Driving test changes in 2017: impact summary
Updated 19 July 2019
Applies to England, Scotland and Wales

© Crown copyright 2019
This publication is licensed under the terms of the Open Government Licence v3.0 except where otherwise stated. To view this licence, visit nationalarchives.gov.uk/doc/open-government-licence/version/3 or write to the Information Policy Team, The National Archives, Kew, London TW9 4DU, or email: psi@nationalarchives.gov.uk.
Where we have identified any third party copyright information you will need to obtain permission from the copyright holders concerned.
This publication is available at https://www.gov.uk/government/publications/driving-test-changes-in-2017-impact-summary/driving-test-changes-in-2017-impact-summary
1. Introduction
This report summarises research that was done to monitor the impact that changes to the driving test had on learner drivers.
It focuses on learner drivers’ experience of:
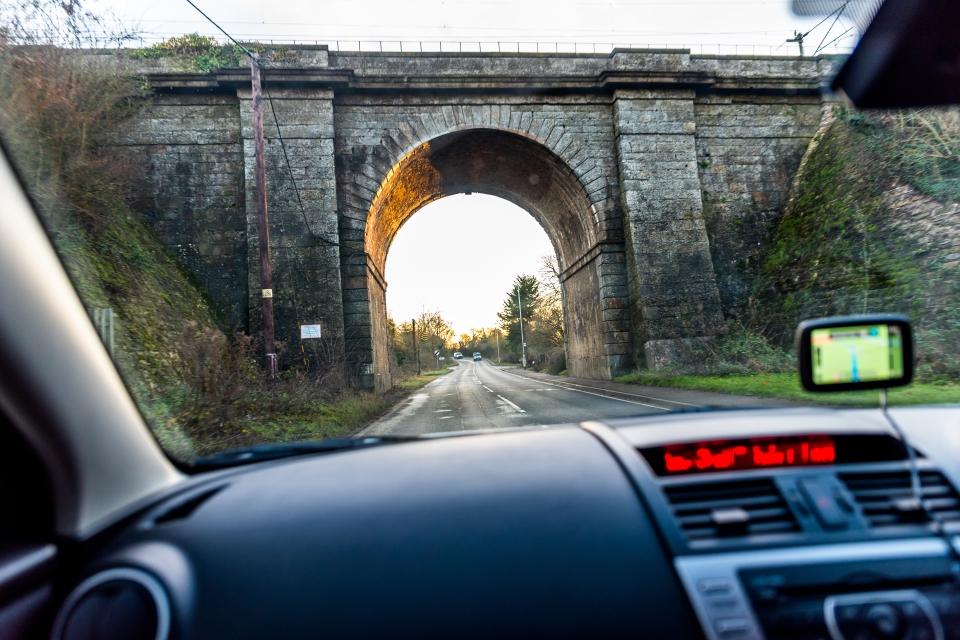
- driving on high-speed roads (except motorways)
- following directions from a sat nav
- driving independently
Background
The Driver and Vehicle Standards Agency (DVSA) changed the way the driving test works on Monday 4 December 2017. The changes applied to England, Scotland and Wales.
The changes were designed to make sure new drivers have the skills they need to help them through a lifetime of safe driving.
The 4 main changes were:
- the independent driving part of the test was increased from 10 to 20 minutes
- candidates in 4 out of 5 driving tests were asked to follow directions from a sat nav during the independent driving part
- the 3 possible reversing manoeuvres were changed
- the driving examiner asking a ‘show me’ question (where you show how you’d carry out a safety task) while the candidate is driving, rather than at the start of the test
Why the changes were made
These changes were made because:
- most fatal collisions happen on high-speed roads (not including motorways) - changing the format of the test allowed more of these types of roads to be included in driving test routes
- more car drivers now have a sat nav - DVSA wants new drivers to be trained to use them safely
- research has shown that new drivers find independent driving training valuable - they can relate it to driving once they’ve passed their test
Find out more about the changes
2. Summary of findings
Six months after passing the new-style driving test, 81.2% of new drivers felt the test had prepared them for driving on Great Britain’s roads.
81.2% felt the test prepared them for driving on Great Britain’s roads
Drivers who took the new-style test had spent more time practising on country roads (44.2% did at least 4 hours) compared to people who took the old-style test (37.1% did at least 4 hours).
44.2% practised for 4 hours or more on country roads
Drivers who took the new-style test had spent more time practising on high-speed dual carriageways (50.1% did at least 4 hours) compared to people who took the old-style test (46.6% did at least 4 hours).
50.1% practised for 4 hours or more on high-speed dual carriageways
After passing their driving test, most drivers have used sat nav while driving to some extent.
86.3% use a sat nav at least some of the time
3. How the research was done
We sent online surveys to people who had taken the new-style driving test from 11 December 2017 to 17 February 2018.
The first survey was sent to them 2 weeks after their test, regardless of whether they passed or failed.
The second survey was sent to the same people 6 months later, but only if they’d passed their test and said that wanted to take part in further research.
| Survey | Number of surveys sent | Number of surveys filled in | Response rate |
|---|---|---|---|
| First survey (2 weeks after the test) | 227,511 | 17,016 | 7.5% |
| Second survey (6 months after the test) | 6,800 | 2,289 | 33.7% |
We used a unique identifier (a 6-digit number) to track responses and changes through the 2 surveys while keeping the respondents anonymous.
Where possible, we’ve compared responses in this research with the data collected in the original trial of the changes held in 2015 and 2016. We’ve compared the answers with those who took the old-style driving test in the trial.
4. Driving on high-speed roads
We looked at learner drivers’ experience of driving on:
- country roads
- high-speed dual carriageways
4.1 Country roads

Drivers who took the new-style test were asked how much time they’d spent practising driving on country roads.
44.2% spent 4 hours or more practising on country roads
| Study | Never | Less than 2 hours | 2 to 4 hours | 4 to 8 hours | More than 8 hours | Total |
|---|---|---|---|---|---|---|
| Before the changes | 15.1% | 25.6% | 22.0% | 16.4% | 20.7% | 100% |
| After the changes | 14.1% | 20.7% | 21.1% | 21.1% | 23.1% | 100% |
| Study | Never | Less than 2 hours | 2 to 4 hours | 4 to 8 hours | More than 8 hours | Total |
|---|---|---|---|---|---|---|
| Before the changes | 96 | 162 | 140 | 104 | 131 | 633 |
| After the changes | 1,238 | 1,813 | 1,850 | 1,851 | 2,018 | 8,770 |
Compared to people who took the old-style test, the data shows a slight increase in the percentage of learner drivers spending 4 hours or more practising on country roads with an approved driving instructor (ADI).
44.2% (3,869) of those who took the new-style test said they spent 4 hours or more practising on country roads, compared to 37.1% (234) who took the old-style test.
34.8% (3,057) of those who took the new-style test said they spent less than 2 hours practising on country roads, compared to 40.7% (258) who took the old-style test.
Access to country roads varies around Great Britain, so the answers to this question could have been affected by the area the driver learned in.
Perceived level of improvement needed
| Study | A lot of improvement | Some improvement | No improvement | Total |
|---|---|---|---|---|
| Before the changes | 4.2% | 31.8% | 64.0% | 100% |
| After the changes | 3.6% | 31.9% | 64.5% | 100% |
| Study | A lot of improvement | Some improvement | No improvement | Total |
|---|---|---|---|---|
| Before the changes | 88 | 673 | 1,353 | 2,114 |
| After the changes | 76 | 679 | 1,372 | 2,127 |
The level of perceived improvement needed for driving on country roads has stayed roughly the same between the 2 studies.
4.2 High-speed dual carriageways

Drivers who took the new-style test were asked how much time they’d spent practising driving on high-speed dual carriageways.
50.1% spent 4 hours or more practising on high-speed dual carriageways
| Study | Never | Less than 2 hours | 2 to 4 hours | 4 to 8 hours | More than 8 hours | Total |
|---|---|---|---|---|---|---|
| Before the changes | 3.0% | 25.0% | 25.6% | 25.8% | 20.8% | 100% |
| After the changes | 3.6% | 20.0% | 26.2% | 24.9% | 25.2% | 100% |
| Study | Never | Less than 2 hours | 2 to 4 hours | 4 to 8 hours | More than 8 hours | Total |
|---|---|---|---|---|---|---|
| Before the changes | 19 | 158 | 162 | 163 | 131 | 633 |
| After the changes | 317 | 1,759 | 2,306 | 2,196 | 2,217 | 8,795 |
Compared to people who took the old-style test, the data shows an increase in the percentage of learner drivers spending 4 hours or more practising on high-speed dual carriageways with an ADI.
50.1% (3,869) of those who took the new-style test said they spent 4 hours or more practising on high-speed dual carriageways, compared to 46.6% (294) who took the old-style test.
23.6% (2,076) of those who took the new-style test said they spent less than 2 hours practising on high-speed dual carriageways, compared to 28% (177) who took the old-style test.
However, the data shows that learner drivers who took the new-style test were also slightly more likely to have never practised on a high-speed dual carriageway with an ADI, compared to those who took the old-style test.
Access to high-speed dual carriageways roads varies around Great Britain, so the answers to this question could have been affected by the area the driver learned in.
Perceived level of improvement needed
| Study | A lot of improvement | Some improvement | No improvement | Total |
|---|---|---|---|---|
| Before the changes | 5.7% | 30.9% | 63.4% | 100% |
| After the changes | 0.5% | 29.9% | 69.6% | 100% |
| Study | A lot of improvement | Some improvement | No improvement | Total |
|---|---|---|---|---|
| Before the changes | 122 | 654 | 1,338 | 2,114 |
| After the changes | 11 | 635 | 1,481 | 2,127 |
The level of perceived improvement needed for driving on high-speed dual carriageways has changed between the 2 studies.
5.7% (122) of those who took the old-style test felt they needed a lot of improvement, compared to 0.5% (11) of those who took the new-style test.
5. Following directions from a sat nav
Drivers who took the new-style test were asked how much time they’d spent practising driving while following directions from a sat nav.
23.1% spent 4 hours or more following directions from a sat nav
| Hours of practice | Percentage |
|---|---|
| Never | 10.4% |
| Less than 2 hours | 43.0% |
| 2 to 4 hours | 23.5% |
| 4 to 8 hours | 13.0% |
| More than 8 hours | 10.1% |
| Hours of practice | Number |
|---|---|
| Never | 1,763 |
| Less than 2 hours | 7,287 |
| 2 to 4 hours | 3,983 |
| 4 to 8 hours | 2,209 |
| More than 8 hours | 1,701 |
These figures include all practice that drivers had with both an ADI and friends and family.
5.1 Practice with ADI
We want to directly compare results with the original trial (where learners only practised with an ADI).
So, the data for the new-style test in this chart and table is for those who only practised with an ADI. It does not include people who also practised with friends and family.
| Study | Never | Less than 2 hours | 2 to 4 hours | 4 to 8 hours | More than 8 hours | Total |
|---|---|---|---|---|---|---|
| Before the changes | 94.6% | 3.0% | 0.8% | 0.3% | 1.3% | 100% |
| After the changes | 9.3% | 42.3% | 24.6% | 14.2% | 9.6% | 100% |
| Study | Never | Less than 2 hours | 2 to 4 hours | 4 to 8 hours | More than 8 hours | Total |
|---|---|---|---|---|---|---|
| Before the changes | 599 | 19 | 5 | 2 | 8 | 633 |
| After the changes | 819 | 3,716 | 2,163 | 1,247 | 846 | 8,791 |
There has been a large increase in the time drivers spend following directions from a sat nav during their learning.
Before the changes to the test, only 1.6% (10) spent 4 hours or more doing this, compared to 23.8% (2,093) of those who took the new-style test.
5.2 How often you use a sat nav
We asked the new drivers how often they use a sat nav (including a navigation app on their mobile phone) while driving.
86.3% use a sat nav at least some of the time
| How often you use sat nav | Percentage |
|---|---|
| Never | 13.7% |
| Sometimes | 54.5% |
| About half of the time | 15.3% |
| Most of the time | 12.8% |
| Every time I drive | 3.6% |
| How often you use sat nav | Number |
|---|---|
| Never | 303 |
| Sometimes | 1,203 |
| About half of the time | 337 |
| Most of the time | 283 |
| Every time I drive | 80 |
5.3 Confidence using a sat nav
We asked drivers in the second survey how confident they were in driving safely while following instructions from a sat nav.
86.2% were confident that they could drive safely while following directions from a sat nav
| Confidence | Percentage |
|---|---|
| Very confident | 48.3% |
| Confident | 37.9% |
| Neutral | 11.1% |
| Not confident | 2.1% |
| Not at all confident | 0.6% |
| Confidence | Number |
|---|---|
| Very confident | 1,067 |
| Confident | 836 |
| Neutral | 244 |
| Not confident | 47 |
| Not at all confident | 13 |
| Total | 2,207 |
86.2% (1903) said they were either confident or very confident that they could drive safely while following directions from a sat nav. Only 0.6% (13) said they were not at all confident.
6. Independent driving
We asked drivers in the second survey if they felt that the test prepared them well for driving on Great Britain’s roads. At this point, they had at least 6 months experience of driving independently.
81.2% felt the test prepared them for driving on Great Britain’s roads
| Response | Percentage |
|---|---|
| Yes | 81.2% |
| No | 18.8% |
| Response | Number |
|---|---|
| Yes | 1,852 |
| No | 428 |
6.1 Why drivers felt the test had or had not prepared them
We asked drivers to tell us more about why they had answered the way they did.
People who felt it had prepared them
Those who answered ‘yes’ said:
- the test and their learning for the test were reflective of real-life driving
- there was a good range of road types included in the test and their learning
- they feel comfortable and confident driving on their own
- they would have liked training and or lessons on motorways
People who felt it had not prepared them
Those who answered ‘no’ said:
- motorway driving lessons would have helped them to feel much more prepared for driving on their own - but they praise the change in the law that has allowed motorway driving lessons since they passed their test
- that while the test prepared them well, they struggle with the different way that experienced drivers treat them now they do not have L plates and an accompanying ADI
- they felt that they were mainly taught to pass the test - they feel the bulk of their learning to drive was done after the test, and that the learning process and test cannot entirely prepare them for driving on their own
6.2 Confidence that you’re a safe driver
In the second survey, we asked drivers how confident they were that they’re a safe driver.
90% were confident that they are a safe driver
| Confidence | Percentage |
|---|---|
| Very confident | 42.4% |
| Confident | 47.6% |
| Neutral | 8.9% |
| Not confident | 1.0% |
| Not at all confident | 0.1% |
| Confidence | Number |
|---|---|
| Very confident | 936 |
| Confident | 1,050 |
| Neutral | 197 |
| Not confident | 22 |
| Not at all confident | 2 |
| Total | 2,207 |
90% (1,986) answered that they are either confident or very confident that they are a safe driver. This was the highest scoring statement for confidence levels.
This indicates that, after driving independently for 6 months, most drivers are confident that they are a safe driver.
6.3 Confidence that you’re a good driver
In the second survey, we asked drivers how confident they were that they’re a good driver.
79.1% were confident that they are a good driver
| Confidence | Percentage |
|---|---|
| Very confident | 27.7% |
| Confident | 51.4% |
| Neutral | 17.7% |
| Not confident | 2.7% |
| Not at all confident | 0.5% |
| Confidence | Number |
|---|---|
| Very confident | 611 |
| Confident | 1,136 |
| Neutral | 390 |
| Not confident | 60 |
| Not at all confident | 12 |
| Total | 2,209 |
79.1% (1,747) answered that they are either confident or very confident that they are a good driver.
This means that the drivers are less confident that they are a good driver than a safe driver.
6.4 Confidence that you’re a skilful driver
In the second survey, we asked drivers how confident they were that they’re a skilful driver.
60.9% were confident that they are a skilful driver
| Confidence | Percentage |
|---|---|
| Very confident | 17.8% |
| Confident | 43.1% |
| Neutral | 32.4% |
| Not confident | 5.7% |
| Not at all confident | 1.0% |
| Confidence | Number |
|---|---|
| Very confident | 394 |
| Confident | 953 |
| Neutral | 716 |
| Not confident | 127 |
| Not at all confident | 19 |
| Total | 2,209 |
60.9% (1,347) answered that they are either confident or very confident that they are a skilful driver.
They’re more likely to answer select the middle option for this than any of the other questions regarding their confidence.
Only 1% (19) answered that they are not at all confident that they are a skilful driver.
The word ‘skilful’ can mean different things to different people. It’s not always interpreted as a good thing when it comes to driving.
6.5 Confidence in your ability
In the second survey, we asked drivers how confident they were in their ability.
81.6% were confident in their ability
| Confidence | Percentage |
|---|---|
| Very confident | 29.9% |
| Confident | 51.7% |
| Neutral | 15.6% |
| Not confident | 2.3% |
| Not at all confident | 0.5% |
| Confidence | Number |
|---|---|
| Very confident | 658 |
| Confident | 1,136 |
| Neutral | 344 |
| Not confident | 51 |
| Not at all confident | 10 |
| Total | 2,199 |
81.6% (1,794) answered that they were very confident or confident in their ability. Only 0.5% (10) answered that they are not at all confident in their ability.
6.6 Confidence you will not be involved in an accident
In the second survey, we asked drivers how confident they were that they will not be involved in an accident in the next 12 months.
75.1% were confident they will not be involved in an accident in the next 12 months
| Confidence | Percentage |
|---|---|
| Very confident | 31.6% |
| Confident | 43.5% |
| Neutral | 19.9% |
| Not confident | 3.5% |
| Not at all confident | 1.5% |
| Confidence | Number |
|---|---|
| Very confident | 695 |
| Confident | 957 |
| Neutral | 438 |
| Not confident | 78 |
| Not at all confident | 78 |
| Total | 2,202 |
75.1% (1,652) answered that they are either confident or very confident that they will not be involved in an accident in the next 12 months. 1.5% (78) answered that they were not at all confident in this.
This could be due to them being aware that other drivers’ skills can be a factor in accidents. It was the only confidence question that was not solely reliant on the skills of the people taking the survey.
6.7 Summary of confidence levels
This chart and table summarise the responses to all of the confidence questions.
Drivers were most confident that they are a safe driver and show the least confidence that they will not be involved in an accident in the next 12 months.
They seem to be the most unsure about being a skilful driver. This could be due to the idea or feelings the word ‘skilful’ invokes.
| Confidence | Very confident | Confident | Neutral | Not confident | Not at all confident | Total |
|---|---|---|---|---|---|---|
| Good driver | 27.7% | 51.4% | 17.7% | 2.7% | 0.5% | 100% |
| Safe driver | 42.4% | 47.6% | 8.9% | 1.0% | 0.1% | 100% |
| Skilful driver | 17.8% | 43.1% | 32.9% | 5.7% | 0.5% | 100% |
| Ability | 29.9% | 51.7% | 15.6% | 2.3% | 0.5% | 100% |
| You will not be involved in an accident in the next 12 months | 31.6% | 43.5% | 19.9% | 3.5% | 1.5% | 100% |
| Topic | Very confident | Confident | Neutral | Not confident | Not at all confident |
|---|---|---|---|---|---|
| Good driver | 611 | 1,136 | 390 | 60 | 12 |
| Safe driver | 936 | 1,050 | 197 | 22 | 2 |
| Skilful driver | 394 | 953 | 716 | 127 | 19 |
| Ability | 658 | 1,136 | 344 | 51 | 10 |
| Will not be involved in an accident in the next 12 months | 695 | 957 | 438 | 78 | 34 |
7. What we’ll do next
We’ll continue analysing the data from this piece of research. We aim to publish a more detailed report by the end of March 2019.
We’ll also analyse data from driving test results when we have a full year’s worth of data available. At the time of publishing this summary, the official statistics only report up to 30 June 2018.
We’ll analyse the different types of faults (dangerous, serious or driving fault) being made during the different parts of the test. This will include the 3 reversing manoeuvres, and the ‘show me, tell me’ questions.
We’ll also identify any trends that ADIs might find useful to know.