COVID-19 confirmed deaths in England (to 30 April 2021): report
Updated 28 April 2023

© Crown copyright 2023
This publication is licensed under the terms of the Open Government Licence v3.0 except where otherwise stated. To view this licence, visit nationalarchives.gov.uk/doc/open-government-licence/version/3 or write to the Information Policy Team, The National Archives, Kew, London TW9 4DU, or email: psi@nationalarchives.gov.uk.
Where we have identified any third party copyright information you will need to obtain permission from the copyright holders concerned.
This publication is available at https://www.gov.uk/government/publications/covid-19-reported-sars-cov-2-deaths-in-england/covid-19-confirmed-deaths-in-england-to-31-april-2021-report
COVID-19 deaths
Public Health England (PHE) has published statistics on deaths in people with laboratory-confirmed COVID-19 since 29 April 2020. In this report we present the latest data on COVID-19 mortality. Further information on the data series can be found here.
Data sources
Cases of laboratory diagnosed COVID-19 resident in England were identified from the Second Generation Surveillance System (SGSS).
Fact and date of death were derived from combined sources: NHS England hospital deaths, Office for National Statistics (ONS) death registrations, PHE Health Protection Team direct reporting and Demographic Batch Service tracing of laboratory-confirmed cases.
Definitions
In this report deaths are defined as a death in a person with a laboratory-confirmed positive COVID-19 test and either:
- died within 60 days of the first specimen date
or
- died more than 60 days after the first specimen date with COVID-19 mentioned on the death certificate
This data does not include deaths in people where COVID-19 is suspected but not confirmed by testing (SARS-CoV-2 PCR either negative or not tested).
This data does not report cause of death, and as such represents all deaths in people with laboratory-confirmed COVID-19, not just those caused by COVID-19.
In this report, data is reported from 29 June 2020 to 30 April 2021.
Mortality rates are calculated using 2019 ONS population estimates data.
Age-standardised rates adjust for differences in the age structure of populations. The standard used throughout this report is the European Standard Population 2013.
Methods
Mortality rates presented for different time periods have been annualised in order to enable comparisons. This method involves adjusting the population data used to calculate rates for the time period covered, these are expressed as mortality rates per 100,000 population per year. These rates cannot be compared with rates that do not have this adjustment.
Mortality rates by region, local authority, sex, ethnic group and Index of Multiple Deprivation (IMD) have been age-standardised to account for the different age distributions within different populations.
All figures displaying mortality rates have been calculated using a 7-day rolling average, to allow for smoothing of fluctuating data.
COVID-19 mortality rates
Within the period 29 June 2020 to 30 April 2021, 3,624,305 cases of COVID-19 were detected in England.
In the same period, there have been 90,931 deaths in persons with laboratory-confirmed COVID-19. This represents a crude mortality rate of 161.6 per 100,000 population. From 29 June 2020 onwards, the highest recorded number of daily deaths was 1,504 deaths on 19 January 2021.
| Month | Cases | Deaths | Crude mortality rate (95% CI) |
|---|---|---|---|
| July 2020 | 19,344 | 1,199 | 2.5 (2.4-2.7) |
| August 2020 | 29,810 | 517 | 1.1 (1.0-1.2) |
| September 2020 | 127,681 | 825 | 1.8 (1.6-1.9) |
| October 2020 | 482,872 | 4,552 | 9.7 (9.4-10.0) |
| November 2020 | 526,605 | 11,645 | 24.8 (24.3-25.2) |
| December 2020 | 862,089 | 15,863 | 33.7 (33.2-34.3) |
| January 2021 | 1,079,239 | 33,308 | 70.8 (70.1-71.6) |
| February 2021 | 292,388 | 16,460 | 35.0 (34.5-35.5) |
| March 2021 | 135,801 | 5,179 | 11.0 (10.7-11.3) |
| April 2021 | 62,156 | 1,242 | 2.6 (2.5-2.8) |
Table 1. Number of laboratory-confirmed cases, deaths and crude mortality rate (per 100,000 population) in laboratory-confirmed cases of COVID-19, by month*†
*Data is presented from 1 July 2020 to 30 April 2021. Due to continuous data quality improvements, reported number of cases and deaths may be subject to fluctuations. These numbers represent a snapshot of the number of cases and deaths at the time of report production.
†Deaths within 60 days of a positive COVID-19 test or where COVID-19 is mentioned on the death certificate.
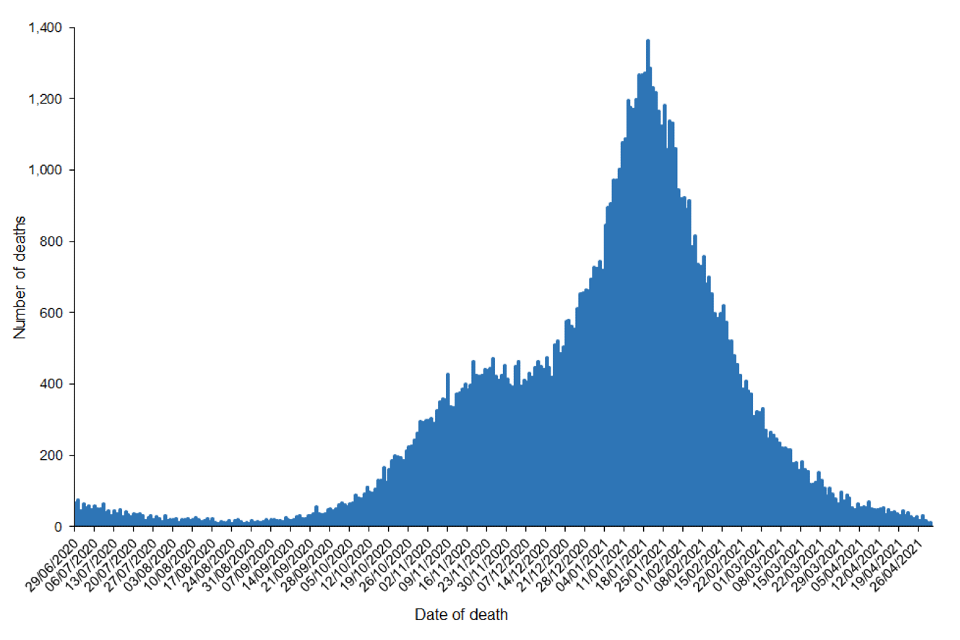
Figure 1. Number of deaths in laboratory-confirmed cases of COVID-19 by date of death, from week 27 onwards*†
*Data is presented from 29 June 2020 to 30 April 2021. †Deaths within 60 days of a positive COVID-19 test or where COVID-19 is mentioned on the death certificate.
Age and sex distribution
Since 29 June 2020, the mortality rate was highest among those aged over 80 (annualised rate of 2,257.7 per 100,000 population per year).
| Age group | Deaths (week 27 onwards*) | Mortality rate** (95% CI) (week 27 onwards*) | Deaths (April 2021) | Mortality rate ** (95% CI) (April 2021) |
|---|---|---|---|---|
| <5 | <10 | 0.2 (0.1-0.5) | <10 | 0.0 (0.0-0.0) |
| 5-9 | <10 | 0.1 (0.0-0.3) | <10 | 0.0 (0.0-0.0) |
| 10-19 | 30 | 0.6 (0.4-0.8) | <10 | 0.0 (0.0-0.0) |
| 20 -29 | 139 | 2.3 (1.9-2.7) | <10 | 0.7 (0.2-1.7) |
| 30-39 | 506 | 8.0 (7.3-8.8) | 13 | 2.1 (1.1-3.6) |
| 40-49 | 1,465 | 24.6 (23.3-25.9) | 24 | 4.1 (2.6-6.1) |
| 50-59 | 4,530 | 71.5 (69.5-73.7) | 85 | 13.6 (10.9-16.9) |
| 60-69 | 9,870 | 199.9 (196.0-203.9) | 170 | 35.0 (29.9-40.7) |
| 70-79 | 20,859 | 528.9 (521.7-536.1) | 252 | 65.0 (57.2-73.5) |
| 80+ | 53,522 | 2257.7 (2238.6-2276.9) | 694 | 297.6 (275.9-320.6) |
Table 2. Number of deaths and annualised mortality rate** (per 100,000 population per year) in laboratory-confirmed cases of COVID-19, by age group†
Note: Numbers of deaths fewer than 10 have been excluded to minimise the risk of deductive disclosure.
*Data is presented from 29 June 2020 to 30 April 2021.
**Rates are annualised and expressed as the number of deaths per 100,000 population per year.
†Deaths within 60 days of a positive COVID-19 test or where COVID-19 is mentioned on the death certificate.
From week 27 onwards, 58,575 (annualised rate of 265.7 per 100,000 population per year) deaths have occurred in males and 54,288 (189.3 per 100,000 per year) in females. The mortality rate in both sexes in April was lower than the average for the total period 29 June 2020 to 30 April 2021.
| Sex | Deaths (week 27 onwards*) | Age-adjusted mortality rate** (95% CI) (week 27 onwards*) | Deaths (April 2021) | Age-adjusted mortality rate** (95% CI) (April 2021) |
|---|---|---|---|---|
| Female | 42,404 | 189.3 (187.5-191.2) | 591 | 2.6 (2.4-2.9) |
| Male | 48,527 | 265.7 (263.3-268.1) | 651 | 3.5 (3.3-3.8) |
Table 3. Number of deaths and age-adjusted annualised mortality rate ** (per 100,000 population) in laboratory-confirmed cases of COVID-19, by sex*†
*Data is presented from 29 June 2020 to 30 April 2021.
**Rates are annualised and expressed as the number of deaths per 100,000 population per year.
†Deaths within 60 days of a positive COVID-19 test or where COVID-19 is mentioned on the death certificate.
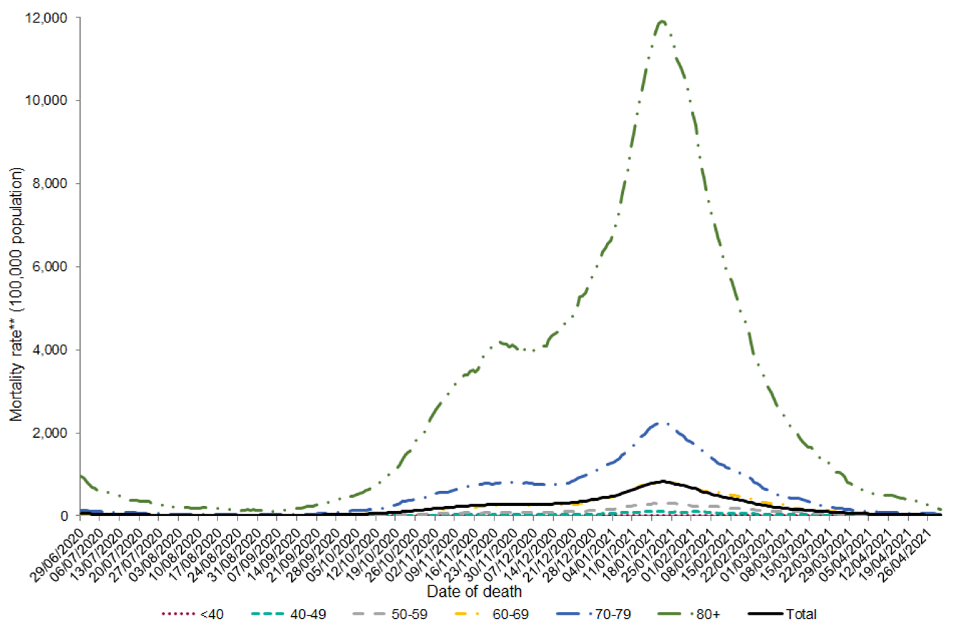
Figure 2.a. Seven-day rolling average annualised mortality rates** (per 100,000 population per year) in laboratory-confirmed cases of COVID-19 by age group, from week 27 onwards*†
*Data is presented from 29 June 2020 to 30 April 2021.
**Rates are annualised and expressed as the number of deaths per 100,000 population per year.
†Deaths within 60 days of a positive COVID-19 test or where COVID-19 is mentioned on the death certificate.
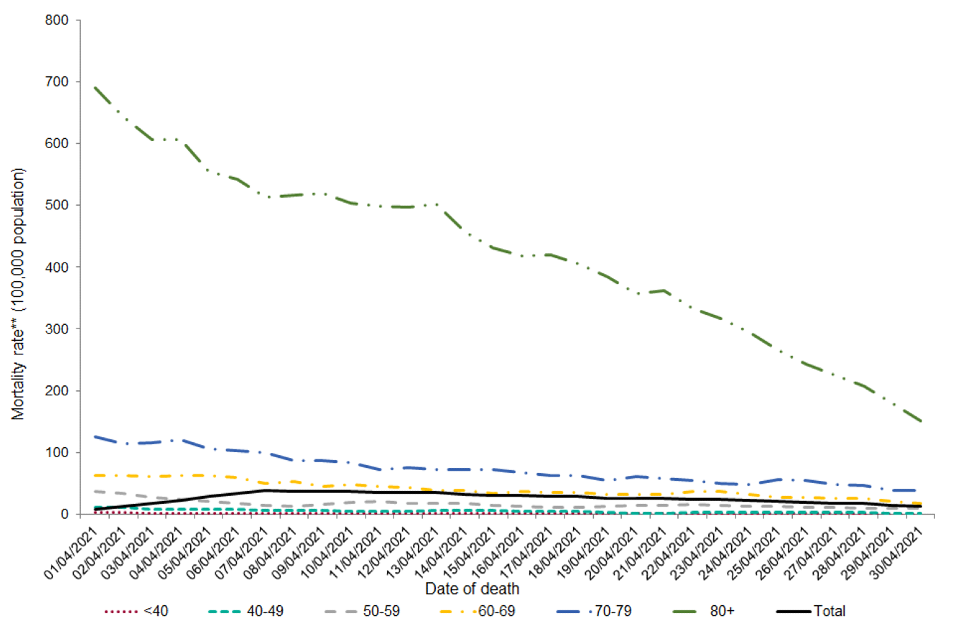
Figure 2.b. Seven-day rolling average annualised mortality rates** (per 100,000 population) in laboratory-confirmed cases of COVID-19 by age group, April 2021*†
*Data is presented from 1 February to 30 April 2021.
**Rates are annualised and expressed as the number of deaths per 100,000 population per year.
†Deaths within 60 days of a positive COVID-19 test or where COVID-19 is mentioned on the death certificate.
Ethnicity
Overall, the age-adjusted annualised mortality rate from 29 June 2020 onwards was highest among those of Other ethnic groups (annualised rate of 875.3 per 100,000 population per year) followed by those of Asian or Asian British ethnic groups (annualised rate of 391.9 per 100,000 population per year). Although 87.2% deaths have been reported among those of White or White British ethnic groups, the age-adjusted mortality rate is lowest among this ethnic group (annualised rate of 188.0 per 100,000 population per year).
| Ethnic category *** | Deaths (week 27 onwards* ) | Age-adjusted mortality rate** (95% CI) (week 27 onwards*) | Deaths (April 2021) | Age-adjusted mortality rate** (95% CI) (April 2021) |
|---|---|---|---|---|
| White/White British | 79,256 | 188.0 (186.7-189.3) | 1,055 | 2.5 (2.4-2.7) |
| Black/Black British | 2,227 | 307.0 (293.6-320.8) | 23 | 2.9 (1.8-4.4) |
| Asian/Asian British | 6,074 | 391.9 (381.6-402.4) | 109 | 6.1 (4.9-7.4) |
| Mixed | 455 | 209.8 (189.7-231.1) | 6 | 2.5 (0.8-5.4) |
| Other± | 1,426 | 875.3 (827.0-925.2) | 23 | 12.3 (7.4-18.7) |
| Unknown | 1,493 | – | 26 | – |
Table 4. Number of deaths and age-adjusted annualised mortality rate** (per 100,000 population) in laboratory-confirmed cases of COVID-19, by ethnicity†
*Data is presented from 29 June 2020 to 30 April 2021.
**Rates are annualised and expressed as the number of deaths per 100,000 population per year.
***Ethnic categories are based on ONS classifications.
±The rates in the Other ethnic group are likely to be an overestimate due to the difference in the method of allocating ethnicity codes to the deaths data and the population data used to calculate the rates.
†Deaths within 60 days of a positive COVID-19 test or where COVID-19 is mentioned on the death certificate.
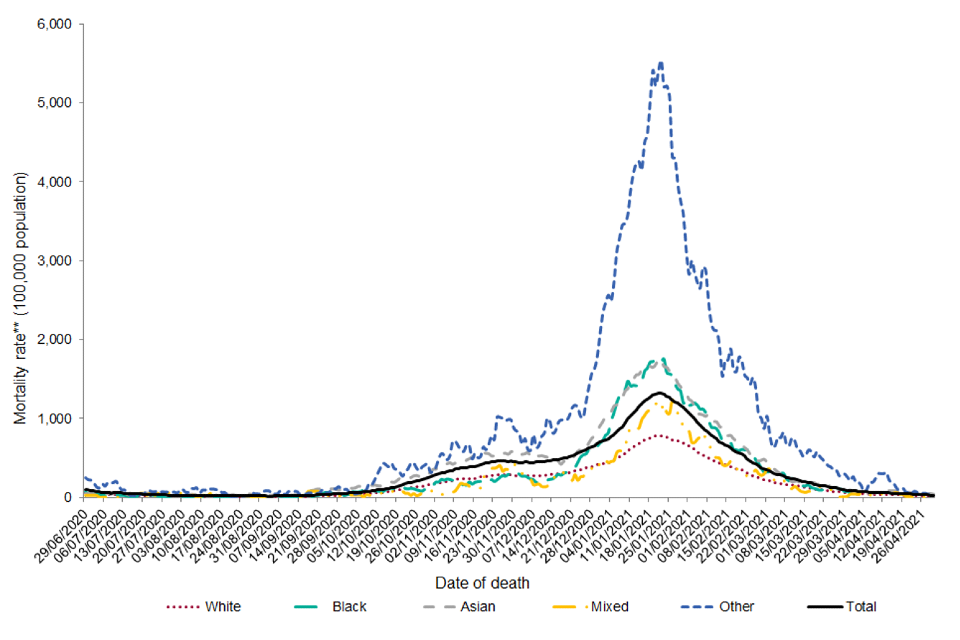
Figure 3.a. Seven-day rolling average age-adjusted annualised mortality rates** (per 100,000 population) in laboratory-confirmed cases of COVID-19 by ethnicity, from week 27 onwards*†
*Data is presented from 29 June 2020 to 30 April 2021.
**Rates are annualised and expressed as the number of deaths per 100,000 population per year.
***Ethnic categories are based on ONS classifications.
±The rates in the Other ethnic group are likely to be an overestimate due to the difference in the method of allocating ethnicity codes to the cases data and the population data used to calculate the rates.
†Deaths within 60 days of a positive COVID-19 test or where COVID-19 is mentioned on the death certificate.
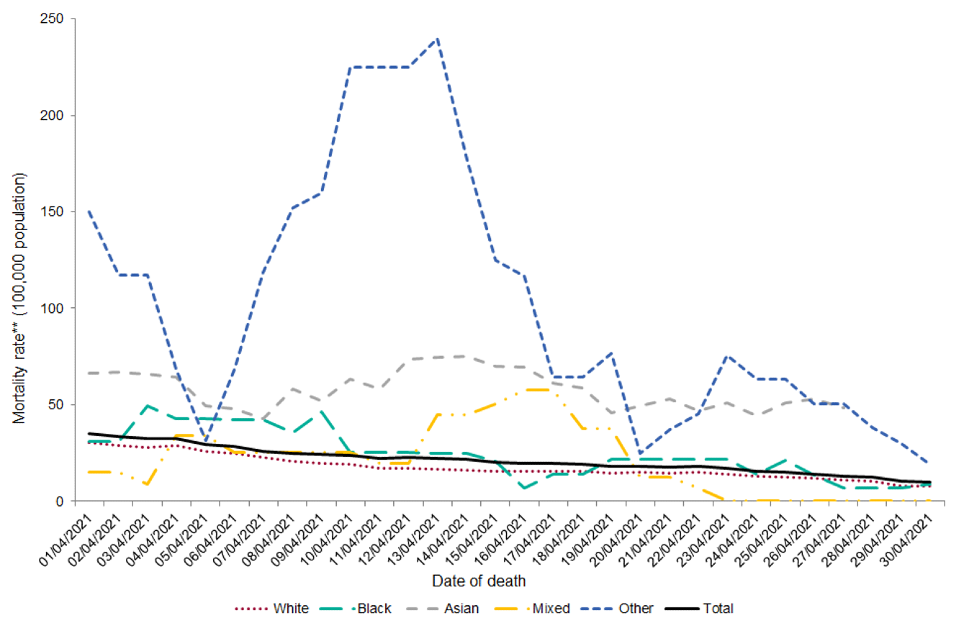
Figure 3.b. Seven-day rolling average age-adjusted mortality rates** (per 100,000 population) in laboratory-confirmed cases of COVID-19 by ethnicity, April 2021*†
*Data is presented from 1 April to 30 April 2021.
**Rates are annualised and expressed as the number of deaths per 100,000 population per year.
±The rates in the Other ethnic group are likely to be an overestimate due to the difference in the method of allocating ethnicity codes to the cases data and the population data used to calculate the rates.
†Deaths within 60 days of a positive COVID-19 test or where COVID-19 is mentioned on the death certificate.
Deprivation
Relative deprivation was assessed using quintiles of the IMD linked to residential lower super output area, with IMD 1 representing the most deprived. Overall, the age-adjusted annualised mortality rate is highest among those living in the most deprived areas, with a gradual decrease in mortality rate seen with decreasing deprivation.
| IMD Quintile (1 most deprived) | Deaths (week 27 onwards*) | Age-adjusted mortality rate** (95% CI) (week 27 onwards*) | Deaths (April 2021) | Age-adjusted mortality rate** (95% CI) (April 2021) |
|---|---|---|---|---|
| 1 | 21,237 | 315.1 (310.9-319.4) | 315 | 4.6 (4.1-5.1) |
| 2 | 19,484 | 241.1 (237.7-244.5) | 263 | 3.2 (2.9-3.7) |
| 3 | 17,960 | 185.6 (182.9-188.3) | 243 | 2.5 (2.2-2.8) |
| 4 | 16,724 | 159.8 (157.4-162.3) | 228 | 2.2 (1.9-2.5) |
| 5 | 15,060 | 137.7 (135.5-140.0) | 183 | 1.7 (1.4-1.9) |
| Unknown | 466 | – | 10 | – |
Table 5. Number of deaths and age-adjusted annualised mortality rate** (per 100,000 population) in laboratory-confirmed cases of COVID-19, by IMD quintile*†
*Data is presented from 29 June 2020 to 30 April 2021.
**Rates are annualised and expressed as the number of deaths per 100,000 population per year.
†Deaths within 60 days of a positive COVID-19 test or where COVID-19 is mentioned on the death certificate.
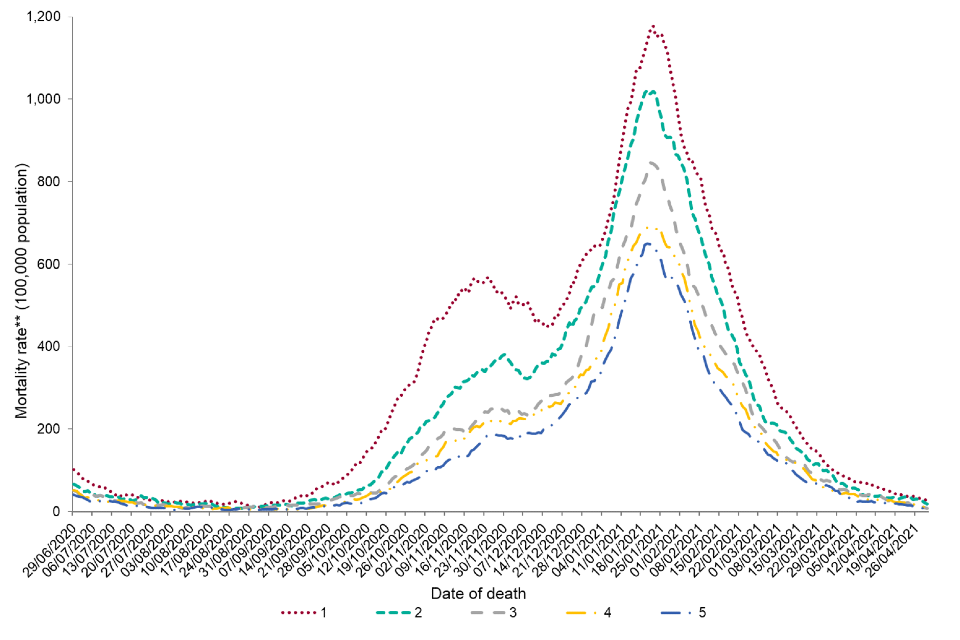
Figure 4.a. Seven-day rolling average age-adjusted annualised mortality rate** (per 100,000 population) in laboratory-confirmed cases of COVID-19 by IMD quintile, from week 27 onwards*†
*Data is presented from 29 June 2020 to 30 April 2021.
**Rates are annualised and expressed as the number of deaths per 100,000 population per year.
†Deaths within 60 days of a positive COVID-19 test or where COVID-19 is mentioned on the death certificate.
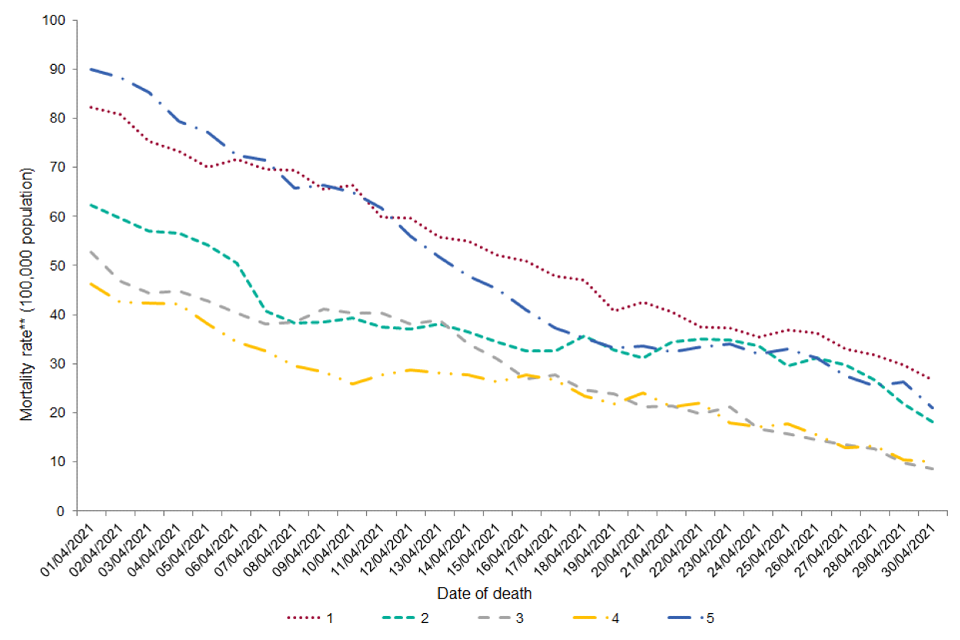
Figure 4.b. Seven-day rolling average age-adjusted annualised mortality rate** (per 100,000) population in laboratory-confirmed cases of COVID-19 by IMD quintile, April 2021*†
*Data is presented from 1 April to 30 April 2021.
**Rates are annualised and expressed as the number of deaths per 100,000 population per year.
†Deaths within 60 days of a positive COVID-19 test or where COVID-19 is mentioned on the death certificate.
Regional breakdown
Since 29 June 2020, the annualised mortality rate was highest in the North West (240.0 per 100,000 population per year), followed by London (226.6 per 100,000 population per year). The lowest mortality rate was seen in the South West (104.4 per 100,000 population per year). In April the highest annualised mortality rate was seen in Yorkshire and Humber (3.9 per 100,000 population per year).
| PHE centre | Deaths (week 27 onwards*) | Age-adjusted mortality rate** (95% CI) (week 27 onwards*) | Deaths (April 2021) | Age-adjusted mortality rate** (95% CI) (April 2021) |
|---|---|---|---|---|
| East Midlands | 8,673 | 214.0 (209.5-218.5) | 134 | 3.3 (2.8-3.9) |
| East of England | 11,581 | 204.3 (200.5-208.0) | 151 | 2.7 (2.3-3.2) |
| London | 11,277 | 226.6 (222.4-230.9) | 126 | 2.5 (2.1-3.0) |
| North East | 4,611 | 200.9 (195.1-206.8) | 45 | 1.9 (1.4-2.6) |
| North West | 14,300 | 240.0 (236.0-243.9) | 196 | 3.3 (2.8-3.8) |
| South East | 14,491 | 183.5 (180.5-186.5) | 158 | 2.0 (1.7-2.3) |
| South West | 5,789 | 104.4 (101.7-107.1) | 82 | 1.5 (1.2-1.9) |
| West Midlands | 10,823 | 222.5 (218.3-226.8) | 166 | 3.4 (2.9-4.0) |
| Yorkshire and Humber | 8,920 | 198.2 (194.1-202.4) | 174 | 3.9 (3.3-4.5) |
| Unknown | 466 | – | 10 | – |
Table 6. Number of deaths and age-adjusted annualised mortality rate** (per 100,000 population) in laboratory-confirmed cases of COVID-19, by PHE centre*†
*Data is presented from 29 June 2020 to 30 April 2021.
**Rates are annualised and expressed as the number of deaths per 100,000 population per year.
†Deaths within 60 days of a positive COVID-19 test or where COVID-19 is mentioned on the death certificate.
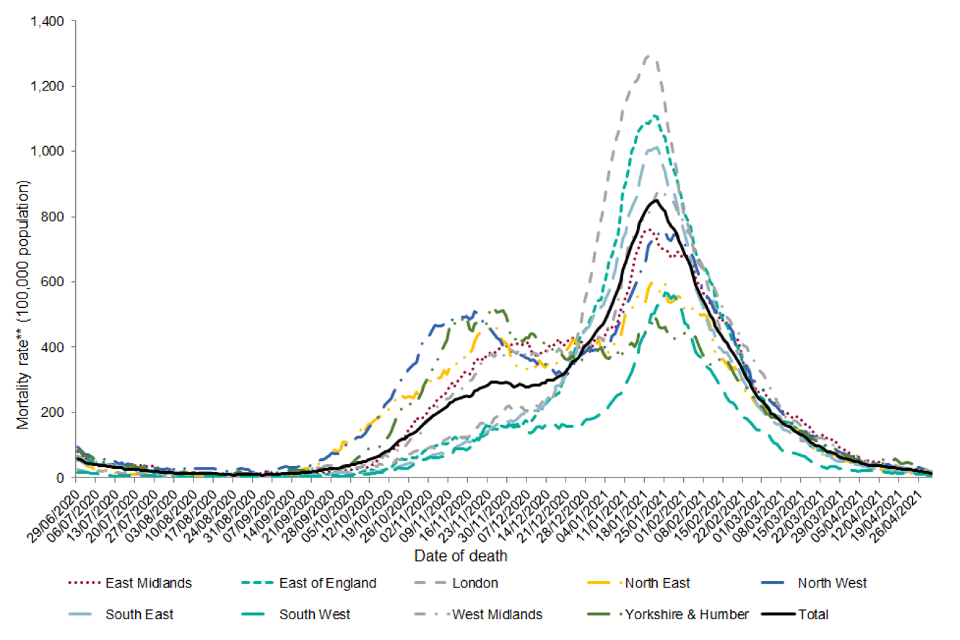
Figure 5.a. Seven-day rolling average age-adjusted annualised mortality rates** (per 100,000 population) in laboratory-confirmed cases of COVID-19 by PHE centre, from week 27 onwards*†
*Data is presented from 29 June 2020 to 30 April 2021.
**Rates are annualised and expressed as the number of deaths per 100,000 population per year.
†Deaths within 60 days of a positive COVID-19 test or where COVID-19 is mentioned on the death certificate.
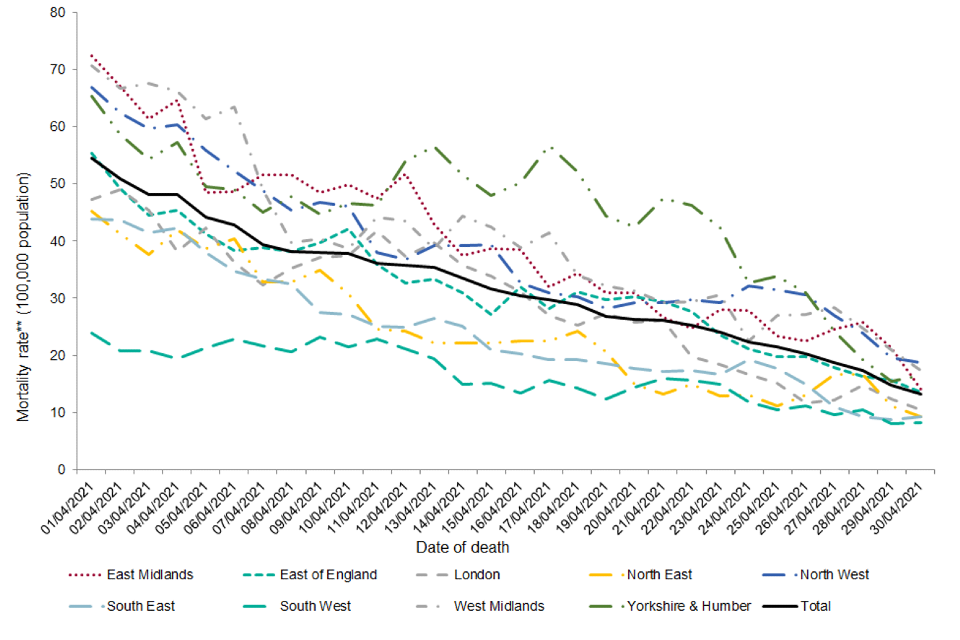
Figure 5.b. Seven-day rolling average age-adjusted annualised mortality rates** (per 100,000 population) in laboratory-confirmed cases of COVID-19 by PHE centre, April 2021*†
*Data is presented from 1 April 2021 to 30 April 2021.
**Rates are annualised and expressed as the number of deaths per 100,000 population per year.
†Deaths within 60 days of a positive COVID-19 test or where COVID-19 is mentioned on the death certificate.
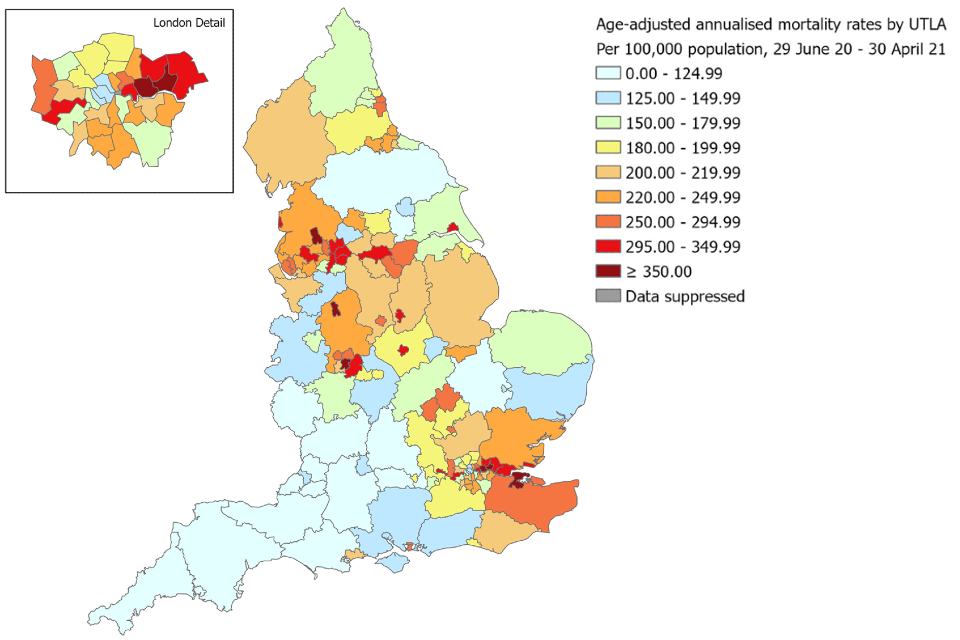
Figure 6.a. Age-adjusted annualised mortality rates** (per 100,000 population) in laboratory-confirmed cases of COVID-19 by upper-tier local authority, week 27 onwards*†
*Data is presented from 29 June 2020 to 30 April 2021.
**Rates are annualised and expressed as the number of deaths per 100,000 population per year.
†Deaths within 60 days of a positive COVID-19 test or where COVID-19 is mentioned on the death certificate.
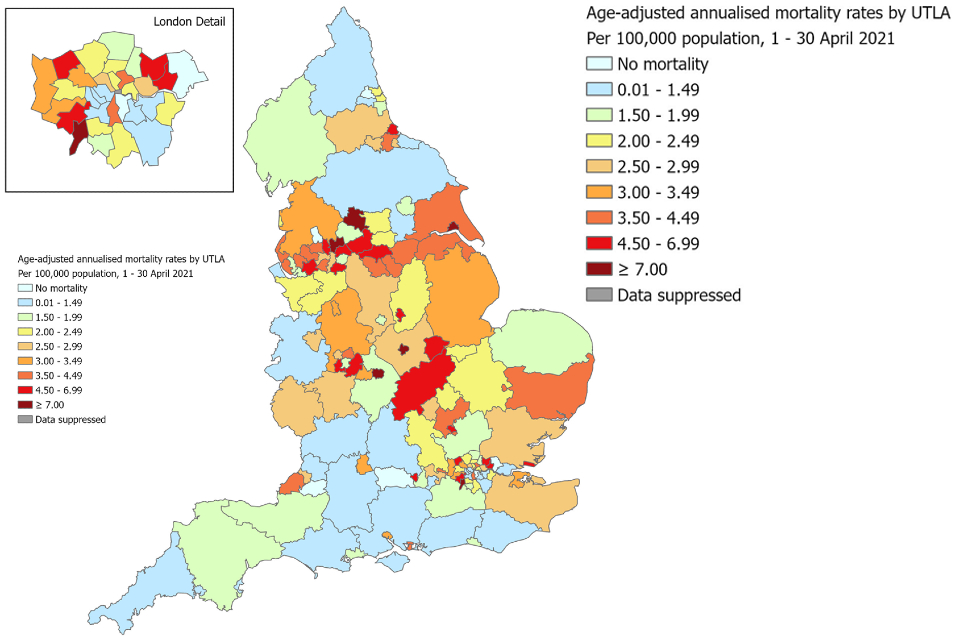
Figure 6.b. Age-adjusted annualised mortality rates** (per 100,000 population) in laboratory-confirmed cases of COVID-19, by upper-tier local authority, April 2021*†
*Data is presented from 1 April to 30 April 2021.
**Rates are annualised and expressed as the number of deaths per 100,000 population per year.
†Deaths within 60 days of a positive COVID-19 test or where COVID-19 is mentioned on the death certificate.
Figures 6a and 6b:
- contain Ordnance Survey data © Crown copyright and database right 2020
- contain National Statistics data © Crown copyright and database right 2020
Case fatality risk
Case fatality risk (CFR) describes the risk of death following a laboratory-confirmed positive COVID-19 test. For this report, CFR has been calculated within 60 days of an individual’s first positive specimen (from PCR, LAMP, and LFD tests) CFR is reported on data from week 27 (29 June 2020) up to and including 6 March 2021.
Cases diagnosed in the last 60 days were excluded from this analysis, due to incomplete follow-up period. Deaths are excluded from the CFR calculation if they cannot be linked to laboratory-confirmed COVID-19 case data.
CFR is sensitive to:
- changes in testing coverage and detection rate of COVID-19 infections (Dudel and others, 2020; Wu and others, 2020; Harman and others, 2021)
- changes in the demographics of the infected population
- changes in the effectiveness of treatment and the health system’s ability to care for severe COVID-19 cases
| Cases | Deaths† | Case fatality risk (%) | |
|---|---|---|---|
| Week 27 onwards* | 3,449,591 | 84,216 | 2.4 |
Table 7. Number of laboratory-confirmed cases, deaths and case fatality risk in laboratory-confirmed cases of COVID-19, from week 27 onwards*†
*Data is presented from 29 June 2020 to 6 March 2020. Figures differ from Table 1 based on CFR calculation inclusion criteria.
†Deaths within 60 days of a positive COVID-19 test and linked to the confirmed COVID-19 case data.
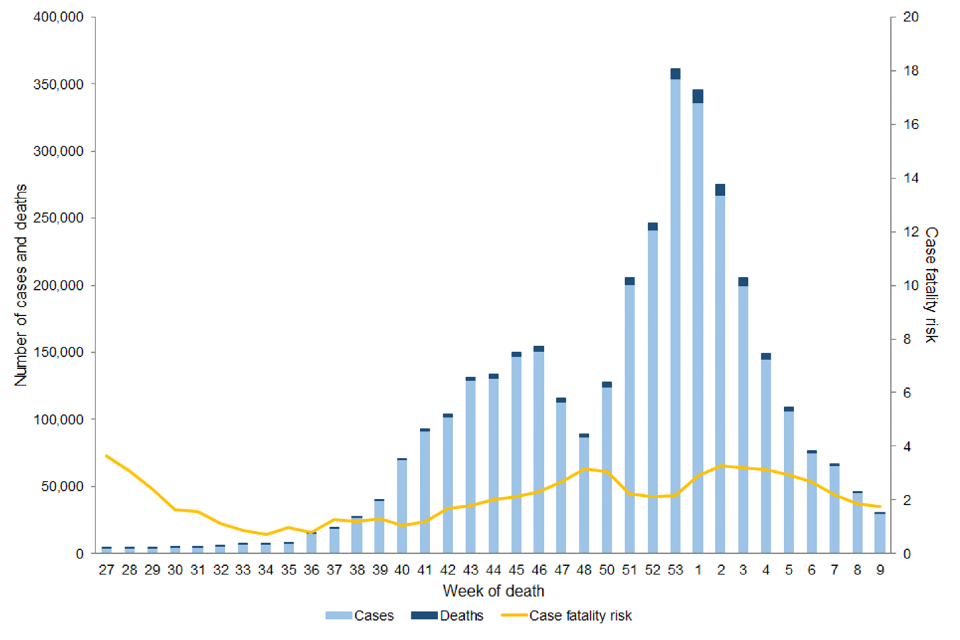
Figure 7. Number of laboratory-confirmed cases, deaths and case fatality risk in laboratory-confirmed cases of COVID-19, from week 27 onwards*†
Note: The time period presented covers a period where testing coverage and testing modes have changed significantly, therefore apparent changes in estimated case fatality should be interpreted with caution. Numbers of cases and deaths are stacked by week. Cases are presented by week of specimen date. Deaths are presented by week of death.
*Data presented from 29 June 2020 to 6March 2021, the last full week of full data available.
†Deaths within 60 days of a positive COVID-19 test and linked to the confirmed COVID-19 case data.
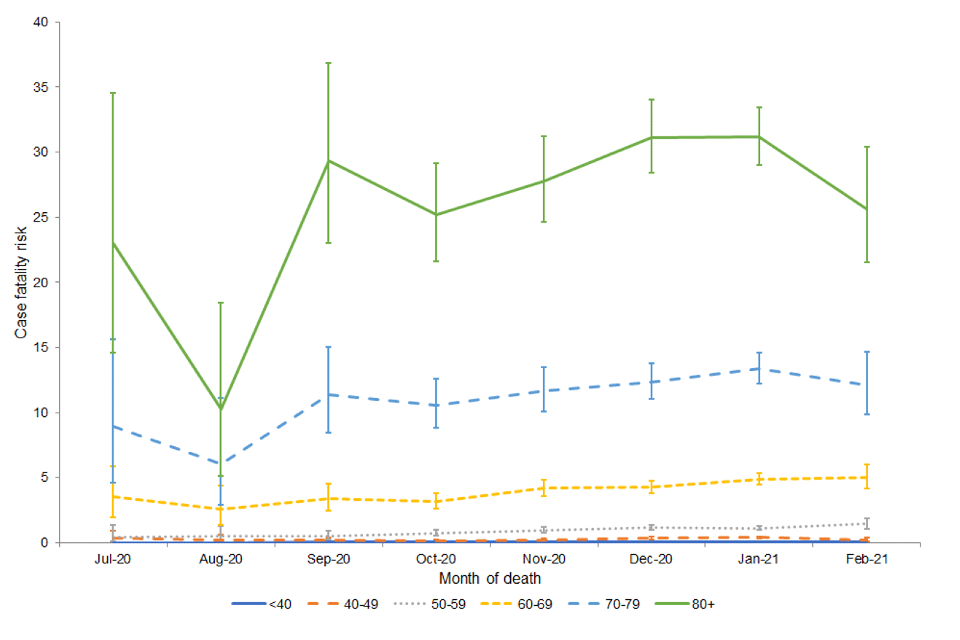
CFR by age and sex
Between 29 June 2020 and 28 February 2021, CFR peaked approximately 2 weeks after the highest case numbers, reflecting the pressures on the healthcare system.
Overall CFR was highest among those aged over 80 (CFR 30.8% (95% CI: 30.5, 31.0)), this trend is seen among both males and females. The CFR in males in the 80+ age group is 39.0% (95% CI: 38.6, 39.5), in comparison, the CFR in females aged 80+ was slightly lower at 26.0% (95% CI: 25.7, 26.3). The CFR for people aged under 40 years old remains very low, at less than 0.3%.
Since December 2020, the CFR has declined in the oldest age group (80+) and a decline has been seen in those aged 70 to 79 since January 2021. This is likely to reflect both the vaccination roll out and national lockdown, resulting in decreased pressure on healthcare services as cases decline.
| Age category | Deaths | Cases | Case fatality risk (%) | Lower 95 CI | Upper 95 CI |
|---|---|---|---|---|---|
| <20 | 44 | 534,036 | 0.0 | 0.0 | 0.0 |
| 20-29 | 130 | 650,429 | 0.0 | 0.0 | 0.0 |
| 30-39 | 457 | 622,995 | 0.1 | 0.1 | 0.1 |
| 40-49 | 1,356 | 539,690 | 0.3 | 0.2 | 0.3 |
| 50-59 | 4,170 | 515,794 | 0.8 | 0.8 | 0.8 |
| 60-69 | 9,176 | 273,553 | 3.4 | 3.3 | 3.4 |
| 70-79 | 19,395 | 144,392 | 13.4 | 13.2 | 13.6 |
| 80+ | 49,482 | 160,810 | 30.8 | 30.5 | 31.0 |
Table 8. Number of laboratory-confirmed cases, deaths and case fatality risk in laboratory-confirmed cases of COVID-19, from week 27 onwards by age group*†
*Data from 29 June 2020 to 6 March 2021.
†Deaths within 60 days of a positive COVID-19 test and linked to the confirmed COVID-19 case data.
| Age category | Deaths | Cases | Case fatality risk (%) | Lower 95 % CI | Upper 95 % CI |
|---|---|---|---|---|---|
| <20 | 25 | 256,928 | 0.0 | 0.0 | 0.0 |
| 20-29 | 75 | 294,116 | 0.0 | 0.0 | 0.0 |
| 30-39 | 264 | 286,881 | 0.1 | 0.1 | 0.1 |
| 40-49 | 812 | 249,534 | 0.3 | 0.3 | 0.3 |
| 50-59 | 2,578 | 240,659 | 1.1 | 1.0 | 1.1 |
| 60-69 | 5,822 | 135,588 | 4.3 | 4.2 | 4.4 |
| 70-79 | 11,699 | 71,236 | 16.4 | 16.1 | 16.7 |
| 80+ | 23,697 | 60,685 | 39.0 | 38.6 | 39.5 |
Table 8a. Number of laboratory-confirmed cases, deaths and case fatality risk in laboratory-confirmed cases of COVID-19, from week 27 onwards by age group, in males*†
*Data from 29 June 2020 to 6 March 2021.
†Deaths within 60 days of a positive COVID-19 test and linked to the confirmed COVID-19 case data.
| Age category | Deaths | Cases | Case fatality risk (%) | Lower 95 % CI | Upper 95 % CI |
|---|---|---|---|---|---|
| <20 | 19 | 273,922 | 0.0 | 0.0 | 0.0 |
| 20-29 | 55 | 352,229 | 0.0 | 0.0 | 0.0 |
| 30-39 | 193 | 332,780 | 0.1 | 0.1 | 0.1 |
| 40-49 | 544 | 287,281 | 0.2 | 0.2 | 0.2 |
| 50-59 | 1,592 | 272,538 | 0.6 | 0.6 | 0.6 |
| 60-69 | 3,354 | 136,287 | 2.5 | 2.4 | 2.5 |
| 70-79 | 7,696 | 72,110 | 10.7 | 10.4 | 10.9 |
| 80+ | 25,785 | 99,090 | 26.0 | 25.7 | 26.3 |
Table 8b. Number of laboratory-confirmed cases, deaths and case fatality risk in laboratory-confirmed cases of COVID-19, from week 27 onwards by age group, in females*†
*Data from 29 June 2020 to 6 March 2021.
†Deaths within 60 days of a positive COVID-19 test and linked to the confirmed COVID-19 case data.
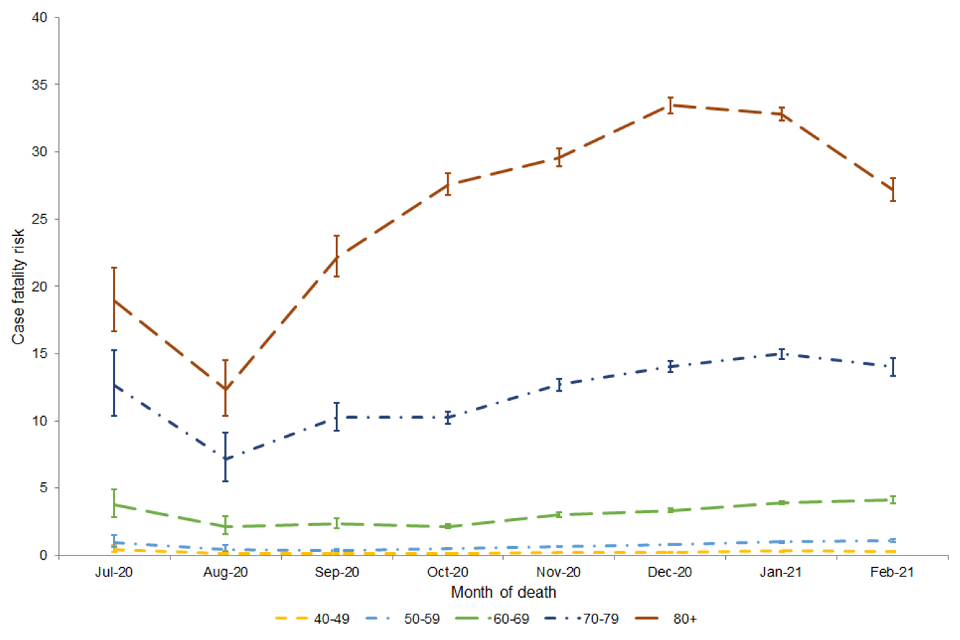
Figure 8a. Case fatality risk in laboratory-confirmed cases of COVID-19, from week 27 onwards, by age group (40+)*†
Note: The time period presented covers a period where testing coverage and testing modes have changed significantly, therefore apparent changes in estimated case fatality should be interpreted with caution.
*Data from 29 June 2020 to 28 February 2021, the last full month of available data.
†Deaths within 60 days of a positive COVID-19 test and linked to the confirmed COVID-19 case data.
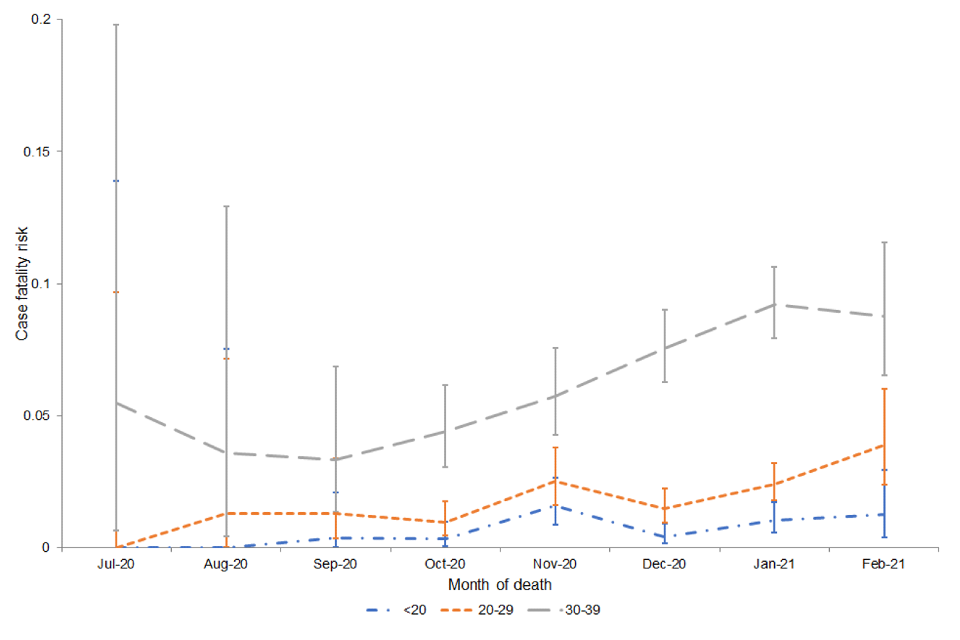
Figure 8b. Case fatality risk in laboratory-confirmed cases of COVID-19, from week 27 onwards, by age group in those aged <40*†
Note: The time period presented covers a period where testing coverage and testing modes have changed significantly, therefore apparent changes in estimated case fatality should be interpreted with caution.
*Data from 29 June 2020 to 28 February 2021, the last full month of available data.
†Deaths within 60 days of a positive COVID-19 test and linked to the confirmed COVID-19 case data.
CFR by ethnicity
From 29 June 2020 to 28 February 2021, the CFR is highest among those in the oldest age group, across all ethnic backgrounds. Those of White or White British ethnic groups report the highest CFR among all ethnicities overall, reporting a CFR of 34.2% in the 80+ age category in December 2020 (95% CI 33.6, 34.8).
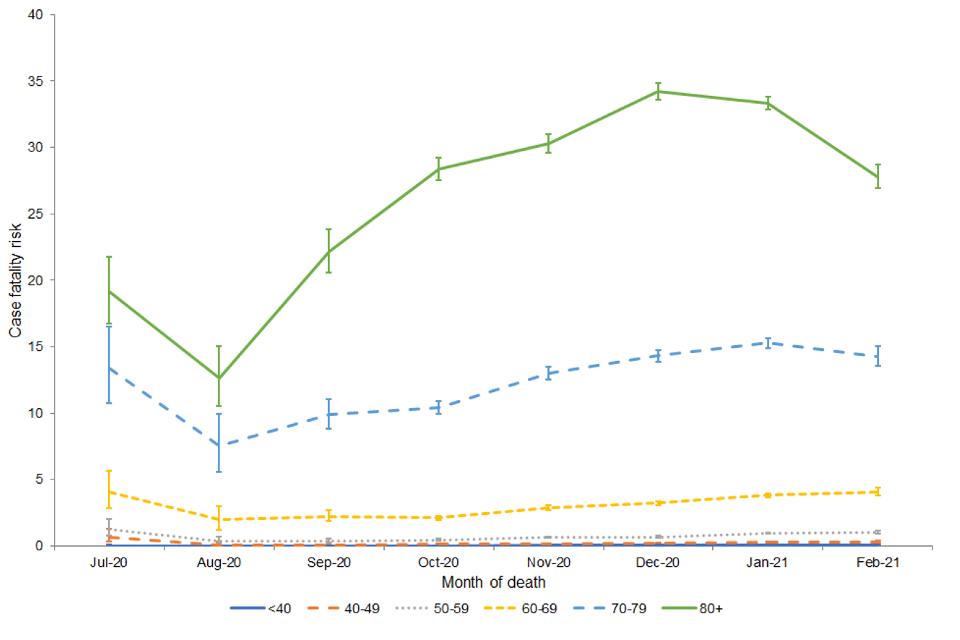
a. White or White British ethnic groups
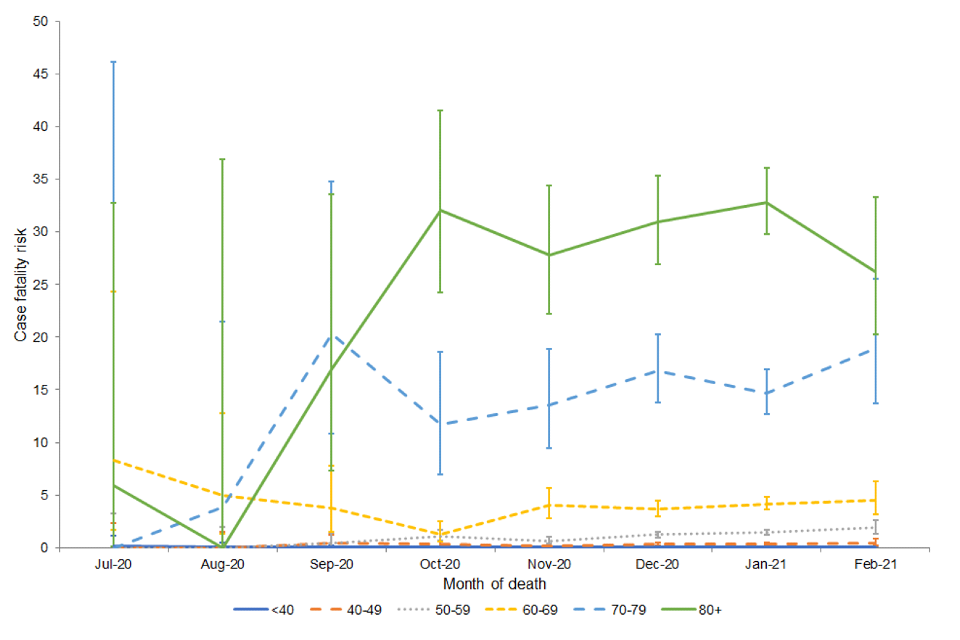
b. Black or Black British ethnic groups
c. Asian or Asian British ethnic groups
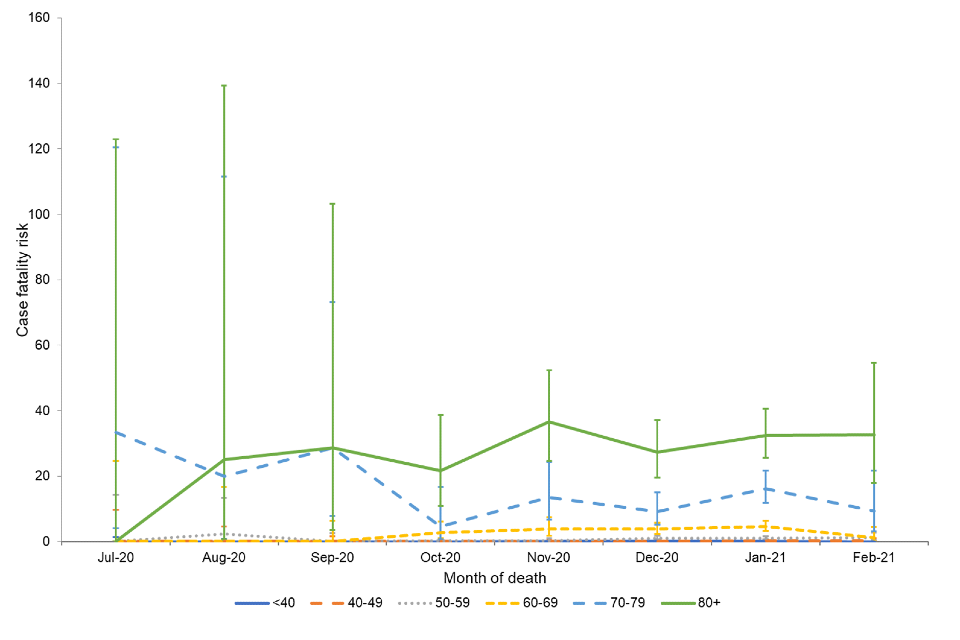
d. Mixed ethnic groups
Figures 9a to 9d. Case fatality risk in laboratory-confirmed cases of COVID-19, from week 27 onwards, by age group in of by ethnicity and age group
Note: The time period presented covers a period where testing coverage and testing modes have changed significantly, therefore apparent changes in estimated case fatality should be interpreted with caution.
Note: Please note the difference in scale across Figure 9.
*Data from 29 June 2020 to 28 February, the last full month of available data.
†Deaths within 60 days of a positive COVID-19 test and linked to the confirmed COVID-19 case data.