Apprenticeships and social mobility: fulfilling potential
Published 24 June 2020
Applies to England

© Crown copyright 2020
This publication is licensed under the terms of the Open Government Licence v3.0 except where otherwise stated. To view this licence, visit nationalarchives.gov.uk/doc/open-government-licence/version/3 or write to the Information Policy Team, The National Archives, Kew, London TW9 4DU, or email: psi@nationalarchives.gov.uk.
Where we have identified any third party copyright information you will need to obtain permission from the copyright holders concerned.
This publication is available at https://www.gov.uk/government/publications/apprenticeships-and-social-mobility-fulfilling-potential/apprenticeships-and-social-mobility-fulfilling-potential
Apprenticeships and social mobility: fulfilling potential
Research report
June 2020
1. Foreword
Apprenticeships are one of the few indisputably effective tools of social mobility currently available to the government. There is now a mountain of evidence to confirm the benefits they confer on workplace learners – such as enhanced career earnings, continued education and richer, more fulfilled working lives.
Yet the system is not working. Instead, the main beneficiaries of apprenticeships are the people who do not need them. In this study, authors at London Economics show how the apprenticeship levy, introduced in 2017, has disproportionately funded higher-level apprenticeships for learners from more advantaged communities, rather than those from disadvantaged socio-economic backgrounds, who would benefit more.
This research reveals how disadvantage gaps exist at every stage of the apprenticeship journey, from initial selection of candidates by employers to the quality of training disadvantaged apprentices get. Geography is also an issue. Lack of opportunities in deprived areas can force disadvantaged learners to undertake expensive and difficult journeys to reach work.
Following the levy’s introduction, there was a large fall in the number of learner starts – with the worst-off learners bearing the brunt. Between 2015/16 and 2017/18, the number of disadvantaged apprentice starts overall fell by 36% – 13% more than the corresponding drop for their more privileged apprentice colleagues.
Today, workplace learners from more deprived backgrounds are less likely to get selected for an apprenticeship than their more privileged peers. If they are successful, it is likely to be for an entry-level Intermediate placement – usually working in a sector where despite their importance to the economy overall they have traditionally lower rates of pay, such as health, education or hospitality. They also have a lower probability of completing their course, and hence are less likely to benefit from the boost in earnings that follows. At the same time, the more lucrative Higher apprenticeships in, for example, ICT or engineering, are increasingly the province of more privileged learners, whose share of them continues to grow.
And yet disadvantaged learners who make it past all the obstacles get the most benefit from an apprenticeship. Disadvantaged female learners, for example, report a post-completion earnings premium of 16% for intermediate apprenticeships by age 28 – compared with 10% for non-disadvantaged women.
It is no longer credible for the government to assume that apprenticeships automatically improve social mobility and leave the system to its own devices. Strategic action and direction are needed to target the system better on disadvantaged communities and improve the system’s value for money. This is an easy win for the government in its attempts at levelling up, if it can get this right. The government must look at the structural barriers in place and take action to channel resources where they will have the greatest effect.
COVID-19 will exacerbate youth unemployment in the short-term. In the long-term, it could speed up adoption of automation, which our previous research has shown will disproportionately affect disadvantaged people. More than ever, we need an apprenticeship system that delivers for skills and social mobility. We cannot wait: the government must act now on the recommendations contained within the report.
Sandra Wallace and Steven Cooper,
Interim Co-Chairs, Social Mobility Commission
2. Executive summary
Apprenticeships are often considered a ladder of social mobility. They can support employability and enable individuals to gain skills in a non-academic context. They can also upskill and reskill workers, giving a second chance to those already in employment. But whether the system is delivering on this potential is another question. Recent reforms to the system, such as the apprenticeship levy and the introduction of apprenticeship standards, have radically changed the provision of new apprenticeships to learners in England.
It’s crucial to understand how changes to the system have helped or hindered social mobility. London Economics undertook an in-depth investigation of the English apprenticeship system and the impact that recent reforms have had on individuals from disadvantaged socio-economic backgrounds.
The research mirrored the traditional steps in the apprentice journey: from selection into apprenticeship training until entry into the labour market. We analysed whether learners from disadvantaged backgrounds faced specific barriers at each stage.
Our analysis shows a big gap at every stage of the training journey between apprentices, depending on their socio-economic status. This is a remarkable finding. Such sizeable ‘disadvantage gaps’ indicate an underperforming system lacking the strategic direction to address social mobility.
We identify disadvantage gaps in terms of:
- employer selection for apprenticeship training
- the quality or ‘value’ of the training received
- the likelihood of completing training and of progressing into higher-level apprenticeships, or further and higher education
- levels of pay after undertaking an apprenticeship
But our analysis also suggests that learners from disadvantaged socio-economic backgrounds benefit more from apprenticeships than those from non-disadvantaged backgrounds. The boost to their earnings, post-apprenticeship, is greater than their peers’.
Despite the many barriers disadvantaged learners face during their training journey, apprenticeships can effectively promote social mobility – if they are targeted at the right learners.
But the system is not delivering. This report should serve as a sobering analysis of a system that could be – but is not – delivering social mobility in England. It should also serve as a wake- up call for government and employers to take action and close the disadvantage gaps within the system.
2.1 Becoming an apprentice
The apprenticeship levy has reduced starts by individuals from disadvantaged backgrounds
The apprenticeship levy caused a heavy fall in the number of apprenticeship starts. This impacted disadvantaged learners more severely than their non- disadvantaged peers.
Between 2015/16 and 2017/18, the number of apprenticeship starters from disadvantaged backgrounds fell by more than a third (36% versus 23% for non- disadvantaged apprentices). The impact was greater for older apprentices (aged 25+) and female apprentices.
Size of employer affects apprenticeship starts for disadvantaged learners
Smaller firms have seen a larger proportional reduction in apprenticeship numbers than larger businesses. Relatively poor outcomes for disadvantaged learners occur in enterprises of all sizes, however.
Since the levy’s introduction, the proportion of disadvantaged starters employed in large enterprises has increased by 8 percentage points (compared with a 10 percentage point increase among non-disadvantaged starts). This is partly due to an overall increase in starts at large firms, driven by the levy.
More than 80% of apprenticeships started by disadvantaged learners were in enterprises in the service industries or in the health, education and public administration sectors. This has remained stable over time.
The levy supports non-disadvantaged apprentices more
The apprenticeship levy radically reformed the funding rules for apprenticeships. In the first year of the levy, disadvantaged starters were less likely to receive levy support than non-disadvantaged starters.
This suggests that the levy helped non- disadvantaged learners more. This disadvantage gap was more severe in London and south-east England, reflecting the economic characteristics of these regions and the prevalence of levy-paying enterprises.
Disadvantaged apprentices do not receive equal value training
The levy has been ineffective at narrowing the gap in the ‘value’ of training received by the 2 groups. In 2017/18, disadvantaged learners:
- clustered in apprenticeships at lower levels (48% of disadvantaged starters were enrolled into an intermediate apprenticeship in 2017/18, compared with only 41% of starters from non-disadvantaged backgrounds)
- clustered in low-paying subject areas at higher apprenticeship levels, particularly for women
- had shorter planned apprenticeship durations than their peers, on average, within higher-earning subject areas such as engineering, construction and Information and Communications Technology (ICT)
Some of these results may reflect differences in prior attainment levels between disadvantaged and non-disadvantaged learners or the characteristics of local labour demand. The Commission will publish a separate analysis looking at this question.
Disadvantaged apprentices are less likely to achieve the qualification or progress to further and higher education
Disadvantaged apprentices are less likely to complete their training than non-disadvantaged peers. This may indicate there are specific financial or accessibility barriers for these learners. The gap is larger for apprenticeships at intermediate than advanced level, but disappears at higher level.
A total 63% of disadvantaged men starting an intermediate apprenticeship between 2013/14 and 2014/15 achieved the qualification within 3 years of the start of training. This compares with 67% of non-disadvantaged men.
A young disadvantaged learner with an intermediate apprenticeship is up to 4 percentage points less likely to achieve a qualification at higher level than a non- disadvantaged learner.
For young non-disadvantaged learners, intermediate apprenticeships act as a stepping stone towards educational attainment at higher levels. This is less applicable for disadvantaged learners.
Apprenticeships give a bigger earnings boost for disadvantaged learners
An apprenticeship provides better training and improved skills, which should increase earnings. So, do apprenticeships promote social mobility – despite the gaps faced by disadvantaged learners in terms of selection, training quality, completion and progression rates?
The answer is yes – for those who overcome the odds and achieve the qualification. Apprenticeships boost employment and reduce the gap in earnings between disadvantaged and non-disadvantaged learners. However, this outcome may not be immediately apparent.
Disadvantaged learners with an apprenticeship earn less than non-disadvantaged individuals.[footnote 1] This occurs at all levels of apprenticeship and for both genders. Yet this does not reflect the earnings boost associated with apprenticeship attainment.
Individuals from disadvantaged backgrounds completing an apprenticeship receive a larger boost in their earnings than non-disadvantaged individuals. This is particularly true at intermediate level – the first step on the apprenticeship journey.
The earnings gap also closes as you move further up the apprenticeship levels. The gap in annual earnings for disadvantaged men declines from £2,000 per year to £1,400 to £1,200 on moving from Level 1 vocational qualifications to intermediate and advanced apprenticeships.
Key findings:
Disadvantage gaps exist at every stage of the apprenticeship journey:
- employer selection
- the ‘value’ or quality of training
- the probability of apprentices progressing to higher levels of training or education
- career earnings
The selection gap: Between 2015/16 and 2017/18, apprentice starts collapsed. Hardest hit were disadvantaged learners, whose numbers fell 13 percentage points more than learners from more privileged backgrounds (36% versus 23%).
The quality gap: The quality of training is not equal, even within the same industry and at the same level. Disadvantaged apprentices planned to receive between 1.5 - 3 months less training in 2017/18 than their peers in 3 notable industries: construction, engineering and ICT.
The levy gap: Disadvantaged learners are less likely to be levy funded by 3 to 5 percentage points. The apprenticeships that are most commonly levy-supported are also the apprenticeships where the disadvantage gap is greatest.
The progression gap: Only 32.7% of disadvantaged men with an intermediate apprenticeship progressed to a higher qualification compared with 39.7% of others.
The earnings boost: When a learner from a low socio-economic background overcomes these relentless barriers, there is hope. Disadvantaged learners earn less than their peers on average but they get a bigger boost. Disadvantaged women with an intermediate apprenticeship at age 28 report a 16% earnings boost from completing an apprenticeship, compared with 10% for non-disadvantaged women.
Apprenticeships have the potential to promote social mobility, but only if targeted at disadvantaged learners, which is not happening.
2.2 Recommendations and targets
This study clearly illustrates that the English apprenticeship system has the potential to promote social mobility in England. However, disadvantaged learners still face significant barriers in terms of access to higher-level training. Some of these barriers and gaps have worsened since the introduction of the levy, and are likely to widen as a result of current economic challenges.
The response to the COVID-19 pandemic in the UK poses new challenges for employers. Reduced economic activity will likely result in a reduction of apprenticeship opportunities in the near future. In addition, government pilot schemes to widen access to apprenticeships that we have previously featured, such as the Opportunities through Apprenticeship programme, were already too small, and we fear are at risk of deprioritisation.
Disadvantaged apprentices are at a disproportionate risk of paying the most severe consequences of this decline. They are disproportionately employed in sectors that have been shut down, such as hospitality and retail. Additionally, they may be perceived by firms to be ‘riskier bets’ or more expensive to recruit and retain, compared with non-disadvantaged apprentices. Decisive government action is needed to prevent a system that is already not working from becoming worse.
We propose a set of targets for government to meet by December 2023 – the fourth anniversary of the current Parliament – and we will monitor government’s progress in achieving this. The targets are in relative rather than absolute terms (compared to latest available year) to account for the economic difficulties arising from the pandemic.
Target 1: Increase the share of apprentices from disadvantaged socio-economic backgrounds to pre-levy level.
The introduction of the levy was accompanied by a drop in the proportion of starts by learners from disadvantaged areas. This is partially the result of the shift towards higher-level apprenticeships, which are less frequently undertaken by disadvantaged learners.
It is crucial that an increased proportion of disadvantage learners start apprenticeships at higher levels, returning the overall proportion of starters from disadvantaged backgrounds to pre-levy levels (26% of all starts in 2015/16 were from disadvantaged areas compared to 22% in 2017/18).
Target 2: Increase the proportion of starters from disadvantaged backgrounds at advanced and higher levels to comparable levels currently prevailing for non-disadvantaged apprentices.
Target 3: Eliminate the disadvantage gap in levy support for starters at higher level.
Not only are disadvantaged starters more often clustered in lower level apprenticeships, they are less likely to be levy-supported when undertaking apprenticeships at higher level.
The clustering of disadvantaged learners in apprenticeships at intermediate level may depend on a number of factors, including the characteristics of local labour demand in disadvantaged areas and the offer of education providers. In addition, evidence from our charity partners suggests it may depend on entry requirements that employers and providers place on starters, such as English and maths.[footnote 2]
Formally, there are no entry requirements in English and maths to undertake a Level 3 apprenticeship. However, the current system may discourage providers from taking on learners without prior attainment in these subjects.[footnote 3] As disadvantaged learners are more likely to have poorer prior educational outcomes, this arrangement is likely to penalise this group.
Geographic access to higher-level apprenticeships is also likely to impact disadvantaged apprentices – as is navigating a complicated selection process, set primarily by employers, that involves both securing a job and applying for an apprenticeship. Our research has shown that disadvantaged people have less opportunity to move to access opportunities.[footnote 4] The Department for Education (DfE) should review these and other barriers to entry and work to close the disadvantage gaps in higher-level and levy-funded starts.
Target 4: Ensure the average planned duration of comparable apprenticeship programmes are at least as long for disadvantaged learners as for non-disadvantaged learners (with no shortening of planned duration compared to current levels).
The analysis indicates that the average planned duration of the programme is shorter for disadvantaged apprentices, compared with non-disadvantaged learners. This difference persists even when controlling for level and subject area of study. The DfE should consider the introduction of measures to ensure disadvantaged learners are provided with similar training opportunities to their non-disadvantaged peers.
Target 5: Reduce incidence of non-achievement for all socio-economic backgrounds to levels comparable to those in other education sectors.
Target 6: Ensure completion rates for comparable apprenticeship programmes are the same for both disadvantaged and non-disadvantaged learners (and comparable to completion rates in the wider education arena).
The current non-achievement rate of approximately 30% is high and leads to an inefficient use of scarce public resources. We are proposing a target for the Department of Education to ensure that apprenticeship drop-out rates are reduced to match drop-out rates in higher education.[footnote 5]
Disadvantaged learners are particularly unlikely to complete their program of learning. One of the main reasons for dropping out, as reported in the latest Learners and Apprentices Survey, relates to travel issues and low pay.[footnote 6] In particular, the ‘on-programme experience’ of disadvantaged apprentices indicates that disadvantaged learners often struggle to cover travel costs, and that levels of apprenticeship pay are often insufficient.
There is also increasing concern that small and medium enterprises, often offering intermediate level apprenticeships, are more likely to pay the apprentice minimum wage. Because disadvantaged learners are clustered in apprenticeships at lower levels, they are more likely to be in a financially precarious situation. We therefore propose that the Low Pay Commission and the DfE targets both those financial and non-financial aspects of apprenticeship training known to depress completion rates, particularly among disadvantaged learners.
Improvements to the statistical release
To ensure the Social Mobility Commission and others can monitor the government’s progress on the proposed targets and evaluate the apprenticeship program properly, the following improvements to the statistical releases on apprenticeship training are needed immediately:[footnote 7]
- Breakdown by region of the provider[footnote 8]
- Breakdown by socio-economic background[footnote 9]
- Reporting on employers (and their characteristics) engaging with the apprenticeship system[footnote 10]
- Refine ILR field on reason for withdrawal
3. Introduction
Apprenticeships can promote social mobility and offer a route into employment for individuals who did not excel in school, as well as upskilling those already in employment.
Over the past few years, 2 complementary reforms have radically changed the English apprenticeship system:
- the progressive removal of apprenticeship frameworks in favour of occupation-designed apprenticeship standards
- the introduction of the apprenticeship levy – drastically reforming funding rules for new apprenticeship starts
Since 2010, employers have also offered apprenticeships at higher levels, together with traditional programmes at Levels 2 and 3 of the qualifications framework. Degree-level apprenticeships, combining work experience and university study, have become more common since 2015. This shift has resulted in government missing its target for 3 million apprentices by 2020, while simultaneously overspending the apprenticeship budget, potentially by as much as £1 billion.[footnote 11]
The reforms have impacted the types of apprenticeships available to prospective learners, as well as employers’ incentives to hire new apprentices. A major concern is that the levy may incentivise employers to train existing, higher-skilled employees instead of disadvantaged apprentices. Our previous report shows that those from higher socio-economic backgrounds receive more training, no matter what their own occupation is.[footnote 12] The shift towards higher-level apprenticeships, if focused on existing employees from higher socio-economic backgrounds, may also limit the system’s ability to provide opportunities to disadvantaged apprentices looking to progress in the workplace.
We investigated whether the English apprenticeship system is effective in fostering social mobility. We used a variety of datasets to follow apprentices throughout their training journey, from initially accessing training until entry into the labour market.[footnote 13]
We assess whether:
-
apprenticeship training is as accessible to individuals from disadvantaged socio-economic backgrounds, and if this has changed as a result of the reforms
- the type of training – in terms of level, subject and planned duration – received by disadvantaged apprentices is comparable to that received by individuals from non- disadvantaged backgrounds
- the chance of completing an apprenticeship or progressing into further and higher education is similar for learners from different socio-economic backgrounds
- apprenticeships are effective at reducing labour market gaps between disadvantaged and non-disadvantaged learners
3.1 Five years of changes: a timeline of the recent reforms to the apprenticeship system in England
Apprenticeship levy
Announced in 2015 and introduced in April 2017, the apprenticeship levy reformed the funding rules of English apprenticeships, with the core aim of increasing the engagement of large employers with the apprenticeship system.
The levy is a tax of 0.5% on the total pay bill for companies with a payroll exceeding £3 million. It is collected by the government but made available to employers to fund apprenticeship training through their digital account. Companies below the £3 million threshold do not pay the levy.
The contribution paid by employers subject to the levy accumulates in their digital accounts, and can be spent on apprenticeship training up to the maximum threshold established for each apprenticeship. After 2 years, these funds expire and are used to support small employers who do not pay the levy.
The government partly subsidises these apprenticeship costs by providing a 10% top-up on the levy paid by companies. Levy-paying employers can also transfer up to 25% of their levy funds to other employers.
Since April 2017, the funding mechanism has also changed for small companies not subject to the levy. Apprenticeship training for them is funded through a co-investment mechanism, where the government subsidises 95% of training costs (for starts from April 2019), compared with the previous subsidy of 90%.
About 22% of the £598 million paid into the levy in the first 4 months was left unused after 2 years and expired. This is less than the amount the government originally expected, resulting in a squeeze on funding available for smaller enterprises.[footnote 14]
Framework and standards
Introduced in 2014, apprenticeship standards are occupation-focused apprenticeships designed by employers. Standards completely replace apprenticeship frameworks by the end of July 2020, when they will become the sole system for new apprenticeship starts.
In parallel with the introduction of the apprenticeship standards, a 20% minimum threshold for off-the-job training was introduced, meaning that apprentices are required to spend at least 20% of their normal working hours in off-the-job training. This requirement applies to both apprenticeship frameworks and apprenticeship standards at all levels.
4. Methodology
We were given access to several large administrative data sources that are being developed as part of the Department for Education-funded Centre for Vocational Education Research. Some information on the various data sources is provided below, together with a description of the approach we used to identify the socio-economic background of apprentices.
4.1 Data sources
Selection, training quality and attrition
We constructed a matched apprentice-employer dataset, linking information from several data sources, namely:
- the Individualised Learner Record (ILR) for the academic year 2010/11 to 2017/18: this provides data on apprenticeships and other publicly-funded training in England
- the Inter-Departmental Business Register (IDBR) for the period 2010/2018: this provides information on UK businesses’ financial, employment, regional and sectoral characteristics
- the English Index of Multiple Deprivation (IMD) for 2010
Detailed information on each dataset is provided in the technical report that accompanies this research.
Progression and labour market outcomes
Using the Longitudinal Education Outcomes (LEO) dataset, we investigated education progression and labour market outcomes for learners after completing intermediate or advanced apprenticeships.[footnote 15] This dataset combines information on education enrolment and attainment at secondary school, further education colleges and higher education institutions with data on earnings, employment and benefit dependency.[footnote 16]
We focused on the 3 cohorts of English-domiciled pupils completing Key Stage 4 in the academic years 2001/02, 2002/03 and 2003/04 and subsequently enrolling into an apprenticeship programme. Information from the various datasets is available up to the 2016/17 academic (or financial) year. This allowed us to follow pupils from the cohorts of interest up to age 28 to 30, depending on the cohort.
4.2 Identifying apprentices from disadvantaged backgrounds
Identifying apprentices from disadvantaged socio-economic backgrounds was one of the main challenges in this study.
We used a geographical definition of deprivation based on the 2010 IMD.[footnote 17] The IMD assigns each neighbourhood in England (or Lower-layer Super Output Area, LSOA) a rank from 1 (most deprived) to 32,844 (least deprived) using 7 specific dimensions of deprivation.[footnote 18] These dimensions are:
- income
- employment
- health
- crime
- housing
- living environment
- education deprivation
Figure 1 displays the decile of deprivation for each LSOA in England, with areas representing the 10% most (red) and least (blue) deprived neighbourhoods. Urban areas, parts of Cornwall and coastal regions were the most deprived areas in 2010. Inland non-urban areas were typically less deprived.
To identify ‘disadvantaged’ apprentices, each apprentice was assigned an IMD rank on the basis of the postcode of domicile of the training programme, as reported in the ILR. In case the information on previous postcode of domicile was missing or mis-recorded, the corresponding IMD rank was assigned as the apprenticeship provider’s postcode.
We defined those apprentices originating from the 20% most deprived English neighbourhoods as disadvantaged. This is consistent with the academic literature on deprivation.[footnote 19],[footnote 20],[footnote 21]
To understand the differences between areas classified as disadvantaged and non- disadvantaged, our technical report presents the characteristics of the population living in disadvantaged and non-disadvantaged neighbourhoods, obtained from the 2011 census.
Figure 1: Index of Multiple Deprivation (IMD) of LSOAs in England (2010)
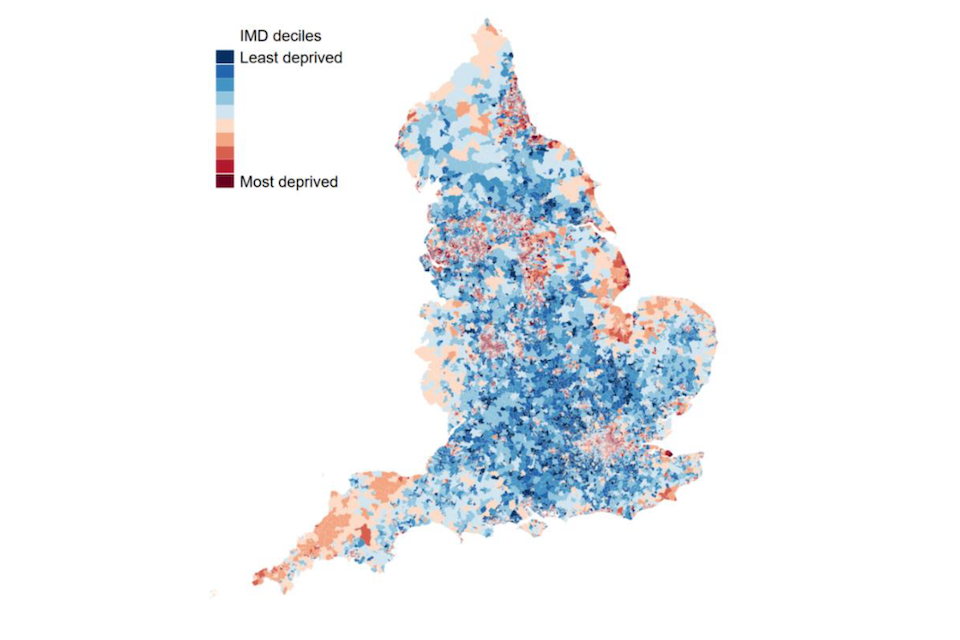
Source: London Economics’ analysis of IMD 2010 data. Contains National Statistics data, Crown Copyright and database right 2018.
Around 42% of the entire population of disadvantaged individuals in 2011 lived in north-west England or London – 2 regions characterised by large urban agglomerations. In contrast, more than 20% of the non-disadvantaged population lived in south-east England. This compares to 7% of disadvantaged apprentices.
Individuals living in disadvantaged areas are younger, more likely to be from BAME (black, Asian and minority ethnic) backgrounds, and are more likely to be affected by some form of disability than learners from non-disadvantaged areas.
5. Who are the disadvantaged apprentices?
For our study, we define disadvantaged apprentices as those from the 20% most socio- economically deprived neighbourhoods.
To understand how access to the apprenticeship system has changed following the recent reforms, and whether this has helped or hindered social mobility, this section explores the characteristics of apprenticeship starters over time, with findings presented separately for disadvantaged and non-disadvantaged learners.
The results in this section should be interpreted bearing in mind there are strong links between population characteristics and measures of disadvantage. Wider population differences across areas defined as disadvantaged and non-disadvantaged must be considered and are highlighted in the report where relevant.[footnote 22]
5.1 Key findings
The fall in number of apprenticeship starters after the introduction of the apprenticeship levy affected disadvantaged apprentice learners more severely than non- disadvantaged learners (36% fall for disadvantaged learners versus 23% fall for non-disadvantaged).
Women and older starters among disadvantaged learners were particularly harmed by the apprenticeship reforms (43% fall for disadvantaged women aged 25 or above).
The decline in apprenticeship training has been more severe in regions that have traditionally been strong at offering apprenticeship training (north-west and north-east of England). These regions are also more likely to be disadvantaged and have seen a larger fall for disadvantaged learners than for non-disadvantaged learners.
5.2 Apprenticeship starts over time
The proportion of apprenticeship starters from disadvantaged backgrounds has declined steadily over time.
This group accounted for 30% of all starts in 2010/11 (141,000), but only 22% (84,000) in 2017/18. Figure 2 shows the number of starters by socio-economic background and the share of disadvantaged learners (dashed line) by academic year for the period 2010/11 to 2017/18.
After the introduction of the levy, the overall number of apprenticeship starts declined by a quarter – from around 500,000 new starts in 2015/16 and 2016/17 to 376,000 in 2017/18.
This fall in starts has impacted disadvantaged learners more than non-disadvantaged ones. Apprenticeship starts for those from disadvantaged backgrounds dropped by around 36% between 2015/16 and 2017/18. This compares with 23% for non-disadvantaged learners.
Figure 2: Apprenticeship starts over time, by disadvantaged status (2010/11 to 2017/18)
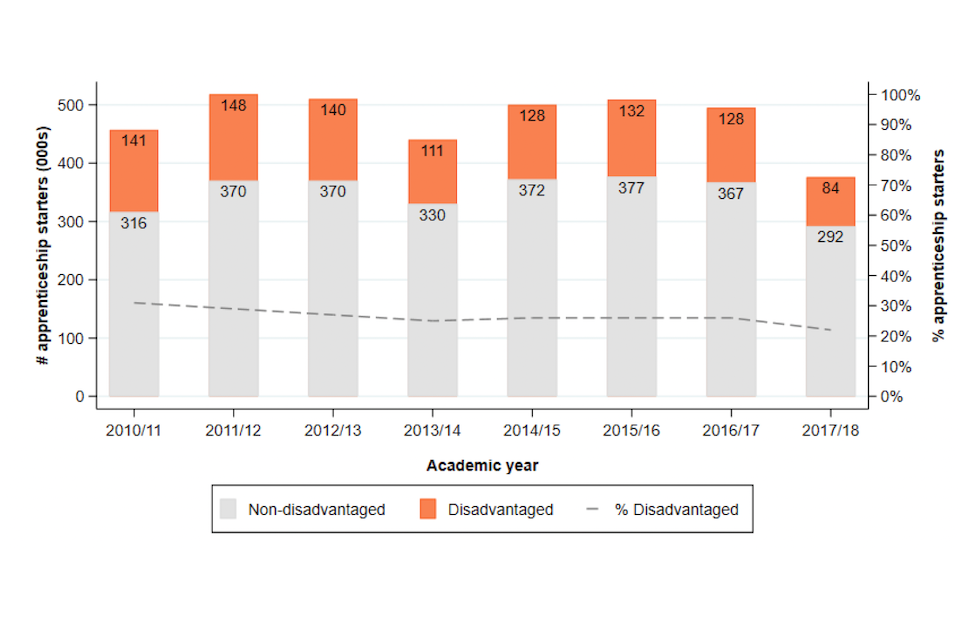
Note: Totals are rounded to the nearest 1,000. Source: London Economics’ analysis of ILR (2010/11 to 2017/18) and IMD (2010) data
5.3 Characteristics of apprenticeship starters
Gender
Historically, more women started apprenticeships than men – particularly those from disadvantaged backgrounds.
In 2015/16, 56.9% of starters from disadvantaged backgrounds were female, compared with 51.3% for starters from non-disadvantaged areas (Figure 3).
Figure 3: Percentage of starters by disadvantaged status, gender and academic year (2015/16 to 2017/18)
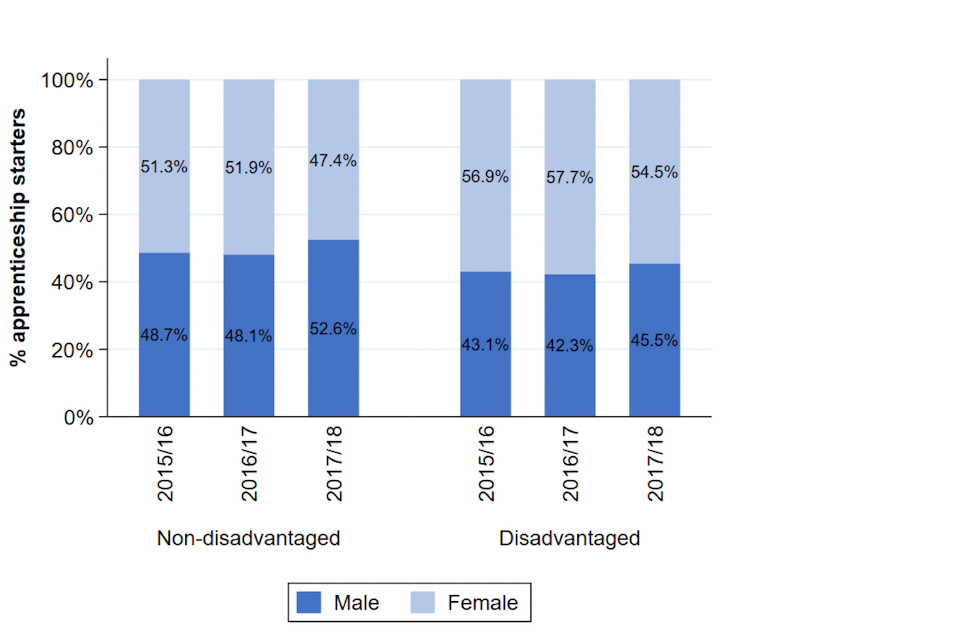
Source: London Economics’ analysis of ILR (2015/16 to 2017/18) and IMD (2010) data.
After the levy was introduced in 2017/18, there was a shift towards male starters among both disadvantaged and non-disadvantaged learners. The proportion of women decreased to 54.5% among disadvantaged starters and to 47.4% among non-disadvantaged, so women experienced a larger decline in apprenticeship starts.
Figure 4 shows the percentage change between 2015/16 and 2017/18 in the number of starters according to their demographic characteristics. Apprenticeship starts declined substantially across all demographic groups.
Figure 4: Percentage change in the number of starters by disadvantaged status and other individual characteristics (2015/16 and 2017/18)
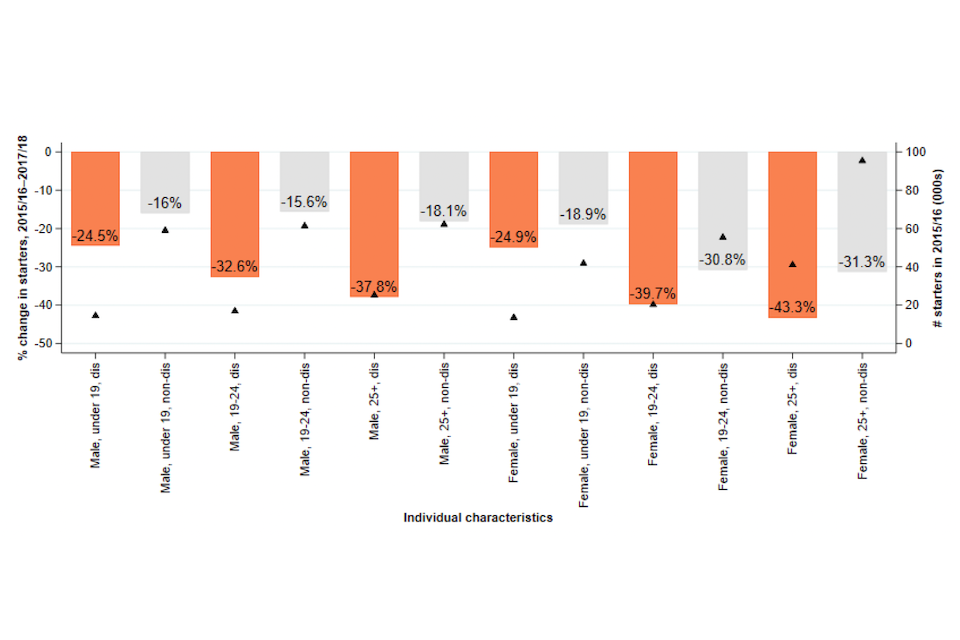
Note: Figures in orange refer to disadvantaged apprentices. Bars refer to left axis. Triangles refer to right axis. Source: London Economics’ analysis of ILR (2015/16–2017/18) and IMD (2010) data.
The groups suffering the largest declines were:
- disadvantaged learners
- women
- older starters (aged 25 or above)
These effects compound each other, so older disadvantaged women were the most severely affected.
Age
There are other differences between disadvantaged and non-disadvantaged groups.
In 2017/18, apprentices from disadvantaged neighbourhoods were older, on average, than non- disadvantaged apprentices.
The average age at the start of the programme was 27.2 years for disadvantaged apprentices, compared with 26.0 years for non-disadvantaged apprentices.
More apprenticeship starters from disadvantaged backgrounds were aged 25 or above at the start of their training (46.5%) than from non-disadvantaged apprentices (40.1%), as shown in Figure 5.
Figure 5: Percentage of starters by disadvantaged status, age group and academic year (2015/16 to 2017/18)
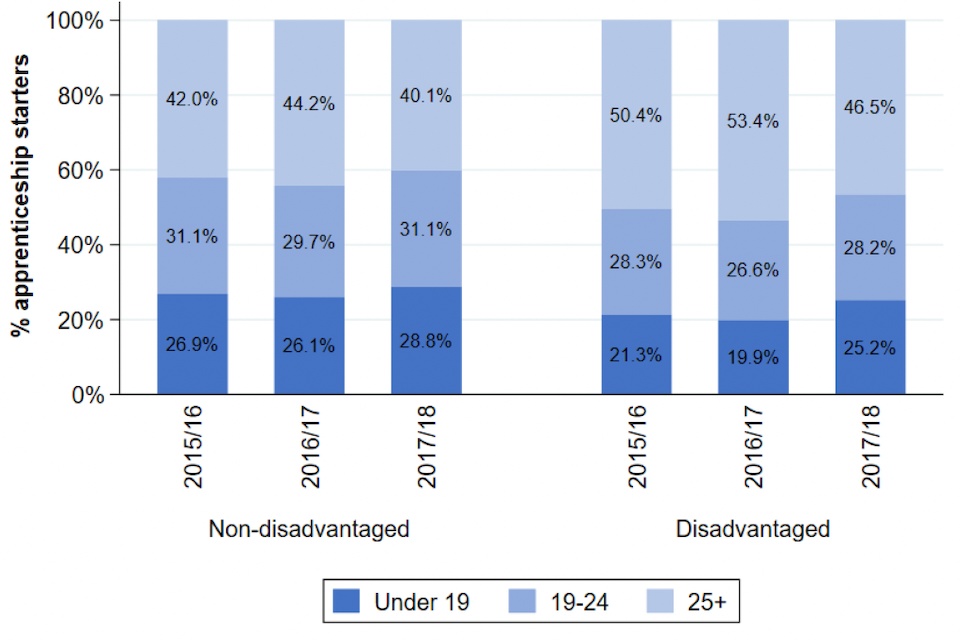
This contrasts with wider population data, which indicates that individuals from disadvantaged areas are generally younger than those from non-disadvantaged areas.[footnote 23] The data does not indicate why disadvantaged learners tend to start apprenticeships later. However, we may infer that:
- apprenticeships provide a ‘second chance’ for disadvantaged learners
- there are barriers to entry into apprenticeship training at a younger age for these learners – for example, entry requirements or financial constraints
Ethnicity
The data shows a difference in ethnic composition between disadvantaged and non- disadvantaged starters – reflecting wider characteristics of these groups as a whole.[footnote 24] In 2017/18, the proportion of non-white British apprenticeship starters from disadvantaged areas was much larger than from non-disadvantaged areas (27.5% versus 15.2%).
Figure 6 indicates the most significant BAME groups among disadvantaged starters:
- White – Other (6.4% versus 4.8% of non-disadvantaged)
- Asian – Pakistani (3.4% versus 0.8%)
- Black – African (3.5% versus 1.1%)
- Mixed/Other (4.6% versus 2.8%)
There was no change in the ethnic composition of disadvantaged and non-disadvantaged learners over the past 3 academic years. This suggests that the post-levy fall in starts did not change the proportion of specific ethnic groups.
Figure 6: Percentage of starters by disadvantaged status, ethnicity and academic year (2015/16 to 2017/18)
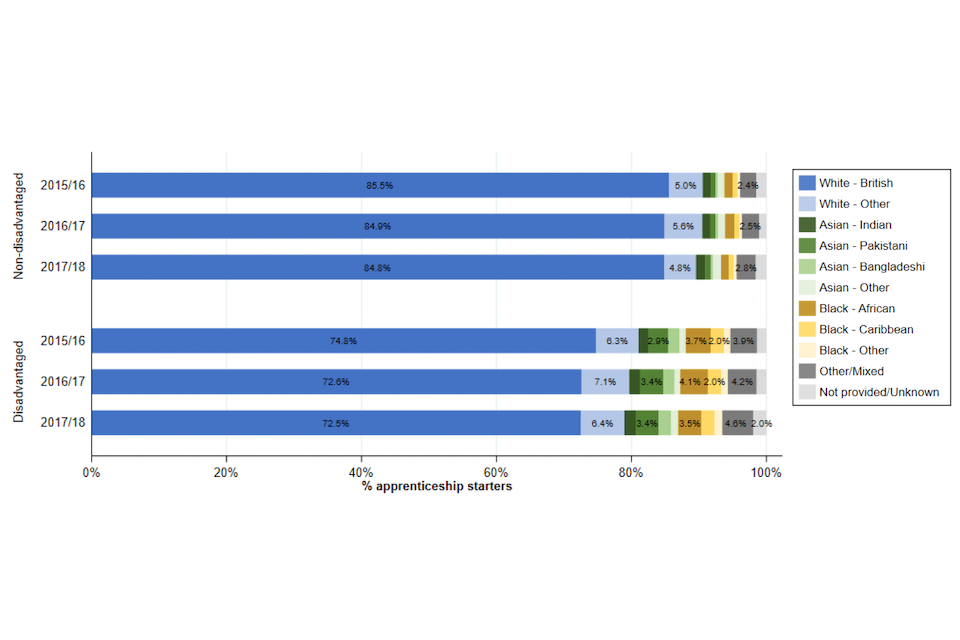
Note: Labels below 2% have been omitted. Source: London Economics’ analysis of ILR (2015/16 to 2017/18) and IMD (2010) data.
Disability
Census data indicates that there is a larger proportion of people with disabilities in disadvantaged areas compared with non-disadvantaged areas.[footnote 25]
The proportion of apprenticeship starters reporting some form of disability was similar across the 2 groups in 2017/18, at around 11% (Figure 7). This figure remained constant between 2015/16 and 2017/18.
Figure 7: Percentage of starters by disadvantaged status, disability and academic year (2015/16 to 2017/18)
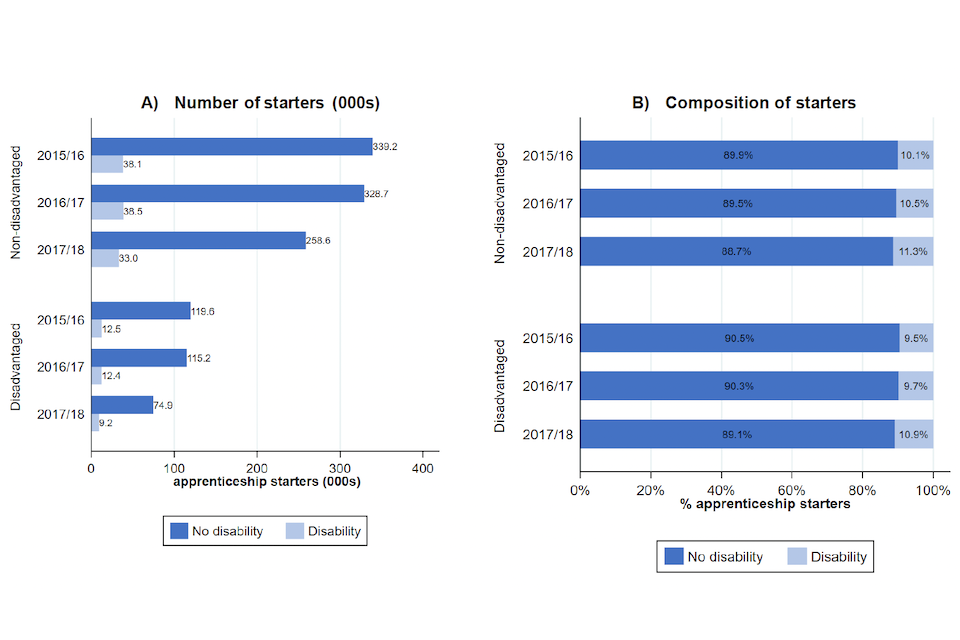
Source: London Economics’ analysis of ILR (2015/16 to 2017/18) and IMD (2010) data.
Region
Most disadvantaged apprenticeship starters came from 3 regions:
- north-west England (25%)
- the west midlands (15%)
- London (15%)[footnote 26]
Conversely, few were from the east of England (4%) or south-west England (5%).
The proportion of disadvantaged starters by region does not vary much by gender (Figure 8). Yet the geographic distribution of starters across England broadly mirrors the areas defined as disadvantaged.[footnote 27]
Figure 8: Disadvantaged apprenticeship starters by region and gender (2017/18)
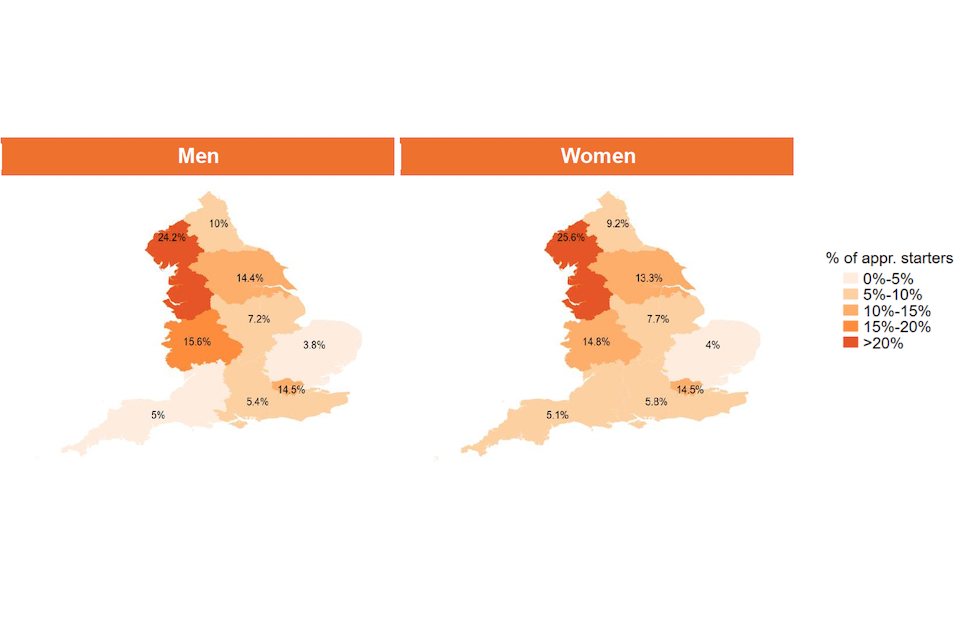
Source: London Economics’ analysis of ILR (2017/18) and IMD (2010) data. Contains National Statistics data, Crown Copyright and database right 2018.
Because the concentration of disadvantaged areas is greater in certain regions than in others, we constructed a measure of ‘apprenticeship training intensity’ to understand whether engagement with apprenticeship training varies by region.
Apprenticeship training intensity in each region was defined as the number of starts by learners from disadvantaged (non-disadvantaged) backgrounds per 1,000 working-age population living in disadvantaged (non-disadvantaged) areas in the region.[footnote 28]
So, does training intensity vary by region, and has this changed since the levy? Before the introduction of the levy in 2015/16, the regions with the highest apprenticeship training intensity from disadvantaged areas were north-east England (for both men and women) and north-west England (for men), which in part reflects the concentration in these regions of industries that traditionally offered apprenticeships.
A lower level of engagement with the apprenticeship system for individuals from disadvantaged areas was observed in London and the south-east. This reflects the relative concentration of service industries in these regions, whose hiring and training practices may unintentionally create barriers to those from disadvantaged backgrounds.[footnote 29],[footnote 30] Nationwide, a larger proportion of individuals from disadvantaged neighbourhoods – particularly women – engaged with apprenticeship training than from non-disadvantaged neighbourhoods (Figure 9).
Figure 9: Intensity of apprenticeship training by region of origin, by disadvantaged background and gender (2015/16 and 2017/18)
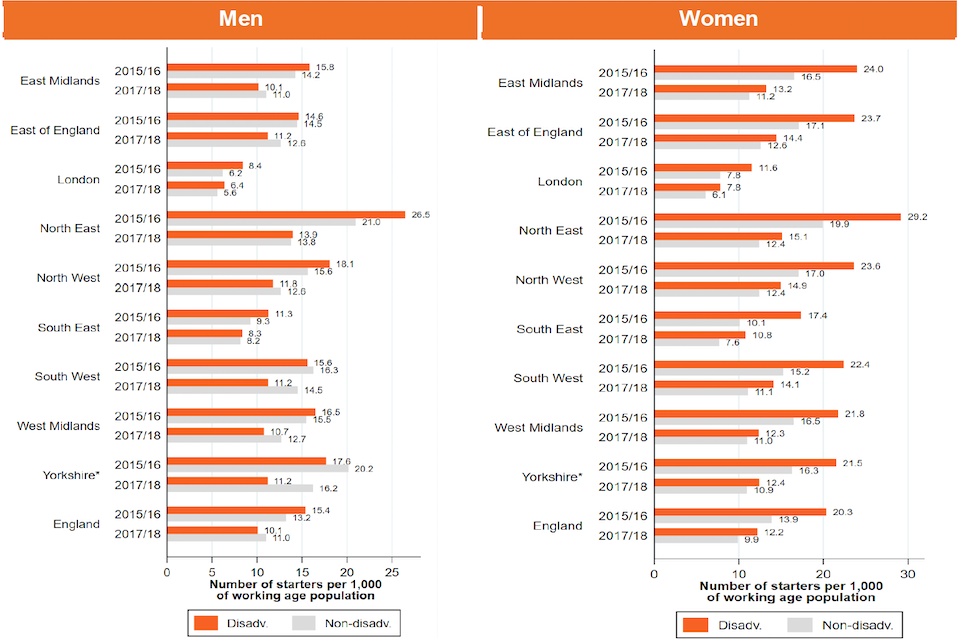
Note: *Yorkshire and the Humber. Source: London Economics’ analysis of ILR (2015/16 to 2017/18) and IMD (2010) data.
There has been a sharp fall in apprenticeship intensity since the levy was introduced:
- apprenticeship training intensity dropped nationally from 15.4 to 10.1 for disadvantaged men and from 20.3 and 12.2 for disadvantaged women – these declines have been greater than the declines experienced by non-disadvantaged learners (Figure 10)
- this decline in training was more severe in the north-east: from 26.5 to 13.9 for men and from 29.2 to 15.1 for women
- London saw a more limited fall for both men and women – as was the case in the south-east for men.[footnote 31] This reflects the increase in apprenticeship training by large levy-paying enterprises that occurred in the post-levy period[footnote 32]
Figure 10: Intensity of apprenticeship training by region of origin, by disadvantaged background and gender (2015/16 and 2017/18)
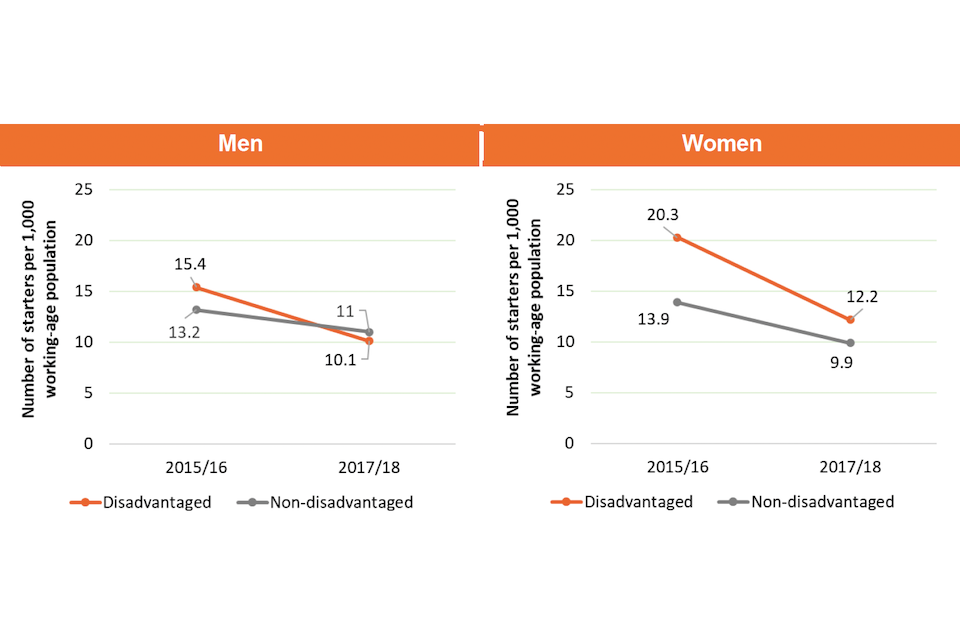
Source: London Economics’ analysis of ILR (2015/16 to 2017/18) and IMD (2010) data.
Both the number of apprenticeship starts and training ‘intensity’ have declined since the levy.
The levy has hit disadvantaged learners most – particularly women and older learners. The decline in apprenticeship training has been more severe in those regions traditionally strong in apprenticeship training. These are also regions more likely to be disadvantaged. To conclude: the levy reforms appear to be detrimental to social mobility in these areas.
Case study: Lucy Corcoran, Manchester
Lucy did well in her A Levels, and could have had her pick of universities.
“I wanted that education,” she said, “but I didn’t want to move from home, I didn’t know what I wanted to study, and I wasn’t bothered by the partying.”
After finishing her A Levels, Career Ready helped Lucy find a marketing internship at RBS, and it opened her eyes.
“It was more than just advertising,” she added, “it was creativity in a corporate environment and I realised that I enjoy both.”
Career Ready took a group of interns to London for some inspirational talks.
One of the speakers was a lady who had done a degree apprenticeship. “I’d never heard of them,” she said. “And started to do some research.”
Lucy met other degree apprentices and her interest grew. She found a 4-year course at Manchester Metropolitan University that seemed perfect: it would earn her a Bachelor’s Degree in Chartered Management and a CMI Level 6 qualification – plus a salary and experience.
“I created a LinkedIn profile,” she said, “and a local company got in touch and asked me if I wanted to lead their new marketing department. During the interview, I pitched them the idea of the degree apprenticeship.
“I thought it might be a barrier, because of the study time, but they loved it. My degree coursework required evidence of applied learning, so it was valuable to my employer, because I put everything straight into practice at work.”
Whilst doing the apprenticeship, Lucy was classed as a normal employee, with a salary.
“Getting that proper wage at such a young age was amazing,” she says, “I’ve gone on holidays, bought a house, and got years of experience ahead of people who just did university.
“I’ve made friends through my course, but from lots of different ages. They’ve encouraged me to try different things, and pushed me out of my comfort zone.”
And it’s even put her at a salary advantage when compared to non-apprentice graduates. “It’s brilliant,” she said. “Absolutely amazing.”
6. Where do disadvantaged apprentices work?
Employers play a key role in the apprenticeship system by hiring new apprentices and supporting them during their training. They shape the profile of the system by deciding how many starters to hire, in which subject areas and at which level. Businesses also influence the learning experience of each apprentice through the provision of on-the-job training. It is therefore crucial to look at the characteristics of employers – especially those hiring disadvantaged apprentices.
We explore the extent to which disadvantaged starters were levy-supported to understand the impact of the recent apprenticeship reforms. We also assess whether there were any links between levy support and other demographic or employer characteristics.
6.1 Key findings
Smaller firms have seen a larger proportional reduction in apprenticeship numbers than larger businesses (almost a 40% fall for SMEs between 2015/16 and 2017/18, compared to a 10% fall for large enterprises). The relatively poor outcomes for disadvantaged learners, however, occur in enterprises of all sizes.
More than 80% of apprenticeships undertaken by disadvantaged learners took place in enterprises in the services, health, education or public administration sectors of the economy. This has not changed since the introduction of the levy.
There is a gap in the chance of undertaking a levy-supported apprenticeship depending on socio-economic background. This is particularly the case at higher levels (a 7 percentage points gap between disadvantaged women compared to non-disadvantaged women and a 4 percentage points gap for men).
London, east England and south-east England were the regions with the largest disadvantage gaps (more than 10 percentage points for the latter two). These areas have more levy-paying enterprises offering higher-level apprenticeships, which generally see fewer disadvantaged apprentices.
6.2 Size of the enterprise
In 2017/18, 55% of new apprenticeship starters from disadvantaged socio-economic backgrounds were employed in a large enterprise.[footnote 33] Compared with the period before the levy, this represents a change in the composition of employers from small and medium-sized enterprises (SMEs) to large enterprises. This occurred because the fall in apprenticeship starts has been more severe in SMEs than at large enterprises.
Figure 11 presents the number and composition of apprenticeship starts by enterprise size and disadvantage status for the period 2015/16 to 2017/18. The change in firm composition has been broadly the same for both disadvantaged and non-disadvantaged learners.
Figure 11: Apprenticeship starters by enterprise size and disadvantaged status (2015/16 to 2017/18)
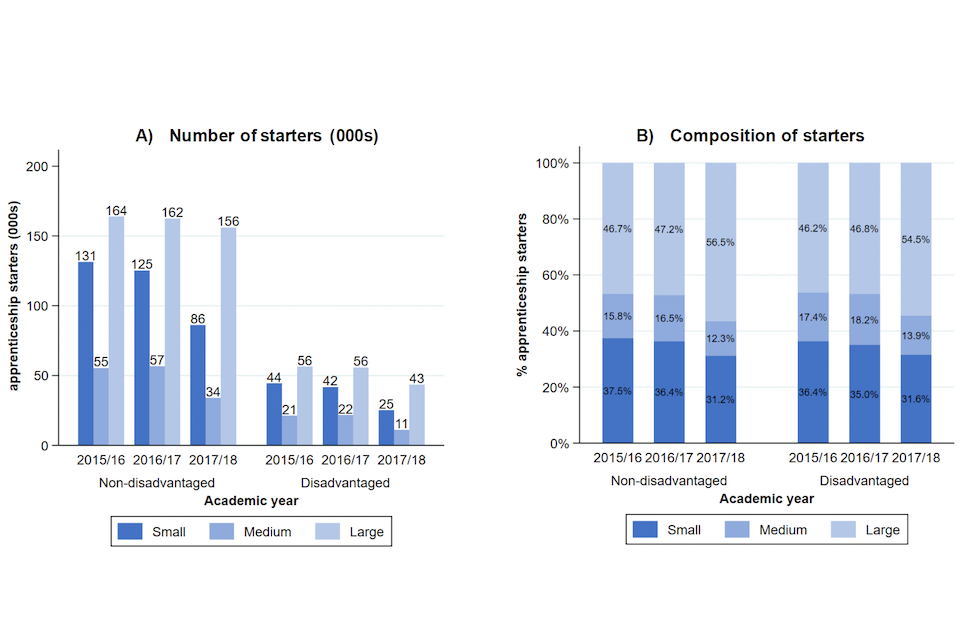
Note: Information on the employer is not available for around 7% of starters in 2015/16, 6% in 2016/17 and 5% in 2017/18. Source: London Economics’ analysis of ILR (2015/16 to 2017/18), IDBR (Sept. 2016–2018) and IMD (2010) data.
There is a link between apprenticeship level and the proportion of starters working in large enterprises (Figure 12, panel A). Apprentices at higher levels are more likely to be employed in large enterprises. In 2017/18, almost 7 in 10 disadvantaged starters undertaking a higher- level apprenticeship were employed in a large enterprise. This compares to just over half of starters at advanced and intermediate level.
This is because larger enterprises are generally more likely to operate in the services sector or the health, education and public administration sector. They are also more likely to offer higher- level apprenticeships than enterprises in the manufacturing and construction sector.
When we look at the size of employer (Figure 12 panel B), the fall in apprenticeship starts at SMEs impacted learners from disadvantaged backgrounds more severely than non- disadvantaged learners.
Our research shows that in SMEs:
- starts by apprentices from disadvantaged backgrounds declined by up to 10 percentage points more than for those from non-disadvantaged neighbourhoods at both intermediate and advanced level
- the gap for higher-level apprenticeships was up to 23 percentage points. The number of non-disadvantaged starters undertaking higher-level apprenticeships increased; compared with a decline for disadvantaged learners
In large enterprises, there has been an increase in the number of higher-level apprenticeship starters since the levy’s introduction for both non-disadvantaged and disadvantaged learners. However, the increase was twice as large for non-disadvantaged learners as for disadvantaged learners.
Overall, the post-levy fall in apprenticeship starts has impacted disadvantaged learners more severely than non-disadvantaged learners. This outcome, however, was not just because of some types of employers changing their behaviour. Instead, the causes were much more widespread.
Figure 12: Apprenticeship starters by enterprise size, level and disadvantaged status (2017/18) and 2015/16 to 2017/18 change
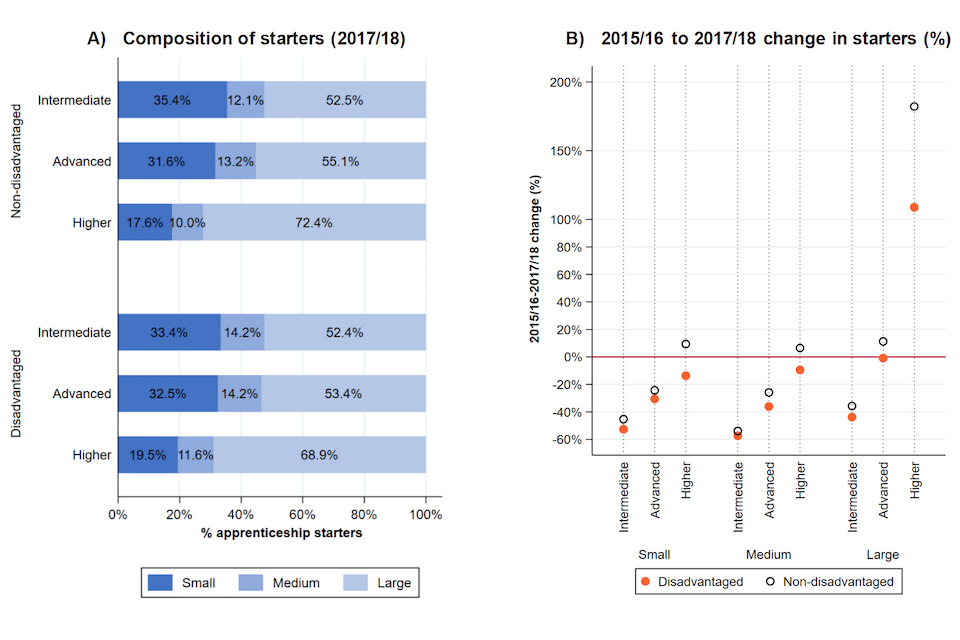
Note: Information on the employer is not available for around 7% of starters in 2015/16, 6% in 2016/17 and 5% in 2017/18. Source: London Economics’ analysis of ILR (2017/18), IDBR (Sept. 2016 to 2018) and IMD (2010) data.
6.3 Industry of the enterprise
More than 4 in 5 apprenticeships started by individuals from disadvantaged socio- economic backgrounds were in the services industries or the fields of health, education and public administration in 2017/18 – 41% and 44% respectively.
Most of the remaining starts took place in the manufacturing and construction sector. The industry composition of starts has not changed markedly over time (Figure 13).
Figure 13: Apprenticeship starters by industry and disadvantaged status (2015/16 to 2017/18)
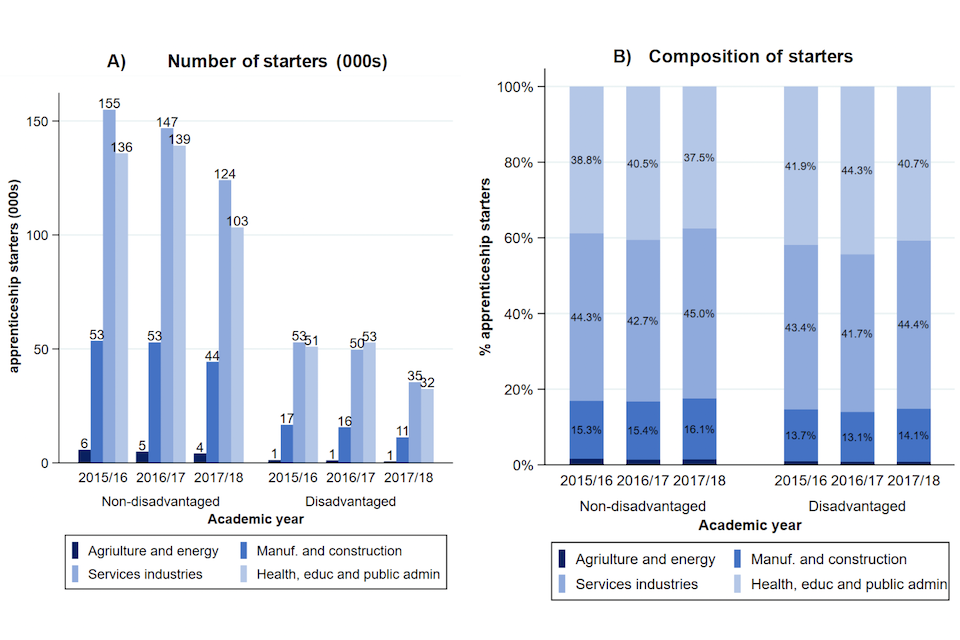
Note: ‘Agriculture and energy’ includes SIC sections A, B, D and E; ‘Manufacturing and construction’ includes SIC sections C and F; ‘Services industries’ includes SIC sections G, H, I, J, K, L, M, N, R, S, T and U; ‘Health, education and public administration’ includes SIC section O, P and Q. Information on the employer is not available for around 7% in 2015/16, 6% in 2016/17 and 5% in 2017/18. Source: London Economics’ analysis of ILR (2015/16 to 2017/18), IDBR (Sept. 2016 –2018) and IMD (2010) data.
Conversely, there was a gender split in the industries in which men and women started their apprenticeships. A large proportion of male learners started apprenticeships in the manufacturing and construction sector; female starters more commonly undertook apprenticeships in the health, education and public administration sector.
There was also some evidence of differences between learners from disadvantaged and non- disadvantaged backgrounds (Figure 14):
- disadvantaged men were relatively under-represented in health, education and public administration (19.8% versus 23.8%) and over-represented in services industries (52.9% versus 47.7%)
- disadvantaged women were under-represented in services industries (37.3% versus 42.0%) and over-represented in health, education and public administration (58.2% versus 52.5%)
Figure 14: Apprenticeship starters by industry, disadvantaged status and gender (2017/18)
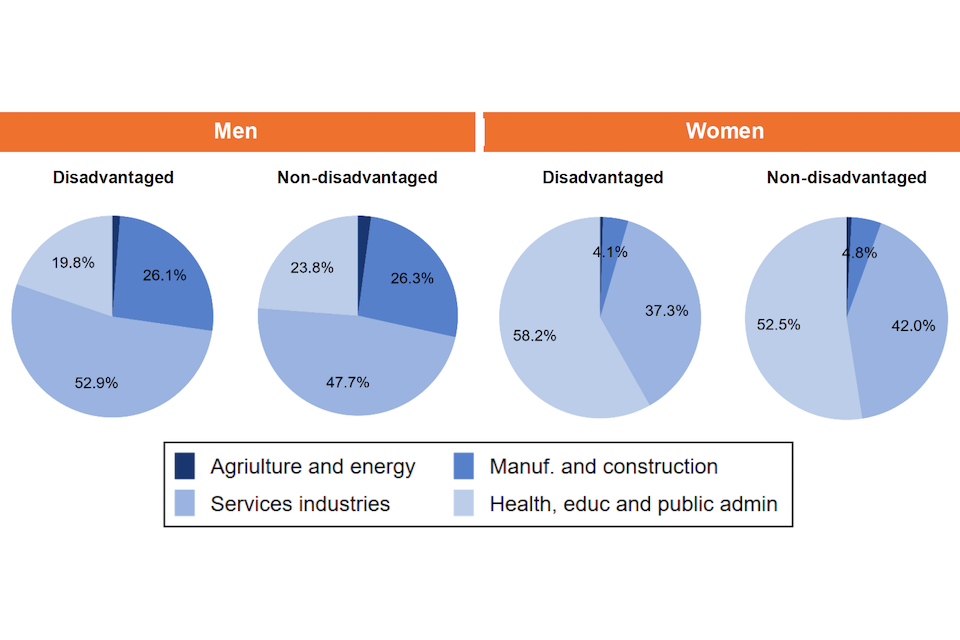
Note: ‘Agriculture and energy’ includes SIC sections A, B, D and E; ‘Manufacturing and construction’ includes SIC sections C and F; ‘Services industries’ includes SIC sections G, H, I, J, K, L, M, N, R, S, T and U; ‘Health, education and public administration’ includes SIC section O, P and Q. Information on the employer is not available for around 7% in 2015/16, 6% in 2016/17 and 5% in 2017/18. Source: London Economics’ analysis of ILR (2017/18), IDBR (Sept. 2018) and IMD (2010) data.
6.4 Levy support
The apprenticeship levy radically changed the funding rules for new apprenticeship starts.[footnote 34] Our research assesses the impact of the levy on disadvantaged learners by looking at the proportion of new starts that were directly supported by the levy, compared with non-disadvantaged learners.
Which types of apprentices started levy-supported apprenticeships in 2017/18?
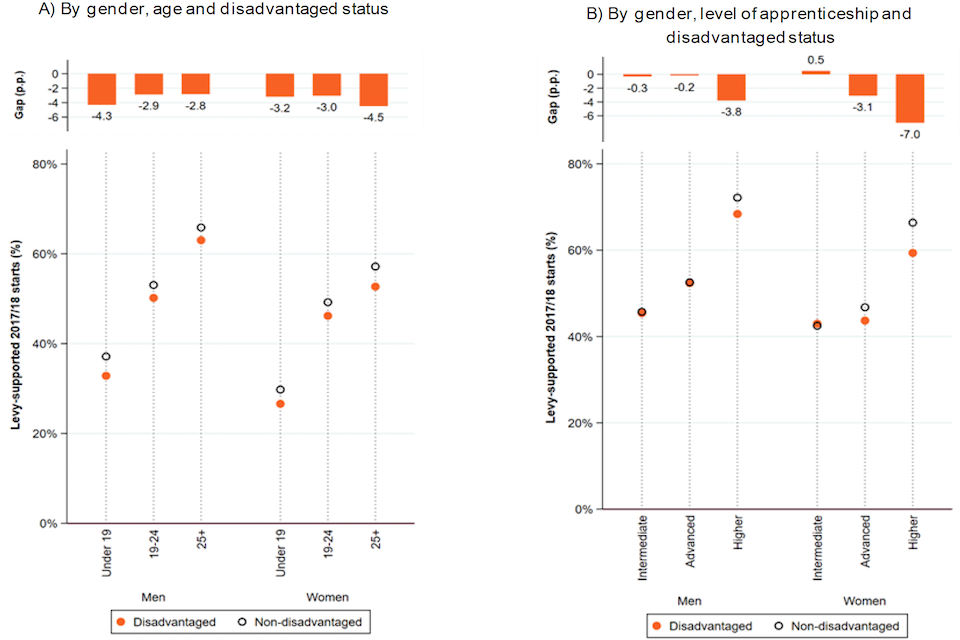
Levy support most commonly occurs at higher levels. Disadvantaged starters at the higher level were, however, less often levy-supported than non-disadvantaged starters. Our analysis in Figure 15 (panel A), showing where levy support occurs, demonstrates that:
- disadvantaged apprentices are less likely to be levy-supported; there is a 3 to 5 percentage point gap in the proportion of levy-supported starts by disadvantaged status
- the gap exists for all age groups and both genders; within the same age and gender group, a smaller proportion of starters from disadvantaged neighbourhoods were levy-supported than non-disadvantaged starters
- the gap was most severe for men under 19 (4.3 percentage points) and women 25 and older (4.5 percentage points). The disadvantage gap is driven by all starters at higher level and for women undertaking advanced apprenticeships
- the apprenticeships that are most commonly levy-supported are also the apprenticeships where the disadvantage gap is greatest (Figure 15, panel B)
As such, the analysis does not consider that different levy-supported apprenticeships may receive different amounts of levy funding. A summary of the new funding rules introduced by the apprenticeship levy is provided in the technical report accompanying this study.
Figure 15: Proportion of levy-supported apprenticeship starts by demographic and apprenticeship characteristics (2017/18)
Source: London Economics’ analysis of ILR (2017/18) and IMD (2010) data.
This suggests that the levy has favoured non-disadvantaged learners over disadvantaged learners. Our research in the accompanying technical report to this study identifies whether the disadvantage gap was more severe in certain regions than others. We found that London and south-east England were the regions experiencing the largest gaps. This is linked to the wider economic characteristics in these regions and the prevalence of large levy-paying enterprises training at higher levels.
Which types of employers had levy-supported starters in 2017/18?
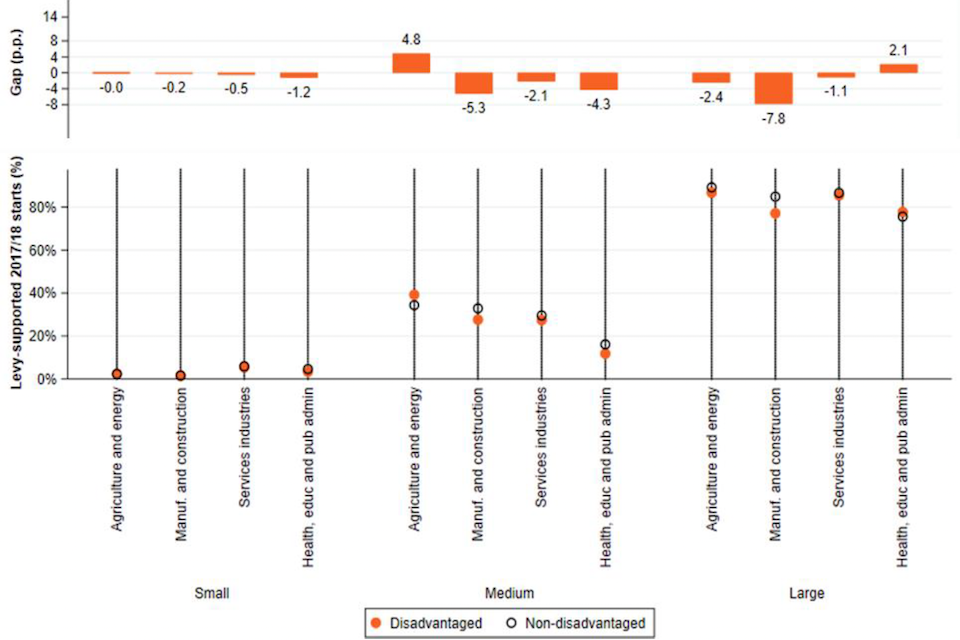
We investigated whether the incidence of levy support for the group of disadvantaged and non- disadvantaged apprentices varies by the size of employer (Figure 16). Very few SMEs offer levy-funded apprenticeships.[footnote 35] The proportion of levy-supported starters was marginally lower for disadvantaged starters than for non-disadvantaged starters.
We identified a disadvantage gap for starters in the manufacturing and construction sector in large enterprises, although this accounted for few apprenticeship starts. However, we also found that disadvantaged learners are more likely to be levy-supported than their better-off peers in large enterprises in the health, education and public administration sectors. This suggests that these areas may have different recruiting practices, which should be investigated in further research.
The disadvantage gap in levy support among disadvantaged and non-disadvantaged starts in 2017/18 does not seem to be driven by employers in a specific sector or size group.
Figure 16: Proportion of levy-supported apprenticeship starts by industry
Source: London Economics’ analysis of ILR (2017/18) and IMD (2010) data.
Case study: Hannah Minikin, Newcastle
A move across the border from Hawick, in Scotland, to Newcastle has been a career-defining decision for Hannah Minikin.
Hannah, 23, is a Design Engineer with TSG Marine, based in Hebburn in the north-east, and completing her degree-level apprenticeship in Mechanical Manufacturing and Engineering.
“It’s brilliant. I love my job, especially using computers to design things. It’s exactly what I wanted. I’m definitely doing the things I enjoy,” she said.
While Hannah is sure she’s in the right place now, her path wasn’t straightforward. She completed her Highers and Advanced Highers at home in Hawick, but turned down an offer to study Film at university.
Already working at Morrisons before she left school at 17, she stayed on, unsure of the future.
“There was pressure to go to university from school, but we didn’t have any help or guidance. We had to find what we wanted to do ourselves,” she said.
“I didn’t really see a career path for myself in Hawick – it’s 1.5 hours to the nearest city – so the day after I passed my driving test, I drove down to Newcastle to live with my dad.”
An initial transfer with Morrisons was followed by bar work for a couple of years. After that, she decided to get back into education and start a Mechanical Manufacturing degree with Northumberland College.
After being encouraged by her teacher, she applied for the apprenticeship role with TSG Marine, which she started in January 2019. The company funds her degree, and pays her the National Living Wage (£7.70/hr) after Hannah told them she couldn’t afford the National Apprenticeship Wage (£3.90/hr).
“They understood and they were really good about it,” she said.
She’s since switched to studying at Newcastle College and attends classes once a week.
“Once I’ve completed my degree, TSG has said we’ll talk about the future. I’m committed to them, not because they put me through my degree, but because I genuinely love working there. My goal is to be a qualified engineer and designer. One day, I’d like my own apprentice.”
7. What type of training do disadvantaged learners receive?
Previous research indicates that apprentices do not receive either the required quantity or sufficient quality of training.[footnote 36],[footnote 37] In this section, we investigate the quality of apprenticeship provision for disadvantaged learners.
7.1 Key findings
Disadvantaged learners have shorter planned apprenticeships, on average, than their non-disadvantaged peers. This is true even at advanced and higher levels in higher- earning subject areas such as engineering, construction or ICT (where the gap can be up to 3 months).
Apprenticeship reforms have not closed the gap in the quality of apprenticeship training between disadvantaged and non-disadvantaged learners. This training gap entrenches disadvantage throughout the entire learning journey.
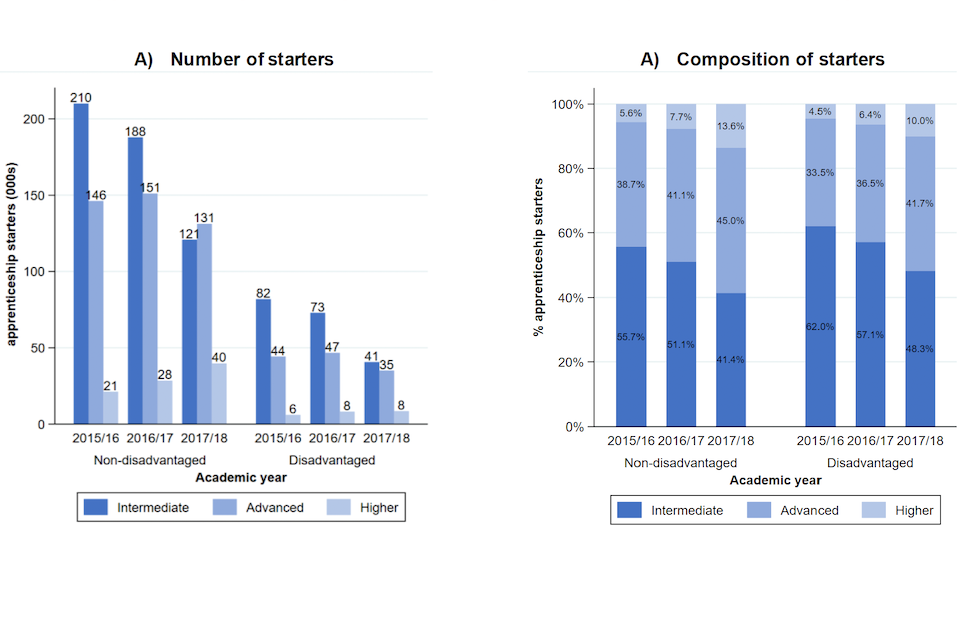
Disadvantaged learners are clustered in lower-level apprenticeships: 48% of starts by individuals from disadvantaged backgrounds in 2017/18 were at intermediate level, compared with 41% for non-disadvantaged learners. This is despite the apprenticeship levy increasing the proportion of advanced and higher-level apprenticeships.
Disadvantaged learners often undertake apprenticeships in low-paying subject areas, such as the health sector, rather than in business, law or engineering. This is especially the case at advanced and higher levels (42% of starts at higher level among disadvantaged women are in health-related subjects, compared to 31% for non- disadvantaged learners).
7.2 Level of apprenticeship starts
Apprenticeships vary in terms of the level of training offered and the prospects for progression.[footnote 38],[footnote 39]
Disadvantaged learners are generally clustered in low- level apprenticeships. Almost half of starts by individuals from disadvantaged backgrounds were at intermediate level in 2017/18, compared with 41.4% of those by individuals from non-disadvantaged backgrounds (Figure 17).
There was a smaller share of starters among disadvantaged learners at advanced level (41.7% versus 45.0%) and higher level (10.0% versus 13.6%). While not directly observable in the available data, this may be due to entry requirements or local labour demand.
Figure 17: Apprenticeship level by disadvantaged status (2015/16 to 2017/18)
Source: London Economics’ analysis of ILR (2015/16 to 2017/18) and IMD (2010) data.
The proportion of starts at intermediate level declined over time for both disadvantaged and non-disadvantaged learners. This decline accelerated after the introduction of the levy. There was a 5 percentage points decrease in the proportion of starts at intermediate level between 2015/16 and 2016/17, compared with a 9-10 percentage point decline between 2016/17 and 2017/18 – irrespective of socio-economic background.
This was partially as a result of the change in the profile of employers from SMEs, which are more likely to train at intermediate level, towards larger employers, which are more likely to train at advanced and higher levels.
Disadvantaged apprentices shifted towards advanced apprenticeships. In contrast, among non- disadvantaged apprentices there has been a move towards higher-level apprenticeships. This suggests that higher-level apprenticeships are less accessible for disadvantaged learners than for non-disadvantaged. This is also likely to be linked to prior attainment, labour demand, employers’ recruitment and training practices, and access to apprenticeships in disadvantaged areas.
7.3 Subject area of study
Within each apprenticeship level there are substantial differences in the training received, depending on the subject area of study, in terms of average:
- planned duration of apprenticeship training[footnote 40]
- average annual earnings accrued during training[footnote 41]
- average post-completion annual and daily earnings, as well as earnings differentials[footnote 42]
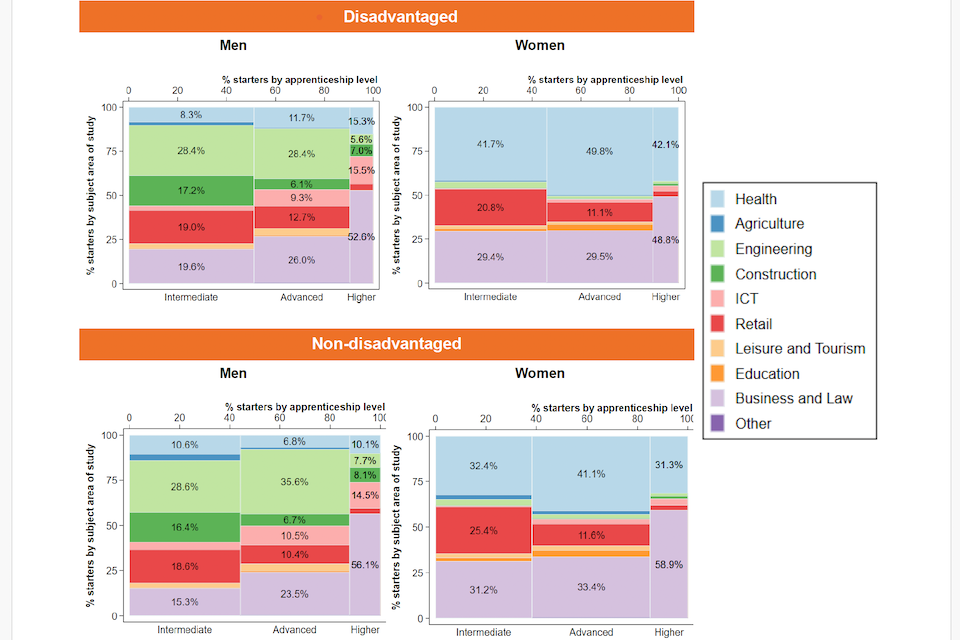
Apprenticeships in the fields of construction, engineering, ICT, and business and law are typically associated with longer planned duration, above-average apprenticeship wages and post-completion earnings. Given these differences, we investigated how the subject mix of starts differs by gender, disadvantaged status and apprenticeship level (Figure 18).
There was a clear gender split in the subject area of study. Male apprentices are more likely to cluster in higher-paying sectors such as engineering and construction, while female learners are more likely to start apprenticeships in the health and retail sectors. This gender variation mirrors the gender split that exists more broadly in employment in different industrial sectors (Figure 13).
There is also evidence that disadvantaged learners are clustered in low-paying subject areas, particularly at advanced and higher levels. For men, only 28.4% and 5.6% of starts at advanced and higher level in engineering were by learners from disadvantaged areas, compared with 35.6% and 7.7% by learners from non-disadvantaged areas.
For women, more disadvantaged learners undertook health-related apprenticeships rather than apprenticeships in business and law, compared with non-disadvantaged learners.
Figure 18: Subject composition of 2017/18 starts by disadvantaged status, gender and level
Source: London Economics’ analysis of ILR (2017/18) and IMD (2010) data.
Disadvantaged learners tend to undertake apprenticeships at lower levels than non- disadvantaged learners, but are also more likely to cluster in subject areas associated with poorer labour market outcomes.[footnote 43]
The Commission will publish research looking at why disadvantaged apprentices choose courses with lower labour market returns, controlling for prior attainment.
7.4 Planned training duration at the start of the apprenticeship
The planned duration of the apprenticeship at the start of the training depends largely on the level and the subject area of the apprenticeship. Advanced and higher apprenticeships typically have a longer duration than apprenticeships at intermediate level and, within each level, apprenticeships in the field of engineering, construction, ICT, and business and law take the longest.[footnote 44]
The planned duration of training taken by disadvantaged apprentices is typically shorter than that of training taken by non-disadvantaged learners: 17.9 months for disadvantaged starters compared with 19.7 months for non-disadvantaged starters in 2017/18. This is because disadvantaged apprentices are typically clustered in low-level programmes and do not undertake apprenticeships in engineering, construction, ICT, and business and law as often as their non-disadvantaged peers.
It seems reasonable to expect that once apprenticeship characteristics, such as level and subject area, are taken into account, the average planned duration of apprenticeships should not differ. This is the case for most subject areas (Figure 19).
However, there is a gap in planned training duration for apprenticeships in the high-earnings subject areas – engineering and construction (at higher level) and ICT (at advanced and higher levels). The planned apprenticeship duration of disadvantaged starters in these specific subject areas was shorter than that of non-disadvantaged learners by 1.5-3 months in 2017/18. This is significant as it indicates that disadvantaged apprentices in these fields are receiving less training, which could make those apprenticeships lower in quality.
Figure 19: Average planned duration (and disadvantage gap) of 2017/18 starters by disadvantaged status, level and subject area of study
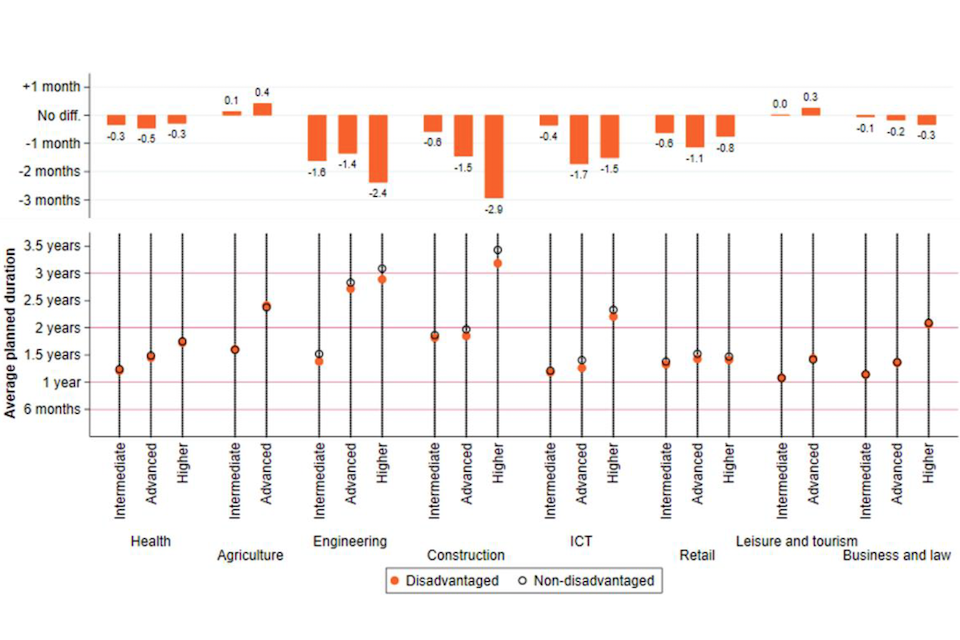
Note: Figures reported for groups of at least 50 learners. Source: London Economics’ analysis of ILR (2017/18) and IMD (2010) data.
To summarise, our analysis indicates that, in terms of quality of the training received, disadvantaged learners:
- typically undertake apprenticeship programmes at lower levels
- appear to be clustered in low-paying subject areas, especially at higher levels and among women
- have shorter planned duration, on average, when undertaking apprenticeships at the same level in higher-earning subject areas such as engineering, construction and ICT
Case study: Courtney Slater, Torquay
Courtney lives in Devon with her dad, who works as a maintenance man, and her mum, who works in WHSmith at the local hospital.
After completing her GCSEs, Courtney did a Level 2 Engineering course at South Devon College and is now in the first year of a f our-year apprenticeship with Effect Photonics, a local electronic engineering company.
She will qualify with a Level 3 NVQ in Electrical Engineering.
“I’ve always been better at hands-on subjects,” says Courtney, “And I love robotics. I knew that I wanted to work in engineering, and did work experience at Effect Photonics after my GCSEs. They didn’t just stick me in the office – I got to work on the production line, too.”
Courtney liked working and saving, and didn’t really want to go to university. She applied to a few apprenticeships but never heard back from them.
“Then my boss at Effect Photonics suggested that I do the apprenticeship with them,” she says, “I said yes, and now work 4 days a week on £5.50 an hour, and go to college one day a week.”
Courtney understands how valuable that experience was. She knows other people who did a Level 3 NVQ without an apprenticeship who are now finding it hard to get work.
“Some might think that I’m missing out by not going to university,” she says, “because of the fun and the partying. But that’s not the case – I have freedom, and I still have my weekends and holidays. It doesn’t affect my friendships with my friends that have gone to university, or change the way that they look at me.
“I am lucky that my college talked about apprenticeships from the very beginning, and value them just as much as academic qualifications. Not all students are so lucky. I’m part of the Young Apprenticeship Ambassador Network, and give talks at careers fairs.
“Some of the schools we visit ask us to only talk about apprenticeships for after A Levels. But they could be a better option for some people, without the pressure and cost of other paths. We need to overcome the stigma of apprenticeships. They can be a great thing for some people.”
Case study: Alexandra Bick, London
Alexandra has always loved languages, and studied Spanish and Mandarin as part of her international baccalaureate at her local academy school. Her mum raised her as a single-parent and, every year, they went to Turkey on holiday. Excited at the prospect of a year abroad in her favourite country, Alexandra chose to study Turkish at SOAS.
“It wasn’t for me,” she says. “Many of the students cared more about politics than their studies, and I didn’t think it was worth the money and the debt. My mum and I agreed that I would finish my first year, and she half-jokingly suggested that I look at Civil Service apprenticeships for school leavers. That’s when I first heard about degree apprenticeships.”
Alexandra applied for a CyberFirst Degree Apprenticeship in May 2015, and started it in September 2016. Over the following 2 years, she gained a Foundation Degree in Cyber Security, a City and Guilds Level 4 Diploma for ICT Professionals, and plenty of experience. All whilst earning a salary of £17,500. She is now working in a permanent role.
“Apprentices are at no disadvantage to graduates,” she says. “The job market requires everyone to have experience, and apprenticeships give you that. Once you’ve got your foot in the door, the world is your oyster – I’m now working in a department that I trained in.”
Alexandra believes that we need to overcome the stigma of apprenticeships.
“People think that certain opportunities are unavailable to them because of their socio- economic background. Apprenticeships can help overcome that barrier. I had no technical background in cyber-security, but the apprenticeship gave me the training and experience that I needed.”
“At school, it was implied that our future choices were university or nothing - there’s a stereotype that only people without ambition do apprenticeships. But I’ve found the opposite to be true.”
8. How likely are disadvantaged learners to complete their apprenticeship?
Research shows that a consistent proportion of learners do not successfully complete their apprenticeships. More than 30% of apprenticeships at intermediate and advanced levels are not achieved within 3 years from the start of the apprenticeship.[footnote 45] As indicated in the Learners and Apprentices Survey 2018, the main reasons for not completing the training are:[footnote 46],[footnote 47]
- issues relating to the apprenticeship[footnote 48] (29% of surveyed non-completers)
- domestic, financial and logistical problems (28% of non-completers)
- move to employment or other forms of training (14% of non-completers)
This chapter tackles the non-achievement issue. We investigate whether the likelihood of successfully achieving the apprenticeship depends on the background of the learner.
To allow for sufficient training time, we restrict the analysis to starters in the academic years 2013/14 and 2014/15. More information on the sample used for this analysis is provided in the technical report.
8.1 Key findings
Apprentices from disadvantaged backgrounds are less likely to successfully achieve the qualification than non-disadvantaged learners within 3 years. The non- completion gap is larger for apprenticeships at intermediate level (3-4 percentage points) than at advanced level (1-2 percentage points), but disappears for higher-level apprenticeships. This suggests that disadvantaged apprentices at lower levels may need more support or face specific barriers that are not being addressed either in policy or by employers.
Disadvantaged apprentices at higher level who successfully achieved the qualification typically had a shorter training duration than non-disadvantaged learners at the same level.
8.2 How many apprenticeships are successfully achieved?
A smaller proportion of disadvantaged learners achieve the qualification within 3 years from the start of the programme, compared with non-disadvantaged learners. This is true at all levels and for both men and women.
More specifically, Table 1 shows achievement rates for disadvantaged apprentices, in comparison with non-disadvantaged apprentices, are:
Men:
- 4.0 percentage points lower at intermediate level (63.1% versus 67.1%)
- 1.3 percentage points lower at advanced level (58.3% versus 59.7%)
- 4.1 percentage points lower at higher level (47.6% versus 51.6%)
Women:
- 3.7 percentage points lower at intermediate level (63.1% versus 66.8%)
- 3.1 percentage points lower at advanced level (63.4% versus 66.5%)
- 2.9 percentage points lower at higher level (51.8% versus 54.2%)
Achievement rates decline as the level of the apprenticeship increases. This is to be expected, considering that higher-level apprenticeships are typically longer and therefore less likely to have been completed within 3 years.
Women appear to have higher achievement rates than men at advanced and higher levels. Not only are women more likely to start an apprenticeship than men, but they are also more likely to successfully achieve it. However, women have been more severely affected than men by the fall in apprenticeship starts following the introduction of the levy.
Table 1: Achievement rates at 36 months by apprenticeship level, gender and disadvantaged status
| Men: Disadvantaged | Men: Non- Disadvantaged | Men: Difference | Women: Disadvantaged | Women: Non- Disadvantaged | Women: Difference | |
| Intermediate | 63.1% | 67.1% | −4.0 percentage points | 63.1% | 66.8% | −3.7 percentage points |
| Advanced | 58.3% | 59.7% | −1.3 percentage points | 63.4% | 66.5% | −3.1 percentage points |
| Higher | 47.6% | 51.6% | −4.1 percentage points | 51.8% | 54.2% | −2.9 percentage points |
Note: Achievement rates for completion within 36 months. Pooled over academic years 2013/14 and 2014/15. Source: London Economics’ analysis of ILR (2013/14 and 2017/18) and IMD (2010) data.
The group of disadvantaged and non-disadvantaged learners may differ in terms of characteristics such as subject area of study, age at start of the programme or type of employer. The results presented so far do not take this into account, so the differences in achievement rates presented in Table 1 may depend on characteristics other than the socio-economic background of the apprentice. For instance, it could be the case that disadvantaged learners tend to take more challenging apprenticeships, and that this is driving the difference in achievement rates.
To strip out the effects of factors other than the socio-economic background of the learner on the likelihood of successfully achieving the apprenticeship, we supplemented the previous analysis with econometric regression techniques.[footnote 49] The results of this analysis are presented in Table 2. The figures should be interpreted as the percentage point difference in the probability of achieving an apprenticeship as a result of being from a disadvantaged background. For instance, a disadvantaged man undertaking an intermediate apprenticeship is 3.6 percentage points less likely to achieve this qualification than a ‘similar’ learner from a non-disadvantaged background.
Overall, the econometric analysis confirms what we observed in the descriptive statistics for apprenticeships at intermediate and advanced levels. Coming from a disadvantaged socio- economic background lowers the probability of achieving the apprenticeship.
For higher-level apprenticeships, our analysis indicates the gap observed is not driven by the socio-economic background of the learner, but rather by differences in the characteristics of the programme, or other learner characteristics.
Table 2: Estimates of the disadvantage gap in the likelihood of achieving the apprenticeship within 36 months from the start of the programme (marginal effects), aggregate and by level
| All levels | Intermediate | Advanced | Higher | |
| Men | −0.029 *** | −0.036 *** | −0.018 *** | −0.024 |
| Observations | 329,758 | 212,551 | 109,542 | 7,648 |
| Women | −0.030 *** | −0.033 *** | −0.026 *** | −0.011 |
| Observations | 370,254 | 220,064 | 135,810 | 14,374 |
Note: Achievement rates for completion within 36 months. Pooled over academic years 2013/14 and 2014/15. * indicates the estimate is statistically significant at 10%, ** at 5% and *** at 1% confidence level. Source: London Economics’ analysis of ILR (2013/14 and 2017/18) and IMD (2010) data.
8.3 How long do learners train for before achieving the apprenticeship?
Learners may achieve the apprenticeship before or after its original planned end date, so that the actual length of the training does not always match what was initially planned. Figure 20 presents information on the actual length of training period for apprentices who started the programme in the academic year 2013/14 or 2014/15 and achieved their qualification within 3 years of the start of the programme.[footnote 50]
Figure 20: Average actual apprenticeship duration by gender, level and socio-economic background (months)
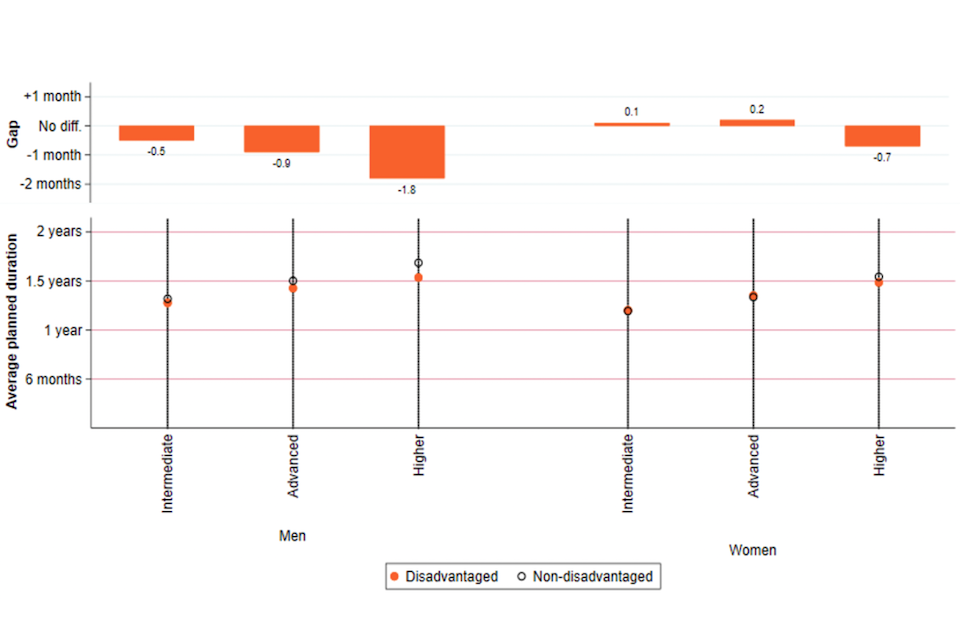
Note: Duration rates (months) for aims completed and achieved within 36 months. Actual duration is calculated as the difference between end date and start date and has been adjusted to account for apprentices who temporarily withdrew, by deducting any time during which an apprentice had a spell of absence from the apprenticeship. Pooled over academic years 2013/14 and 2014/15. Source: London Economics’ analysis of ILR (2013/14 and 2017/18) and IMD (2010) data.
We observe that:
- men typically train for longer than women – women are less likely to undertake longer- duration apprenticeships in subjects such as engineering and construction (Figure 18)
- apprenticeships at higher level require a longer training period than those at lower levels; this is consistent with information on the planned duration presented in Figure 19
- higher-level apprentices from disadvantaged backgrounds who successfully achieved their apprenticeship typically had a shorter training duration than non-disadvantaged learners at the same level
- the gap in actual training duration was approximately 8%, or 2 months, less than their non- disadvantaged peers at the same level. Among women, the gap in actual training duration was 3%, or one month
Disadvantaged apprentices have not only seen a decline in numbers, relative to non- disadvantaged apprentices, but also receive less training, at least at higher level. The evidence continues to suggest that the apprenticeship system supports those from non-disadvantaged backgrounds more than those from disadvantaged backgrounds. This should be a wake-up call to government and those who assume the current apprenticeship system is working for social mobility.
Case study: Gary Mosely, South Shields
Becoming an apprentice in his mid-20s gave Gary Moseley a path out of temporary employment and into a career as an electrician.
It has not been an easy road for Gary, 26, who had his first apprenticeship experience cut short due to a debilitating back injury.
After GCSEs, he enrolled in an engineering course at South Tyneside College, but left within 2 months to head back to his school sixth form to do AS levels. Soon after, his mum spotted a job advert in the local paper.
“She found this apprenticeship in electrical engineering and the careers advisor at school helped me write the application,” he said. Gary got the job, completed his Level 3 qualification and was a year into his HNC with the same company when his back injury happened.
“I had a lot of time-off waiting for surgery and in the end they let me go,” he said.
“I had the operation and recovery period and I tried to get another job but I’d had that much time off that I didn’t feel confident. I ended up with an agency doing mostly low-skilled work.”
But Gary was determined.
“I kept looking for jobs and saw that South Tyneside Homes wanted an electrical apprentice. Often there’s an upper age limit, but not this time, so I went for it,” he said.
He started his 4-year apprenticeship in September 2019 and is really enjoying his new role.
“I love it. South Tyneside Homes have been absolutely brilliant with me, I can’t fault them,” he said.
In his final year, Gary will take his EM2 test after which he’ll be a qualified electrician.
“More people should definitely be doing apprenticeships, but maybe not straight from school, I think it’s valuable to have a bit of life experience first,” he said.
“I feel completely different about this apprenticeship compared to my first one. I didn’t appreciate what I was doing. I look at the younger teenage apprentices and think they don’t realise how lucky they are. You don’t understand what a great opportunity it is.”
Case study: Josiah Daley, Newton Aycliffe
A switch from engineering to customer services has helped Josiah Daley find the job he loves and the confidence he lacked.
Josiah, 19, from Halifax, now has a Level 2 apprenticeship as a customer services practitioner under his belt and is due to start a Level 3 course in the near future.
He said: “After I finished my GCSEs at school, I didn’t really know what I wanted to do, but I fancied something in engineering.
“I got a place at the South Durham UTC College in Newton Aycliffe and moved up there to stay with my aunt and uncle, but after a while I realised it was not for me and I wanted to earn and learn at the same time.”
Josiah stayed in Newton Aycliffe and started an apprenticeship with Glen Office Supplies in September 2018, with training and support from ITEC North East, passing his Level 2 qualifications with distinctions.
“He added: “The main thing my apprenticeship has given me is more confidence, not just in my job but in life in general. At work I answer telephone enquiries from customers and place orders and I am much more confident now. Being able to learn new skills while being paid to do a job has been a massive advantage for me.
“Apprenticeships are great, especially if you don’t know exactly what you want to do as a career. If someone definitely knows they want to be an electrician or a plumber or whatever, they know they will have 4 years of study, but you don’t have to do long courses for other jobs. And, like me, you can change direction if you find it’s not what you want to do straight away.”
Josiah’s best advice for anyone considering an apprenticeship is to persevere.
He said: “It can take a lot of applications before you get accepted into an apprenticeship and it’s easy to get disheartened and give up. You have to be determined and keep at it. If you do, it is well worth it in the end.”
9. How likely are disadvantaged apprentices to progress to further and higher education?
Apprenticeships can operate as a stepping-stone towards higher levels of qualification attainment. We used the Longitudinal Educational Outcomes (LEO) dataset to explore the educational trajectories of apprentices from disadvantaged backgrounds into further and higher education. In this chapter, our research addresses the following questions:
- How do progression rates from apprenticeships into further and higher education vary by socio-economic background of the learner?
- What is the highest level of qualification achieved by apprentices who do progress, and how does this vary by socio-economic background?[footnote 51]
The analysis was undertaken for individuals completing the apprenticeship programme by the age of 21 and for intermediate and advanced apprenticeships separately.[footnote 52],[footnote 53],[footnote 54],[footnote 55] Because LEO data is only available up to the academic year 2016/17, we are able to follow education trajectories only up to the age of 28 to 30, depending on the cohort.
9.1 Key findings
For young disadvantaged learners, apprenticeships less often act as a stepping stone towards educational attainment at higher level. Young disadvantaged learners were up to 4 percentage points less likely to progress to qualifications at higher levels, compared with non-disadvantaged learners.
Most intermediate apprentices (more than 70% of men and approximately 58% of women) who did progress went on to achieve an advanced apprenticeship as their highest qualification by the age of 28 or 30. This is independent of both gender and socio-economic background.
9.2 What are the progression rates from intermediate apprenticeships to higher- level qualifications?
Young disadvantaged learners completing an intermediate apprenticeship by the age of 21 are less likely to achieve qualifications at higher levels than learners from non-disadvantaged backgrounds. A total of 32.7% of disadvantaged men with an intermediate apprenticeship achieved at higher levels – compared with 39.7% for non-disadvantaged (Table 3).
For women, the progression rates were 38.7% for disadvantaged and 41.6% for non- disadvantaged learners. For young disadvantaged learners, apprenticeships less often act as a stepping stone towards educational attainment at higher level. For these learners from disadvantaged backgrounds, intermediate apprenticeships more commonly represent a means to enter the world of work.
A larger proportion of women went on to achieve at a higher qualification level, compared with men. This was true for both disadvantaged learners and those from non-disadvantaged backgrounds.
We also looked at the highest qualification achieved by 2016/17 for those learners who achieved at higher levels of education and training after completing an intermediate apprenticeship (Table 3) to understand whether there was a difference in the specific progression routes by disadvantaged status.
Table 3: Progression rates of English learners who undertook an intermediate apprenticeship by the age of 21 (%)
| Men: Disadvantaged | Men: Non- disadvantaged | Women: Disadvantaged | Women: Non- disadvantaged | |
| Any qualification | 32.7% | 39.7% | 38.7% | 41.6% |
| Highest qualification achieved by 2016/17 by those who progressed and achieved at higher levels: | Men: Disadvantaged | Men: Non- disadvantaged | Women: Disadvantaged | Women: Non- disadvantaged |
| Any academic L3 | 1.5% | 1.3% | 3.6% | 3.6% |
| Any vocational L3 | 15.0% | 12.8% | 21.4% | 19.7% |
| Advanced apprenticeship | 71.3% | 74.1% | 57.6% | 58.9% |
| Any vocational L4 | 4.3% | 4.3% | 3.6% | 4.8% |
| First degree or equivalent higher education qualification | 7.3% | 6.8% | 12.4% | 12.3% |
| Postgraduate education | 0.9% | 0.8% | 1.3% | 1.2% |
Note: Figures show the percentage of English learners (from the 2001/02 to 2003/04 cohorts) who completed an intermediate apprenticeship by the age of 21 who went on to complete a higher-level qualification by the end of 2016/17. Figures display only the highest level achieved by 2016/17, not all intermediate steps. ‘Any academic L3’ includes one or more A-levels. ‘Any vocational L3’ includes BTEC at Level 3, NVQ at Level 3, and other full and non-full Level 3 vocational qualifications. ‘Any vocational L4’ includes higher apprenticeships, HND and HNC. Columns may not sum to 100 due to rounding. Source: London Economics’ analysis of LEO data (2001/02 to 2016/17).
The analysis indicates a clear gender split in the progression route:
- more than 70% of men who progressed went on to complete an advanced apprenticeship as their highest qualification, compared with less than 60% for women; this occurred for both disadvantaged and non-disadvantaged learners
- a larger proportion of women who progressed went on to achieve Level 3 qualifications and a first degree (or an equivalent higher-education qualification), compared to men
Differences in the educational pathways appear to be driven by gender and not socio-economic background.
The analysis does not take into account the possibility that individuals from different socio- economic groups may differ in terms of other personal characteristics or the characteristics of their apprenticeship. Disadvantaged learners may undertake apprenticeships in subjects with less obvious links to higher education. If this is the case, the difference in progression rates (Table 3) may be attributable not to socio-economic background, but rather to the difference between the 2 groups with respect to other characteristics.
We used econometric regression techniques to concentrate on the role of socio-economic background and to remove the effect of these other factors.[footnote 56] This allowed us to measure the gap in progression rates between the groups that was solely due to the learners’ backgrounds.
The results of the econometric analysis in Table 4 confirm the descriptive analysis. A young man from a disadvantaged background achieving an intermediate apprenticeship by the age of 21 is 4 percentage points less likely to go on to achieve a qualification at a higher level than a similar individual from a non-disadvantaged background holding a similar apprenticeship. For women, the effect is 3 percentage points.
Table 4: Estimates of the disadvantage gap in the likelihood of progressing and achieving qualifications at higher levels for individuals achieving an intermediate apprenticeship by the age of 21 (marginal effects), by gender
| Men | Women | |
| Estimated effect (percentage points) | −0.040 *** | −0.029 *** |
| Observations | 68,952 | 56,743 |
Note: * indicates that the estimate is statistically significant at 10%, ** at 5% and *** at 1% confidence levels. Source: London Economics’ analysis of LEO data (2001/02 to 2016/17).
9.3 What are the progression rates from advanced apprenticeships to higher- level qualifications?
We repeated the analysis for young learners achieving an advanced apprenticeship by the age of 21 (Table 5). Our analysis shows that fewer learners from disadvantaged backgrounds progress to qualifications at higher level, compared with non-disadvantaged learners (11.1% versus 13.6% for men and 17.0% versus 19.1% for women).
Table 5: Progression rates of English learners who undertook an advanced apprenticeship by the age of 21
| Men: Disadvantaged | Men: Non-disadvantaged | Women: Disadvantaged | Women: Non-disadvantaged | |
| Any qualification | 11.1% | 13.6% | 17.0% | 19.1% |
| Highest qualification achieved by 2016/17 by those who progressed and achieved at higher levels: | Men: Disadvantaged | Men: Non-disadvantaged | Women: Disadvantaged | Women: Non-disadvantaged |
| Any vocational L4 | 52.3% | 52.9% | 32.9% | 34.6% |
| First degree and equivalent higher education qualification | 45.0% | 44.1% | 62.9% | 59.7% |
| Postgraduate education | 2.7% | 2.9% | 4.7% | 5.2% |
Note: Figures show the percentage of English learners (from the 2001/02 –2003/04 cohort) who completed an advanced apprenticeship by the age of 21 who went on to complete a higher -level qualification by the end of 2016/17. Figures display only the highest level achieved by 2016/17, not all intermediate steps. ‘Any vocational L4’ includes higher apprenticeships . Columns may not sum to 100 due to rounding. Source: London Economics’ analysis of LEO data (2001/02 to 2016/17).
However, the econometric analysis indicates that the differences in progression rates at this level are driven by differences in personal and apprenticeship characteristics of the 2 groups and are not attributable to their background.[footnote 57] This means that an advanced-level apprentice from a disadvantaged background has the same chance of progressing and achieving a higher- level qualification as a similar apprentice from a non-disadvantaged background undertaking a similar apprenticeship (Table 6).
Women were more likely than men to progress from advanced apprenticeships and achieve qualification at higher levels. They also outperformed men in terms of the level of qualification they went on to achieve. About 60% of women who progressed achieved a first degree or equivalent, compared with approximately 45% of men.
Table 6: Estimates of the disadvantage gap in the likelihood of progressing and achieving qualifications at higher levels for individuals achieving an advanced apprenticeship by the age of 21 (marginal effects), by gender
| Men | Women | |
| Estimated effect (percentage points) | −0.001 | −0.001 |
| Observations | 49,996 | 23,430 |
Note: * indicates that the estimate is statistically significant at 10%, ** at 5% and *** at 1% confidence levels. Source: London Economics’ analysis of LEO data (2001/02 to 2016/17).
Overall, we find that intermediate apprenticeships are often a first step on the education ladder for non-disadvantaged learners – many of whom, especially women, go on to further or higher education qualifications. Conversely, apprenticeship training at intermediate level is often the final training outcome for disadvantaged learners.[footnote 58] There was no difference in subsequent educational attainment for learners of different backgrounds who undertook an advanced apprenticeship.
Case study: Jack Sudworth, Newton Abbot
Jack Sudworth was on track to study law at university when he ‘freaked out’ and decided to defer his place. Now he’s a technician at a growing technology company with 3 years of training under his belt.
“I had heard some people really like studying law but don’t like the job, and some people really like the job and hate the studying. So, I wanted to make sure I enjoyed work and then study,” he said.
“My A-Levels were all in wordy subjects and I’d never done much practical, so I thought I’d check to see if I was any good at that sort of stuff. I’m really glad that I did.”
With advice from South Devon College, Jack successfully applied for a Level 2 Electrical Engineering apprenticeship at start-up, Effect Photonics - a fledgling company developing products for use in high-speed optical networks.
He started in September 2016 and a year later moved straight onto the Level 3 qualification. Now he’s progressed even further to a part-time Combined STEM degree with the Open University, with the company funding 50 per cent of his fees.
“I really don’t want to be stagnant. I always want to push myself towards the next level,” he said.
This drive has seen him jump from machine operations to maintenance, to training, to quality control and now to auditing, alongside his studies. “I absolutely love it,” he said.
“I’ve never had a bad day at work, it’s such fun. There’s always something new. Working in a start-up means you’re constantly trying things out.”
Reflecting back on his decision to swerve the university route, Jack, now 21, is happy with his choice, but laments the apprentice/graduate pay gap.
“I think someone with 3 years of an apprenticeship is more valuable. It’s frustrating when people come out of uni and get put on a higher wage,” he said, though overall he’s very positive about his experience.
“There is a stigma - before I was an apprentice, I thought it was all students going to building sites and being sent off to find tartan paint, but apprentices are actually educated people who will go far.”
10. Labour market outcomes associated with apprenticeships
An apprenticeship provides better training and improved skills, which should result in enhanced labour market outcomes. Do apprenticeships promote social mobility – despite the many gaps faced by disadvantaged learners in selection, training quality, completion and progression rates? This chapter assesses the value of apprenticeship training in the labour market.
This strand of the analysis makes use of the Longitudinal Education Outcome (LEO) data and measures labour market outcomes at age 28.[footnote 59]
10.1 Key findings
On average, apprentices from disadvantaged backgrounds earn less than non- disadvantaged apprentices. This occurs at all levels of apprenticeship and for both genders. The gaps stand at £1,400 and £1,000 for men and women in possession of an intermediate apprenticeship respectively.
However, apprenticeships appear to promote social mobility by reducing the gap in labour market outcomes between apprentices from different backgrounds.
This is because apprentices from disadvantaged backgrounds receive a larger boost in their earnings from apprenticeship completion than their non-disadvantaged peers.
This is especially the case at intermediate level. For disadvantaged women achieving an intermediate apprenticeship, the earning boost stands at 16% compared to 10% for non-disadvantaged women. For men, it stands at 23% and 21% respectively.
This shows that apprenticeships are an engine for social mobility if – and only if – a disadvantaged learner can persevere throughout the system to complete their qualification.
10.2 Key measures of labour market outcomes at age 28
Individuals from disadvantaged backgrounds suffer a disadvantage gap in terms of labour market outcomes because their annual earnings and the proportion of the year spent in employment at age 28 are lower than those of non-disadvantaged apprentices.
This is shown in Tables 7 and 8, which provide detailed descriptive statistics on the average annual earnings and proportion of the year spent in employment at age 28 across a number of characteristics.[footnote 60] For example, apprentices from disadvantaged backgrounds earn between £1,000 and £2,000 less per year than their non-disadvantaged peers. This gap may be due to what subjects disadvantaged apprentices choose to go into, the geographical location of employers, and the relative pay-levels within firms.
Table 7: Average annual earnings at age 28, by socio-economic background and highest qualification
| Highest qualification | Men: Disadvantaged | Men: Non- disadvantaged | Men: Difference | Women: Disadvantaged | Women: Non- disadvantaged | Women: Difference |
| Advanced apprenticeship | £26,100 | £27,300 | -£1,200 | £14,300 | £15,700 | -£1,300 |
| Intermediate apprenticeship | £20,500 | £21,900 | -£1,400 | £12,300 | £13,300 | -£1,000 |
| L1 vocational qualification | £15,200 | £17,200 | -£2,000 | £9,100 | £10,600 | -£1,500 |
Note: Figures show the average annual earnings of individuals at age 28 who are not in education (earnings from self-employment have been included). Earnings have been adjusted for outliers, excluding individuals in the top and bottom percentiles. Rounded to the nearest £100. Source: London Economics’ analysis of LEO data (2001/02 to 2016/17).
Table 8: Average proportion of the year spent in employment at age 28, by socio- economic background and qualification
| Highest qualification | Men: Disadvantaged | Men: Non- disadvantaged | Men: Difference | Women: Disadvantaged | Women: Non- disadvantaged | Women: Difference |
| Advanced apprenticeship | 83.1% | 82.7% | 0.3 percentage points | 76.4% | 79.4% | −3.0 percentage points |
| Intermediate apprenticeship | 77.4% | 80.2% | −2.7 percentage points | 65.2% | 70.6% | −5.4 percentage points |
| L1 vocational qualification | 60.6% | 67.5% | −6.9 percentage points | 43.1% | 50.6% | −7.5 percentage points |
Note: Individuals in education at age 28 have been excluded from the sample. Source: London Economics’ analysis of LEO data (2001/02 to 2016/17).
Our analysis suggests, however, that apprenticeship training is still an effective means of fostering social mobility.
While disadvantaged apprentices in possession of a Level 1 vocational qualification earned £2,000 (13%) less on average than their non-disadvantaged peers at age 28, this gap narrows to £1,400 (7%) and £1,200 (5%) for those in possession of apprenticeships at intermediate and advanced levels respectively.
Likewise, for women the gap declines from £1,500 (13% of average annual salary) for those with a Level 1 vocational qualification to £1,000 (8%) for those with an intermediate apprenticeship. However, the earnings gap persists for women with an advanced apprenticeship – standing at £1,300 (9% of average annual salary).
Apprenticeships have a similar positive effect on the time spent in employment for both men and women, with the employment gap declining on moving up the qualifications ladder.
This means that even though individuals from disadvantaged backgrounds have poorer labour market outcomes than non-disadvantaged individuals with similar training, apprenticeships reduce the post-completion differences in earnings and employment outcomes.
10.3 What is the earnings boost associated with an apprenticeship?
Completing an apprenticeship generally leads to a boost in earnings. This means that apprenticeships improve the labour market outcomes of those who successfully complete the training. But is this positive impact similar across learners from different socio-economic backgrounds?
The answer is no. Learners from disadvantaged backgrounds receive a larger earnings boost (at age 28) from completing an apprenticeship than those from non-disadvantaged backgrounds. This is especially the case at intermediate level and indicates that apprenticeships effectively promote social mobility.
To assess the earnings boost associated with achieving an apprenticeship, we undertook an econometric analysis.[footnote 61],[footnote 62] A detailed description of the methodology is provided in the technical report.
The econometric analysis allowed us to address the following:[footnote 63]
- What is the percentage boost in earnings associated with progressing from a vocational qualification at Level 1 (for example, NVQ Level 1) to an intermediate apprenticeship by age 28, and how does this vary by socio-economic background?
- What is the percentage boost in earnings associated with progressing from an intermediate apprenticeship to an advanced apprenticeship at age 28, and how does this vary by socio- economic background?
The earnings effects are provided in Table 9, with comparison with the next-highest level of qualification labelled as ‘level-below counterfactual’.
The analysis shows that the earnings boost was larger for disadvantaged learners than for non- disadvantaged learners. Disadvantaged learners experience a larger boost in their earnings than non-disadvantaged apprentices when progressing from a lower-level qualification to an apprenticeship.
Table 9: Percentage effects on daily earnings, by level of apprenticeship, gender and socio-economic background – same socio-economic background counterfactual
| Highest qualification | Men: Disadvantaged | Men: Non-disadvantaged | Women: Disadvantaged | Women: Non-disadvantaged |
| Level-below counterfactual | ||||
| Advanced apprenticeship | 14.2% | 12.9% | 13.0% | 13.0% |
| Observations | 15,158 | 61,762 | 11,404 | 38,760 |
| Intermediate apprenticeship | 22.9% | 21.3% | 16.1% | 10.4% |
| Observations | 16,198 | 40,826 | 10,028 | 25,343 |
| Same-level counterfactual | ||||
| Advanced apprenticeship | 22.6% | 16.1% | 5.3% | 3.6% |
| Observations | 9,146 | 38,336 | 10,740 | 41,903 |
| Intermediate apprenticeship | 12.5% | 9.5% | 11.6% | 5.4% |
| Observations | 18,482 | 42,657 | 10,730 | 24,940 |
Note: Individuals in education and not in employment at age 28 have been excluded from the sample. Earnings have been adjusted for outliers, excluding individuals in the top and bottom percentiles. The level-below counterfactual comprises individuals holding a Level 1 vocational qualification (as highest) for intermediate apprenticeship and an intermediate apprenticeship (as highest) for advanced apprenticeship. The same-level counterfactual comprises individuals holding a Level 2 vocational qualification (as highest) for intermediate apprenticeships and a Level 3 vocational qualification (as highest) for advanced apprenticeships. When estimating the same -level counterfactual, the treatment groups have been restricted to individuals in possession of both a Level 2 vocational qualification and intermediate apprenticeship and a Level 3 vocational qualification and advanced apprenticeship to capture the value associated with adding an apprenticeship to a vocational qualification at the same RQF level. The regressions are estimated separately for individuals from disadvantaged and non - disadvantaged backgrounds. Percentage effect reported after exponentiating coefficient (exp(δ)− 1). All figures are statistically significant at 1% confidence level. Source: London Economics’ analysis of LEO data (2001/02 to 2016/17).
In particular:
- there was an earnings premium of 14.2% on progression from intermediate to advanced apprenticeships for men from disadvantaged backgrounds – compared with 12.9% for those from non-disadvantaged backgrounds; a premium of 22.9% was identified with progression from a Level 1 vocational qualification to an intermediate apprenticeship for the same group – compared with 21.3% for non-disadvantaged learners
- the corresponding boosts for disadvantaged women were 13.0% and 16.1% for progression from intermediate to advanced apprenticeship and from Level 1 vocational qualifications to intermediate apprenticeships respectively – compared with 13.0% and 10.4% for non- disadvantaged women
In the bottom half of Table 9 (labelled ‘same-level counterfactual’), we also present the boost in earnings associated with progressing from a qualification at the same level to an apprenticeship. In other words, we address the following questions:
- What is the boost in earnings experienced, by socio-economic background, when progressing from a vocational qualification at Level 2 (for example, NVQ level 2) to an intermediate apprenticeship?
- What is the boost in earnings experienced, by socio-economic background, when progressing from a vocational qualification at Level 3 (for example, NVQ level 3) to an advanced apprenticeship?
Confirming the previous findings, the boost in earnings associated with progression to apprenticeship training was larger for apprentices from disadvantaged backgrounds.
Unsurprisingly, given that the individual already has a same-level qualification, the earnings premiums estimated using the same-level counterfactual were smaller in size than those using the level-below counterfactual only.
These results suggest that apprenticeship training, particularly at intermediate level, effectively promotes social mobility by closing the earnings disadvantage gap.
11. About the Commission
The Social Mobility Commission is an independent advisory non-departmental public body established under the Life Chances Act 2010 as modified by the Welfare Reform and Work Act 2016. It has a duty to assess progress in improving social mobility in the UK and to promote social mobility in England.
The Commission board comprises:
- Sandra Wallace, Joint Deputy Chair, Joint Managing Director Europe at DLA Piper
- Steven Cooper, Joint Deputy Chair, Chief Executive Officer , C. Hoare and Co
- Alastair da Costa, Chair of Capital City College Group
- Farrah Storr, Editor-in-chief, Elle
- Harvey Matthewson, Aviation Activity Officer at Aerobility and Volunteer
- Jessica Oghenegweke, Presenter, BBC Earth Kids
- Jody Walker, Senior Vice President at TJX Europe (TK Maxx and Home Sense in the UK)
- Liz Williams, CEO @FutureDotNow.UK
- Pippa Dunn, Founder of Broody, helping entrepreneurs and start ups
- Saeed Atcha, Chief Executive Officer of Youth Leads UK
- Sam Friedman, Associate Professor in Sociology at London School of Economics
- Sammy Wright, Vice Principal of Southmoor Academy, Sunderland
12. About London Economics
London Economics is one of Europe’s leading specialist economics and policy consultancies. Based in London and with offices and associate offices in 5 other European capitals, we advise an international client base throughout Europe and beyond on economic and financial analysis, litigation support, policy development and evaluation, business strategy, and regulatory and competition policy.
Our consultants are highly-qualified economists who apply a wide range of analytical tools to tackle complex problems across the business and policy spheres. Our approach combines the use of economic theory and sophisticated quantitative methods, including the latest insights from behavioural economics, with practical know-how ranging from commonly used market research tools to advanced experimental methods at the frontier of applied social science. For more information, please visit www.londoneconomics.co.uk
Head Office: Somerset House, New Wing, Strand, London, WC2R 1LA, United Kingdom.
Website: londoneconomics.co.uk
Email: info@londoneconomics.co.uk
Twitter: @LondonEconomics and @LE_Education
tel: +44 (0)20 3701 7700
fax : +44 (0)20 3701 7701
12.1 Authors
Alice Battiston, Rhys Williams, Pietro Patrignani and Gavan Conlon
Access to the data was granted through the Department for Education-funded Centre for Vocational Education Research (CVER). Responsibility for the information and views set out in this report lies entirely with the authors.
-
We measure earnings and employment probabilities at age 28. ↩
-
Apprentices at Level 2 only have to be working towards a Level 2 English and maths qualification but don’t have to complete it to achieve the apprenticeship. In contrast, Level 3 apprentices must complete their Level 3 English and maths qualifications to gain the apprenticeship. ↩
-
Providers will not get full payment for an apprentice who doesn’t complete their English and maths qualification at Level 3. If the provider’s rates of non-completion are high, they will be penalised and could be prevented from offering apprenticeships in the future. ↩
-
Social Mobility Commission, State of the Nation 2018-19, 2019 ↩
-
Higher education drop-out rates stand at around 7% between first and second year and less than 20% over the course of a 3-year full time undergraduate degree. ↩
-
Department for Education, Learners and Apprentices Survey, 2018 ↩
-
Additionally, to ensure replicability of this analysis, therefore, it is crucial that all data sources are made available to researchers in the ONS Safe Research Setting (SRS) and that the SRS can be easily accessed remotely. The analysis benefited crucially from the matching of the ILR information to the employers’ information sourced from the IDBR. The matching strategy developed by London Economics improved significantly upon previous attempts of matching the 2 datasets performed in-house by the ONS. To ensure the analysis can be repeated in future it is crucial that the matching exercise is updated after the end of CVER (April 2020). ↩
-
This is available in the ILR but currently not included in the main published tables on ‘Apprenticeship and Levy statistics’. ↩
-
Using the latest available Index of Multiple Deprivation at the time of publication. ↩
-
As part of CVER, London Economics has shared the ILR/EDS-IDBR look-up with the Department for Education, making this apprentice/firm-level analysis feasible. ↩
-
Learning and Work Institute, Bridging the gap: next steps for the apprenticeship levy, 2019 ↩
-
Social Mobility Commission, The adult skills gap: is falling investment in UK adults stalling social mobility?, 2019 ↩
-
Access to the various data sources was granted via the Centre for Vocational Education Research (CVER). ↩
-
Learning and Work Institute, Bridging the gap: next steps for the apprenticeship levy, 2019 ↩
-
The sample sizes for achievers of higher apprenticeships in the available cohorts were not large enough to extend the analysis to apprenticeships at Level 4 and above. ↩
-
Education data is derived from the National Pupil Database, Individualised Learner Record and Higher Education Statistics Agency. Employment data is derived from HM Revenue and Customs and Department for Work and Pensions data. ↩
-
The 2010 English Index of Multiple Deprivation (IMD) was used as measure of disadvantage for the analysis of selection into apprenticeship training, training quality and attrition. However, for the analysis of progression into further and higher education and labour market outcomes, based on the Longitudinal Education Outcome (LEO) data, the Income Deprivation Affecting Children Index (IDACI) was used to identify pupils from disadvantaged backgrounds. Both the IMD and the IDACI provide a geographical measure of disadvantage rather than an individual-level measure of deprivation. This means that all learners from the same neighbourhood will be considered disadvantaged or non-disadvantaged, irrespective of each specific socio-economic situation. Given the limited geographical extension of each LSOA, this approximation was deemed sufficient to identify disadvantaged learners. Along with the IDACI information, the LEO dataset provides information on pupils registered for f ree school meals (FSM). Information on the association between IDACI and FSM eligibility for the 3 cohorts of interest in LEO is presented in the technical report. ↩
-
Department for Education (2018). Learners and Apprentices Survey 2018 ↩
-
Abel, G.A., Barclay, M.E., Payne, R.A. (2016). Adjusted indices of multiple deprivation to enable comparisons within and between constituent countries of the UK including an illustration using mortality rates. BMJ Open 6(11). ↩
-
Welch, C.A., Harrison, D.A., Hutchings, A., Rowan, K. (2010). The association between deprivation and hospital mortality for admissions to critical care units in England. Journal of Critical Care 25(3) ↩
-
Population figures from the 2011 census are provided in the technical report attached to this report. ↩
-
52.9% of those living in disadvantaged areas at the time the 2011 census was undertaken were aged 34 or below compared with 42.0% in non-disadvantaged areas. ↩
-
Population figures from the 2011 census are provided in the technical report. ↩
-
Population figures from the 2011 census are provided in the technical report. ↩
-
‘Region’ refers to the region of origin of the apprentices, measured prior to enrolment in the programme. ↩
-
Given that disadvantaged areas are not equally spread out across England, it is expected that a larger proportion of disadvantaged apprentices will have originated from particular regions. ↩
-
To compute apprenticeship training intensity, we used mid-2017 ONS LSOA-level working-age (16–65) population estimates, by gender. In order to identify disadvantaged LSOA, we mapped LSOAs from the 2001 definition (used in the 2010 IMD) onto LSOAs from the 2011 definition (used for ONS estimates). Data from 2011 LSOAs corresponding to more than one 2001 LSOA has only been included provided that all of its 2001 LSOAs were classified as disadvantaged or non-disadvantaged (not a mix of the two). ONS population estimates are publicly available. ↩
-
Social Mobility Commission, Socio-economic diversity and inclusion: employers’ toolkit, 2020 ↩
-
Social Mobility Commission, Adult skills gap and the falling investment of adults with low qualifications, 2019 ↩
-
Cross-regional mobility of apprentices is limited and the vast majority of apprentices are domiciled in the same region before and during the programme. ↩
-
Battiston, A., Conlon, G., Dickerson, A., McIntosh, S., Patrignani, P. (2010). Exploring trends in apprenticeship training around the introduction of the Apprenticeship Levy: emerging evidence using a matched apprentice- employer dataset. CVER Briefing Note 011. ↩
-
Small enterprises: employment of less than 10 people; medium enterprises: employment between 10 and 249; large enterprises: employment of 250 or more. ↩
-
The first levy-supported apprenticeships started in May 2017. We identify as levy-supported all those apprenticeships for which at least one payment from the digital account of the employer has been made. ↩
-
Levy-funded apprenticeships at SMEs could result from transfers in levy funding from larger firms. In addition, it should be noted that the IDBR employment variable used to classify enterprises by size reports data with a lag of around one to 2 years. ↩
-
Public Accounts Committee (2019). The apprenticeships programme: progress review. 98th report. ↩
-
Department for Education (2017). Apprenticeships evaluation 2017: learners. November 2017. ↩
-
The levels of apprenticeships are: intermediate, equivalent to 5 good GCSE passes; advanced, equivalent to 2 A level passes; higher, equivalent to Levels 4 to 7; and degree, equivalent to Levels 6 and 7 and combining paid work with university study. ↩
-
For the purpose of this study, degree apprenticeships have been combined with higher apprenticeships. Higher apprenticeships and degree apprenticeships were introduced in 2010 and 2014 respectively. ↩
-
This association is demonstrated in the technical report attached to this report. See also next section. ↩
-
Resolution Foundation (2019). Trading up or trading off? Understanding recent changes to England’s apprenticeships system. August 2019. ↩
-
Battiston, A., Patrignani, P., Hedges, S., Conlon, G. (2019). Labour market outcomes disaggregated by subject area using the Longitudinal Education Outcomes (LEO) data. CVER Research Discussion Paper 021. ↩
-
We additionally investigated whether the subject mix has changed following the introduction of the levy and observed a shift from business and law towards engineering (for men) and health and retail (for women) at intermediate level. At higher level, the shift was from heath towards business and law (men and women) and engineering (men only). Differences by socio-economic background were limited. ↩
-
This is shown in the technical report. ↩
-
Bursnall, M, Nafilyan, V, Speckesser, S (2017). An analysis of the duration and achievement of apprenticeships in England. CVER Research Briefing Note 004. ↩
-
Department for Education (2018). Learners and Apprentices Survey 2018. Research report. ↩
-
The Learners and Apprentices Survey 2018 provides information on reasons for non-completion rather than non- achievement. The focus of this chapter, however, is on apprenticeships that have been successfully completed and achieved. As such, we refer to achievement rates rather than completion rates. ↩
-
Issues with the apprenticeship included the following answers: ‘Apprenticeship poorly run’; ‘Did not like the work’; ‘Did not like the people’; ‘Did not like the training element’; ‘Did not pay enough’; ‘Did not like the hours’; ‘Did not like travelling to get there’. ↩
-
We estimated a Probit model, where the dependent variable is a dummy for whether the apprenticeship has been achieved within 3 years from the start of the programme and the independent variable is a dummy indicating whether the apprentice is from a disadvantaged background. A detailed description of the methodology is provided in the technical report, including the list of the characteristics selected as controls. We ran the analysis both by pooling apprentices at various levels and for each level separately. The technical report additionally provides results from the subject-specific regressions. ↩
-
The previous chapter presented information on the planned duration of the training. ↩
-
Data on higher education and further education in LEO is available up to the academic year 2016/17. This means that it was possible to follow pupils from the 2001/02 cohort up to the age of 30, from the 2002/03 cohort up to the age of 29 and from the 2003/04 cohort up to the age of 28. ↩
-
In the technical report, we also consider those completing the programme between the ages of 21 and 24. ↩
-
Progression rates are computed including learners who progressed and achieved at higher level. Learners who enrolled into a higher-level qualification without achieving it have been excluded. ↩
-
The main report focuses on the group of learners achieving by the age of 21. Results for achievers between the age of 21 and 24 are provided in the technical report. ↩
-
Due to the small sample size, it was not possible to extend the analysis to apprenticeships at higher level. ↩
-
We estimated a Probit model where the dependent variable is a dummy for whether the apprentice has progressed to further or higher education and achieved a qualification at higher level by 2016/17 and the independent variable is a dummy indicating whether the apprentice is from a disadvantaged background. Detailed information on the methodology as well as a list of the covariates included in the model are provided in the technical report. ↩
-
We estimated a Probit model, where the dependent variable is a dummy for whether the apprentice has progressed to further or higher education and achieved a qualification at higher level by 2016/17 and the independent variable is a dummy indicating whether the apprentice is from a disadvantaged background. Detailed information on the methodology as well as a list of the covariates included in the model are provided in the technical report. ↩
-
At least by the age of 28. ↩
-
This is the latest age observable for all of the 3 cohorts of learners in the available data. ↩
-
Analogous descriptive statistics on the proportion of the year spent in receipt of active labour market benefits are provided in the technical report. ↩
-
To investigate the extent to which any difference in returns associated with apprenticeships persists over time, we also conducted a triple-difference-in-difference analysis, looking at changes in outcomes before and after enrolling in an advanced/intermediate apprenticeship for disadvantaged learners (first difference) against the counterfactual group (second difference), and comparing the outcomes with the comparable outcomes for the non-disadvantaged group (third difference). This analysis suffers from small sample sizes, and the results are less reliable. This is because only a few individuals undertake the educational pathway required for the analysis (achieving an intermediate apprenticeship at a very early age, spending sufficient time in employment, subsequently starting an advanced apprenticeship and completing it by the age of 28 – the latest age available in the data). As such, the results of this element of the analysis should be treated with caution and are only presented for information purposes in the technical report. ↩
-
Estimates for employment and benefits differentials are provided in the technical report. ↩
-
We also estimated the earnings differentials associated with completing an apprenticeship (at intermediate or advanced level) using a common level-below counterfactual. The results are provided in the technical report. This alternative approach looks at the boost in earnings compared with the average earnings accrued by individuals at the level below, irrespective of socio-economic background. Despite providing a measure of the relative value of the qualification for the 2 groups, this type of analysis does not factor in the substantial earnings gap in the counterfactual groups depending on socio-economic background. ↩