A study of work and health transitions: analysis of Understanding Society
Published 20 July 2021

© Crown copyright 2021
This publication is licensed under the terms of the Open Government Licence v3.0 except where otherwise stated. To view this licence, visit nationalarchives.gov.uk/doc/open-government-licence/version/3 or write to the Information Policy Team, The National Archives, Kew, London TW9 4DU, or email: psi@nationalarchives.gov.uk.
Where we have identified any third party copyright information you will need to obtain permission from the copyright holders concerned.
This publication is available at https://www.gov.uk/government/publications/a-study-of-work-and-health-transitions-analysis-of-understanding-society/a-study-of-work-and-health-transitions-analysis-of-understanding-society
A study of work and health transitions: analysis of understanding society
DWP research report no. 994
A report of research carried out by the National Institute of Economic and Social Research on behalf of the Work and Health Unit.
© Crown copyright 2021.
You may re-use this information (not including logos) free of charge in any format or medium, under the terms of the Open Government Licence. To view this licence, visit the Open Government Licence or write to the Information Policy Team, The National Archives, Kew, London TW9 4DU,or email: psi@nationalarchives.gsi.gov.uk
This document/publication is also available on our website at DWP research reports.
If you would like to know more about DWP research, please email: socialresearch@dwp.gsi.gov.uk
First published 2021.
ISBN 978-1-78659-273-6
Views expressed in this report are not necessarily those of the Department for Work and Pensions or any other Government Department
Statement of Compliance
This research complies with the 3 pillars of the Code of Practice for Statistics: trustworthiness, quality and value.
Trustworthiness
This research was conducted, delivered and analysed impartially by the National Institute of Economic and Social Research (NIESR), working to the Government Code of Practice for Statistics Authors: Sergio Salis, Stefan Speckesser, Lea Samek (National Institute of Economic and Social Research) and Paul Bivand (Learning and Work Institute)
Quality
The research was carried out using established quantitative and qualitative research methods, with relevant academic experts consulted over methodology and application of techniques. Details of methodological choice and application, as well as limitations of results are documented.
The research has been quality assured using NIESR’s internal quality checking processes, which have been shared with the Work and Health Unit.
The report has been checked thoroughly by Work and Health Unit analysts to ensure it meets the highest standards of analysis and drafting
Value of this research
Findings from this report will help us consider more sophisticated approaches to the targeting and timing of policy interventions, as well as providing direction to future research.
The research also contributes to the growing evidence base to support work and health policy.
Acknowledgements
This report was commissioned by the Work and Health Unit, jointly sponsored by the Department for Work and Pensions (DWP) and the Department of Health and Social Care (DHSC). The research was carried out by the National Institute of Economic and Social Research (NIESR) in collaboration with Paul Bivand (Learning and Work Institute). The authors gratefully acknowledge the support of colleagues at the DWP, in particular H Patel and Lily Shannon. This report also benefited from the advice of a steering group composed of Mike Daly and Ellen Flint (DWP), Melanie Jones (University of Cardiff), and Stephen Bevan (Institute for Employment Studies). Thanks are also due to Prof. Stephen Jenkins (London School of Economics and Political Science), Pilar García-Gómez (Erasmus School of Economics) and Ralf Wilke (Copenhagen Business School) for helpful advice on the survival analysis. Finally, the project team would like to thank the Understanding Society User Support team and Andrea Stochino, an intern at NIESR funded under the Erasmus+ traineeship scheme, for technical support.
The authors
This report was produced by Sergio Salis, Stefan Speckesser and Lea Samek (National Institute of Economic and Social Research), and Paul Bivand (Learning and Work Institute).
Definitions within this report
Incident health problem
The health literature uses the term incident to refer to the occurrence of a new case of a health problem. Incidence should not be confused with prevalence, which refers to the proportion of a population with a given health condition at a point in time. Throughout the report, the terms ‘incident health problem’ and ‘onset of poor health’ are used interchangeably.
Health transition
A health transition denotes a change from one health state to another between 2 consecutive time points. A move from poor to good health is called a positive health transition, while a negative health transition reflects a switch from good to poor health. In this report the term ‘health shock’ is used interchangeably with ‘health transition’.
Work transition
A work transition denotes a change from one labour market status to another between 2 consecutive points in time. Changing status from employed to not employed (or from economically active to inactive) is considered a negative work transition, while moving from not employed to employed (or from economically inactive to active) is a positive work transition. For those who remain employed between the 2 time points considered, moving from part to full-time, temporary to permanent, dissatisfactory to satisfactory, or low to high-pay jobs are considered positive work transitions. The opposite changes reflect negative work transitions.
Impact
The impact of health transitions on work transitions is a measure of how experiencing health transitions alters the likelihood of undergoing a work transition for the individuals observed. Technically, it is calculated as the difference between the probabilities of undergoing a work transition among those who experienced a health transition and those who did not experience a health transition, after having accounted for important differences between the 2 groups.
Percentage point
A percentage point (ppt) is the unit used to measure the difference between 2 percentages. The impact of health transitions on work transitions is measured in ppts. For example, if the percentage exiting employment among those who experienced onset of a mental health problem is 77% and the percentage exiting employment that would be observed had the same people not experienced the onset (the so called ‘counterfactual’) is estimated at 70%, then we say that onset of a mental health problem increased the percentage exiting employment by 7ppts.
Statistical significance
Statistical significance tests are designed to determine the probability that an observed impact did not occur by chance, that is, a result specific to the sample and not reflective of the wider population from which it was drawn. If the assumptions about the data that underpin the application of the test applied hold true, then the smaller the statistical significance threshold an impact estimate is determined to exceed, the higher the likelihood that the apparent impact observed in the sample may represent a true association in the population of interest. The p-value of an impact estimate represents the probability of finding the result in a sample even if no such association exists in the population. In the context of this report, an impact estimate which is found to be statistically significant at the 5% (1%) level means that we accord a high (very high) probability that the estimate provides a true measure of the association of health transitions with work transitions.
Chronic conditions
The chronic conditions considered are asthma, arthritis, congestive heart failure, coronary heart disease, angina, emphysema, hyperthyroidism or an over-active thyroid, hypothyroidism or an under-active thyroid, chronic bronchitis, any kind of liver condition, cancer or malignancy, diabetes, epilepsy, high blood pressure, clinical depression, heart attack or myocardial infarction, and stroke. These are the only conditions explicitly referenced in the data.
General Health Questionnaire
The General Health Questionnaire (GHQ) is a 12-item questionnaire generally used to identify non-psychotic and minor psychiatric conditions. It includes questions aimed at exploring aspects of an individual’s daily life, including: anxiety, depression, feelings of incompetence, difficulty coping with problems and sleep disturbance. Specifically, respondents are asked to report, using a 4-point Likert scale, the extent to which they have recently been feeling that they have been: able to concentrate on doing things, able to sleep despite worries, playing a useful part in things, able to make decisions, under strain, able to overcome problems, able to enjoy daily activities, able to face problems, feeling unhappy or depressed, losing confidence in themselves, thinking of being worthless, and feeling reasonably happy. For each item, the individual’s answer is converted into a single dummy variable indicating whether a symptom of distress existed. Adding the value of the 12 dichotomous variables, a single indicator of mental health problem or psychological distress ranging 0 to 12 is obtained, denoting the number of symptoms of distress for the individual.
Functional impairments
Functional impairments (or limitations) include those relating to mobility (moving around at home and walking), lifting, carrying or moving objects, manual dexterity (using hands to carry out everyday tasks), continence (bladder and bowel control), hearing (apart from using a standard hearing aid), sight (apart from wearing standard glasses), communication or speech problems, memory or ability to concentrate, learn or understand, recognising when you are in physical danger, physical co-ordination (for example, balance), difficulties with own personal care, and other health problem or disability.
Executive summary
Background
Disabled people typically fare worse in the labour market. Between April and June 2018, while the UK employment rate reached a historic high of 75.6%, only half of disabled people were in work. Although the disability employment gap (the difference between the employment rates of disabled and non-disabled people) has narrowed by 5 percentage points from 34 to 29 percentage points since 2014, the prevalence of disability and ill-health among the working-age population has been rising over time. Working age ill-health, which prevents people attending work or being in a job due to illness or disability, comes at a considerable cost to the UK economy of around £100 billion a year (Work and Health Unit, 2017).
To provide contextual evidence for the government’s strategy for improving employment among disabled people or people with health conditions, this study examines transitions (changes) in health and work status experienced by working-age people (16 to 64 years old). It uses a large-scale longitudinal survey, Understanding Society (USoc), to provide fresh empirical evidence on the complex relationship between health and work transitions, which is arguably under-explored.
More specifically, the analysis aims to explore:
- what impacts changes in health have on work outcomes and the extent to which those impacts vary by individual characteristics;
- the durations of health transitions (length of time in good or poor health) across different groups, and the individual characteristics affecting the probability of experiencing these transitions; and
- the patterns of people’s employment status and job satisfaction in the medium term following health transitions
The research seeks to improve understanding of which types of people are most likely to experience deteriorations or improvements in health, and to identify factors which might mitigate the negative labour market consequences (or maximise the positive effects) of health shocks.
Methodology
This study uses data from 8 waves of USoc. USoc is a longitudinal survey of around 40,000 UK households recruited between 2009 and 2011, and re-interviewed at around one-year intervals. USoc contains information on demographics and circumstances of individuals and their households (including work, health, income and education characteristics), enabling analysis of recent trends and patterns in health and work.
In this study, a health transition is defined as either an onset of poor health or an incident health problem (negative health transition) or an exit from poor health (positive health transition). Five different definitions of poor health are considered: poor self-assessed general health, the existence of a mental health problem or psychological distress, self-reported long-term disability or illness, self-reported long-term disability or illness limiting daily activities (functional impairment), and having one or more chronic conditions.
Work transitions include both changes in an individual’s labour market status over time and, for those who remain employed, in their work conditions. Changes in an individual’s labour market status include transitions from employment to non-employment and from economic activity to inactivity (negative work transitions), and vice versa (positive work transitions). Positive in-work transitions include moves from low to high pay, part to full-time, temporary to permanent, and dissatisfactory to satisfactory jobs. In-work transitions in the opposite direction denote negative work transitions.
These transitions were explored using 3 different analytical approaches:
- assessing the association between transitions in health and subsequent transitions in employment status, and identifying risk factors, using multiple logistic regression. The impact of incident poor health and exit from poor health on changes in labour market status or work conditions is assessed using logistic regression models. Impacts are estimated as the difference in the probabilities of experiencing work transitions between those who undergo a health transition and those who do not. The methodology controls for baseline differences between these 2 groups in terms of important individual characteristics and circumstances. The identification of impact moderators is implemented using interaction terms in the regression models
- examining durations of time in different states of health using survival analysis. Survival functions (estimated using the Kaplan-Meier method) and discrete-time proportional hazards (estimated by means of complementary log-log models) are used to analyse time spent in good and poor health. They are also used to investigate which individual characteristics and circumstances are associated with a higher likelihood of recovering from, or relapsing into, poor health
- exploring patterns of employment status and work conditions over time following a health transition using sequence analysis. The aim of the sequence analysis is to explore employment status and job satisfaction patterns experienced by individuals making a health transition. We look at these outcomes after the health transition as a sequence of self-reported outcomes. By doing this, we aim to explore how people’s labour market activity and satisfaction with work changes following a health shock
Key findings
Risk factors associated with work transitions following a health transition - the findings of a series of logistic regression analyses indicate that:
- an incident health problem is associated with a greater likelihood of job loss in the same period and, to a lesser extent, one year after. Among those who remained in employment following an incident health problem, some negative effects were observed, notably a greater likelihood of an individual becoming dissatisfied with their job
- the risk of job loss following an incident mental health problem is mitigated by having a university degree, working in a larger workplace (200 or more employees) and having a skilled job
- recovering from poor health is associated with a greater likelihood of becoming employed in the same period. This positive association of recovery with employment appears to be smaller than the negative association of an incident health problem with job loss
Durations of time in different states of health - the findings of the survival analysis indicate that:
- for those affected by an incident health problem, there is a greater likelihood of recovery among certain groups including white people (compared with those from other ethnic groups), employed people, those with children under the age of 16 in the household, and home owners. In general, these groups are found to experience a faster recovery
- younger people (16 to 24 year olds) are more likely to recover from incident health problems, and do so more quickly, than older groups. However, the opposite appears to be true where a mental health condition is concerned
- people with a qualification (notably, a GCSE or degree) appear to recover from poor health more slowly, and be at greater risk of relapse, than those without any qualifications
- with the exception of mental health conditions, there is evidence suggesting that the higher the qualification the higher the likelihood of relapsing into poor health
- generally, the individual characteristics associated with a greater likelihood of recovering from an incident health problem are the same as those associated with a lower risk of relapse
Patterns of employment status and work conditions following health transitions - the findings from the sequence analysis indicate that:
- patterns of work and job satisfaction appear similar regardless of the way in which health is measured
- around half of people experiencing a transition into poor general health remain in employment. These are equally split between people satisfied with their job and (transitorily or permanently) dissatisfied
- around half of people experiencing a transition into poor general health are out of employment and remain so for the period observed (5 years). Of those that are out of work, half report that their withdrawal from employment was because of poor health (at least temporarily)
- findings are very similar across conditions, except for the onset of mental health problems, where a larger proportion is found to remain in full-time employment and, amongst them, a larger proportion are dissatisfied with work
Implications and recommendations for further research
While the impact of unemployment (and particularly long-term unemployment) on health has been researched extensively,[footnote 1] there is arguably less research that explicitly examines the effects of changes in health on employment outcomes. The present study provides an exploratory analysis of these effects, identifying important impact moderators like socio-economic group and workplace characteristics. The findings may help with consideration of how best to target interventions.
Whilst this study has focused on a few measures of work and health, and on a limited number of health and work transitions, a wide range of further issues could be explored. Examples of opportunities for further analysis include:
- examining how an individual’s occupational status and earnings develop in different scenarios, for example after they recover from ill-health (or remain in employment with a continued health problem)
- how adjustments in the workplace affect outcomes
- more complex transitions concerning co-occurring health conditions
- exploration of multiple transitions per individual
- relating the biomarkers collected in Understanding Society for a proportion of survey respondents to the self-identified health status responses underpinning this study to enrich measurement of different health states
Additionally, other datasets may be a valuable source for future analysis. For example, analysis of DWP administrative data about benefit claimants, (especially where linked with HMRC data on employment and earnings) might enable analysis of a larger scale study with finer granularity of time (where the annual periodicity of Understanding Society may be a drawback). Furthermore, with informed consent, linkage of bespoke health cohort studies with administrative employment data would be even more informative.
1. Introduction
This chapter describes the policy background to this study, and summarises the current state of empirical research on health and work transitions. It outlines the research objectives, the data and the statistical methods used.
1.1. Policy background
Disabled people fare worse in the labour market. Between April and June 2018, while the UK employment rate reached a historic high of 75.6%, only half of people with a disability or limiting health condition were in work. The disability employment gap (the difference between the employment rates of disabled and non-disabled people) has been stable at around 30 percentage points throughout the past decade, while the prevalence of disability and ill-health among the working-age population has been rising over time. Working age ill-health, which prevents people attending work or being in a job due to illness or disability, comes at a considerable cost to the UK economy estimated to be around £100 billion a year (Work and Health Unit, 2017).
To provide contextual evidence for the government’s strategy for improving employment outcomes among people with health conditions or disabilities, this study examines transitions (changes) in health and work status experienced by working-age people (16 to 64 year olds). It uses a large-scale longitudinal survey, Understanding Society (USoc), to provide fresh empirical evidence on the complex relationship between health and work transitions, which is arguably under-explored.
In 2017, at a time when there were 3.5 million disabled people in work, the UK government set a goal to see one million more disabled people in work over the next 10 years. ‘Improving Lives: The Future of Work, Health and Disability (Work and Health Unit, 2017)’ set out in more detail the Government’s 10-year strategy to improve disability employment outcomes. This described the intent for action through employers, particularly on recruitment and retention of disabled people, the need to improve access to occupational health services, and measures to achieve a sustainable welfare and employment system co-ordinated with the health system and local communities.
The government’s 2017 command paper also acknowledged the importance of developing the evidence base to inform policy measures. Previously, the Black Review (2008) highlighted that many incapacity benefit claimants could have maintained and progressed in their jobs with the right support. The 2017 command paper placed emphasis on tailoring support to individual situations. Understanding the characteristics, circumstances, and health and work journeys of disabled people and those affected by ill health is therefore important to inform policy responses – both the targeting, and nature, of support and incentives needed to achieve better work outcomes.
1.2. Existing research on health and work transitions
There is extensive empirical research demonstrating that an individual’s likelihood of being in paid employment is negatively affected by poor health (for example, Blackaby et al., 1999; Kidd et al., 2000; Meltzer at al., 1995; Waddell and Burton, 2006). However, little is known about the complex dynamics of the relationship between health and work. We did not identify any previous studies which have examined the impact of a change in an individual’s health state (or ‘health transition’, such as the sudden onset of a mental health problem or of a chronic condition) and changes in their labour market status (‘work transition’ – for example, a move from employment to inactivity or unemployment). Recent research also suggests that for those who remain in work despite experiencing a health problem, work conditions are of paramount importance, as is the type of health condition experienced, so changes in these states should be considered. For example, Pacheco et al. (2012) suggest that those who suffer from physical pain are more likely to do casual (temporary or part-time) jobs, while people affected by depression are less likely to hold a permanent job while still remaining full-time.
A report by the Joseph Rowntree Foundation (Webber et al., 2015) is the first attempt to better understand employment transitions and in-work experiences of people affected by disability or ill-health.[footnote 2] Using longitudinal data from the British Household Panel Survey (BHPS), the authors find that being in poor health (physical, mental or both) reduces the likelihood of experiencing positive employment transitions. Their analysis also suggests that individuals with a health condition or disability are more likely to be trapped in low-pay circles of labour market activity (lower-status jobs in terms of pay, conditions, security and development opportunities). While explicitly addressing employment dynamics (changes in labour market status and employment conditions) in their analysis, Webber et al. (2015) consider health in a static sense (in terms of whether an individual had poor health at any point in time), and thus the role of health transitions remains unexplored.
1.3. Research aims
In October 2018, the Work and Health Unit (a cross-government unit, jointly sponsored by the Department for Work and Pensions and the Department of Health and Social Care) commissioned the National Institute of Economic and Social Research to conduct research into health and work transitions. Specifically, the analysis sought to achieve the following research objectives:
- explore the statistical association between health transitions and work transitions, and attempt to provide indicative measures of the impact of the former on the latter
- identify the characteristics and circumstances of working-age individuals which moderate the impact of health transitions on work transitions (if any)
- investigate time-related aspects around health transitions, notably whether the duration of health transitions varies across different population subsets, and how individual characteristics affect this duration
- explore time patterns (sequences) of employment statuses and in-work conditions experienced by individuals following an initial health transition
In addition to achieving these specific research objectives, it is more generally expected that the research will contribute to the development of a wider framework to measure and monitor improvements in work and health outcomes over time and for different subgroups, defined by demographics and wider circumstances.
Note that, while important, the impact of work transitions on health transitions (reverse causality in the context of this analysis) was beyond the scope of this study and is not considered in this report. We acknowledge that for work and health transitions that occur in the same period it is not possible to remove the issue of reverse causality - a review of the wider literature on this phenomenon would help put the results of this study into broader context.[footnote 3] The analysis aims to assess whether (and, if so, to what extent) experiencing a health transition affects the likelihood of undergoing a work transition. More specifically, it seeks to explore the impact of negative health transitions on negative work transitions (for example, the effect that the onset of a chronic condition or mental health problem has on employment exit), and the impact of positive health transitions on positive work transitions (for example, the effect of exiting poor health on employment entry).[footnote 4]
1.4. Data and methods
The statistical analysis uses data from Understanding Society (USoc) to achieve the project objectives outlined in section 1.2. Using this data source meant that issues around work and health transitions could be explored for a large number of individuals over the decade spanning from 2009 to 2018. As explained in section 2.1, the choice of USoc over other data sources (notably, BHPS) was dictated by the need to observe health trends and patterns over a more recent time period.
Health transitions are changes in an individual’s health state as described in the Definitions section. Health is measured using 5 different constructs, which vary across a number of dimensions such as:
- the health condition itself (mental health or psychological distress, long-term disability or illness, chronic condition or general health);
- who reported it (with the exception of chronic conditions, which are diagnosed by a doctor, all other health indicators are self-assessed); and
- whether it entailed a functional impairment (a distinction is drawn between limiting and non-limiting long-term disabilities or illnesses)[footnote 5]
This results in defining health transitions in 5 alternative ways (one for each health construct). Work transitions are changes in an individual’s labour market status or in-work conditions/employment contract arrangements. The labour market statuses of interest are employment and activity, and the work conditions include hours worked (the analysis differentiates between part- and full-time jobs), contract length (temporary versus permanent jobs), pay level (high- versus low-pay jobs) and satisfaction (whether employees are satisfied with their jobs or not).
The findings illustrated in this report are obtained using different statistical methods, each tailored to address specific research questions:
- impacts are assessed using a multiple regression approach, whereby possible determinants of health transitions which are also thought to be predictive of work transitions are controlled for. Within the regression framework, interaction terms are used to explore the existence of moderators of the impact of health transitions on work transitions
- survival analysis methods are used to study time to recover from poor health, time to relapse into poor health and time to experience the onset of a chronic condition. This entails estimating survival functions and discrete-time duration models
- sequence analysis is used to identify the most common patterns of employment status and in-work conditions observed for people following the onset of, and exit from, poor health. The empirical clustering of sequences allows for a visual understanding of the size of the groups who experience each pattern
1.5. Report outline
Chapter 2 describes the data sources. Chapter 3 illustrates the statistical methods used for the analysis of health and work transitions. Chapter 4 presents the empirical findings. Finally, Chapter 5 summarises the main results and presents conclusions. Six appendices provide further detail on the methodology adopted and the results.
2. Data
This chapter gives an overview of the data sources and outlines the variables used in the analysis. Basic statistics on health transitions are presented, along with characteristics and labour market outcomes of those who experience health transitions.
2.1. Data sources
The analysis for this report is conducted using individual data from Understanding Society (USoc). Information from the Labour Force Survey (LFS) is also used to explore the extent to which USoc data are representative of the general population experiencing health transitions. This section provides a brief overview of USoc and the LFS.
2.2.1. Understanding Society (USoc)
Understanding Society, also known as the UK Household Longitudinal Study (UKHLS), is a longitudinal survey of around 40,000 UK households recruited between 2009 and 2011 (when the fieldwork for the first wave of interviews took place) and re-interviewed at around one-year intervals through either face-to-face interview or self-completion online survey. At the time of this study, 8 USoc interview waves had been implemented. USoc collects information on demographics and circumstances of individuals and their households (including work, health, income and education characteristics) with the aim of helping understanding of how social and economic change affects the wellbeing of the UK population in the long-run. Anonymised USoc data are publicly available for download from the UK Data Service.
Around 6,000 participants from the British Household Panel Survey (BHPS), USoc’s predecessor which started in 1991, took part in USoc.[footnote 6] Although this provided the opportunity to link the 2 studies to create a longer panel of subjects, important changes were made, notably to questions affecting the health variables critical to this analysis. The lack of continuity between the 2 surveys meant that a decision had to be made as to which data source could be used for analysis of health and work transitions. Despite the shorter time period, USoc was chosen primarily because it enabled a more current analysis of trends and patterns in health and work.
Unless otherwise stated, the analysis for this report was conducted using data for working-age individuals, defined as people aged between 16 and 64 (inclusive), given the focus of the research on the study of work transitions.
2.1.2. Labour Force Survey (LFS)
The UK LFS is a nationally representative quarterly household survey containing a variety of labour market statistics that has been running since the mid-1970s. In this report we only use the data source as a consistency validation check for the frequency of health transitions observed in USoc. The main data source used for this purpose is the 5-quarter longitudinal LFS.
The quarterly cross-sectional LFS has information about health conditions (for example, musculoskeletal conditions, heart conditions and depression). These are not mutually exclusive - people can report up to 17 conditions at the same time. The longitudinal survey only keeps the 3 main conditions out of the 17 surveyed every wave.
The data are linked to create a balanced panel of about 4,000 people observed for one year, which is analysed with descriptive methods to provide checks on whether the volumes of health shocks reported in the USoc data are consistent with those reported in the LFS.
The main health problems recorded in the LFS generally differ from those reported in USoc, with the exception of 3 chronic conditions (diabetes, depression and epilepsy), which are consistent across the 2 surveys. We compare the frequency of health transitions related to these 3 conditions between LFS and USoc as a proxy for general consistency of health transition volumes (see Appendix 2). It does not appear that USoc underreports the extent of health transitions relative to the LFS, which is a larger survey and arguably more nationally representative than USoc.
2.2. Main variables
The variables used for the analysis of work and health transition can be divided into 3 groups:
i. health-related variables: those capturing the health state of USoc respondents
ii. work-related variables: those indicating an individual’s labour market status or work conditions
iii. other variables: those related to an individual’s demographics or general circumstances
This section provides detail on these 3 sets of variables.
2.2.1. Health-related variables
The analysis for this report used 5 indicators of health, each capturing a different aspect of an individual’s health state. These indicators, used to define health transitions (see section 2.3), are as follows:
- self-assessed general health: in USoc, survey respondents rate their health as poor, fair, good, very good or excellent. Those who reported good or better health at interview were classified as being in good health, while those who said that their health was poor or fair were considered as having poor health[footnote 7]
- mental health or psychological state: we describe someone as having a mental health condition or in psychological distress if their General Health Questionnaire (GHQ) score was 3 or higher[footnote 8]
- self-assessed long-standing illness or disability: in USoc, individuals are asked whether they have any long-standing physical or mental impairment, illness or disability (without specifying what the issue is). Anyone who answered positively to this question is classified as being in poor health, while those who answered negatively are regarded as being in good health
- self-assessed long-standing illness or disability entailing a functional impairment (‘limiting’): in USoc, those who report having a long-standing illness or disability (previous item) are asked whether this illness/disability affects their daily life across 12 functional impairments.[footnote 9] All individuals who indicated at least one functional impairment are considered as being in poor health. This health indicator is consistent with the Equality Act 2010 and the Government Statistical Service’s harmonised definition of disability (long-term condition affecting an individual’s ability to carry out day-to-day activities)
- any diagnosed chronic conditions: survey respondents are considered to have a chronic condition, and therefore be in poor health, if they indicated that a doctor or other health professional ever diagnosed them with one or more of 17 conditions listed.[footnote 10] A subject was considered to be in good health if they did not report any of these health problems[footnote 11]
2.2.2. Work-related variables
The following 6 work-related indicators are used to capture work transitions:
Transitions into and out of work/activity
- employment: an individual is considered employed if, at the interview date, they reported being a paid employee (full- or part-time), self-employed, on maternity leave, on a government training scheme, in unpaid family business or on an apprenticeship (the categories are mutually exclusive and each respondent can only indicate one). This definition of employment attempts to match that used by the ONS (for example, in the UK Labour Market statistics bulletin), which in turn follows guidelines set out by the International Labour Organisation (ILO)[footnote 12]
- economic activity: an individual is considered as economically active if, at the time of interview, they reported being employed (based on the definition above) or stated that they are unemployed but have actively been looking for a job in the last 4 weeks
Transitions whilst remaining in work
- job satisfaction: individuals who reported having worked in the last week, or not having worked last week but having a job, rate how satisfied they are with their present job. Those who report being somewhat satisfied, mostly satisfied or completely satisfied were classified as being satisfied
- pay: respondents are considered to be in a low-pay job if their hourly pay is below two-thirds of the wave-specific median hourly pay[footnote 13]
- temporary or permanent job: binary indicators are used to capture each
- full-time or part-time work: self-employed and paid-employees are considered to be in a full-time job if their weekly working hours exceeded 30 hours and in part-time work if they work 30 hours or less
2.2.3. Other variables
In addition to the health and work-related variables, the analysis used variables capturing the following demographics and circumstances of individuals:
- gender
- age: the focus of this study is on the working-age population so ages range between 16 and 64. The age categories 16 to 24, 25 to 34, 35 to 49, 50 to 59 and 60 to 64 are also used
- ethnicity: a binary indicator denoting whether the individual’s ethnicity is white or non-white[footnote 14]
- highest educational qualification: 6 categories, from the highest to the lowest: Degree, Other higher qualification, A-level or equivalent, GCSE or equivalent, Other qualification and No qualification
- marital status: dichotomous variable indicating whether the individual is married or in a civil partnership, as opposed to widowed, divorced or never married
- whether the respondent has any children in the household aged under 16: Yes/No
- home ownership: 3 binary variables were used, denoting whether the individual owns the property in which they live outright, through mortgage, or is renting it
- region of residence: 12 Government Office Regions - North East, North West, Yorkshire and the Humber, East Midlands, West Midlands, East of England, London, South East, South West, Wales, Scotland, and Northern Ireland[footnote 15]
For those employed, in addition to the variables listed in section 2.2.2 (used to define work transitions), the following work-related characteristics were also considered:
- occupation: 6 categories - professional, managerial and technical, skilled non-manual, skilled manual, partly skilled, and unskilled
- workplace size: 3 binary indicators are used, denoting whether the workplace in which the individual works has 1 to 24, 25 to 199 or over 200 employees[footnote 16]
2.3. Health and work transitions
2.3.1. Health transitions and patterns in USoc
For the purpose of this report a health or work transition is defined as a change in an individual’s health state (health transition) or labour market status/working conditions (work transition) between 2 consecutive USoc waves.[footnote 17] For example, if someone reports being in good health in their Wave 1 interview and in poor health in their Wave 2 interview then we can infer that they experienced a negative health transition at some (unspecified) point between the 2 interview dates. This is, of course, a simplification as we acknowledge that in reality multiple health transitions may have taken place between the 2 consecutive USoc waves. The exact time that the change in the individual’s health status happened remains unknown.
Table 2.1 shows the numbers of individuals who experienced negative and positive health transitions (‘Onset of poor health’ and ‘Exit from poor health’, respectively), and the numbers exhibiting other health patterns (‘Continuous good health’, ‘Continuous poor health’ and ‘Not classifiable’). These numbers are expressed as averages across the 7 transition periods observed in USoc (Wave 1 to Wave 2, Wave 2 to Wave 3, Wave 3 to Wave 4, Wave 4 to Wave 5, Wave 5 to Wave 6, Wave 6 to Wave 7, and Wave 7 to Wave 8). The table also shows what proportion of the (average) total number of individuals observed between 2 consecutive USoc waves each number represents.
Individuals classified as ‘Continuous good health’ are observed as being in good health at both a given wave and the next, while those who report poor health at both time points are defined as ‘Continuous poor health’. The ‘Not classifiable’ category is a residual group including all those whose health state is unknown at either or both interview dates. All individuals across the 5 categories considered are of working age at the point of transition. Health transitions and patterns are derived using each of the 5 health variables discussed in section 2.2.1:
- self-assessed (general) health
- mental health or psychological state
- self-assessed long-standing illness or disability
- self-assessed long-standing illness or disability entailing a functional impairment
- one or more diagnosed chronic conditions
The transition ‘Exit from poor health’ could not be explored for the construct ‘One or more chronic conditions’ because chronic conditions are persistent by definition.
As shown in Table 2.1, over 30,000 people are observed in any 2 consecutive USoc waves. The most frequently observed health transitions experienced by these individuals concerned onset of, and exit from, poor mental health/psychological state (almost 9% of the total sample, nearly 2,700 people). Smaller proportions were found to have experienced onset of, and exit from, self-assessed long-standing illness or disability (8.4% and 7.7%, respectively). Less than 6% experienced onset of, and exit from, poor self-assessed (general) health, and the same figure is observed when the health construct in question is a long-standing illness or disability entailing a functional impairment.
As expected, the most frequent pattern is observed for ‘Continuous good health’, which ranges between 54% and 76% (between some 16,000 and 23,000 individuals), depending on the health construct considered. The proportion of individuals classified as ‘Continuous poor health’ shows a certain degree of variability across the 5 health constructs considered, ranging between 9% (mental health) and 30% (chronic conditions).
Table 2.1 Health transitions and patterns (average counts and percentages across the 7 transition periods)
Health construct: Self-assessed (general) health:
| Health transition or pattern | Average count | Average percentage |
|---|---|---|
| Onset of poor health | 1,811.4 | 5.9 |
| Exit from poor health | 1,684.1 | 5.5 |
| Continuous good health | 23,113.7 | 76.0 |
| Continuous poor health | 3,206.1 | 10.5 |
| Not classifiable | 541.1 | 1.9 |
| Total | 30,356.6 | 100.0 |
Health construct: Mental health or psychological state:
| Health transition or pattern | Average count | Average percentage |
|---|---|---|
| Onset of poor health | 2,657.40 | 8.8 |
| Exit from poor health | 2,682.70 | 8.9 |
| Continuous good health | 16,158.70 | 53.5 |
| Continuous poor health | 2,763.00 | 9.1 |
| Not classifiable | 6,094.70 | 19.7 |
| Total | 30,356.60 | 100 |
Health construct: Self-assessed long-standing illness or disability:
| Health transition or pattern | Average count | Average percentage |
|---|---|---|
| Onset of poor health | 2,534.4 | 8.4 |
| Exit from poor health | 2,345.0 | 7.7 |
| Continuous good health | 19,219.9 | 63.3 |
| Continuous poor health | 6,202.3 | 20.4 |
| Not classifiable | 55.0 | 0.2 |
| Total | 30,356.6 | 100.0 |
Health construct: Self-assessed long-standing illness or disability entailing a functional impairment
| Health transition or pattern | Average count | Average percentage |
|---|---|---|
| Onset of poor health | 1,765.9 | 5.9 |
| Exit from poor health | 1,614.9 | 5.3 |
| Continuous good health | 23,039.7 | 75.9 |
| Continuous poor health | 3,306.9 | 10.9 |
| Not classifiable | 629.3 | 2.0 |
| Total | 30,356.6 | 100.0 |
Health construct: One or more diagnosed chronic conditions
| Health transition or pattern | Average count | Average percentage |
|---|---|---|
| Onset of poor health | 884.7 | 2.9 |
| Exit from poor health | NA | NA |
| Continuous good health | 20,268.4 | 66.6 |
| Continuous poor health | 9,203.4 | 30.5 |
| Not classifiable | 0.0 | 0.0 |
| Total | 30,356.6 | 100.0 |
Source: authors’ calculations based on data from Understanding Society.
In general, only a very small proportion (2% of respondents or less) cannot be classified into any transition/pattern type due to missing information about their health. However, the proportion is much higher for the mental health construct (almost 20%). Given that poor mental health tends to be under-reported, the proportion who report experiencing an onset of poor mental health (around 9%) is likely to be an underestimate of the real figure. As a consequence, the impact estimates for the onset of poor health in general, and poor mental health in particular, illustrated in Chapter 4 are likely to underestimate the real impact.[footnote 18]
2.3.2. Population at risk of making a transition
While identifying someone who experiences a specific health or work transition is straightforward, defining the group of people who could have experienced a transition but do not (providing the pool of potential comparators ‘at risk’ to be used in the estimation of impacts) is more problematic. For example, if our focus is on transitions from good to poor health, among those who do not experience such transitions we can include people categorised as ‘Continuous good health’, ‘Continuous poor health’ and ‘Not classifiable’. Comparability between people who experience onset of poor health and people who are continuously in poor health (or between those who experience exit from poor health and individuals continuously in good health) is questionable as, it would be argued, the latter are not at risk of experiencing the transition in the first place: the 2 groups exhibit different health states to start with.[footnote 19] For this reason, unless otherwise stated, in the remainder of the report when we contrast individuals who experience a given health transition and individuals who do not, the latter group will only be comprised of people at risk of experiencing the transition in question.
Table 2.2 shows the numbers of individuals experiencing negative and positive health transitions (onset of, and exit from, poor health, respectively) for each of the 5 health constructs, and the sizes of the populations at risk of making the transitions (in brackets). The table also indicates what percentage of the at-risk population the individuals who make the transition represent. Also in this case, figures are expressed as averages across the 7 transition periods observed in USoc.
With regards to negative health transitions, 1 in 7 (14.1%) individuals at risk of experiencing onset of a mental health problem or psychological distress (almost 19,000 people) actually experienced one, while almost 1 in 8 (11.7%) of those at risk of a long-standing illness or disability onset (nearly 22,000 people) experienced one. Onset of (self-assessed) poor health was experienced by around 1 in 14 individuals at risk, and a similar proportion was observed for onset of a (limiting) long-standing illness or disability. Only 1 in 25 individuals (4.1%) at risk of experiencing onset of a chronic condition developed one or more conditions.
Compared to negative health transitions, positive health transitions (exits from poor health), are observed for much larger proportions of the populations at risk. For example, 1 in 2 (49.3%) individuals at risk of recovering from poor mental health actually experienced an improvement in their mental health state within one year. Among those at risk of exiting poor (self-assessed) health, 1 in 3 experienced the transition, and the same was true when poor health is defined based on a (self-assessed) long-standing illness or disability. When the illness was classified as limiting, 1 in 4 among the at-risk population was found to have exited poor health. The larger proportion of individuals experiencing positive health transitions compared to negative health transitions is attributable to a much smaller base (sample size of the at-risk population). As we saw in Table 2.1, the pattern ‘Continuous poor health’ is not as frequent as the pattern ‘Continuous good health’, as most survey respondents are in good health.
Table 2.2 Individuals experiencing each health transition as a percentage of the population at risk of making the transition (averages across the 7 transition
| Negative health transition | Average Count | Average Percentage |
|---|---|---|
| Onset of poor (self-assessed) health | 1811.4 (24,925.1) | 7.2 |
| Onset of mental health problem/psychological distress | 2657.4 (18,816.1) | 14.1 |
| Onset of (self-assessed) long-standing illness or disability | 2534.4 (21,754.3) | 11.7 |
| Onset of (self-assessed) long-standing illness or disability entailing a functional impairment | 1765.9 (24,805.6) | 7.2 |
| Onset of one or more (diagnosed) chronic conditions | 884.7 (21,153.1) | 4.1 |
| Positive health transition | Average Count | Average Percentage |
|---|---|---|
| Exit from poor (self-assessed) health | 1684.1 (4,890.3) | 34.3 |
| Exit from mental health problem/psychological distress | 2682.7 (5,445.7) | 49.3 |
| Exit from (self-assessed) long-standing illness or disability | 2345.0 (8,547.3) | 27.3 |
| Exit from (self-assessed) long-standing illness or disability entailing a functional impairment | 1614.9 (4,921.7) | 32.6 |
Source: authors’ calculations based on data from Understanding Society
2.3.3. Characteristics of those who experience health transitions
The impact of health transitions on work transitions is defined as the difference between the proportions experiencing work transitions among individuals who undergo health transitions and among individuals who do not. However, meaningful comparisons must take into account any important, systematic differences between these 2 groups, particularly in the period prior to the health transitions (at the baseline), that may explain differences in the likelihood of undergoing the transitions.
Tables 2.3 and 2.4 compare individuals who experience onset of poor health and exit from poor health, respectively, with those who do not, across a range of characteristics observed immediately before the health transitions take place (specifically, at the first of the 2 waves defining each transition). In the tables, instances in which the proportion with a given characteristic differs between the 2 groups is indicated with 3 or 2 asterisks (denoting statistical significance at the 1 and 5% level, respectively). Due to different numbers of missing observations across the variables considered, the sample sizes vary depending on the characteristic in question (the largest and smallest sizes are reported in the tables).
As Table 2.3 shows, a large number of statistically significant differences were detected, suggesting that those who underwent negative health transitions and those who did not are different when compared across the features explored. For example, those who experienced onset of poor health are less likely to have a job, be male, have children under 16, be mortgaged property-owners and have a degree.
While these findings are consistent across the 5 health constructs explored, other results vary depending on the health measure used. For example, people who experienced an incident health problem are found to be, on average, older than those who did not. However, this finding is reversed when health is measured through mental health or psychological distress. A lower proportion of those who experienced an incident health problem are married or in a civil partnership compared to those who did not. However, a greater proportion were married or in a civil partnership among those who experienced an onset of self-assessed long-standing illness or disability (limiting or non-limiting) or of a chronic condition compared those who did not.
As shown in Table 2.4, the findings for positive health transitions are broadly consistent with those for negative health transitions.
Table 2.3 Characteristics of individuals who experience an onset of poor health (averages across the 7 transition periods)
Self-assessed (general) health:
| Individual characteristic | No onset | Onset | |
|---|---|---|---|
| Employed (%) | 74.6 | *** | 63.2 |
| Active (%) | 76.6 | *** | 68.2 |
| Male (%) | 46.2 | *** | 43.2 |
| Age (mean, in years) | 39.4 | *** | 42.3 |
| Married or in civil partnership (%) | 52.5 | *** | 49.1 |
| Highest qualification: Degree (%) | 29.6 | *** | 19.2 |
| Highest qualification: Other higher (%) | 12.1 | *** | 10.9 |
| Highest qualification: A level (%) | 24.0 | *** | 21.4 |
| Highest qualification: GCSE (%) | 22.2 | *** | 25.8 |
| Highest qualification: Other lower (%) | 6.6 | *** | 10.0 |
| No qualification (%) | 5.6 | *** | 12.6 |
| Region: North East (%) | 3.6 | 3.7 | |
| Region: North West (%) | 10.0 | 9.9 | |
| Region: Yorkshire and the Humber (%) | 8.0 | *** | 8.9 |
| Region: East Midlands (%) | 7.5 | 8.0 | |
| Region: West Midlands (%) | 7.9 | *** | 9.2 |
| Region: East of England (%) | 8.6 | 8.3 | |
| Region: London (%) | 13.4 | 13.6 | |
| Region: South East (%) | 12.3 | *** | 10.9 |
| Region: South West (%) | 7.9 | ** | 7.3 |
| Region: Wales | 6.4 | ** | 6.9 |
| Region: Scotland | 8.4 | *** | 7.3 |
| Region: Northern Ireland | 6.0 | 6.1 | |
| White ethnicity (%) | 82.5 | *** | 79.6 |
| Any children under 16 (%) | 37.9 | *** | 36.3 |
| Homeowner (%) | 20.9 | ** | 20 |
| Mortgage (%) | 52.6 | *** | 41.5 |
| Renting (%) | 26.4 | *** | 38.3 |
| Minimum sample size | 151,266 | 11,886 | |
| Maximum sample size | 161,796 | 12,680 |
Mental health or psychological distress:
| Individual characteristic | No onset | Onset | |
|---|---|---|---|
| Employed (%) | 75.1 | *** | 68.8 |
| Active (%) | 76.9 | *** | 71.6 |
| Male (%) | 46.4 | *** | 37.9 |
| Age (mean, in years) | 41.4 | *** | 39.8 |
| Married or in civil partnership (%) | 54.8 | *** | 47.8 |
| Highest qualification: Degree (%) | 28.6 | 28.5 | |
| Highest qualification: Other higher (%) | 12.4 | 12.0 | |
| Highest qualification: A level (%) | 23.3 | 22.8 | |
| Highest qualification: GCSE (%) | 22.4 | 22.5 | |
| Highest qualification: Other lower (%) | 7.3 | 7.1 | |
| No qualification (%) | 5.9 | *** | 7.1 |
| Region: North East (%) | 3.8 | 3.9 | |
| Region: North West (%) | 10.1 | ** | 10.7 |
| Region: Yorkshire and the Humber (%) | 7.9 | 8.1 | |
| Region: East Midlands (%) | 7.5 | 7.4 | |
| Region: West Midlands (%) | 7.7 | *** | 8.7 |
| Region: East of England (%) | 8.6 | 8.5 | |
| Region: London (%) | 11.3 | *** | 11.9 |
| Region: South East (%) | 12.3 | 12.5 | |
| Region: South West (%) | 8.4 | 8.3 | |
| Region: Wales | 6.7 | 6.4 | |
| Region: Scotland | 9.2 | *** | 8.2 |
| Region: Northern Ireland | 6.4 | *** | 5.5 |
| White ethnicity (%) | 85.8 | *** | 83.6 |
| Any children under 16 (%) | 36.4 | 36.9 | |
| Homeowner (%) | 22.6 | *** | 18.3 |
| Mortgage (%) | 51.7 | *** | 48.9 |
| Renting (%) | 25.6 | *** | 32.7 |
| Minimum sample size | 111,782 | 18,372 | |
| Maximum sample size | 113,111 | 18,602 |
Self-assessed long-standing illness or disability:
| Individual characteristic | No onset | Onset | |
|---|---|---|---|
| Employed (%) | 74.0 | *** | 70.9 |
| Active (%) | 76.1 | *** | 74.7 |
| Male (%) | 46.5 | *** | 43.9 |
| Age (mean, in years) | 38.0 | *** | 43.3 |
| Married or in civil partnership (%) | 51.0 | *** | 54.6 |
| Highest qualification: Degree (%) | 29.0 | *** | 24.4 |
| Highest qualification: Other higher (%) | 11.5 | ** | 12.1 |
| Highest qualification: A level (%) | 24.5 | *** | 21.8 |
| Highest qualification: GCSE (%) | 22.7 | ** | 23.4 |
| Highest qualification: Other lower (%) | 6.4 | *** | 9.0 |
| No qualification (%) | 5.9 | *** | 9.4 |
| Region: North East (%) | 3.5 | ** | 3.9 |
| Region: North West (%) | 9.9 | 9.9 | |
| Region: Yorkshire and the Humber (%) | 8.2 | 8.3 | |
| Region: East Midlands (%) | 7.2 | *** | 7.9 |
| Region: West Midlands (%) | 8.1 | 8.5 | |
| Region: East of England (%) | 8.5 | 8.6 | |
| Region: London (%) | 15.0 | *** | 13.1 |
| Region: South East (%) | 11.7 | 11.6 | |
| Region: South West (%) | 7.3 | *** | 8.1 |
| Region: Wales | 6.2 | *** | 6.9 |
| Region: Scotland | 8.0 | 8.1 | |
| Region: Northern Ireland | 6.3 | *** | 5.2 |
| White ethnicity (%) | 79.3 | *** | 82.4 |
| Any children under 16 (%) | 39.9 | *** | 34.9 |
| Homeowner (%) | 19.2 | *** | 22.8 |
| Mortgage (%) | 52.6 | *** | 46.7 |
| Renting (%) | 28.1 | *** | 30.3 |
| Minimum sample size | 125,126 | 16,717 | |
| Maximum sample size | 134,539 | 17,741 |
Self-assessed long-standing illness or disability (limiting):
| Individual characteristic | No onset | Onset | |
|---|---|---|---|
| Employed (%) | 74.4 | *** | 65.6 |
| Active (%) | 76.6 | *** | 70.4 |
| Male (%) | 46.2 | *** | 41.5 |
| Age (mean, in years) | 39.0 | *** | 44.1 |
| Married or in civil partnership (%) | 52.1 | 52.5 | |
| Highest qualification: Degree (%) | 29.2 | *** | 21.5 |
| Highest qualification: Other higher (%) | 11.8 | 11.9 | |
| Highest qualification: A level (%) | 24.0 | *** | 20.8 |
| Highest qualification: GCSE (%) | 22.4 | *** | 24.3 |
| Highest qualification: Other lower (%) | 6.6 | *** | 10.1 |
| No qualification (%) | 6.0 | *** | 11.4 |
| Region: North East (%) | 3.6 | 3.9 | |
| Region: North West (%) | 9.9 | 10.1 | |
| Region: Yorkshire and the Humber (%) | 8.2 | 8.3 | |
| Region: East Midlands (%) | 7.5 | 7.8 | |
| Region: West Midlands (%) | 8.1 | *** | 8.9 |
| Region: East of England (%) | 8.6 | ** | 8.0 |
| Region: London (%) | 14.3 | *** | 12.2 |
| Region: South East (%) | 11.9 | 11.4 | |
| Region: South West (%) | 7.6 | 7.8 | |
| Region: Wales | 6.3 | *** | 7.0 |
| Region: Scotland | 8.1 | 8.3 | |
| Region: Northern Ireland | 6.0 | 6.3 | |
| White ethnicity (%) | 80.8 | *** | 82.7 |
| Any children under 16 (%) | 38.9 | *** | 33.2 |
| Homeowner (%) | 20.1 | *** | 22.3 |
| Mortgage (%) | 52.3 | *** | 42.6 |
| Renting (%) | 27.5 | *** | 34.9 |
| Minimum sample size | 151,524 | 12,036 | |
| Maximum sample size | 161,278 | 12,361 |
One or more chronic conditions:
| Individual characteristic | No onset | Onset | |
|---|---|---|---|
| Employed (%) | 72.2 | *** | 68.7 |
| Active (%) | 74.6 | *** | 72.3 |
| Male (%) | 47.9 | *** | 42.0 |
| Age (mean, in years) | 37.9 | *** | 43.4 |
| Married or in civil partnership (%) | 50.1 | *** | 54.9 |
| Highest qualification: Degree (%) | 28.4 | *** | 22.8 |
| Highest qualification: Other higher (%) | 11.2 | 11.9 | |
| Highest qualification: A level (%) | 24.4 | *** | 21.3 |
| Highest qualification: GCSE (%) | 22.8 | *** | 24.4 |
| Highest qualification: Other lower (%) | 6.6 | *** | 8.8 |
| No qualification (%) | 6.6 | *** | 10.7 |
| Region: North East (%) | 3.5 | 3.7 | |
| Region: North West (%) | 9.5 | 10.1 | |
| Region: Yorkshire and the Humber (%) | 8.2 | 8.6 | |
| Region: East Midlands (%) | 7.4 | 6.8 | |
| Region: West Midlands (%) | 7.9 | 8.0 | |
| Region: East of England (%) | 8.3 | 8.6 | |
| Region: London (%) | 14.2 | *** | 12.9 |
| Region: South East (%) | 11.8 | 11.9 | |
| Region: South West (%) | 7.6 | 7.6 | |
| Region: Wales | 6.6 | 6.7 | |
| Region: Scotland | 8.4 | 8.6 | |
| Region: Northern Ireland | 6.7 | 6.6 | |
| White ethnicity (%) | 80.6 | *** | 82.7 |
| Any children under 16 (%) | 39.1 | *** | 35.8 |
| Homeowner (%) | 19.2 | *** | 22.2 |
| Mortgage (%) | 52.1 | *** | 45.4 |
| Renting (%) | 28.6 | *** | 32.2 |
| Minimum sample size | 129,989 | 5,776 | |
| Maximum sample size | 141,879 | 6,193 |
*** and ** denote whether the difference in proportions between the Onset and No onset groups is statistically significant at the 1 and 5% level, respectively. The number of observations varies depending on the variable explored (the minimum and maximum numbers are reported). Source: authors’ calculations based on data from Understanding Society
Table 2.4 Characteristics of individuals who experience an exit from poor health (averages across the 7 transition periods)
Self-assessed (general) health:
| Individual characteristic | No exit | Exit | |
|---|---|---|---|
| Employed (%) | 37.7 | *** | 61.6 |
| Active (%) | 44.4 | *** | 66.9 |
| Male (%) | 40.4 | *** | 43.3 |
| Age (mean, in years) | 47.7 | *** | 42.1 |
| Married or in civil partnership (%) | 48.2 | 48.3 | |
| Highest qualification: Degree (%) | 13.3 | *** | 19.1 |
| Highest qualification: Other higher (%) | 9.9 | *** | 11.1 |
| Highest qualification: A level (%) | 18.5 | *** | 21.6 |
| Highest qualification: GCSE (%) | 23.1 | *** | 25.5 |
| Highest qualification: Other lower (%) | 13.2 | *** | 10.0 |
| No qualification (%) | 22.0 | *** | 12.8 |
| Region: North East (%) | 4.7 | *** | 3.7 |
| Region: North West (%) | 10.9 | 10.3 | |
| Region: Yorkshire and the Humber (%) | 8.7 | 9.0 | |
| Region: East Midlands (%) | 7.7 | 8.1 | |
| Region: West Midlands (%) | 9.3 | 9.0 | |
| Region: East of England (%) | 7.4 | *** | 8.4 |
| Region: London (%) | 11.0 | *** | 13.8 |
| Region: South East (%) | 9.9 | ** | 10.6 |
| Region: South West (%) | 7.4 | 7.2 | |
| Region: Wales | 7.1 | 6.6 | |
| Region: Scotland | 8.2 | *** | 7.2 |
| Region: Northern Ireland | 7.6 | *** | 6.1 |
| White ethnicity (%) | 82.7 | *** | 79.2 |
| Any children under 16 (%) | 26.2 | *** | 36.2 |
| Homeowner (%) | 20.6 | ** | 19.7 |
| Mortgage (%) | 31.5 | *** | 41.5 |
| Renting (%) | 47.7 | *** | 38.6 |
| Minimum sample size | 21,255 | 11,046 | |
| Maximum sample size | 22,443 | 11,789 |
Mental health or psychological distress:
| Individual characteristic | No exit | Exit | |
|---|---|---|---|
| Employed (%) | 52.1 | *** | 65.3 |
| Active (%) | 57.3 | *** | 68.9 |
| Male (%) | 33.6 | *** | 37.7 |
| Age (mean, in years) | 41.2 | *** | 40.0 |
| Married or in civil partnership (%) | 41.9 | *** | 47.0 |
| Highest qualification: Degree (%) | 22.1 | *** | 28.9 |
| Highest qualification: Other higher (%) | 11.7 | 12.2 | |
| Highest qualification: A level (%) | 22.2 | ** | 23.2 |
| Highest qualification: GCSE (%) | 23.9 | *** | 21.6 |
| Highest qualification: Other lower (%) | 9.5 | *** | 7.1 |
| No qualification (%) | 10.6 | *** | 7.0 |
| Region: North East (%) | 4.0 | 3.7 | |
| Region: North West (%) | 11.2 | 10.6 | |
| Region: Yorkshire and the Humber (%) | 8.5 | 8.2 | |
| Region: East Midlands (%) | 7.4 | 7.6 | |
| Region: West Midlands (%) | 9.4 | 8.8 | |
| Region: East of England (%) | 7.8 | *** | 8.7 |
| Region: London (%) | 12.0 | 12.2 | |
| Region: South East (%) | 11.5 | ** | 12.4 |
| Region: South West (%) | 7.3 | *** | 8.1 |
| Region: Wales | 7.0 | *** | 6.3 |
| Region: Scotland | 8.3 | 7.9 | |
| Region: Northern Ireland | 5.7 | 5.6 | |
| White ethnicity (%) | 82.7 | ** | 83.5 |
| Any children under 16 (%) | 33.6 | *** | 36.8 |
| Homeowner (%) | 16.8 | *** | 18.0 |
| Mortgage (%) | 41.0 | *** | 49.2 |
| Renting (%) | 42.1 | *** | 32.6 |
| Minimum sample size | 19,132 | 18,548 | |
| Maximum sample size | 19,341 | 18,779 |
Self-assessed long-standing illness or disability:
| Individual characteristic | No exit | Exit | |
|---|---|---|---|
| Employed (%) | 52.1 | *** | 70.3 |
| Active (%) | 56.9 | *** | 73.8 |
| Male (%) | 42.2 | *** | 44.1 |
| Age (mean, in years) | 46.7 | *** | 43.4 |
| Married or in civil partnership (%) | 46.7 | *** | 54.6 |
| Highest qualification: Degree (%) | 46.7 | *** | 25.3 |
| Highest qualification: Other higher (%) | 46.7 | 12.1 | |
| Highest qualification: A level (%) | 46.7 | *** | 21.7 |
| Highest qualification: GCSE (%) | 46.7 | 22.9 | |
| Highest qualification: Other lower (%) | 46.7 | *** | 8.7 |
| No qualification (%) | 46.7 | *** | 9.2 |
| Region: North East (%) | 46.7 | *** | 3.6 |
| Region: North West (%) | 46.7 | *** | 9.8 |
| Region: Yorkshire and the Humber (%) | 46.7 | 8.6 | |
| Region: East Midlands (%) | 46.7 | *** | 7.7 |
| Region: West Midlands (%) | 46.7 | 8.2 | |
| Region: East of England (%) | 46.7 | ** | 8.5 |
| Region: London (%) | 46.7 | *** | 12.9 |
| Region: South East (%) | 46.7 | *** | 12.3 |
| Region: South West (%) | 46.7 | 8.0 | |
| Region: Wales | 46.7 | *** | 6.4 |
| Region: Scotland | 46.7 | 8.7 | |
| Region: Northern Ireland | 46.7 | *** | 5.3 |
| White ethnicity (%) | 46.7 | *** | 83.6 |
| Any children under 16 (%) | 46.7 | *** | 35.1 |
| Homeowner (%) | 46.7 | 23.0 | |
| Mortgage (%) | 46.7 | *** | 47.2 |
| Renting (%) | 46.7 | *** | 29.6 |
| Minimum sample size | 41,326 | 15,554 | |
| Maximum sample size | 43,416 | 16,415 |
Self-assessed long-standing illness or disability (limiting):
| Individual characteristic | No exit | Exit | |
|---|---|---|---|
| Employed (%) | 37.6 | *** | 64.2 |
| Active (%) | 43.8 | *** | 68.6 |
| Male (%) | 38.8 | *** | 41.0 |
| Age (mean, in years) | 47.8 | *** | 44.2 |
| Married or in civil partnership (%) | 47.0 | *** | 53.2 |
| Highest qualification: Degree (%) | 14.8 | *** | 21.8 |
| Highest qualification: Other higher (%) | 11.1 | *** | 12.1 |
| Highest qualification: A level (%) | 18.2 | *** | 20.8 |
| Highest qualification: GCSE (%) | 23.2 | 24.0 | |
| Highest qualification: Other lower (%) | 12.9 | *** | 9.9 |
| No qualification (%) | 19.8 | *** | 11.3 |
| Region: North East (%) | 4.6 | *** | 3.7 |
| Region: North West (%) | 10.8 | 10.3 | |
| Region: Yorkshire and the Humber (%) | 8.4 | 8.6 | |
| Region: East Midlands (%) | 7.4 | 7.9 | |
| Region: West Midlands (%) | 8.0 | ** | 8.7 |
| Region: East of England (%) | 7.2 | ** | 7.9 |
| Region: London (%) | 10.7 | 11.3 | |
| Region: South East (%) | 10.3 | *** | 11.9 |
| Region: South West (%) | 8.1 | 7.9 | |
| Region: Wales | 7.3 | 7.0 | |
| Region: Scotland | 9.1 | 8.4 | |
| Region: Northern Ireland | 8.1 | *** | 6.4 |
| White ethnicity (%) | 85.9 | *** | 84.2 |
| Any children under 16 (%) | 24.7 | *** | 33.4 |
| Homeowner (%) | 22.2 | 22.7 | |
| Mortgage (%) | 31.1 | *** | 43.2 |
| Renting (%) | 46.5 | *** | 33.9 |
| Minimum sample size | 22,967 | 11,209 | |
| Maximum sample size | 23,148 | 11,304 |
*** and ** denote whether the difference in proportions between the Exit and No exit groups is statistically significant at the 1 and 5% level, respectively. The number of observations varies depending on the variable explored (the minimum and maximum numbers are reported). Source: authors’ calculations based on data from Understanding Society
2.4. Time of impact, size of impact, sample sizes and rare events
A key question concerns the time between an initial health transition and the subsequent work transition. Understanding when a work transition occurs in relation to a health transition has important implications. For example, it may help understand the potential time frame available for policy makers to intervene to minimise the (negative) employment impact of an incident health problem.
Knowing the magnitude of the impact of health transitions on work transitions, and how many people experience a work transition at each point in time following the initial health shock, are other important aspects that may help inform policy development.
Knowing the observed numbers experiencing work transitions, and the proportions of the at-risk samples that they represent, helps us identify the best approach to statistical analysis. For example, as a work transition following a health transition is a relatively rare phenomenon observed in USoc, some adjustments to our models and estimating specifications are required to attempt to avoid introducing bias to our results.[footnote 20] These aspects were explored empirically in relation to specific work transitions. This section summarises the main findings (details on the analysis are reported in Appendix 1).
While the term ‘impact’ is often used in this section, the figures reported are only indicative of the causal effect of health transitions on work transitions as they are based on simple differences in the proportion experiencing work transitions between those who underwent health transitions and those who did not, without controlling for those baseline differences which section 2.2.3 has shown to be important. Indicative impacts are explored to provide some insights into the most appropriate methodology and data set-up to estimate impacts (more reliable impact estimates, which account for baseline differences, are reported in Chapter 4).
2.4.1. Time and size of the impact
The findings from the preliminary analysis of health and work transitions suggest that:
- health transitions have an impact on work transitions - experiencing onset of poor health increases the likelihood of exiting employment (and economic activity), and recovering from poor health improves people’s chances of entering employment (and activity);
- the magnitude of the impact differs across the health constructs explored, and varies considerably depending on which cohort is observed (each cohort is composed of people at risk of making a health transition between 2 consecutive USoc waves);[footnote 21]
- the greatest impact is observed in the same period that individuals experienced the health shock (contemporaneous health and work transitions); and
- the impact progressively reduces to become negligible around 3 years after the initial health transition
Based on these findings, it seems appropriate to assess the magnitude of the impact of health transitions on work transitions considering different cohorts, as the existence of time-specific effects would mean that people undergoing an onset of (or exit from) poor health at different times may experience different impacts. To account for this, a multi-cohort (repeated cross-section) approach can be used (see Chapter 3). Outcomes (work transitions) for the whole cohort (those experiencing a health transition and those considered at risk) should be observed for at least 3 years. Finally, contemporaneous associations between health and work transitions appear to be the largest, and on this basis deserve exploration, notwithstanding the issue of reverse causality described in section 1.3.
2.4.2. Sample size and rare events issues
The preliminary analysis also explored, separately for each cohort, the number of people for whom a negative or positive work transition is observed at each point in time after being considered at risk of experiencing a health transition. As shown in Table 2.5 (first row, first column), 1,156 people were found to have exited employment at time 0 (between Wave 1 and Wave 2). These people represent 4.6% of the sample of those at risk of making a negative health transition in the same period (25,077 people). The number (and proportion) who experienced an exit from employment among those at risk of making a negative health transition decreases at later time points (only 380 individuals, making up 1.5% of the at-risk sample, exited employment at time 3). As we can see from Table 2.6, both sample sizes and frequencies of work transitions are smaller when positive (rather negative) health-work transitions are considered. Pooling together different health transition cohorts (an approach aimed at controlling for possible time-specific effects in the estimation of associations, as previously explained) also addresses the potential estimation bias generated by rare events as well as boosting sample sizes.
Table 2.5 Employment exit among those at risk of experiencing onset of poor health between Waves 1 and 2 (numbers and proportion of total sample at risk)
Poor self-assessed health:
| Time | Number | % |
|---|---|---|
| 0 | 1,156 | 4.6 |
| 1 | 682 | 2.7 |
| 2 | 463 | 1.8 |
| 3 | 380 | 1.5 |
| 4 | 348 | 1.4 |
| 5 | 296 | 1.2 |
| 6 | 257 | 1.0 |
| Sample size | 25,077 | 100.0 |
Mental health or psychological distress:
| Time | Number | % |
|---|---|---|
| 0 | 772 | 4.6 |
| 1 | 510 | 3.0 |
| 2 | 352 | 2.1 |
| 3 | 280 | 1.7 |
| 4 | 253 | 1.5 |
| 5 | 224 | 1.3 |
| 6 | 203 | 1.2 |
| Sample size | 16,831 | 100.0 |
Long-standing illness or disability:
| Time | Number | % |
|---|---|---|
| 0 | 955 | 4.5 |
| 1 | 540 | 2.6 |
| 2 | 375 | 1.8 |
| 3 | 284 | 1.3 |
| 4 | 247 | 1.2 |
| 5 | 208 | 1.0 |
| 6 | 187 | 0.9 |
| Sample size | 21,161 | 100.0 |
Long-standing illness or disability (limiting):
| Time | Number | % |
|---|---|---|
| 0 | 1,117 | 4.6 |
| 1 | 644 | 2.7 |
| 2 | 449 | 1.9 |
| 3 | 358 | 1.5 |
| 4 | 316 | 1.3 |
| 5 | 256 | 1.1 |
| 6 | 232 | 1.0 |
| Sample size | 24,242 | 100.0 |
One or more chronic conditions:
| Time | Number | % |
|---|---|---|
| 0 | 967 | 4.5 |
| 1 | 543 | 2.5 |
| 2 | 367 | 1.7 |
| 3 | 280 | 1.3 |
| 4 | 261 | 1.2 |
| 5 | 217 | 1.0 |
| 6 | 186 | 0.9 |
| Sample size | 21,542 | 100.0 |
Source: authors’ calculations based on data from Understanding Society
Table 2.6 Employment entry among those at risk of experiencing exit from poor health between Waves 1 and 2 (numbers and proportion of total sample at risk)
Poor self-assessed health:
| Time | Number | % |
|---|---|---|
| 0 | 242 | 4.3 |
| 1 | 125 | 2.2 |
| 2 | 79 | 1.4 |
| 3 | 67 | 1.2 |
| 4 | 39 | 0.7 |
| 5 | 30 | 0.5 |
| 6 | 20 | 0.4 |
| Sample size | 5,569 | 100.0 |
Mental health or psychological distress:
| Time | Number | % |
|---|---|---|
| 0 | 321 | 6.7 |
| 1 | 155 | 3.2 |
| 2 | 81 | 1.7 |
| 3 | 74 | 1.5 |
| 4 | 52 | 1.1 |
| 5 | 28 | 0.6 |
| 6 | 19 | 0.4 |
| Sample size | 4,800 | 100.0 |
Long-standing illness or disability:
| Time | Number | % |
|---|---|---|
| 0 | 379 | 4.0 |
| 1 | 199 | 2.1 |
| 2 | 116 | 1.2 |
| 3 | 99 | 1.0 |
| 4 | 60 | 0.6 |
| 5 | 56 | 0.6 |
| 6 | 28 | 0.3 |
| Sample size | 9,466 | 100.0 |
Long-standing illness or disability (limiting):
| Time | Number | % |
|---|---|---|
| 0 | 234 | 4.1 |
| 1 | 127 | 2.2 |
| 2 | 72 | 1.2 |
| 3 | 65 | 1.1 |
| 4 | 40 | 0.7 |
| 5 | 39 | 0.7 |
| 6 | 22 | 0.4 |
| Sample size | 5,767 | 100.0 |
Source: authors’ calculations based on data from Understanding Society
3. Research methods
This chapter provides a brief description of the methods used to address the research questions explored in this report. The statistical association between health and work transitions, and the role of individual characteristics in moderating this association, are assessed using multiple regression analysis. Time to recover from and relapse into poor health (and time to develop a chronic condition) are explored using survival analysis techniques. Finally, sequence analysis is used to explore the most common patterns of employment statuses and in-work conditions experienced by individuals following an initial health transition.
3.1. Multiple regression analysis
3.1.1. Regression approach
The association between an individual’s health transition and a change in their labour market status or work conditions is explored by means of multiple logistic regression analysis. This entails modelling a binary variable, indicating whether an individual experienced a work transition, as a function of another binary variable, denoting a health transition, and other control variables capturing the individual’s characteristics and circumstances (these are outlined in section 2.2.3).
To provide a measure of the impact of a health transition on a work transition, the health transition is observed earlier in time than the work transition, and the individual characteristics are observed at the baseline before the health transition takes place (in this way their role as determinants of the health transition can be explored). For example, any health transition taking place between Wave 1 and Wave 2 is potentially determined by an individual’s characteristics observed at Wave 1, and the impact of this health transition on work transitions taking place in later periods is explored. Figure 3.1 illustrates this. As the preliminary analysis, reported in the previous chapter, suggested that the greatest impact on employment exit and entry appears to be in the same period as the health transition, the impact on contemporaneous work transitions (0 years after) is also investigated. However, we acknowledge that for work and health transitions that occur in the same period, using annual data points, it is not possible to remove the issue of reverse causality, whereby employment transitions have an impact on health transitions. A review of the wider literature on this phenomenon would help put the results of this study into broader context.
Figure 3.1 Impact of health transitions between Wave 1 and Wave 2 on contemporaneous and subsequent work transitions
| Wave 1 | Wave 2 | Wave 3 | Wave 4 |
|---|---|---|---|
| Individual characteristics | |||
| Health transition between Wave 1 and Wave 2 | Health transition between Wave 1 and Wave 2 | ||
| Work transition between Wave 1 and Wave 2 (0 years after) | Work transition between Wave 1 and Wave 2 (0 years after) | ||
| Work transition between Wave 2 and Wave 3 (1 year after) | Work transition between Wave 2 and Wave 3 (1 year after) | ||
| Wave transition between Wave 3 and Wave 4 (2 years after) | Wave transition between Wave 3 and Wave 4 (2 years after) |
A logistic regression model is used to predict the probability of experiencing a work transition conditional on health transitions and other individual characteristics and circumstances.[footnote 22]
3.1.2. Analysis set-up
The fact that work transitions are a relatively rare phenomenon, and the need to observe impacts over a minimum of 3 years after the initial health transition (up to time 3), are addressed simultaneously in the logistic regression analysis using a repeated cross-section approach. Four cross sections (or cohorts) of individuals who are at risk of experiencing a health transition over different periods (namely, between Wave 1 and Wave 2, Wave 2 and Wave 3, Wave 3 and Wave 4, and Wave 4 and Wave 5) are pooled together and the impact of health transitions over a 3-year follow-up period is explored.
The analysis set-up described above is outlined in Figure 3.2. Each cohort (in grey) includes both individuals who experienced a health transition over the period in question and individuals who did not. The latter group is used as the comparator for the former in the estimation of impacts.[footnote 23]
Estimating impacts within a regression framework under a repeated cross-section set-up entails regressing a binary indicator for whether the person undergoes a specific work transition at a given time (0, 1, 2 or 3 years after the health transition) against a set of regressors which includes the health transition binary indicator and other covariates capturing the individual’s characteristics and circumstances observed at the baseline. Time dummies are also included among the regressors to capture the specific cohort, that is the period in which people are being considered to be at risk of experiencing a health transition.[footnote 24] Whenever multiple transitions are observed for an individual (for example, 2 onsets of poor health, one between Wave 1 and Wave 2 and another between Wave 4 and Wave 5) only the first transition is considered.
Figure 3.2 Analysis set-up (repeated cross-section approach)
| Wave 1 | Wave 2 | Wave 3 | Wave 4 | Wave 5 | Wave 6 | Wave 7 | Wave 8 |
|---|---|---|---|---|---|---|---|
| HT (W1 to W2) | HT (W1 to W2) | ||||||
| WT (W1 to W2) | WT (W1 to W2) | ||||||
| WT (W2 to W3) | WT (W2 to W3) | ||||||
| WT (W3 to W4) | WT (W3 to W4) | ||||||
| WT (W4 to W5) | WT (W4 to W5) | ||||||
| HT (W2 to W3) | HT (W2 to W3) | ||||||
| WT (W2 to W3) | WT (W2 to W3) | ||||||
| WT (W3 to W4) | WT (W3 to W4) | ||||||
| WT (W4 to W5) | WT (W4 to W5) | ||||||
| WT (W5 to W6) | WT (W5 to W6) | ||||||
| HT (W3 to W4) | HT (W3 to W4) | ||||||
| WT (W3 to W4) | WT (W3 to W4) | ||||||
| WT (W4 to W5) | WT (W4 to W5) | ||||||
| WT (W5 to W6) | WT (W5 to W6) | ||||||
| WT (W6 to W7) | WT (W6 to W7) | ||||||
| HT (W4 to W5) | HT (W4 to W5) | ||||||
| WT (W4 to W5) | WT (W4 to W5) | ||||||
| WT (W5 to W6) | WT (W5 to W6) | ||||||
| WT (W6 to W7) | WT (W6 to W7) | ||||||
| WT (W7 to W8) | WT (W7 to W8) |
3.2 Survival analysis
Survival analysis, also known as ‘time-to-event’, ‘duration’ or ‘event history’ analysis, comprises a suite of statistical methods aimed at studying time-to-event data. In the context of time-to-event studies, the term ‘failure’ indicates a specific event of interest (typically a detrimental one, like a heart attack or death, but this is not always the case), while the term ‘survival’ denotes the length of time (or duration) until such an event occurs.
In this report, survival analysis methods are used to explore the time until a given health transition occurs, and to shed light on individual characteristics and circumstances that affect the likelihood of making these transitions (referred to as a ‘hazard’ in the context of survival analysis). The overarching aim is to gain insights into how public policies should be designed and implemented to prevent or delay negative health shocks and anticipate positive health shocks (for example, by targeting or prioritising specific population subgroups over others).
3.2.1. Events and durations explored
Survival analysis is conducted to explore the probability of individuals remaining in good (or poor) health for different lengths of time before experiencing the onset of (or exit from) poor health. Specifically, the following 3 durations are explored:
a) Time to recover after onset of poor health;
b) Time to relapse after exit from poor health; and
c) Time to develop one or more chronic conditions
Figure 3.3 graphically illustrates these durations:
- the duration ‘time to recover after onset of poor health’ (recovery time) is illustrated in Figure 3.3a. It is defined by the number of consecutive USoc waves in which an individual reported being in poor health. For example, if someone reported being in good health in Wave 1, in poor health in Waves 2 and 3, and in good health in Wave 4, then they are said to have remained in poor health for 2 years (a recovery time of 2 years)[footnote 25]
- similarly, ‘time to relapse after exit from poor health’ (relapse time), illustrated in Figure 3.3b denotes the length of time in good health (number of consecutive USoc waves in which individuals reported being in good health)
- ‘time to develop one or more chronic conditions’ illustrated in Figure 3.3c is the number of years people survived without a chronic condition. Essentially, it is the age at which they started reporting a chronic condition
It is important to note that durations start at different points in time for different people across the study waves observed here, and that survival analysis methods account for the presence of incomplete spells (individuals leaving USoc before the end of their duration is observed).[footnote 26]
Figure 3.3 Durations explored by means of survival analysis
a. Time to recover after onset of poor health (time in poor health)
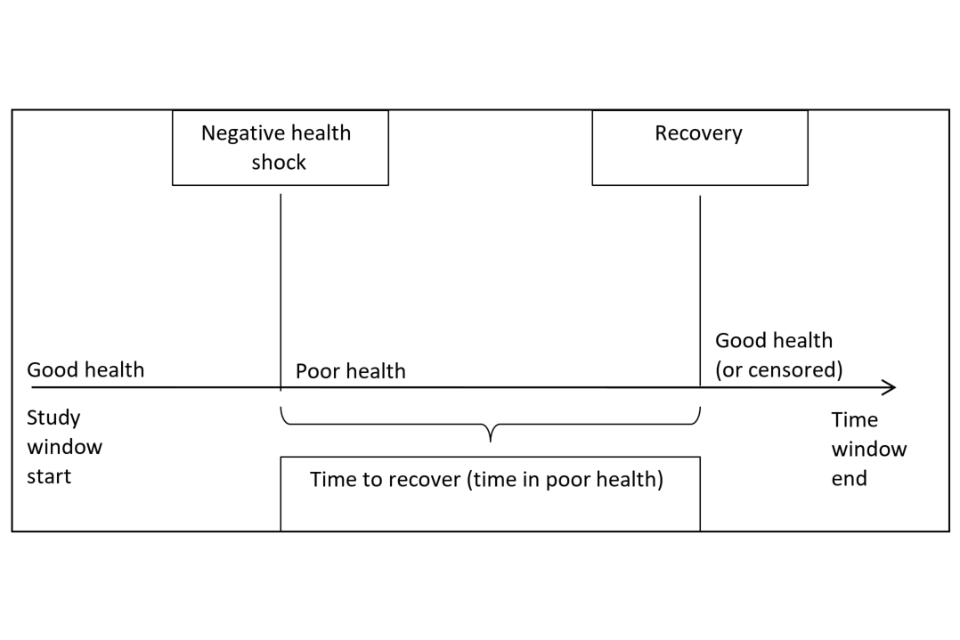
b. Time to relapse after exit from poor health (time in good health)
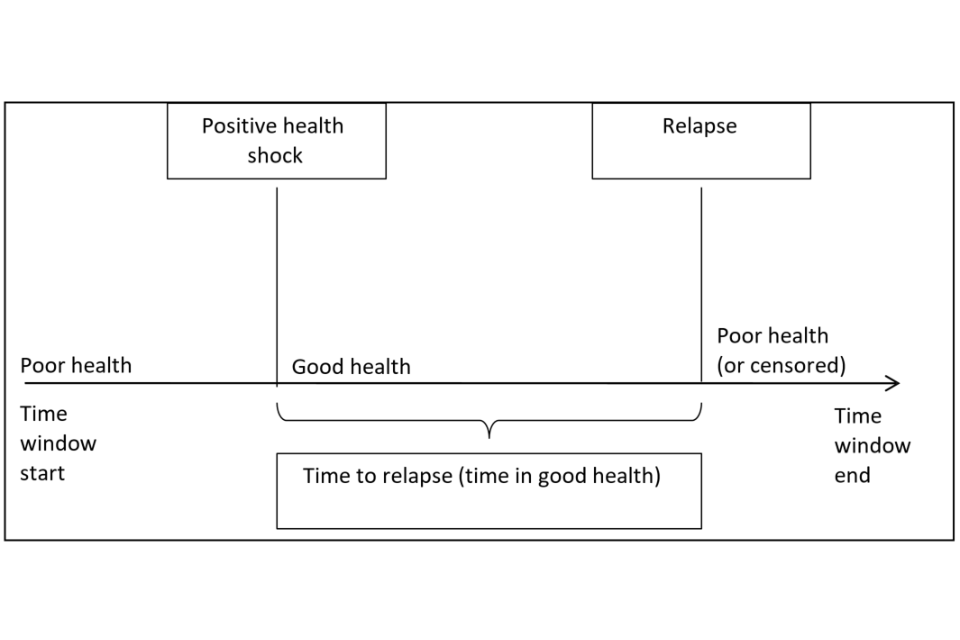
c. Time to develop one or more chronic conditions (time in good health)
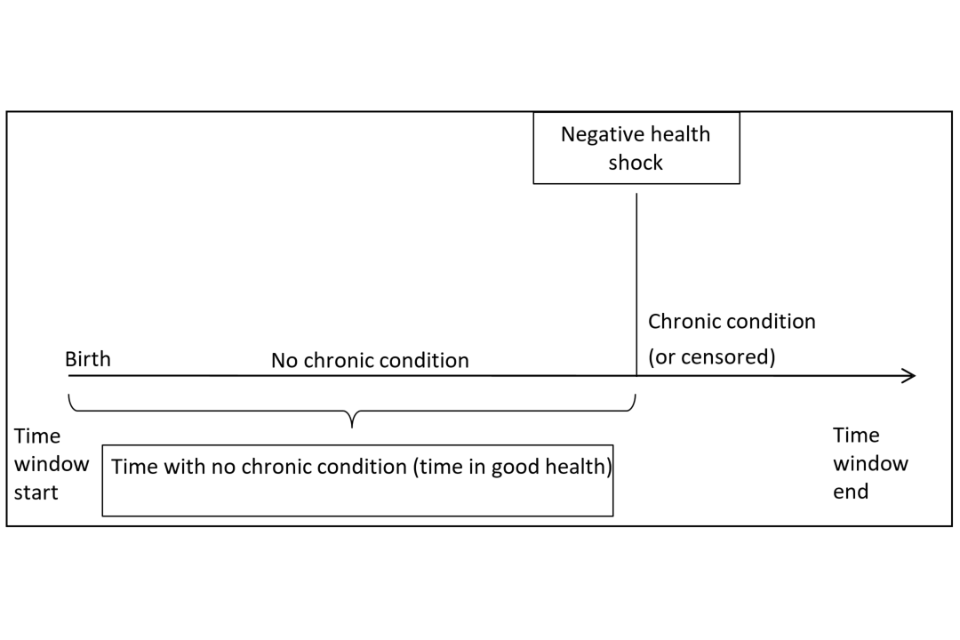
3.2.2. Research methods
The following 2 survival analysis methods are used in this report:[footnote 27]
- Kaplan-Meier approach to estimating survival functions; and
- discrete-time duration models (specifically, complementary log-log regressions) to estimate the effect of individual characteristics on the hazard of experiencing the onset of, or the exit from, poor health
Kaplan-Meier approach
The Kaplan-Meier (KM) approach is a non-parametric method used to estimate survival functions. As opposed to parametric modelling, this approach does not make the assumption that the data have to follow a particular (parametric) probability distribution. A survival function indicates the proportion of individuals who survive in a given state for a given amount of time. In this report, survival functions denote the probability of remaining in a particular health state beyond a given time period (measured in years due to annual data points). The KM function is a step function with discontinuities at the observed failure times (see Figures 4.1 and 4.2 in the following chapter).[footnote 28]
Discrete-time duration models
The complementary log-log regression is a discrete-time duration model. It is used in this report to estimate the effect of individual characteristics and circumstances on the hazards of:
a) recovering from poor health;
b) relapsing into poor heath; and
c) experiencing the onset of a chronic condition
The hazard (or hazard rate) is a measure of the likelihood of experiencing a given health transition having not experienced it until that point in the observation window (for example for recovering from poor health: onset poor health recovery, whereby recovery is the hazard). While in theory the timing of health transitions considered in this report is continuous, USoc data is only available at one-year intervals, hence the use of ‘discrete time’ models. The complementary log-log hazard rate is modelled as a function of survival time and a set of individual characteristics and circumstances, for example: gender, age, ethnicity, educational qualifications, employment status and marital status.
3.3. Sequence analysis
The survival analysis is purely focused on health transitions. Sequence analysis helps us clarify aspects around work transitions, such as identifying when changes in employment status and conditions occur in relation to health transitions, which changes are most frequent and in what combination.
The aim of the sequence analysis is to highlight the main time patterns (sequences or trajectories) of employment status and in-work conditions for individuals who experience a health transition. The method can also be used to identify the proportion of individuals who fall within the most frequently observed sequences and, within any given sequence, the length of time people remain in certain employment statuses or work conditions. In the context of this report, the method helps shed light on people’s in- and out-of-work journeys following a health transition. The combinations over time of employment status and work conditions show – within the samples of people who experience the health transitions explored – what proportions reduce labour supply by reducing working hours or leave employment.
Sequence analysis is used in this report to identify, across individuals, similar trajectories in employment-related outcomes following a health transition between USoc Wave 1 and Wave 2. The focus on health transitions occurring between these 2 waves is due to the need to maximise the observation period following health transitions. Individual sequences of employment-related outcomes can be visualised across 5 USoc waves in a horizontal series of colour-coded plots. Each sequence combines information from the 5 waves on different employment status–work condition pairings. These are:
- out of work (no sickness absence);
- out of work (sickness absence);
- in full-time work and satisfied with the job;
- in full-time work and dissatisfied with the job;
- in part-time work and satisfied with the job; and
- in part-time work and dissatisfied with the job
These outcomes were selected because previous analysis has shown that, regardless of the health construct and whether onset of or exit from poor health is concerned, the percentage of individuals experiencing a work transition following the health transition reduces over time. While the largest percentage of people experience a contemporaneous work transition, a sharp decline is observed between wave 2 and wave 5. At the latest point in time, wave 8, only minimal changes related to the earlier health shock can still be observed. Therefore, the sequence analysis is limited to 5 waves. A fully balanced panel (an observation for every time period observed for every individual included) is required to create the complete sequences needed for this type of analysis. Combining plots of the sequences with these outcomes for all individuals following a health shock enables a visual understanding of the size of those groups making specific types of transitions over time.
While the plots are purely descriptive, the use of an optimal matching algorithm[footnote 29] allows the detection of similar trajectories by organising sequences in a way that minimises the variation between sequences based on distance measures. A number of empirical clusters are pre-specified, allowing groups of sequences to be created that minimise variation within the cluster and maximise variation between them. Based on this data-driven matching approach, we settle on 4 pre-specified groups that allow us to visualise, and thereby characterise, types of trajectories clearly.
4. Results
This chapter describes the study findings. It first shows the estimates of the impact of health transitions on work transitions achieved through a multiple regression approach, and discusses individual characteristics or circumstances that appear to influence this impact. It then presents the results of the survival analysis, aimed at exploring the probabilities of individuals remaining healthy (or unhealthy) before relapsing into (or recovering from) poor health, or before experiencing the onset of a chronic condition. Finally, the sequence analysis shows the most common patterns (or trajectories) of employment statuses and work conditions following the onset of, and exit from, poor health.
4.1. The impact of health transitions on work transitions
4.1.1. Overall impacts
The multiple regression model described in section 3.1 estimates the impact of an individual’s health transition on the likelihood of experiencing a work transition. Impacts are observed at 4 different points in time in relation to the health transition (from 0 to 3 years after the health transition – see Figure 3.2) and are expressed as percentage point changes in the probability of experiencing a work transition.
In this section the impact estimates for negative health transitions (onset of poor health) are presented separately for 2 groups of negative work transitions:
- transitions out of employment and transitions out of activity; and
- negative in-work transitions (from satisfied to dissatisfied with the job, from permanent to temporary job, from full to part-time job and from high to low-pay)
Similarly, the estimates of the impact of positive health transitions (exit from poor health) are presented separately for the following 2 sets of transitions:
- transitions into employment and into activity; and
- positive in-work transitions (from dissatisfied to satisfied with the job, from temporary to permanent job, from part to full-time job and from low to high-pay)
Transitions out of employment and out of activity
Table 4.1 shows that incident health problems are associated with job loss or movements to inactivity, particularly in the short term.[footnote 30] Regardless of how poor health is measured, incident health problems have the greatest association with losing employment and activity in the short term, shown in the period ‘0 years after’, where both the health and work transitions occur in the same period. The apparent effects of an onset of poor health on employment and activity tend to reduce over time. They are lower the year after incident health problems, observed across all health indicators used in this study, and further reductions in effects are observed at later time points (2 and 3 years after the onset of poor health) for some health indicators. However, these effects at later time periods are small (generally less than 1ppt) and seldom statistically significant.
Table 4.1 Impact of onset of poor health on employment and activity exit
Employment to non-employment:
| Work transition | Onset of poor general health | Onset of poor mental health | Onset of long-term disability or illness | Onset of long-term disability or illness (limiting) | Onset of one or more chronic conditions | |||||
|---|---|---|---|---|---|---|---|---|---|---|
| 0 years after | 3.9 | *** | 4.9 | *** | 2.0 | *** | 3.8 | *** | 3.5 | *** |
| 1 year after | 1.8 | *** | 1.6 | *** | 1.7 | *** | 2.1 | *** | 1.3 | ** |
| 2 years after | 0.6 | 0.3 | 0.3 | 0.9 | *** | 0.3 | ||||
| 3 years after | 0.5 | 0.8 | *** | 0.3 | 0.9 | *** | 1.1 |
Activity to inactivity:
| Work transition | Onset of poor general health | Onset of poor mental health | Onset of long-term disability or illness | Onset of long-term disability or illness (limiting) | Onset of one or more chronic conditions | |||||
|---|---|---|---|---|---|---|---|---|---|---|
| 0 years after | 3.1 | *** | 4.1 | *** | 1.6 | *** | 3.0 | *** | 2.3 | *** |
| 1 year after | 1.5 | *** | 1.7 | *** | 1.5 | *** | 2.2 | *** | 1.5 | *** |
| 2 years after | 0.7 | ** | 0.3 | 0.4 | 0.8 | ** | 0.4 | |||
| 3 years after | 0.8 | 0.8 | *** | 0.3 | 1.1 | *** | 1.0 | *** |
*** and ** denote statistical significance at the 1 and 5% level, respectively.
The onset of a mental health problem had the largest effect on the likelihood of leaving work in the short-term (in the same period).
Negative in-work transitions
There is less evidence of an impact of incident health problems on negative in-work transitions and results are seldom statistically significant.[footnote 31] Table 4.2 shows that, generally, onset of poor health is associated with a detrimental effect on job satisfaction in the same period.
Table 4.2 Impact of the onset of poor health on negative in-work transitions
Satisfied to dissatisfied with job:
| Work transition | Onset of poor general health | Onset of poor mental health | Onset of long-term disability or illness | Onset of long-term disability or illness (limiting) | Onset of one or more chronic conditions | |||||
|---|---|---|---|---|---|---|---|---|---|---|
| 0 years after | 1.8 | *** | 11.0 | *** | 1.1 | ** | 2.1 | *** | 1.5 | |
| 1 year after | 1.5 | *** | 0.3 | 0.4 | 0.9 | 0.1 | ||||
| 2 years after | 0.7 | -0.3 | 0.0 | -0.2 | 0.6 | |||||
| 3 years after | -0.4 | -0.2 | -0.2 | -0.5 | 0.3 |
Permanent to temporary job:
| Work transition | Onset of poor general health | Onset of poor mental health | Onset of long-term disability or illness | Onset of long-term disability or illness (limiting) | Onset of one or more chronic conditions | |||||
|---|---|---|---|---|---|---|---|---|---|---|
| 0 years after | -0.2 | 0.4 | 0.0 | -0.1 | -0.0 | |||||
| 1 year after | -0.1 | 0.5 | *** | 0.2 | 0.3 | 0.7 | ||||
| 2 years after | -0.0 | -0.0 | -0.0 | 0.0 | -0.3 | |||||
| 3 years after | 0.1 | 0.3 | ** | -0.1 | -0.1 | -0.3 | ** |
High to low paid job:
| Work transition | Onset of poor general health | Onset of poor mental health | Onset of long-term disability or illness | Onset of long-term disability or illness (limiting) | Onset of one or more chronic conditions | |||||
|---|---|---|---|---|---|---|---|---|---|---|
| 0 years after | 0.9 | -0.4 | 1.0 | ** | 0.8 | 0.3 | ||||
| 1 year after | 0.5 | 0.1 | 0.4 | 0.8 | ** | 1.1 | ** | |||
| 2 years after | -0.4 | -0.0 | -0.2 | 0.1 | -0.1 | |||||
| 3 years after | 0.0 | 0.5 | *** | 0.0 | 0.0 | 0.1 |
Full- to part-time job:
| Work transition | Onset of poor general health | Onset of poor mental health | Onset of long-term disability or illness | Onset of long-term disability or illness (limiting) | Onset of one or more chronic conditions | ||||
|---|---|---|---|---|---|---|---|---|---|
| 0 years after | 0.0 | 0.8 | ** | 0.9 | *** | 0.9 | ** | 0.6 | |
| 1 year after | 0.1 | 1.1 | *** | 0.3 | 0.7 | 0.9 | |||
| 2 years after | 0.8 | ** | 0.6 | ** | 0.4 | 0.7 | ** | 0.8 | |
| 3 years after | 0.3 | 0.1 | 0.2 | 0.1 | 0.2 |
The impact is greatest for the onset of poor mental health, increasing the probability of an individual becoming dissatisfied with their job in the same period by 11ppts.
There is little evidence of an impact beyond the period of the incident health problem, except for onset of poor general health, where an association is still observed one year later.
The onset of poor mental health and of a long-term health condition or disability increased an individual’s likelihood of moving from full- to part-time employment in the short-term. There is some evidence of this at later time points for the onset of poor mental health. In the latest ONS monthly labour market statistics (June 2019), 3.3% of part-time workers gave illness or disability as the reason for working part-time. This percentage has been increasing over time (in the same quarter of 1999, the equivalent percentage was 1.8%). Further research would be needed to investigate the implications of this rise, which forms part of the increase in disability employment over the long-term.
Transitions into employment and into activity
Table 4.3 shows the findings for the impact of health recovery on employment and entry into activity. Generally, recovery from poor health is associated with a greater likelihood of having entered employment. Among the health constructs observed, recovery from poor mental health shows the greatest association. These are short-term impacts, with no evidence of any impact at later time points.
Table 4.3 Impact of the exit from poor health on employment and activity entry
Non-employment to employment:
| Work transition | Exit from poor general health | Exit from poor mental health | Exit from long-term disability or illness | Exit from long-term disability or illness (limiting) | ||||
|---|---|---|---|---|---|---|---|---|
| 0 years after | 2.1 | *** | 3.0 | *** | 0.6 | ** | 1.6 | *** |
| 1 year after | -0.5 | -0.3 | -0.3 | -0.1 | ||||
| 2 years after | -0.1 | -0.1 | -0.1 | -0.0 | ||||
| 3 years after | -0.3 | 0.1 | 0.1 | 0.0 |
Inactivity to activity:
| Work transition | Exit from poor general health | Exit from poor mental health | Exit from long-term disability or illness | Exit from long-term disability or illness (limiting) | ||||
|---|---|---|---|---|---|---|---|---|
| 0 years after | 0.1 | 2.3 | *** | -0.1 | 0.7 | |||
| 1 year after | -0.5 | -0.8 | ** | -0.7 | *** | -0.7 | ** | |
| 2 years after | -0.7 | ** | -0.6 | *** | -0.2 | -0.5 | ||
| 3 years after | -0.4 | -0.2 | -0.4 | ** | -0.3 |
*** and ** denote statistical significance at the 1 and 5% level, respectively.
Recovery from a mental health condition is the only health transition to be associated with a greater likelihood of having become economically active. At later time points small negative impacts are observed, which may reflect the complex dynamics some people face when dealing with mental health issues.
Comparing the results reported in Tables 4.1 and 4.3, the evidence here suggests that, in general, the association of employment entry with recovery from poor health (and entry into activity where recovery from poor mental health is concerned) is smaller than the association of job loss (and movement into inactivity) with the onset of poor health.
Positive in-work transitions
Table 4.4 shows the impacts of health recovery on positive in-work transitions. Recovering from poor (general and mental) health is associated with an increase in the likelihood of an individual reporting satisfaction with their job (by 3 and 7ppts, respectively).
People who recover from mental health conditions are less likely to become satisfied with their job one and 2 years after the recovery. This could be due to relapsing into poor mental health at some point after the recovery, or to other individual circumstances determining job satisfaction - further investigation would be required to better understand this phenomenon.
Recovering from mental health conditions is associated with a greater likelihood of an individual having moved from a low to a high-paid job (2ppt increase). The findings also suggest that recovery from poor general health lowers an individual’s likelihood of moving from a part to a full-time job by a similar degree.
Table 4.4 Impact of the exit from poor health on positive in-work transitions
Dissatisfied to satisfied with job:
| Work transition | Exit from poor general health | Exit from poor mental health | Exit from long-term disability or illness | Exit from long-term disability or illness (limiting) | ||||
|---|---|---|---|---|---|---|---|---|
| 0 years after | 3.3 | *** | 6.9 | *** | 1.0 | 0.9 | ||
| 1 year after | -0.6 | -2.4 | *** | -0.3 | -0.2 | |||
| 2 years after | 0.1 | -1.1 | *** | -0.0 | -0.2 | |||
| 3 years after | 0.1 | -0.3 | -0.1 | -0.3 |
Temporary to permanent job:
| Work transition | Exit from poor general health | Exit from poor mental health | Exit from long-term disability or illness | Exit from long-term disability or illness (limiting) | ||||
|---|---|---|---|---|---|---|---|---|
| 0 years after | -0.0 | 0.6 | -0.3 | 0.1 | ||||
| 1 year after | -0.1 | 0.2 | -0.1 | -0.4 | ||||
| 2 years after | -0.3 | -0.2 | -0.1 | -0.3 | ||||
| 3 years after | 1.5 | -0.3 | -0.1 | -0.3 |
Low to high paid job:
| Work transition | Exit from poor general health | Exit from poor mental health | Exit from long-term disability or illness | Exit from long-term disability or illness (limiting) | ||||
|---|---|---|---|---|---|---|---|---|
| 0 years after | 0.3 | 2.0 | *** | 0.3 | -0.3 | |||
| 1 year after | 0.2 | -0.5 | 0.2 | 0.3 | ||||
| 2 years after | 0.1 | 0.2 | -0.1 | 0.0 | ||||
| 3 years after | -0.3 | -0.3 | -0.1 | -0.2 |
Part- to full-time job:
| Work transition | Exit from poor general health | Exit from poor mental health | Exit from long-term disability or illness | Exit from long-term disability or illness (limiting) | ||||
|---|---|---|---|---|---|---|---|---|
| 0 years after | -1.9 | ** | -0.6 | -0.0 | -0.2 | |||
| 1 year after | -1.2 | 0.4 | 0.1 | -0.8 | ||||
| 2 years after | -0.2 | 0.2 | 0.1 | 0.2 | ||||
| 3 years after | -0.1 | -0.1 | -0.0 | -0.0 |
*** and ** denote statistical significance at the 1 and 5% level, respectively.
4.1.2. Factors that increase or reduce impacts
This section explores how individual characteristics and circumstances can increase or reduce the impact of health transitions on work transitions.[footnote 32]
The analysis focuses on the following 4 characteristics:
- qualifications - whether the individual has a degree (‘degree’), as opposed to lower or no qualifications (‘no degree’)
- workplace size - workplaces with 200 or more employees are defined as ‘large’, while workplaces with fewer than 200 employees are defined as ‘small to medium’[footnote 33]
- occupation - whether the individual’s occupation is defined as skilled (the ‘skilled’ category includes those who reported their occupation as being professional, managerial and technical, skilled non-manual or skilled manual), as opposed to ‘unskilled’ (partly-skilled or unskilled occupations)
- home ownership - whether the person owns the property in which they live outright (‘home-owner’), as opposed to ‘non-owner’ (owns the property through mortgage or rents it).
Some evidence of the positive role of skills in facilitating work transitions has already been provided by Webber et al. (2015). Table 4.5 shows the differences between the impacts for subgroups with and without a degree (differential impacts). A negative figure means that the impact of onset of poor health on the work transition in question is smaller for those with a degree compared to those without. Individuals who experience onset of poor general health are 3ppts less likely to experience job loss if they have a degree.[footnote 34] A similar moderating effect of having a degree is observed with onset of a mental health condition. Having a degree is also found to reduce the chances of experiencing inactivity. Whilst having a degree is associated with a lower likelihood of lob loss or exit from activity, it is associated with a greater likelihood of an individual becoming dissatisfied with their job amongst those that remain in work.
Table 4.5 Differential impact of onset of poor health on contemporaneous work transitions: qualification (degree versus no-degree)
| Employment exit | Activity exit | Satisfied to dissatisfied with job | High to low paid job | Permanent to temporary job | Full- to part-time job | |||||||
|---|---|---|---|---|---|---|---|---|---|---|---|---|
| Onset of poor general health | -3.0 | *** | -2.3 | ** | 3.1 | ** | 0.1 | 0.0 | -0.3 | |||
| Onset of poor mental health | -3.5 | *** | -2.9 | *** | 5.0 | *** | 0.0 | 0.0 | -0.9 | |||
| Onset of a long-term disability/illness | 0.6 | 0.8 | -0.5 | -0.6 | -0.6 | -0.6 | ||||||
| Onset of a long-term disability/illness (limiting) | 0.5 | 0.6 | -0.1 | -1.8 | ** | -0.6 | -0.6 | |||||
| Onset of one or more chronic condition | -1.5 | -1.0 | -1.4 | -0.2 | -0.2 | 0.2 |
*** and ** denote statistical significance at the 1 and 5% level, respectively.
Table 4.6 shows that employer size has a moderating effect on the impact of onset of poor health on work transitions (except for onset of a long-term disability).
Working for large employers (200 employees or more) reduces the likelihood of job loss by between 2.0 and 3.3ppts (depending on the health construct), on average, compared to working for smaller employers. To what extent this effect is the result of larger firms having greater capacity to accommodate adjustments, if at all, would require further research.
Where onset of poor mental health is concerned, individuals working for smaller employers are more likely to leave work or become inactive than those working for larger employers.
There is also evidence that following onset of poor general health individuals who work for large employers are more likely to become dissatisfied with their job compared to people working for smaller employers.
Table 4.6 Differential impact of the onset of poor health on contemporaneous work transitions: workplace size (large versus small-to-medium firms)
| Employment exit | Activity exit | Satisfied to dissatisfied with job | High to low paid job | Permanent to temporary job | Full- to part-time job | |||||||
|---|---|---|---|---|---|---|---|---|---|---|---|---|
| Onset of poor general health | -2.0 | ** | -1.4 | 3.3 | *** | 0.1 | -0.2 | 0.4 | ||||
| Onset of poor mental health | -3.3 | *** | -2.5 | *** | 1.8 | 1.1 | -0.2 | 0.3 | ||||
| Onset of a long-term disability/illness | -0.3 | -0.1 | 0.8 | 0.0 | -0.3 | 0.4 | ||||||
| Onset of a long-term disability/illness (limiting) | -0.9 | -0.6 | 2.3 | -1.5 | -1.0 | ** | 0.5 | |||||
| Onset of one or more chronic condition | -2.9 | *** | -1.7 | -1.0 | 0.8 | -0.4 | 0.0 |
*** and ** denote statistical significance at the 1 and 5% level, respectively.
Table 4.7 shows that individuals working in skilled occupations are less likely to experience job loss or inactivity following onset of a mental health condition, but they are more likely to become dissatisfied with their job. Among those who experience onset of a long-term disability or illness, individuals working in unskilled occupations are less likely to move to a part-time job.
Table 4.7 Differential impact of the onset of poor health on contemporaneous work transitions: occupation category (skilled versus unskilled)
| Employment exit | Activity exit | Satisfied to dissatisfied with job | High to low paid job | Permanent to temporary job | Full- to part-time job | |||||||
|---|---|---|---|---|---|---|---|---|---|---|---|---|
| Onset of poor general health | -1.4 | -0.1 | 1.4 | -0.5 | 0.1 | -0.7 | ||||||
| Onset of poor mental health | -3.2 | *** | -2.3 | ** | 4.0 | *** | 1.0 | 0.1 | -0.9 | |||
| Onset of a long-term disability/illness | -1.2 | -0.7 | -0.4 | -1.5 | -0.7 | -2.0 | ** | |||||
| Onset of a long-term disability/illness (limiting) | -2.3 | -1.6 | 0.2 | -1.4 | -0.9 | -0.2 | ||||||
| Onset of one or more chronic condition | 0.7 | 0.8 | 0.0 | -1.1 | -1.1 | -1.6 |
*** and ** denote statistical significance at the 1 and 5% level, respectively.
Table 4.8 shows that, generally, there is no evidence of any differential impact between those owning a property outright relative to those renting or having a mortgage. However, where onset of a limiting long-term disability is concerned, there is evidence that home owners are more likely to move from a permanent to a temporary job.
Table 4.8 Differential impact of the onset of poor health on contemporaneous work transitions: home ownership (home owner versus non-owner)
| Employment exit | Activity exit | Satisfied to dissatisfied with job | High to low paid job | Permanent to temporary job | Full- to part-time job | |||||||
|---|---|---|---|---|---|---|---|---|---|---|---|---|
| Onset of poor general health | 0.1 | 0.0 | 0.1 | 0.9 | -0.3 | 1.3 | ||||||
| Onset of poor mental health | 1.2 | 0.7 | -1.9 | 0.1 | -0.3 | 0.3 | ||||||
| Onset of a long-term disability/illness | -1.7 | -1.6 | -0.9 | 1.5 | -0.1 | 1.3 | ||||||
| Onset of a long-term disability/illness (limiting) | -0.2 | -0.2 | -1.9 | 0.5 | 1.6 | ** | -0.6 | |||||
| Onset of one or more chronic condition | 1.2 | 1.5 | 1.2 | -1.4 | -0.4 | 0.2 |
*** and ** denote statistical significance at the 1 and 5% level, respectively.
4.2. Findings from the survival analysis
4.2.1. Estimation of survival functions
The Kaplan-Meier method introduced in section 3.2.3 is used to estimate survival functions for the following 3 durations (spells):
- time to recover after onset of poor health (recovery time);
- time to relapse after exit from poor health (relapse time); and
- time to develop one or more chronic conditions
Each duration reflects how long individuals remained in a given health state (poor health for ‘recovery time’ and good health for ‘relapse time’ and ‘time to develop a chronic condition’). Nine survival functions are estimated, each relating to a different sample defined by a specific duration and health construct (see Table 4.9).[footnote 35] Individuals in the ‘Recovery time’ and ‘Relapse time’ samples are of working age (16 to 64 years old) at the start of their duration, while those in the ‘Time to develop one or more chronic conditions’ sample are of working age at their first interview.
Table 4.9 Sample size, by duration and health construct
Time in poor health:
| Recovery time | |
|---|---|
| Self-assessed (general) health | 10,517 (4.1) |
| Mental health or psychological distress | 15,172 (2.3) |
| Self-assessed long-standing disability or illness | 14,481 (5.1) |
| Self-assessed long-standing disability or illness (limiting) | 10,260 (4.8) |
| One or more chronic conditions | - |
Time in good health:
| Relapse time | Time with no chronic conditions | |
|---|---|---|
| Self-assessed (general) health | 9,880 (4.8) | - |
| Mental health or psychological distress | 15,329 (3.7) | - |
| Self-assessed long-standing disability or illness | 13,514 (5.7) | - |
| Self-assessed long-standing disability or illness (limiting) | 9,382 (7.0) | - |
| One or more chronic conditions | - | 26,524 (3.2) |
All individuals are aged 16 to 64 at spell start[footnote 36]
Table 4.9 above shows the size of each of the 9 samples - the proportions older than 64 at spell end are shown in brackets. For example, the survival function for ‘Recovery time’ using the construct ‘Self-assessed (general) health’ is based on 10,517 subjects who either have a complete spell (both duration start and end are observed) or left the dataset at some point in time before an exit from poor health is observed (incomplete spell).
The survival functions for the 9 samples are shown in Figures 4.1 (recovery time) and 4.2. (relapse time and time to develop a chronic condition).
As we can see from Figure 4.1, regardless of the health construct used, the median survival time for recovery is 2 years (indicated by intersection of the dashed line, set at half the sample, and the survival function). This means that half of the subjects recover from poor health within the first 2 years after the initial onset of poor health.
Figure 4.1 Time to recover after an onset of poor health
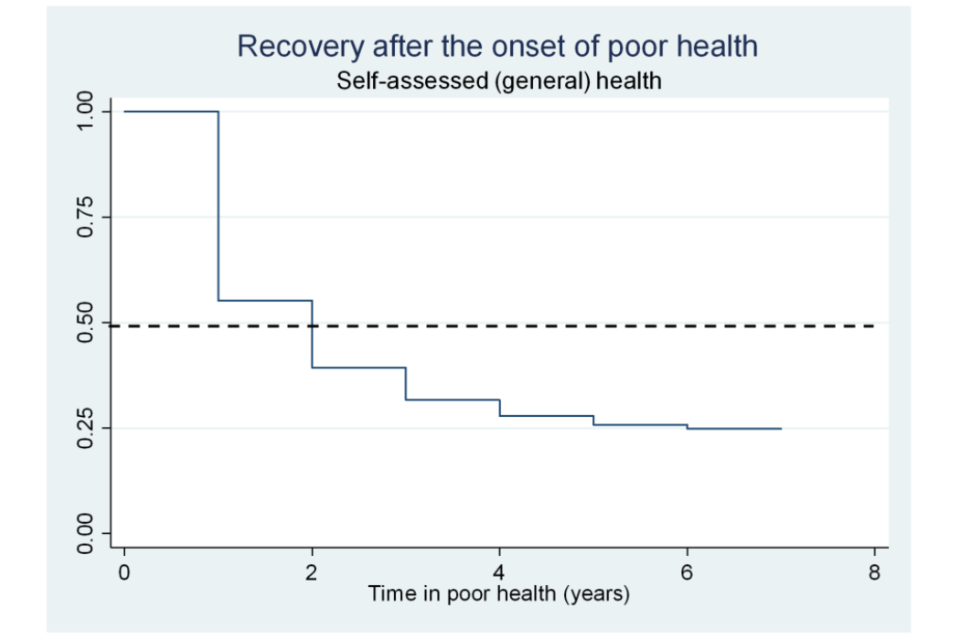
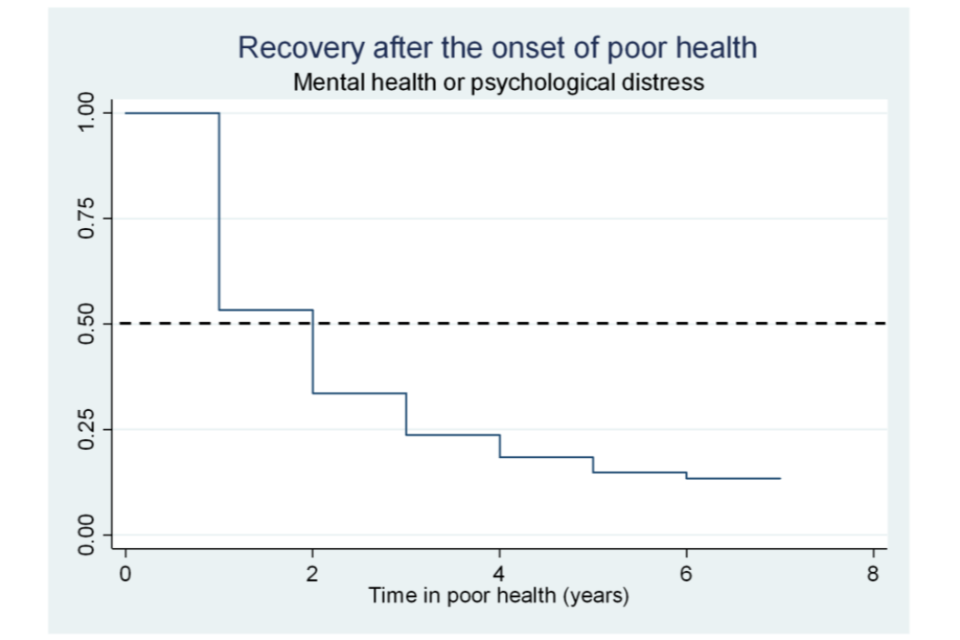
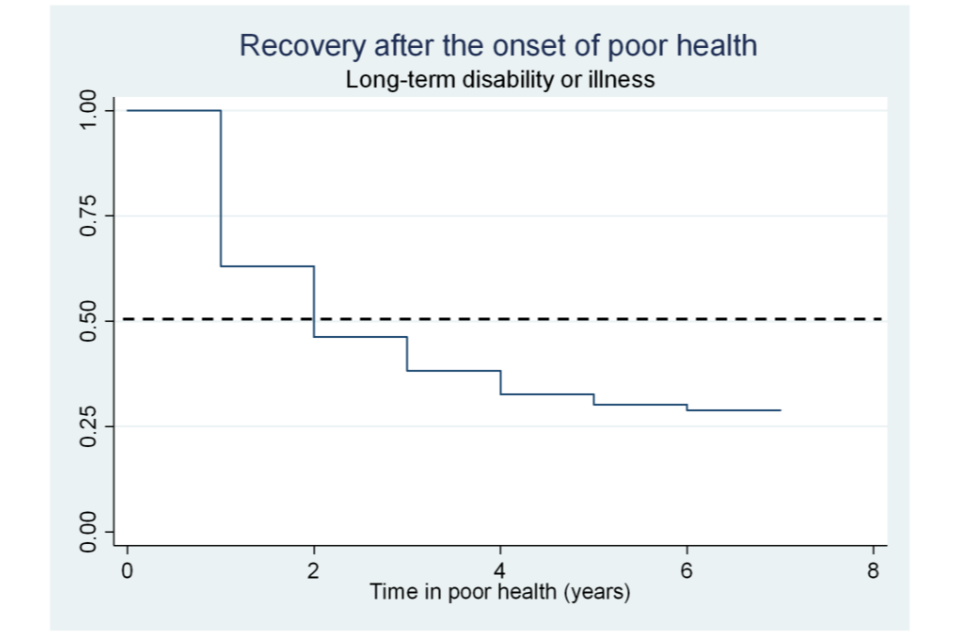
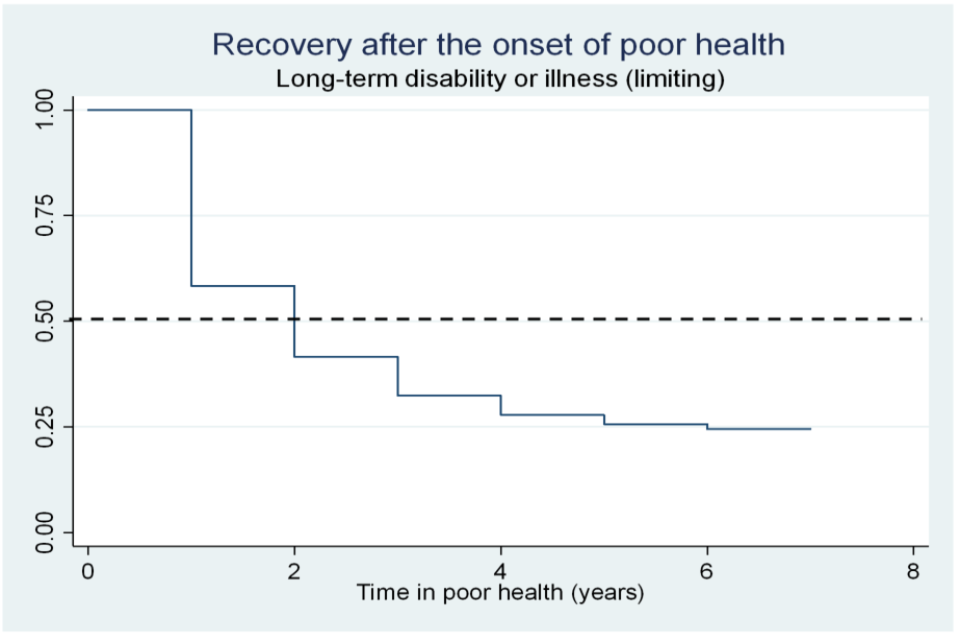
As Figure 4.2 shows, the median survival time for relapsing into poor health shows some variation depending on the health construct explored. The median survival time for self-assessed (general) health and limiting long-term disability or illness is 4 years. This means half of the individuals remained healthy for up to 4 years before experiencing a relapse of poor health. The median survival time for mental health/psychological distress is 5 years, and for non-limiting disability or illness is 3 years.
After correcting for survival bias due to delayed entry (left truncation), the estimated median survival time for the development of a chronic condition falls substantially (from 68 to 48 years).[footnote 37] This means that, among those who develop one or more chronic conditions, half experience onset by the age of 48.
Figure 4.2 Time to relapse after an exit from poor health and time to develop one or more chronic conditions
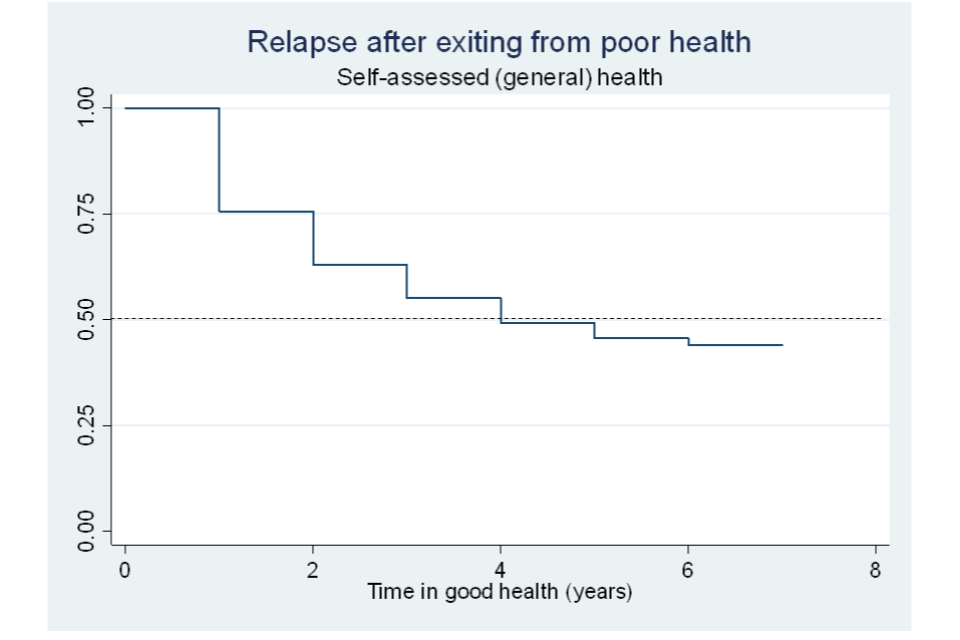
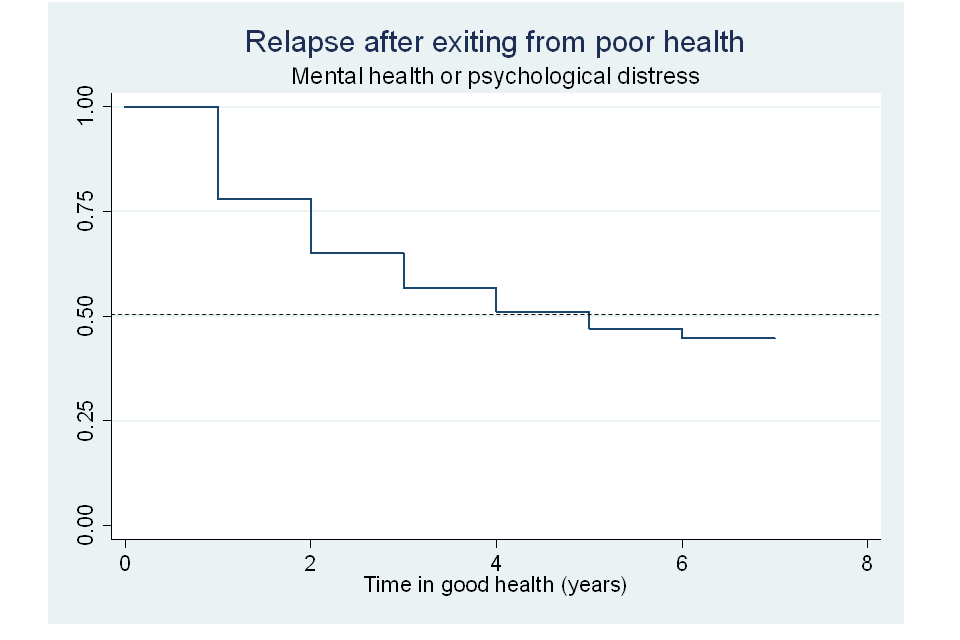
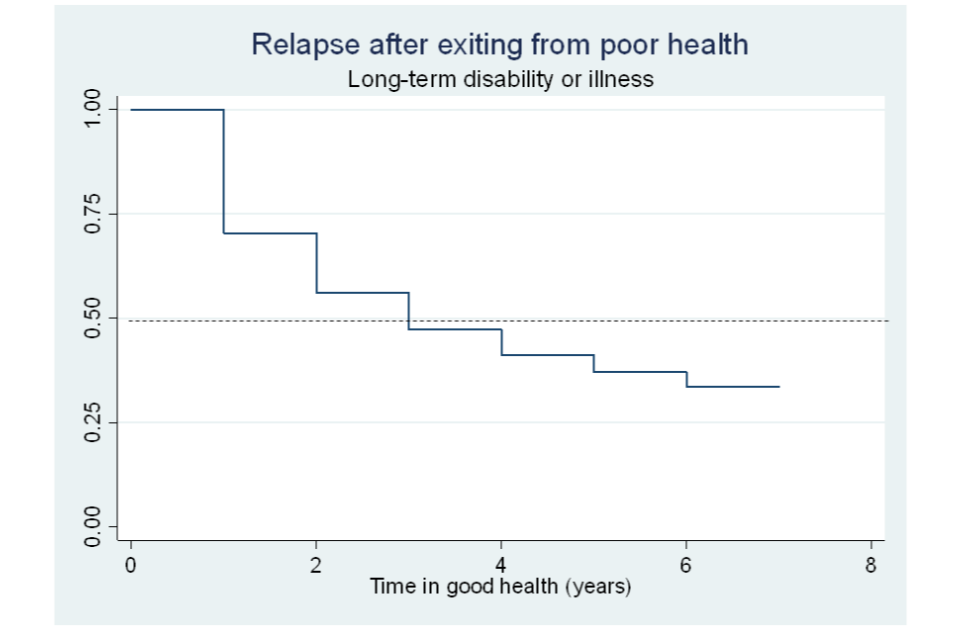
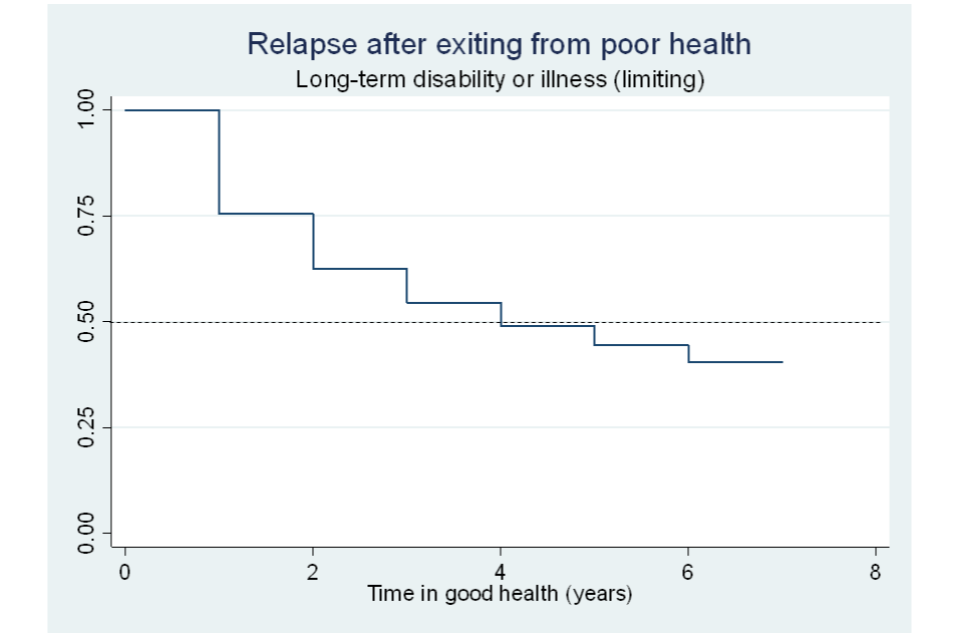
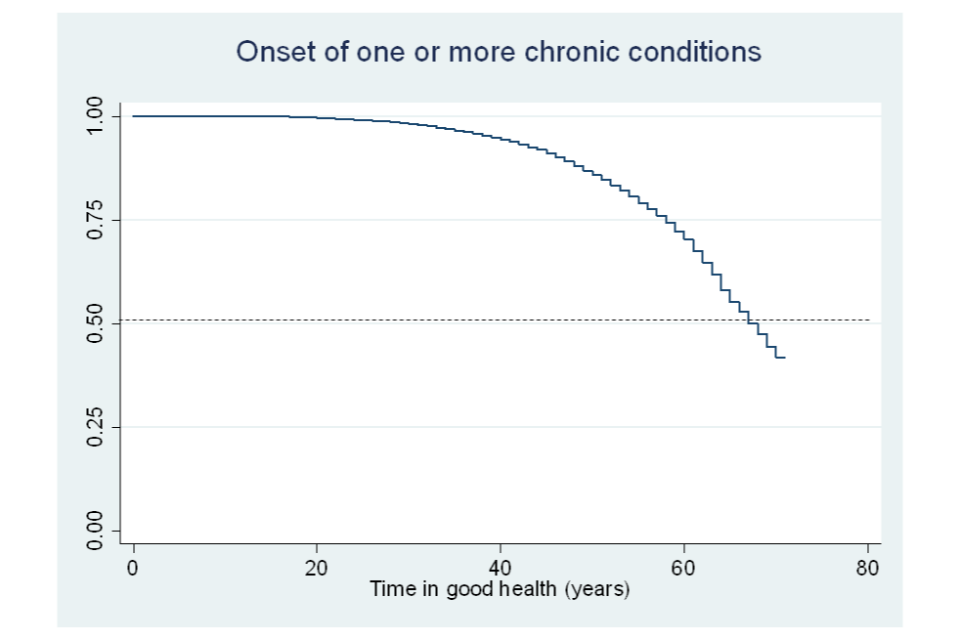
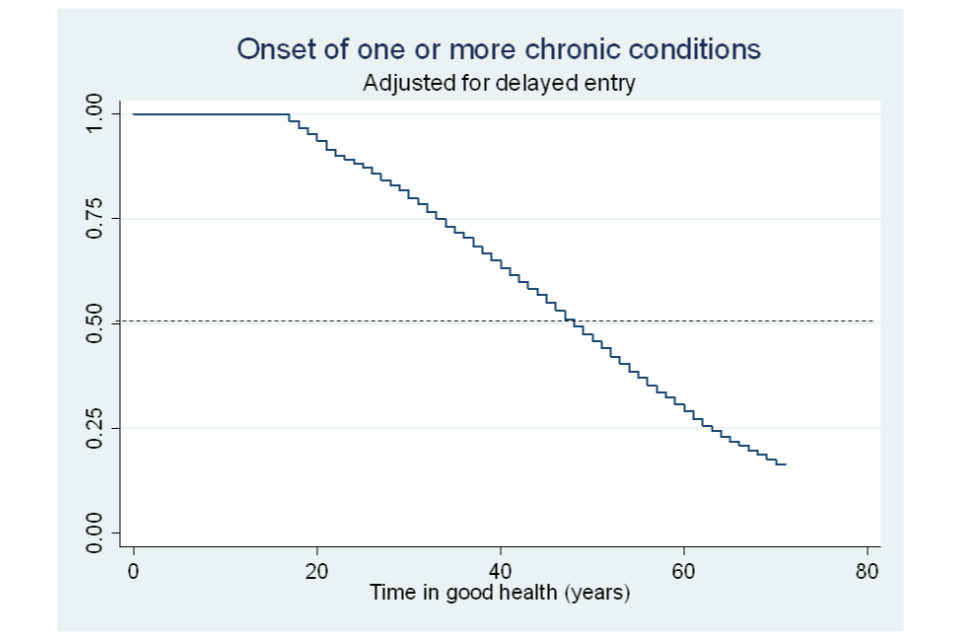
4.2.2. Survival differences across subgroups
Each of the Kaplan-Meier functions illustrated in the previous section refers to a specific sample in its entirety. However, survival functions are also estimated separately for subsets of each sample defined by individual demographics or circumstances. Statistical tests are then run to determine whether there are differences in survival function between subsets. Table 4.10 shows the results of these tests for the duration ‘recovery time’ while Table 4.11 reports the results for ‘relapse time’ and ‘time to develop a chronic condition’. Results from the log-rank test are used to assess the null hypothesis of no difference between survival functions.[footnote 38] The finding of no difference between/across survival functions means that a single function can be used to represent each subgroup.
As Table 4.10 (first row) shows, the survival functions for remaining in poor health are found to be the same for men and women, and this is regardless of the health construct used.[footnote 39] Hence, the survival function illustrated in Figure 4.1 applies to both genders.
Table 4.10 Testing the equality of survival functions across groups (recovery time)
| Self-assessed (general) health | Mental health or psychological distress | Self-assessed long-standing illness or disability | Self-assessed long-standing illness or disability (limiting) | |
|---|---|---|---|---|
| Gender | 0.15 (0.696) | 0.70 (0.404) | 0.26 (0.614) | 0.06 (0.802) |
| Age categories | 25.94 (0.000) | 104.22 (0.000) | 23.28 (0.000) | 24.76 (0.000) |
| Married status | 6.76 (0.009) | 73.86 (0.000) | 25.54 (0.000) | 44.66 (0.000) |
| Highest qualifications | 74.33 (0.000) | 112.54 (0.000) | 68.50 (0.000) | 64.01 (0.000) |
| White ethnicity (%) | 17.54 (0.000) | 93.62 (0.000) | 6.50 (0.011) | 22.90 (0.000) |
| Any children aged under 16 | 19.54 (0.000) | 12.98 (0.000) | 24.59 (0.000) | 30.27 (0.000) |
| Home ownership | 44.45 (0.000) | 164.24 (0.000) | 75.23 (0.000) | 97.26 (0.000) |
| Employed | 127.55 (0.000) | 170.19 (0.000) | 108.32 (0.000) | 106.59 (0.000) |
| Active | 93.51 (0.000) | 117.90 (0.000) | 84.05 (0.000) | 101.00 (0.000) |
| Regions | 20.58 (0.038) | 43.20 (0.000) | 26.95 (0.005) | 23.19 (0.017) |
Log-rank tests: Chi square statistics (*** and ** denote statistical significance at the 1 and 5% level, respectively); all individual characteristics are observed at the start of the spell.
However, for all other individual characteristics explored differences across survival functions were detected.[footnote 40] The results indicate that recovery from poor health is faster for:
- people with higher qualifications compared to people with lower qualifications (people without qualifications show the slowest recovery);
- white people compared to people from other ethnic groups;
- people who are married/in a civil partnership compared to people who are not;
- individuals who are employed compared to people who are not;
- people with children aged under 16 in the household compared to people without;
- younger people compared to older people (with the exception of psychological distress, where older people recover faster); and
- people who own the property in which they live outright or through a mortgage compared to those that rent (and the graph indicates that recovery takes longer, on average, for people who own their property outright as opposed to through a mortgage)
The results for the durations of ‘relapse time’ and ‘time to develop a chronic condition’ are less clear-cut and vary depending on the health construct used, as shown in Table 4.11.
Table 4.11 Testing the equality of survivor functions across groups (relapse time and time to develop a chronic conditions); log-rank tests
| Self-assessed (general) health | Mental health or psychological distress | Self-assessed long-standing illness or disability | Self-assessed long-standing illness or disability (limiting) | One or more chronic conditions | |
|---|---|---|---|---|---|
| Gender | 1.22 (0.270) | 34.57 (0.000) | 0.70 (0.404) | 1.58 (0.209) | 18.69 (0.000) |
| Age categories | 197.20 (0.000) | 23.55 (0.000) | 306.13 (0.000) | 169.54 (0.000) | 56.24 (0.000) |
| Married status | 0.45 (0.501) | 3.03 (0.082) | 11.13 (0.000) | 2.85 (0.091) | 8.01 (0.005) |
| Highest qualifications | 105.54 (0.000) | 7.38 (0.194) | 80.62 (0.000) | 105.40 (0.000) | 47.79 (0.000) |
| White ethnicity (%) | 8.91 (0.003) | 17.77 (0.000) | 12.39 (0.000) | 9.65 (0.002) | 1.29 (0.256) |
| Any children aged under 16 | 6.22 (0.013) | 0.78 (0.376) | 34.02 (0.000) | 35.21 (0.000) | 0.58 (0.446) |
| Home ownership | 37.98 (0.000) | 21.81 (0.000) | 48.57 (0.000) | 41.30 (0.000) | 28.56 (0.000) |
| Employed | 63.81 (0.000) | 11.51 (0.000) | 37.74 (0.000) | 98.74 (0.000) | 17.49 (0.000) |
| Active | 52.02 (0.000) | 14.98 (0.000) | 32.37 (0.000) | 67.37 (0.000) | 7.65 (0.006) |
| Regions | 8.32 (0.685) | 21.30 (0.030) | 29.90 (0.002) | 26.24 (0.006) | 13.30 (0.274) |
Log-rank tests: Chi square statistics (*** and ** denote statistical significant at the 1 and 5% level, respectively); all individual characteristics are observed at the start of the spell (at Wave 1 interview for those who experience the onset of chronic conditions).
4.2.3. Effect of individual characteristics on the hazard of experiencing health transitions
This section illustrates the results from the estimation of discrete-time hazard models. The aim of the analysis is to help identify demographic subsets or individual circumstances that public policies can target to delay the onset of (or anticipate an exit from) poor health.
As explained in the previous chapter, in the context of this report a hazard rate is the probability of leaving a given health state at a given point in time having survived in that health state up to then. The log-log regression model introduced in section 3.2.2 is used to estimate the association between individual characteristics and circumstances (covariates) and the hazards of recovering from poor health, relapsing into poor health and experiencing the onset of a chronic condition.[footnote 41]
Table 4.12 illustrates the findings for the hazard of ‘recovering from poor health’. The direction of the association between the covariates explored and hazard rates is reflected by the sign of the regression coefficients.[footnote 42] The positive (and statistically significant) coefficients reported in the table suggest that the probability of recovering from poor health is higher for:
- white people compared to people from other ethnic groups (with the exception of recovery from a ‘long-term disability or illness’);
- employed people compared to those not employed;
- people with children aged under 16 in the household compared to those without; and
- people who own a property outright or through mortgage compared to those who rent[footnote 43]
On the other hand, negative (and statistically significant) coefficients indicate that the probability of recovering from poor health is lower for:
- people in the age categories 35 to 49, 50 to 59 and 60 to 64 compared to those in the 16 to 24 category. However, the situation is reversed for mental health: the hazard of recovery is higher for all age categories compared to the youngest group (aged 16 to 24);[footnote 44]
- individuals with qualifications (notably degree, but for some specifications also lower qualifications) compared to those with no qualifications. Interestingly, the hazard of recovery decreases with qualification level; and
- people who live in the North West, West Midlands and Wales regions compared to those living in the London region (This finding only applies to recovery from a long-term disability or illness)
The negative coefficient on the variable ‘Logarithm of survival time’ indicates that the baseline hazard (the hazard independent of the covariates and therefore common to all individuals in the sample) decreases with elapsed survival time. This suggests that, in general, the likelihood of an individual recovering from an incidence of poor health reduces over time – the longer they remain in poor health the less likely they are to recover.
Table 4.12 Estimating the discrete-time hazard of recovering from poor health
| Self-assessed (general) health | Mental health or psychological distress | Long-term disability or illness | Long-term disability or illness (limiting) | |||||
|---|---|---|---|---|---|---|---|---|
| Age category: Aged 25-34 | -0.086 | 0.181 | *** | -0.052 | -0.088 | |||
| Age category: Aged 35-49 | -0.206 | *** | 0.164 | *** | -0.116 | ** | -0.135 | ** |
| Age category: Aged 50-59 | -0.252 | *** | 0.189 | *** | -0.214 | *** | -0.248 | *** |
| Age category: Aged 60-64 | -0.139 | ** | 0.334 | *** | -0.119 | ** | -0.043 | |
| Male | -0.008 | 0.007 | -0.005 | -0.024 | ||||
| White ethnicity | 0.138 | *** | 0.223 | *** | 0.063 | 0.091 | ** | |
| Highest qualifications: Degree | -0.163 | *** | -0.271 | *** | -0.134 | *** | -0.113 | ** |
| Highest qualifications: Other higher degree | -0.153 | *** | -0.125 | *** | -0.054 | -0.092 | ||
| Highest qualifications: A-level | -0.056 | -0.107 | *** | -0.057 | -0.060 | |||
| Highest qualifications: GCSE | -0.126 | *** | -0.064 | ** | -0.093 | *** | -0.083 | ** |
| Highest qualifications: Other qualification | -0.070 | -0.005 | -0.067 | -0.024 | ||||
| Employed | 0.303 | *** | 0.156 | *** | 0.240 | *** | 0.308 | *** |
| Married | 0.033 | 0.028 | 0.074 | *** | 0.110 | *** | ||
| Has children aged under 16 | 0.123 | *** | 0.057 | ** | 0.107 | *** | 0.136 | *** |
| Home-ownership status: Homeowner | 0.146 | *** | 0.140 | *** | 0.196 | *** | 0.179 | *** |
| Home-ownership status: Mortgage | 0.099 | *** | 0.180 | *** | 0.148 | *** | 0.169 | *** |
| North East | -0.138 | 0.008 | -0.085 | 0.050 | ||||
| North West | -0.054 | -0.035 | -0.164 | *** | -0.007 | |||
| Yorkshire and the Humber | 0.042 | 0.056 | -0.068 | -0.023 | ||||
| East Midlands | -0.074 | 0.074 | -0.075 | 0.096 | ||||
| West Midlands | -0.016 | 0.037 | -0.156 | *** | -0.017 | |||
| East of England | 0.013 | 0.031 | -0.063 | 0.037 | ||||
| South East | -0.021 | 0.035 | -0.029 | 0.058 | ||||
| South West | -0.053 | 0.096 | -0.077 | 0.090 | ||||
| Wales | -0.121 | -0.035 | -0.191 | *** | 0.030 | |||
| Scotland | 0.008 | -0.034 | -0.063 | 0.035 | ||||
| Northern Ireland | -0.051 | -0.070 | -0.044 | -0.010 | ||||
| Log (survival time) | -0.939 | *** | -0.565 | *** | -0.798 | *** | -0.778 | *** |
| Constant | -0.644 | *** | -1.003 | *** | -0.896 | *** | -0.917 | *** |
| Number of observations | 15,331 | 20,936 | 23,588 | 15,628 |
*** and **: statistically significant at the 1 and 5% level, respectively.
Table 4.13 shows the associations between the probabilities of relapsing into poor health and of developing a chronic condition and the individual characteristics explored. In many cases, these associations are consistent with those obtained for the hazard of recovery, in that they highlight some individual features which define disadvantaged groups. Notably, the results indicate that probability of relapsing into poor health is higher for:
- older people compared to those aged 16 to 24 (consistent across all specifications);[footnote 45]
- those not employed compared to employed people;
- people who rent compared to those who own the property in which they live (whether outright or through a mortgage); and
- people who have a qualification compared to those without (note: this result does not hold for people who relapse into a mental health condition)
Table 4.13 Estimating the discrete-time hazard of relapsing into poor health and developing one or more chronic conditions
| Self-assessed (general) health | Mental health or psychological distress | Long-term disability or illness | Long-term disability or illness (limiting) | Chronic conditions | ||||||
|---|---|---|---|---|---|---|---|---|---|---|
| Age category: Aged 25-34 | 0.377 | *** | 0.221 | *** | 0.281 | *** | 0.389 | *** | - | - |
| Age category: Aged 35-49 | 0.684 | *** | 0.263 | *** | 0.534 | *** | 0.584 | *** | - | - |
| Age category: Aged 50-59 | 0.831 | *** | 0.212 | *** | 0.737 | *** | 0.837 | *** | - | - |
| Age category: Aged 60-64 | 0.797 | *** | 0.041 | 0.777 | *** | 0.780 | *** | - | - | |
| Male | -0.003 | -0.156 | *** | -0.005 | -0.012 | -0.135 | *** | |||
| White ethnicity | 0.100 | 0.183 | *** | 0.082 | 0.124 | ** | -0.031 | |||
| Highest qualifications: Degree | 0.235 | *** | -0.079 | 0.163 | *** | 0.246 | *** | 0.446 | *** | |
| Highest qualifications: Other higher degree | 0.178 | *** | -0.068 | 0.133 | *** | 0.217 | *** | 0.283 | *** | |
| Highest qualifications: A-level | 0.148 | *** | -0.056 | 0.063 | 0.121 | ** | 0.326 | *** | ||
| Highest qualifications: GCSE | 0.094 | -0.053 | 0.112 | *** | 0.109 | ** | 0.245 | *** | ||
| Highest qualifications: Other qualification | 0.147 | ** | -0.002 | 0.061 | 0.017 | 0.233 | *** | |||
| Employed | -0.272 | *** | -0.167 | *** | -0.184 | *** | -0.322 | *** | -0.130 | *** |
| Married | -0.066 | -0.046 | -0.036 | -0.126 | *** | -0.077 | ||||
| Has children aged under 16 | -0.051 | -0.046 | -0.071 | ** | -0.097 | ** | -0.059 | |||
| Home-ownership status: Homeowner | -0.250 | *** | -0.193 | *** | -0.145 | *** | -0.257 | *** | -0.253 | *** |
| Home-ownership status: Mortgage | -0.187 | *** | -0.084 | ** | -0.137 | *** | -0.171 | *** | -0.257 | *** |
| North East | 0.012 | 0.094 | 0.057 | 0.006 | 0.146 | |||||
| North West | 0.104 | 0.021 | 0.141 | ** | 0.147 | 0.150 | ||||
| Yorkshire and the Humber | 0.019 | -0.038 | 0.154 | ** | 0.118 | 0.142 | ||||
| East Midlands | 0.088 | -0.036 | 0.152 | ** | 0.106 | -0.055 | ||||
| West Midlands | 0.112 | 0.081 | 0.143 | ** | 0.224 | *** | 0.004 | |||
| East of England | -0.051 | 0.092 | 0.100 | 0.064 | 0.167 | ** | ||||
| South East | 0.055 | 0.031 | 0.083 | 0.039 | 0.025 | |||||
| South West | 0.076 | 0.024 | 0.109 | 0.166 | ** | 0.034 | ||||
| Wales | 0.076 | -0.046 | 0.068 | 0.020 | -0.079 | |||||
| Scotland | -0.021 | 0.076 | 0.021 | -0.045 | 0.040 | |||||
| Northern Ireland | -0.019 | -0.092 | -0.076 | 0.071 | -0.088 | |||||
| Log(survival time) | -0.731 | *** | -0.619 | *** | -0.697 | *** | -0.656 | *** | 1.359 | *** |
| Constant | -1.748 | *** | -1.403 | *** | -1.509 | *** | -1.703 | *** | -8.317 | *** |
| Number of observations | 20,271 | 31,976 | 26,893 | 20,978 | 90,903 |
*** and **: statistically significant at the 1 and 5% level, respectively.
4.3. Findings from the sequence analysis
The sequence analysis method described in Chapter 3 is used to identify the most common sequences (patterns) of employment statuses and work conditions observed after the onset of, and exit from, poor health between USoc Waves 1 and 2. Poor health is measured using the same 5 health constructs as in the other analyses.
Each sequence is composed of 5 elements, one for each of the 5 waves observed following the initial health transition. Each element indicates which of 6 mutually exclusive ‘employment status : work condition’ combinations the individual is in at each wave. Note that an individual’s initial employment status and work condition (in Wave 1) is observed prior to the health transition (which occurs between Waves 1 and 2).
How to read the sequence analysis panels described below
Each column block describes one of 4 clusters that have been defined by the analysis. The height of the cluster (y-axis) refers to the number of individuals from the given sample (sequences) allocated to that cluster. The colours refer to one of 6 mutually exclusive combinations of employment status and work conditions. Each individual’s journey has been coded for one of these combinations for each of the 5 waves observed to give a sequence for that individual. These sequences have then been rearranged by a matching algorithm to maximise the similarity of individuals within a cluster and maximise the difference between clusters. Similarly, sequences within clusters have been arranged such that similar sequences are grouped together.
4.3.1. General patterns revealed across health constructs
In general, over the 5-year period observed, the sequence analysis reveals similar patterns of employment status and work condition trajectories across all health constructs. These can be summarised as follows:
- experiencing onset of poor general health:
- the largest group of people experiencing onset of poor general health remain in employment. About half of them remain satisfied with their job, while the other half are either transitorily or permanently dissatisfied with work but continue to work full time
- a similar proportion experiencing onset of poor general health were out of work at the time of the negative health transition and remain so for most of the time. Half of this group report that, at least temporarily, their withdrawal from employment was because of poor health
- a smaller group initially working part-time (and satisfied with their job) remains in part-time employment, but about half of them show transitions to temporary or permanent dissatisfaction with work
- when making a transition out of poor general health, a majority remain out of work or make transitions primarily to part-time work
- health and work outcomes of people experiencing changes in mental health are very similar to those found when people experience changes in general health, although a larger proportion is found to remain in full-time employment. However, within the cluster of people who experience continued employment, a much larger proportion shows temporary or permanent job dissatisfaction
- people experiencing onset of a long-term disability show similarly large proportions remaining in employment as found when looking at mental health conditions. A number of these people report transitory dissatisfaction with their job. Further work would be needed to understand to what extent, if any, the transitory nature of this dissatisfaction is the result of adjustments in the workplace. We also find a cluster of people who continue in full-time employment but report being dissatisfied with their job
4.3.2. Onset of / recovery from poor general health
Looking into the ‘employment status : work condition’ combinations by type of initial health transition, we start with people experiencing the onset of poor general health (see Figure 4.3, upper panel):
- a large proportion of this group are out of work at the time of the health shock and continue to be so (“Out of work” cluster of the upper panel). Some people in this cluster mention sickness as the reason for being out of work at some point in time (dark red)
- a similar proportion of individuals report being continuously in full-time employment, with around half remaining satisfied with their job (“FT work and satisfied” cluster of the upper panel, predominantly green) and around half showing temporary dissatisfaction with work,[footnote 46] while they stay in full-time employment (yellow)
- a smaller cluster has been identified including individuals in part-time employment who initially are satisfied with their work and either stay so in the following years or become temporarily dissatisfied immediately after the onset or in later periods (“PT work and satisfied” cluster)
- both groups in full-time and part-time employment show significant proportions (about a quarter to a third) of people who were initially dissatisfied, but who then either transitorily or permanently experience a return to satisfied work. Further work would be needed to understand the drivers of these changes, which could include health improvements, workplace adjustments or job changes
- the last cluster (“Out of work (sickness)” cluster of the upper panel, predominantly dark red) shows people who were already out of work because of sickness prior to the health transition and mainly continue to be so after their good self-assessed health became poor
The lower panel of Figure 4.3 shows the work trajectories after the exit from poor general health. Although the patterns in the lower panel are very similar to the ones observed after the onset of poor health, differences in the proportions of people experiencing these work trajectories exist:
- a large proportion of individuals initially out of work for any reason other than sickness mainly remain out of work even after exiting from poor general health (“Out of work” cluster)
- at the same time, an equally large proportion continue to be satisfied and in full-time work (“FT work and satisfied” cluster)
- understandably, compared to onset of poor general health, exit is associated with larger proportions of initially non-working people who move into full-time and part-time work and are satisfied with their job (“Out of work” cluster)
Figure 4.3 Sequence of employment states following the onset of and exit from poor general health
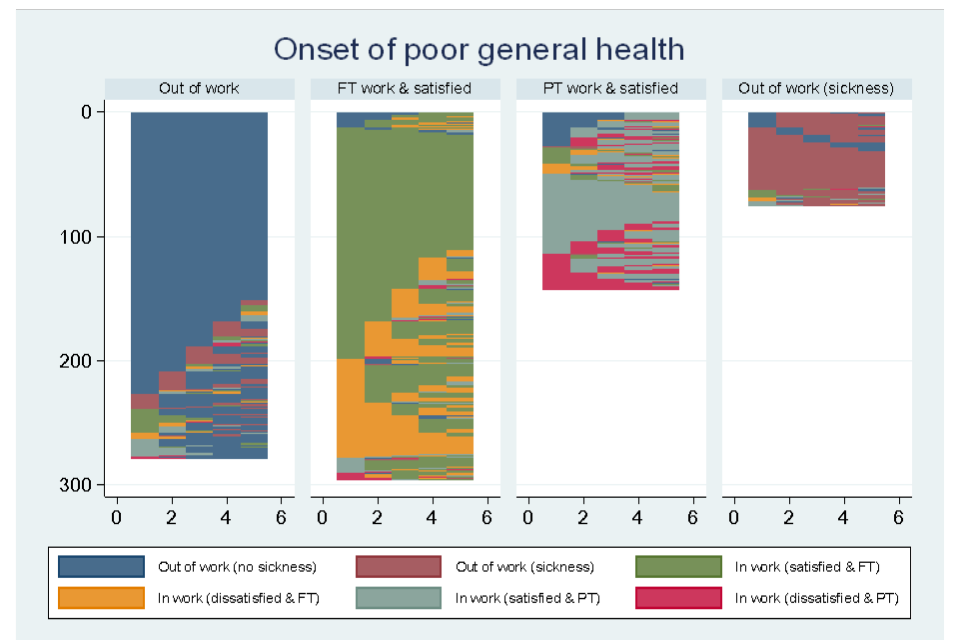
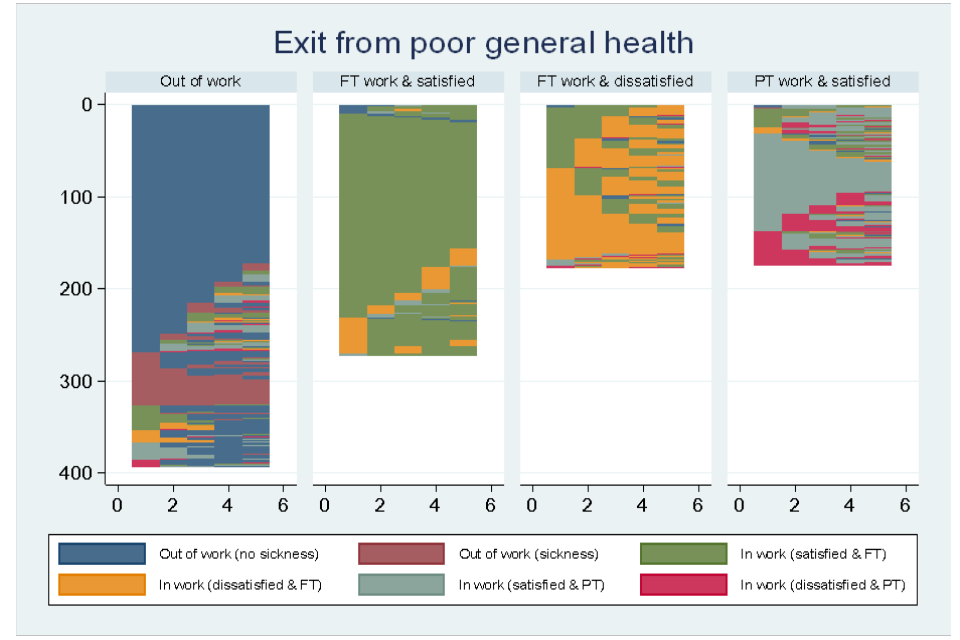
4.3.3. Onset of / recovery from poor mental health
Similar patterns to the ones observed for onset of poor general health are seen for people that experience onset of poor mental health (Figure 4.4). However, in comparison:
- while the proportion of people in “out of work” clusters is comparable, there is a larger proportion of people initially in full-time employment, who were satisfied with their job prior to the onset of poor mental health, who then experience transitory or permanent dissatisfaction with their job, but largely remain in work (“FT work and satisfied” cluster). For most people, this dissatisfaction was transitory
The lower panel of Figure 4.4 shows the ‘employment status : work condition’ trajectories after recovery from poor mental health. The observed trajectories here are very similar to the ones identified for people who recover from poor general health. However, in comparison:
- the proportion of people who work in full-time employment and who report dissatisfaction with work (“FT work and dissatisfied” cluster of the lower panel) is much larger for recovery from poor mental health
Figure 4.4 Sequence of employment states following the onset of and exit from poor mental health
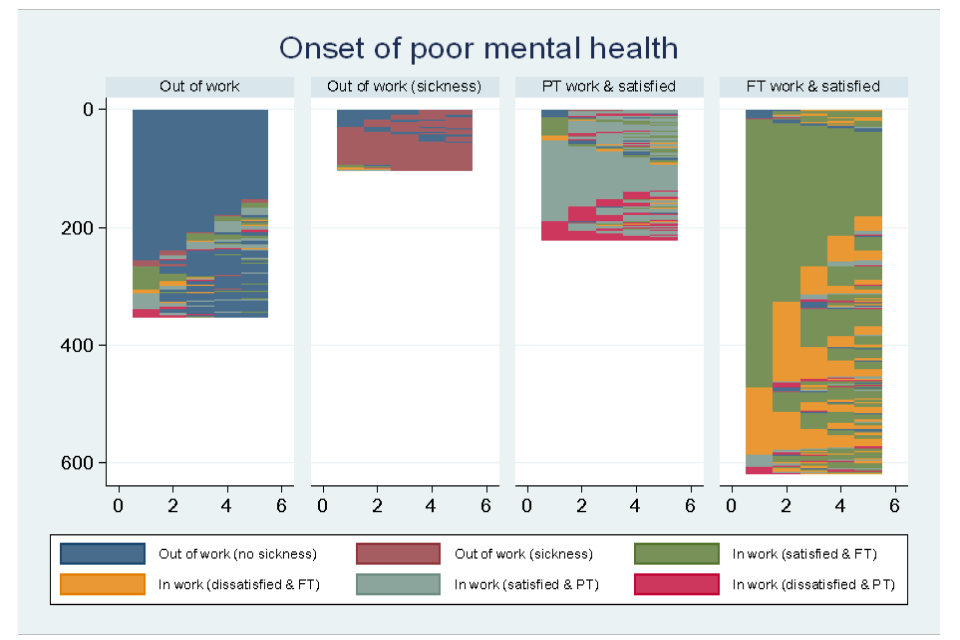
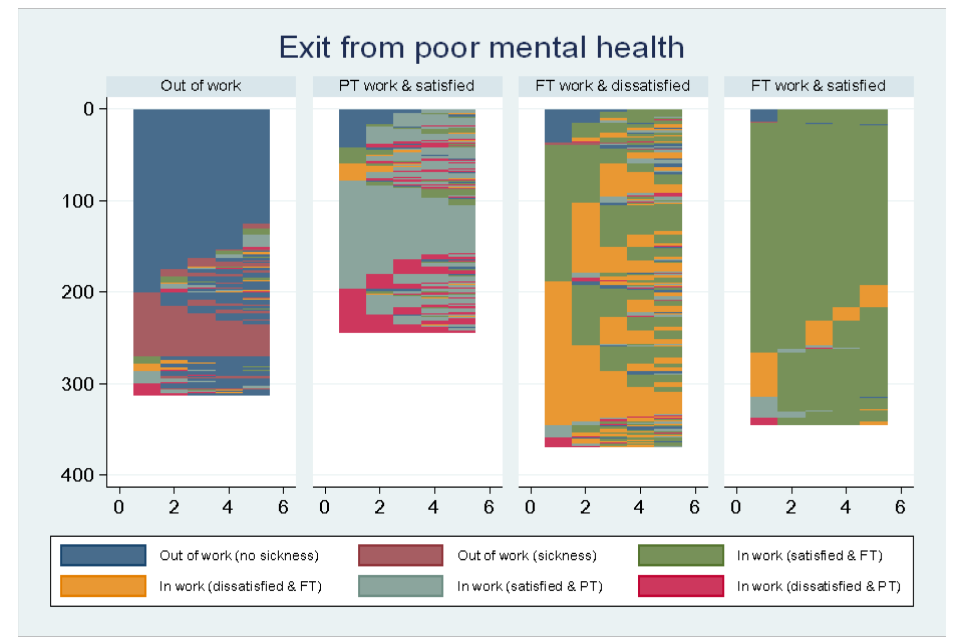
4.3.4. Onset of / recovery from long-term disability or illness (not limiting day-to-day activities)
The upper panel of Figure 4.5 shows the employment status-condition trajectories for people who experience the onset of a long-term disability or illness. There are some noteworthy differences in comparison to people experience the onset of poor general health or poor mental health:
- the proportion of people who are out of work and stay out of work which they report is due to sickness is almost negligible (“Out of work” cluster of the upper panel, dark red)
- compared to a transition to poor general health, we see a larger proportion of people in full-time work and dissatisfied in their job (“FT work and dissatisfied” cluster of the upper panel)
- there is a larger proportion of people who remain in full-time work but become dissatisfied, mostly temporarily (“FT work and satisfied” cluster of the upper panel)
The lower panel of Figure 4.5 shows the trajectories of people who recover from a long-term disability or illness. The patterns, as well as the proportions, of people experiencing a positive or a negative health shock appear to be very similar resulting in the same construction of clusters. However:
- the proportion of people who report sickness as the reason for being out of work is smaller after recovery (“Out of work” cluster of lower panel) and part-time employment increases in later periods
- people who are initially in part-time employment and are satisfied with their job (“PT work and satisfied” cluster of the lower panel) show more intermittent change with regards to working hours and their satisfaction level when they recover from a long-term disability or illness compared to people who experience onset
Figure 4.5 Sequence of employment states following the onset of and exit from a long-term disability/illness
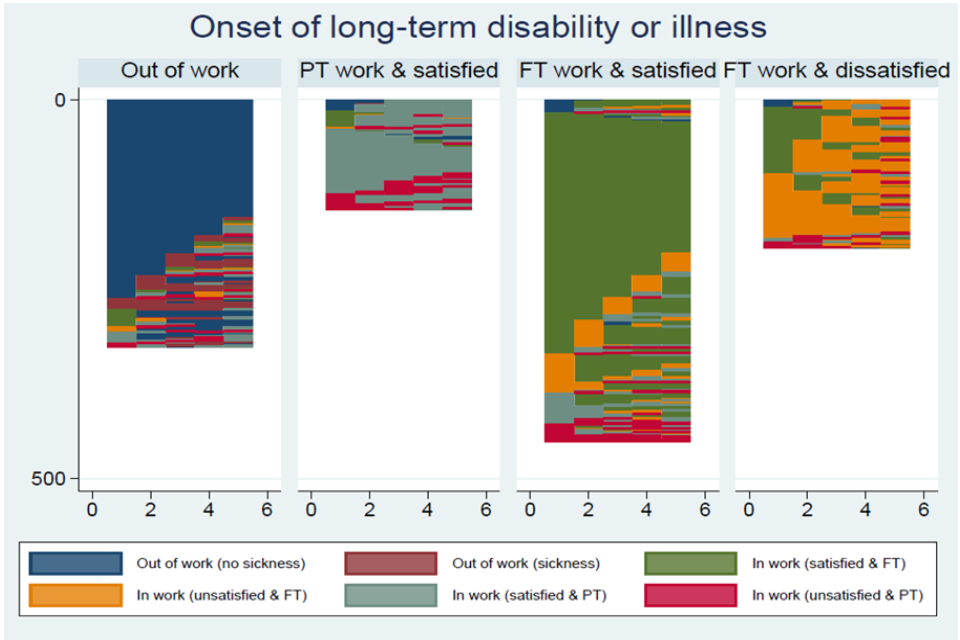
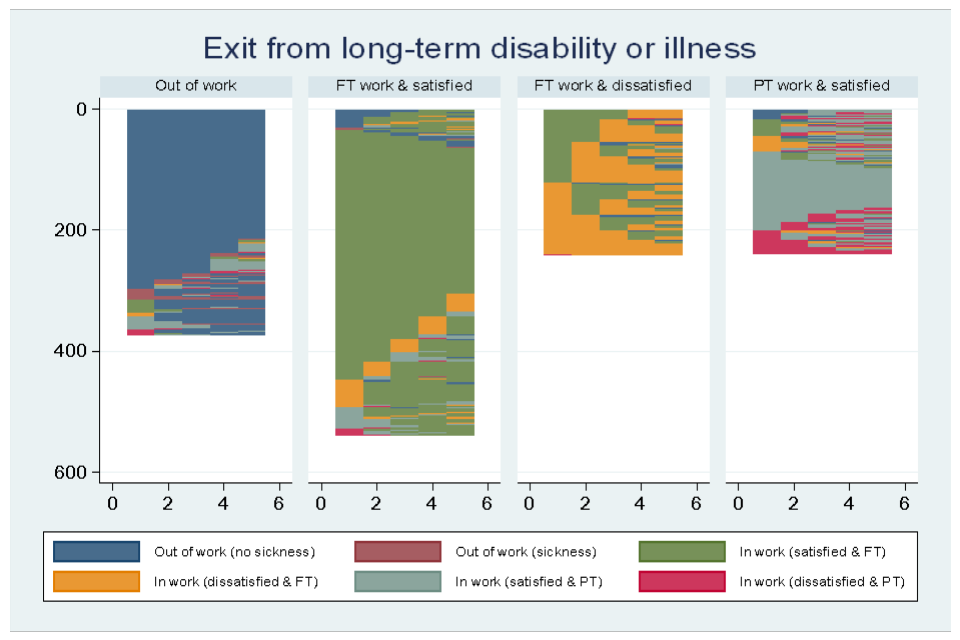
4.3.5. Onset of / recovery from long-term disability or illness (limiting)
The upper panel of Figure 4.6 shows the ‘employment status : work condition’ sequences of people who experience the onset of a long-term disability or illness that becomes functionally impairing. At the time when the transition occurs, most of the work and job satisfaction trajectories are comparable to the ones observed when other health constructs are used. However, in comparison to other health constructs:
- The proportion of people who are out of work and stay out of work due to sickness is much smaller (“Out of work” cluster of the upper panel)
The lower panel of Figure 4.6 shows the ‘employment status : work condition’ trajectories after recovery from a functionally impairing disability or illness. The patterns in this panel are very similar to the ones identified in the other health constructs after individuals have recovered. Noticeable differences suggest that in comparison to other health constructs:
- Dissatisfaction in work is more persistent after recovery (“FT work and dissatisfied” cluster of the lower panel)
Figure 4.6 Sequence of employment states following the onset of and exit from a limiting long-term disability/illness (functional impairment)
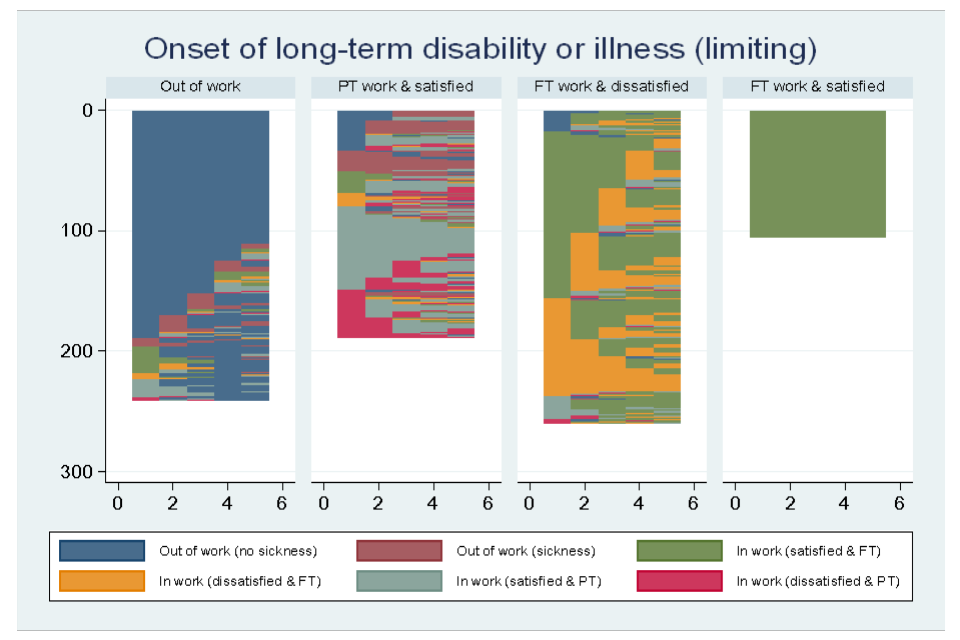
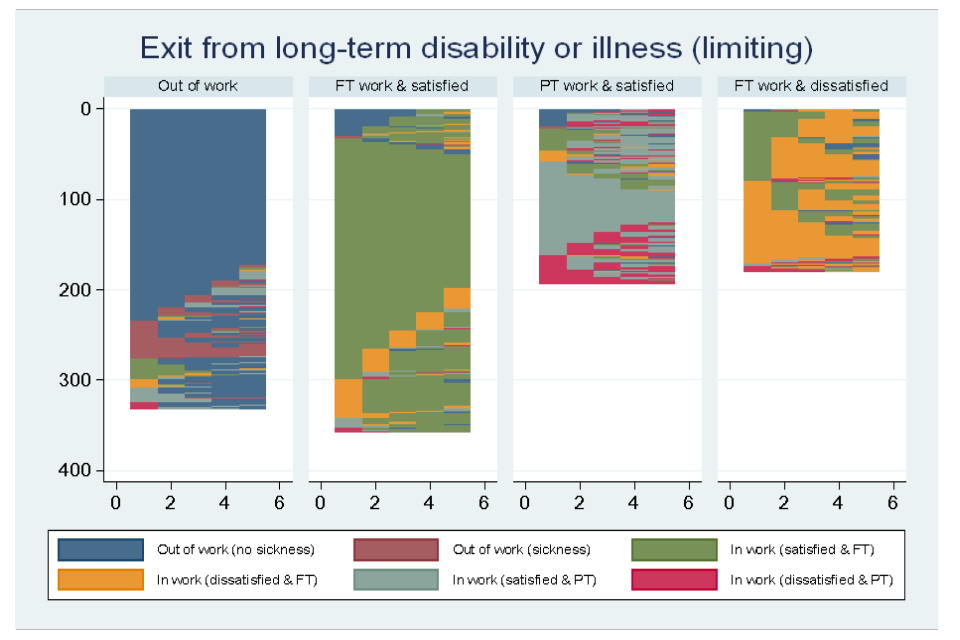
4.3.6. Onset of a chronic condition
Finally, Figure 4.7 shows trajectories of people who experience onset of a chronic condition. Since such conditions can improve but not disappear, sequence analysis was only carried out for trajectories after the onset of a diagnosed chronic condition. Although the trajectories are comparable to the ones observed for the other health constructs, the proportions differ slightly:
- we see much more variation with regards to job satisfaction and working hours for people experiencing the onset of a chronic condition
Figure 4.7 Sequence of employment states following the onset of a chronic condition
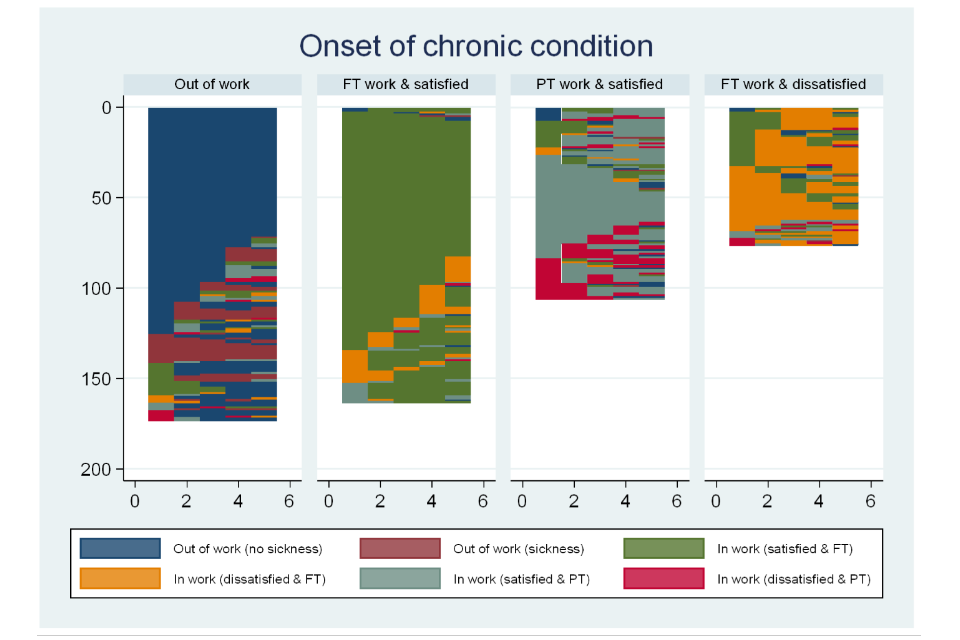
5. Conclusions
This section summarises the findings from the analysis of health and work transitions reported in Chapter 4, offering some conclusions and suggestions for further research.
5.1. Impact of health transitions on work transitions
Negative health transitions
- regardless of health construct, the onset of a health problem is associated with a greater likelihood of job loss (or becoming inactive) both around the time of the onset and, to a lesser extent, one year later. Beyond this timeframe, there is less evidence of impacts over the longer term - the magnitude of effects detected is generally small
- individuals who remain in employment following the onset of poor health are more likely to become dissatisfied with their job around the same time, regardless of health construct. However, people who experience onset of poor mental health are most likely to become dissatisfied in work. There is some evidence that onset of poor health is associated with a greater likelihood of an individual moving to temporary, low-paid or part-time work, but these impacts are small and are not consistent across all health constructs
Positive health transitions
- recovery from poor health is associated with a greater likelihood of an individual having become employed in the same period. The effect is strongest for those recovering from poor mental health. The findings for entering activity are more complex. Individuals who recover from a mental health condition are more likely to become active in the same period as their recovery. However, one year later this effect appears to reverse. This could be due to relapsing back into poor health, but further investigation is required to understand this observation
- people who are employed and experience a recovery from poor health (general or mental) are associated with a greater likelihood of becoming satisfied with their job in the same period. However, for people recovering from mental health conditions this impact is reversed one and 2 years later
- people who recover from mental health conditions are more likely to move from low-paid to high-paid jobs in the same period
- people who recover from poor general health appear to be less likely to move from part-time to full-time work
It is important to note that impact estimates relating to the onset of poor mental health are likely to underestimate true impacts. This is because poor mental health is generally recognised as being under-reported in surveys, such as USoc, that rely on self-reporting as opposed to diagnostic question sets. Therefore, we would expect that negative health transitions result in more detrimental effects than those illustrated in this report.
However, we acknowledge that with annual data points it is not possible to remove the issue of reverse causality (employment transitions having an impact on health transitions) when work and health transitions are observed to occur in the same period. Consideration of the wider literature on the impact of negative work transitions on health would help put the results of this study in context.
The direction of the estimation bias for the impact of health recovery due to under-reporting ill-health is less clear - estimates should, therefore, be considered with caution.
Impact moderators
The analysis of moderators explores how qualifications, workplace size, skills and home ownership affect the impact of onset of poor health on likelihood of work transition. The findings suggest a role for the following:
- qualifications: individuals with incident poor health (general or mental) are less likely to experience job loss (or become inactive) if they have a degree. However, individuals with a degree are more likely to become dissatisfied with their job following the onset of poor health. For individuals with an incident long-term health condition that limits their day-to-day activities, those with a degree are less likely to move from high-paid to low-paid jobs
- workplace size: the likelihood of experiencing job loss following onset of poor health (general or mental) is lower for people working in larger workplaces (200 or more employees) compared to smaller workplaces. However, among people who remain in work following incident poor general health, those working for larger employers are more likely to experience job dissatisfaction
- skills: onset of poor mental health is less detrimental for skilled than unskilled employees (lower proportions are observed leaving employment following onset). However, skilled employees are also more likely to become dissatisfied with their job than unskilled employees. There is some evidence suggesting that following onset of a self-reported long-term disability or illness skilled employees are less likely to move to part-time jobs than unskilled employees
- home ownership: no systematic evidence of any moderating effect of home ownership is found. However, among those that experience onset of a disability or illness that limits daily activities, those who own the property in which they live outright are found to be more likely to move from permanent to temporary jobs than those who own through a mortgage or rent
It is important to note that the moderating effects described above refer exclusively to health and work transitions that occur in the same period. We found weak evidence of any moderating effects one, 2 or 3 years after the onset of poor health. Data limitations mean that health transitions could have happened before, at the same time or after work transitions, and therefore the observed associations may reflect:
- anticipation effects (people experiencing a work transition because they know they are about to undergo a health transition);
- immediate effects of health transitions;
- reverse causality (impact of work transition on health transitions); or
- a combination of the above
5.2. Survival analysis
The findings of the survival analysis are, in the main, consistent across the definitions of poor health. They indicate that the probability of recovering from poor health is higher for:
- white people compared to other ethnic groups;
- employed people compared to those not in employment;
- people with children aged under 16 in the household compared to those without;
- people who own their home outright or through mortgage compared to those who rent;
- young people (aged 16 to 24) compared to older people (age categories 35 to 49, 50 to 59 and 60 to 64). However, when the analysis investigates a recovery from poor mental health, older people are found to recover at a faster rate on average; and
- people with no qualifications compared to those with qualifications (notably degree but, for some specifications, also lower qualifications). Interestingly, the higher the qualification the lower the likelihood of recovering from poor mental health
These results suggest that a number of demographic and socio-economic factors (including age, ethnicity, employment status, skills and financial wealth) are related to an individual’s likelihood of recovering from poor health.
The survival analysis on relapsing into poor health and the onset of chronic conditions matches the findings for certain characteristics influencing recovery. In many cases, the associations are consistent with those obtained for the hazard of recovery, in that they highlight some individual features which define disadvantaged groups. Notably, the results indicate that probability of relapsing into poor health is higher for:
- older people (aged 25 to 64) in comparison to young people (aged 16 to 24);
- people who are not in employment;
- people who do not own their home; and
- people with higher levels of qualifications, compared to those without (with the exception of mental health conditions)
An interesting finding here is that individual characteristics associated with a higher likelihood of relapsing into poor health are not necessarily the same as those associated with a lower likelihood of recovering. For example, people of white ethnicity are found to be more likely to recover from and, at the same time, more likely to relapse into poor mental health compared to people of other ethnicities. This could reflect differences in behaviour across different groups, in the way individuals adjust after a health shock in the short or longer-term. However, it could also be caused by differences in (observable and unobservable) characteristics between people recovering and relapsing into poor health (for example, those in the sample used for the analysis concerned with relapsing into poor mental health are more likely to be employed than those in the sample used for the recovery analysis – see Tables A6.8 and A6.9 in Appendix 6). Further work would be required to better understand this phenomenon.
5.3. Sequence analysis
The aim of the sequence analysis was to describe trajectories of employment and work condition outcomes for people experiencing onset of, or exit from, health conditions up to 5 years after the health transition. The findings show similar patterns of employment and work condition outcomes following different health transitions.
- experiencing onset of, or exit from, poor general health:
- the largest group of people experiencing onset of poor general health remain in employment. Half of them remain satisfied with their job while the other half become unsatisfied (either transitorily or permanently) with work
- an almost equally large proportion experience onset of poor general health during periods outside of employment and mostly remain outside employment. Half of this group say that, at least temporarily, their withdrawal from employment was because of poor health
- a smaller group working part-time with good job satisfaction remains in part-time employment but about half of them report temporary or permanent dissatisfaction with work
- when making a transition out of poor general health, a larger proportion remains out of work or makes transitions primarily to part-time work
- health and work outcomes of people experiencing changes in mental health are very similar to those for people experiencing changes in general health, although a larger proportion is found to remain in full-time employment
- people experiencing onset of a long-term disability show similarly large proportions remaining in employment as found when looking at mental health conditions. A large cluster of these people report only transitory dissatisfaction with work. This may reflect adjustments in the workplace that facilitated continued labour market activity – however, further work would be required to understand this phenomenon. However, amongst this group, we also find the largest proportion of people saying that while they continue full-time employment they are dissatisfied with work
5.4. Conclusions and suggestions for further research
This research was intended to examine the relationships between a range of health and work transitions that have been under-explored despite being of interest to policymakers. The impact of unemployment, and particularly long-term unemployment, on health has been researched extensively (see Bartley (1994) for a review of the research). However, the causal link between health transitions and employment transitions, in both directions, has been less researched.
This study provides a basic exploratory analysis of health and work transitions. Further research would be needed to examine whether the effects of transitions were symmetrical or asymmetrical. For example, are the negative associations of incident poor health on likelihood of employment exit similar in scale to the positive associations of health recovery on employment entry? The question of whether people suffering negative health and work transitions followed by positive ones returned to similar occupational and earnings status as their previous one, and how quickly, has been beyond the scope of this study.
Further analysis of Understanding Society could be done using the biomarkers that are collected on a proportion of survey respondents. This could be related to their self-identified health status responses.
Additionally, with informed consent, other datasets may be a valuable source to link to for future such analysis. For example, if it were possible to associated USoc respondents with relevant administrative data (DWP benefit claim data, HMRC employment and earnings data) this might enable analysis for a larger scale study with a finer granularity of time (where the annual periodicity of Understanding Society may be a drawback). Linkage of bespoke health cohort studies with administrative employment data would be even more informative.
6. References
Bartley, M., 1994. Unemployment and ill health: understanding the relationship. Journal of Epidemiology & Community Health, 48(4), pp.333 to 337.
Bharadwaj, P., Pai, M.M. and Suziedelyte, A., 2017. Mental health stigma. Economics Letters, 159, pp.57 to 60.
Black, C., 2008. Dame Carol Black’s review of the health of Britain’s working age population: Working for a healthier tomorrow. Stationery Office.
Blackaby, D.H., Murphy, P.D. and O’Leary, N.C., 1999. Hourly earnings differentials for unionised labour: a decile-based examination in Great Britain. University College of Swansea, Department of Economics.
Blundell, R. and Costa Dias, M., 2000. Evaluation methods for non‐experimental data. Fiscal studies, 21(4), pp.427 to 468.
Browning, M. and Heinesen, E., 2012. Effect of job loss due to plant closure on mortality and hospitalization. Journal of health economics, 31(4), pp.599 to 616.
Cano, A., Sprafkin, R., Scaturo, D., Lantinga, L., Fiese, B. and Brand, F., 2001. Mental Health Screening in Primary Care: A Comparison of 3 Brief Measures of Psychological Distress. The Primary Care Companion to the Journal of Clinical Psychiatry, 3(5), pp.206 to 210.
Curnock, E., Leyland, A.H. and Popham, F., 2016. The impact on health of employment and welfare transitions for those receiving out-of-work disability benefits in the UK. Social Science & Medicine, 162, pp.1 to 10.
Dawson, C., Veliziotis, M., Pacheco, G. and Webber, D.J., 2015. Is temporary employment a cause or consequence of poor mental health? A panel data analysis. Social Science & Medicine, 134, pp.50 to 58.
Department for work and pensions and Department of health, 2016. The Work, Health and Disability Green Paper, s.l.:s.n.
Flint, E., Bartley, M., Shelton, N. and Sacker, A., 2013. Do labour market status transitions predict changes in psychological well-being?. J Epidemiol Community Health, 67(9), pp.796 to 802.
García-Gómez, P., Jones, A.M. and Rice, N., 2010. Health effects on labour market exits and entries. Labour Economics, 17(1), pp.62 to 76.
Hellevik, O., 2009. Linear versus logistic regression when the dependent variable is a dichotomy. Quality & Quantity, 43(1), pp.59 to 74.
Jones, M., Mavromaras, K., Sloane, P.J. and Wei, Z., 2018. The dynamic effect of disability on work and subjective well-being. Oxford Economic Papers, 70(3), pp.635 to 657.
Kidd, M.P., Sloane, P.J. and Ferko, I., 2000. Disability and the labour market: an analysis of British males. Journal of health economics, 19(6), pp.961 to 981.
King, G. and Zeng, L., 2001. Logistic regression in rare events data. Political analysis, 9(2), pp.137 to 163.
Long, J. S. 1997. Regression Models for Categorical and Limited Dependent Variables (1st ed.). Sage Publications, Inc.
Marcus, J., 2013. The effect of unemployment on the mental health of spouses–Evidence from plant closures in Germany. Journal of health economics, 32(3), pp.546 to 558.
Meltzer, H., Gill, B., Petticrew, M. and Hinds, K., 1995. OPCS Surveys of Psychiatric Morbidity in Great Britain, Report 3: Economic activity and social functioning of adults with psychiatric disorders. London: HM Stationery Office.
Meyer, B.D. and Mok, W.K., 2019. Disability, earnings, income and consumption. Journal of Public Economics, 171, pp.51 to 69.
Pacheco, G., Page, D. and Webber, D., 2012. Mental and physical health: reconceptualising the relationship with employment propensity (No. 20121206)
Prentice, R.L. and Gloeckler, L.A., 1978. Regression analysis of grouped survival data with application to breast cancer data. Biometrics, pp.57 to 67.
Rich, J.T., Neely, J.G., Paniello, R.C., Voelker, C.C., Nussenbaum, B. and Wang, E.W., 2010. A practical guide to understanding Kaplan-Meier curves. Otolaryngology—Head and Neck Surgery, 143(3), pp.331 to 336.
Schmitz, H., 2011. Why are the unemployed in worse health? The causal effect of unemployment on health. Labour economics, 18(1), pp.71 to 78.
Tøge, A.G. and Blekesaune, M., 2015. Unemployment transitions and self-rated health in Europe: A longitudinal analysis of EU-SILC from 2008 to 2011. Social Science & Medicine, 143, pp.171 to 178.
Van Der Westhuizen, D.W., Pacheco, G. and Webber, D.J., 2012. Culture, participative decision making and job satisfaction. The International Journal of Human Resource Management, 23(13), pp.2661 to 2679.
Waddell, G. and Burton, A.K., 2006. Is work good for your health and well-being?. The Stationery Office.
Webber, D.J., Page, D., Veliziotis, M. and Johnson, S., 2015. Does poor health affect employment transitions?
Work and Health Unit, 2016. Improving Lives: The Future of Work, Health and Disability Green Paper, cm 9342
Work and Health Unit, 2017. Improving Lives: The Future of Work, Health and Disability, cm 9526
7. Appendices
7.1. Appendix 1 - Indicative time and size of impact of health transitions on work transitions
For individuals who experienced a negative health transition (onset of poor health) between USoc Wave 1 and Wave 2 we observe exits from employment occurring between Wave 1 and Wave 2 (contemporaneous health and work transitions) and exits from employment which took place between any pair of successive waves (between Wave 2 and Wave 3, between Wave 3 and Wave 4, etc.). In a similar fashion, contemporaneous and subsequent entries into employment are explored for people who experienced a positive health transition (exit from poor health) between the first 2 USoc waves. At any point in time, the difference between the proportions who exited (entered) employment for the Onset (Exit) and No onset (No exit) groups provides an indicative measure of the impact of negative (positive) health transitions on work transitions. The same analysis was carried out for transitions into and out of economic activity.
Figure A1.1 shows the proportion of people exiting employment among those who experienced a negative health transition (‘Onset’ category) and among those who did not (‘No onset’ category). An individual can leave employment between Wave 1 and Wave 2 (exit at time 0) or at later time points. Exiting employment at time 1 means that the subject has been employed up to (and including) Wave 2 and not-employed at Wave 3, i.e. they left employment at some point in time between Wave 2 and Wave 3, having been employed at Waves 1 and 2. Similarly, exiting employment at time 2 denotes an employment exit between Wave 3 and Wave 4, having been employed in Waves 1, 2 and 3. Note that, by construction, the employment exit variable indicates the first instance of exiting employment for each individual. Therefore, experiencing an employment exit at a specific time point implies that, after the onset of poor health, no employment exit was experienced before and no employment exit will be observed after for the same individual. Summing the percentages observed for the Onset (No onset) group up to and including any time point provides the cumulative percentage of people, among those who experienced (did not experience) the initial health transition between the first 2 USoc waves, who exited employment by that point in time.
Figure A1.1 Employment exit among those at risk of experiencing onset of poor health between Wave 1 and Wave 2, separately for those who experience the health transition (Onset) or those who do not (No onset)
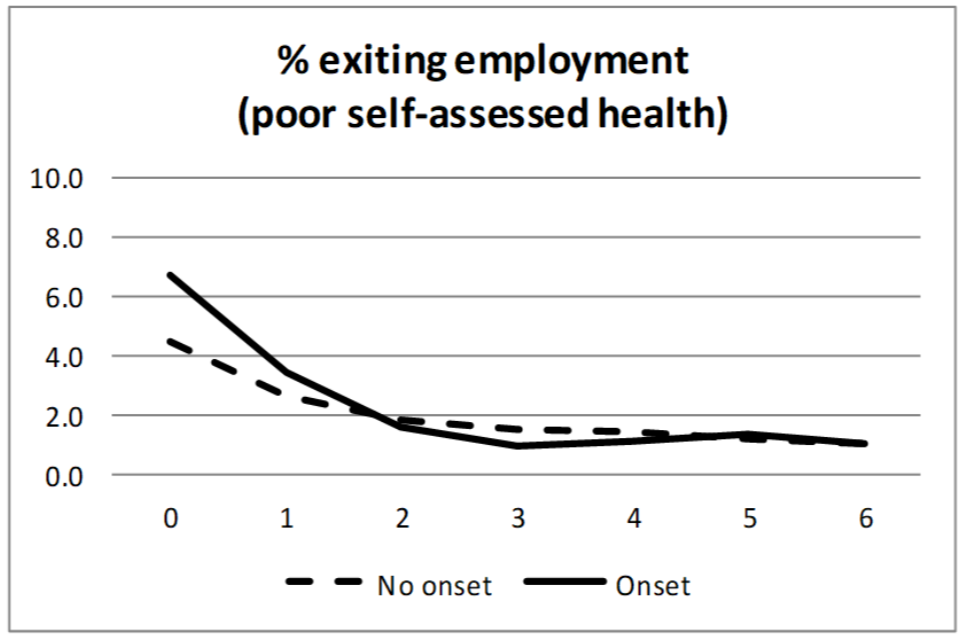
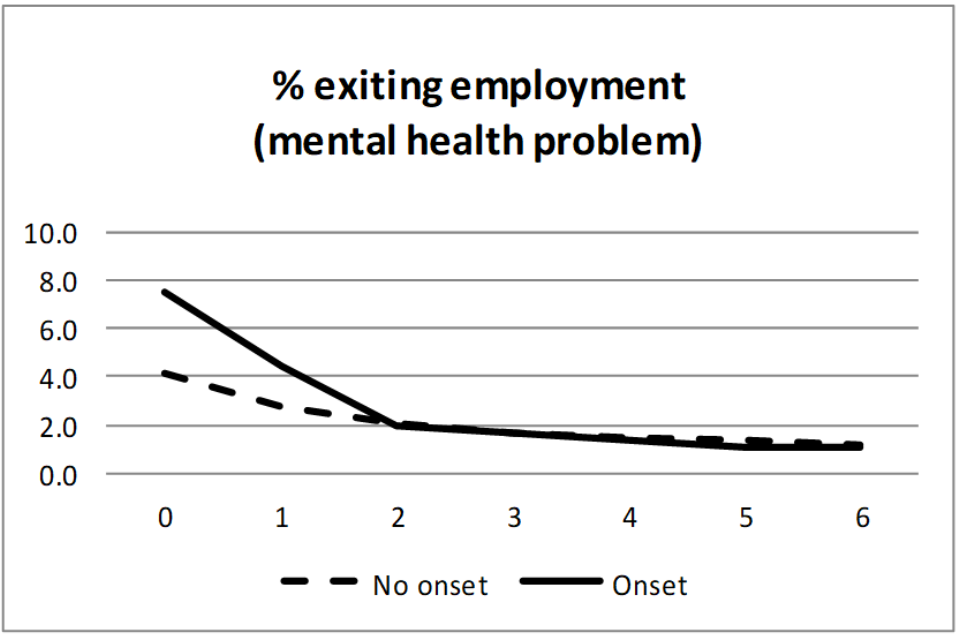
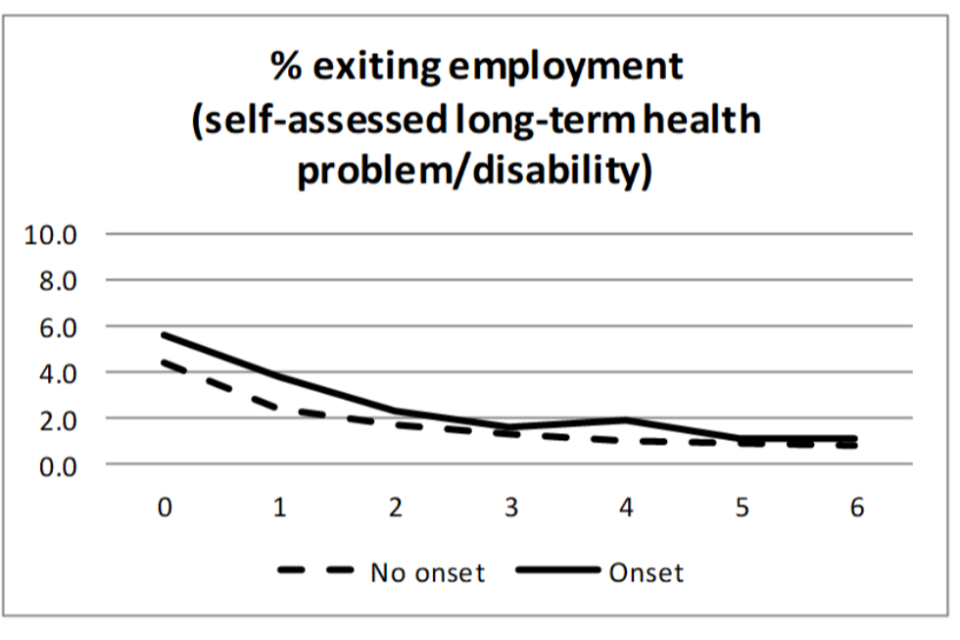
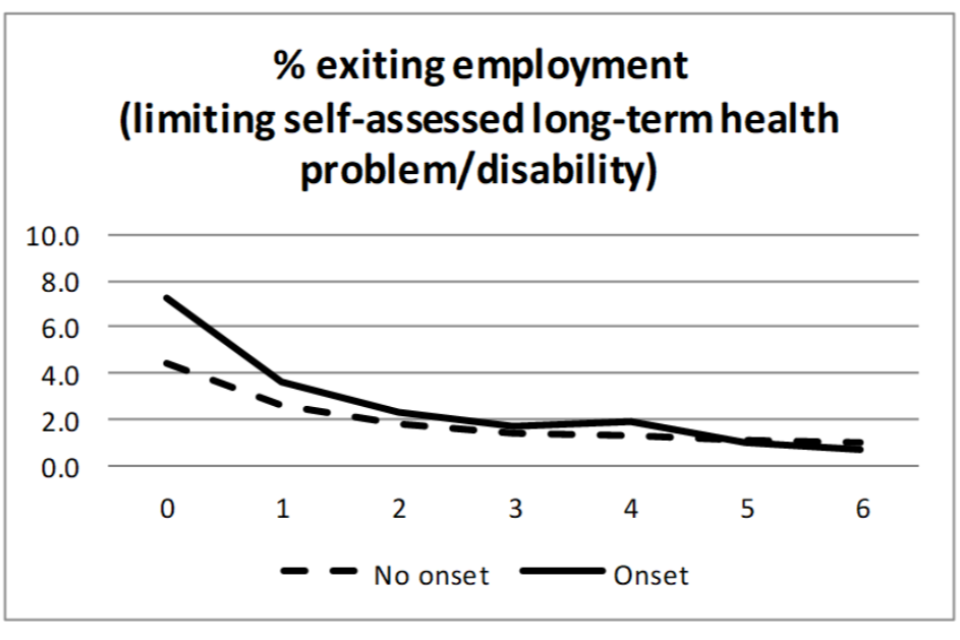
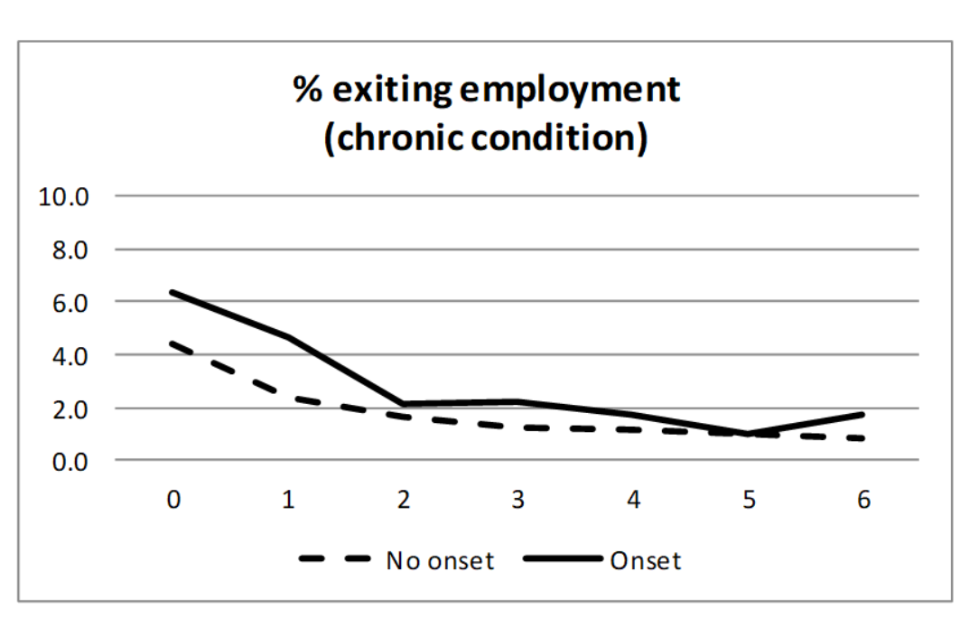
The 5 graphs in Figure A1.1 show that, in general, the proportion of individuals who experienced an exit from employment is higher among those who experienced a negative health transition (‘Onset’ category) compared to those who did not (‘No onset’ category), and this suggests that experiencing onset of poor health increases the likelihood of leaving work. For both groups, the largest percentage experiencing an exit from employment is observed at time 0, which is also the time point with the greatest employment exit gap. This means that the largest impact of the onset of poor health on employment exit is observed in the same period the onset takes place.[footnote 47]
As the graphs clearly show, the percentage of individuals experiencing an employment exit reduces over time. However, while a sharp decline is generally observed between time 0 and time 3, the percentage change is much lower between time 3 and time 6 (not more than 1ppt). Overall, the employment exit gap is closed by time 3, suggesting a small, negligible impact in the time period starting 3 years after the initial health shock (with the exception for the onset of a chronic condition, the effect is always smaller than 1ppt).
The findings for employment entry, illustrated by means of Figure A1.2, are in line with those found for employment exit. In general, those who exited from poor health between Wave 1 and Wave 2 (‘Exit’ category) experienced better outcomes (higher proportions entering employment) than those who remained in poor health (‘No exit’ category) between the same 2 waves. This finding suggests that, for the individuals observed, the likelihood of entering work increased following an exit from poor health. The employment entry gap is largest at time 0 (impacts in the region of between 2 and 4ppts are observed), progressively reduce over time, and ceases to exist by time 3.
Figure A1.2 Employment entry among those at risk of experiencing an exit from poor health between Wave 1 and Wave 2, separately for those who have the health transition (Exit) or those who do not (No exit)
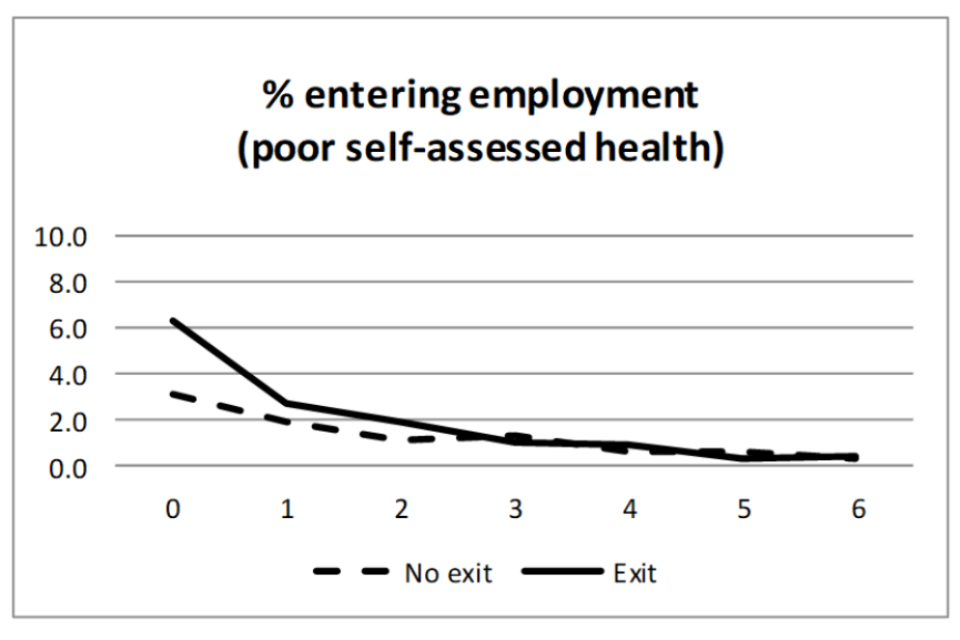
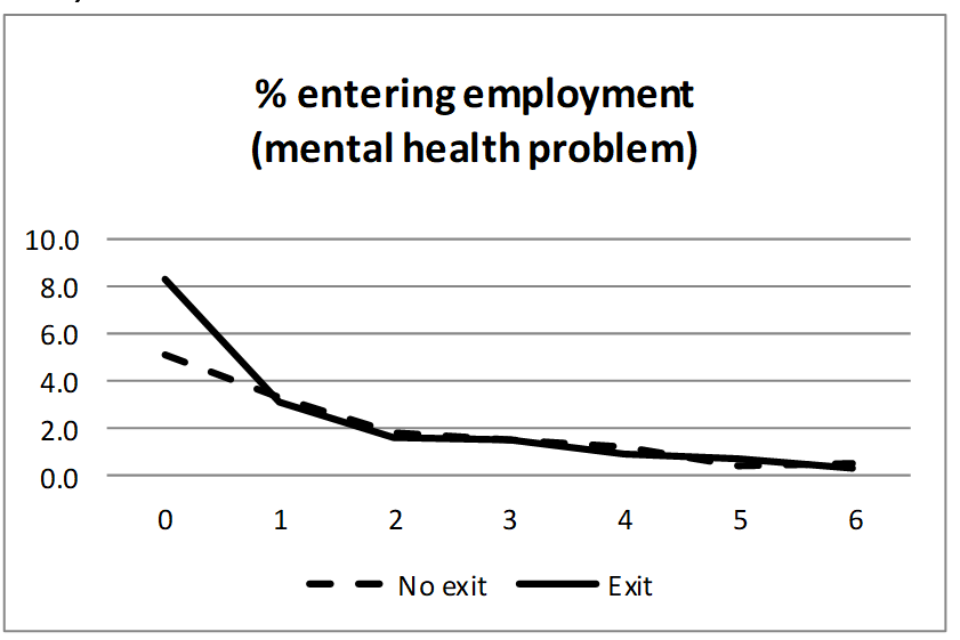
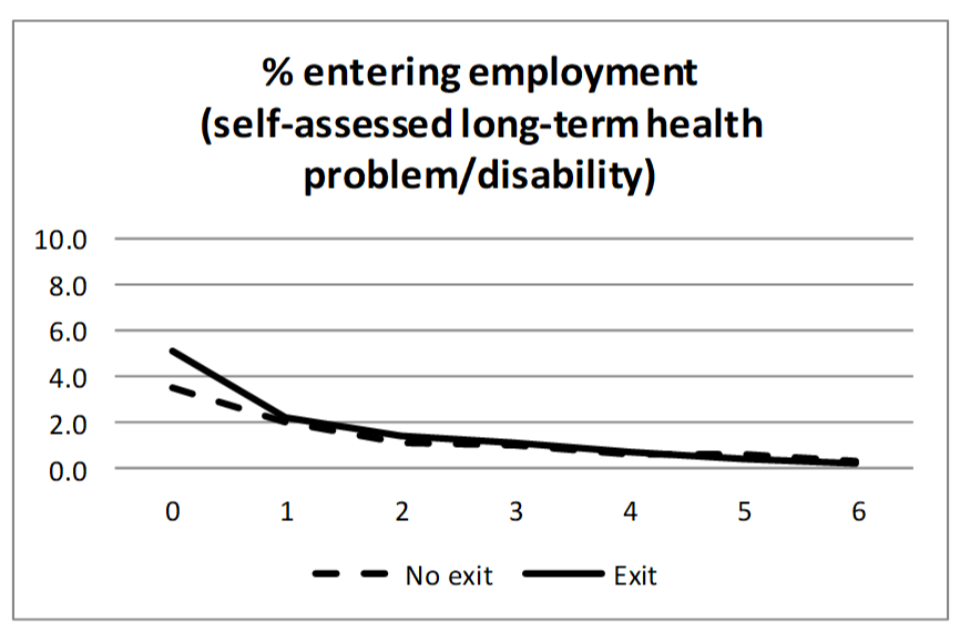
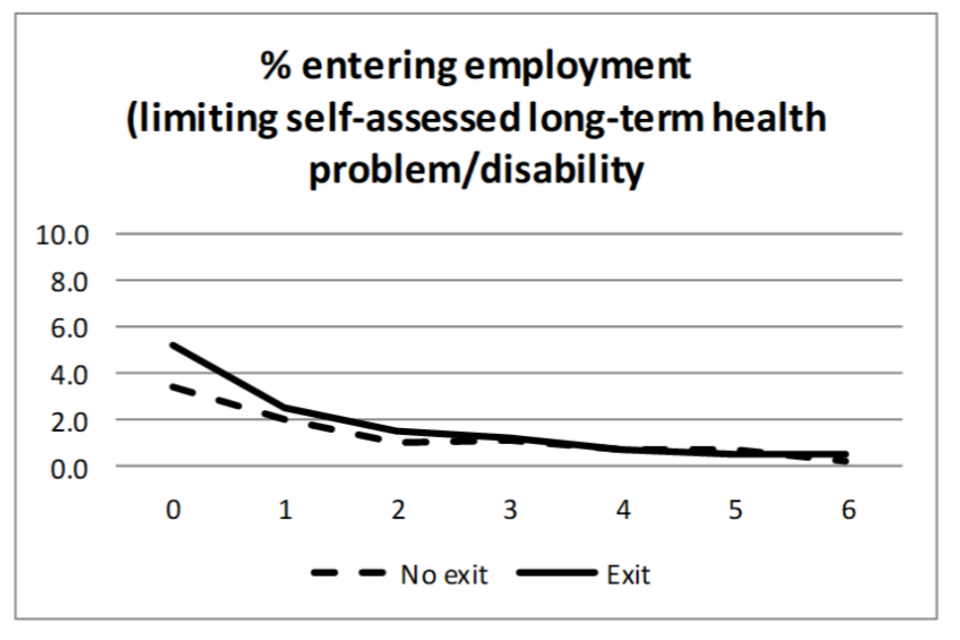
Overall, similar results are found when entries into and exits from economic activity, rather than employment, are explored (see Figures 1.3 and 1.4).
Figure A1.3 Activity exit among those at risk of experiencing an onset of poor health between Wave 1 and Wave 2, separately for those who experience the health transition (Onset) and those who do not (No onset)
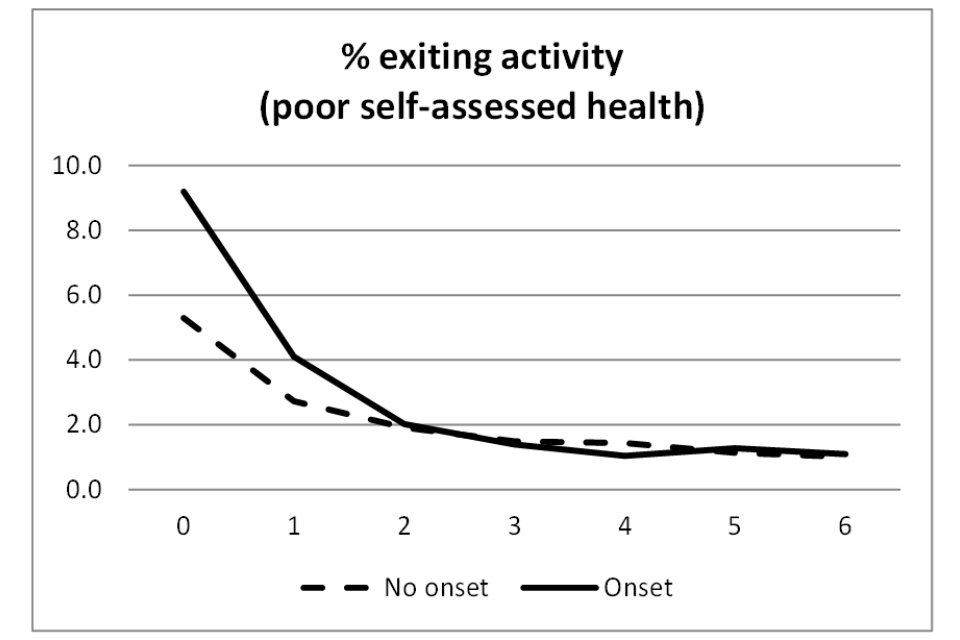
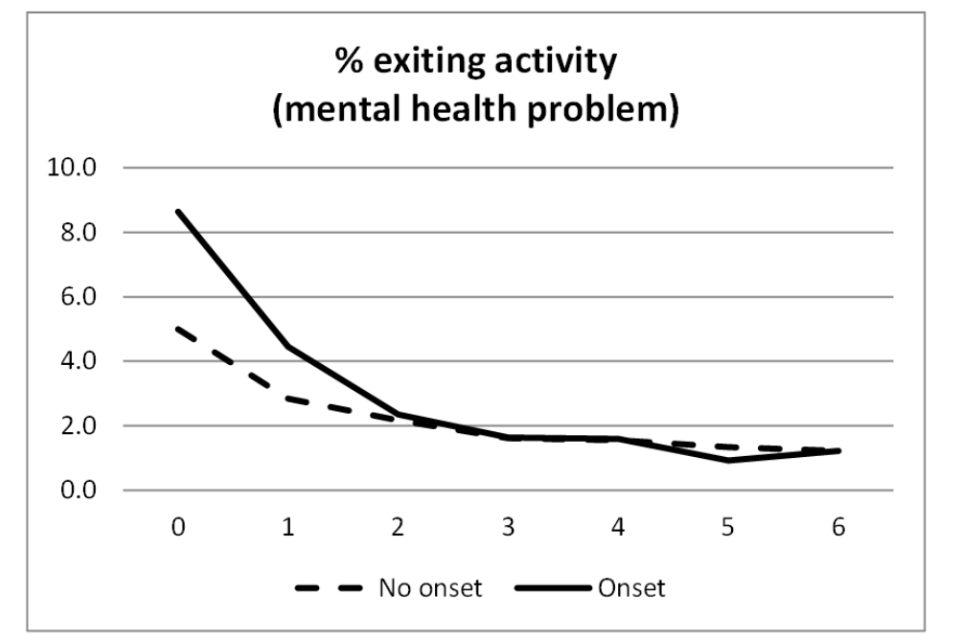
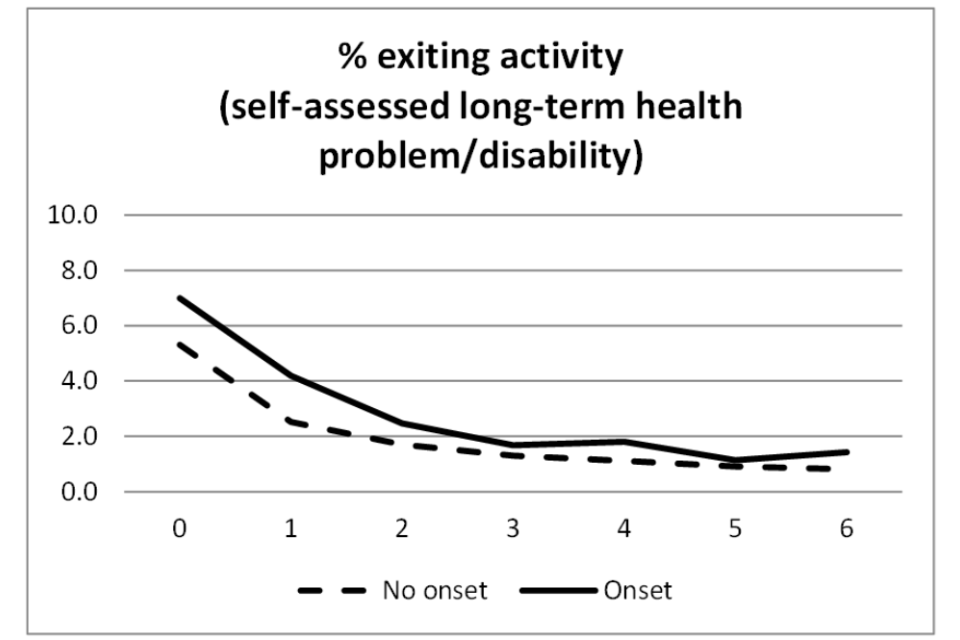
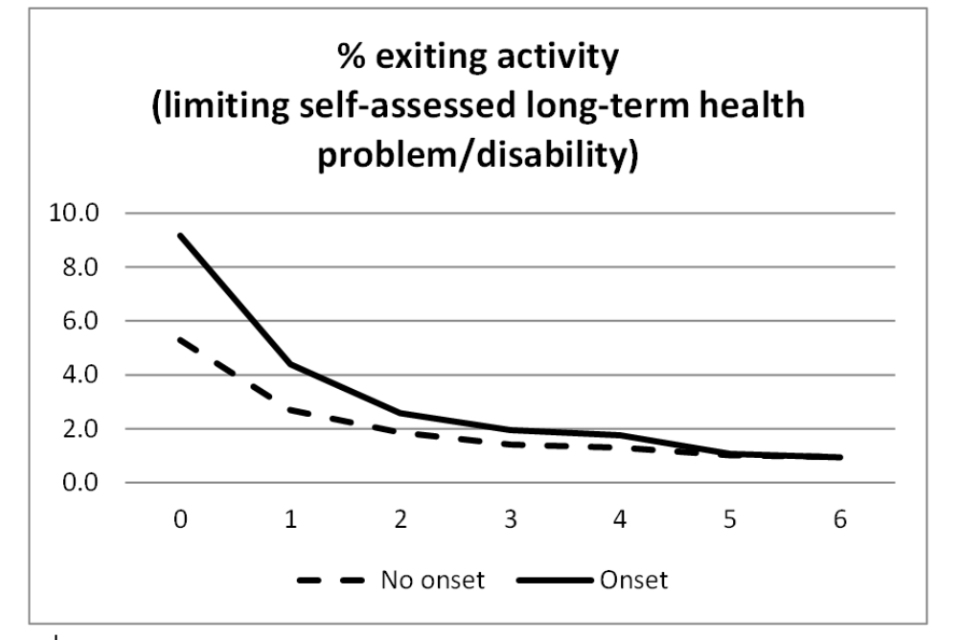
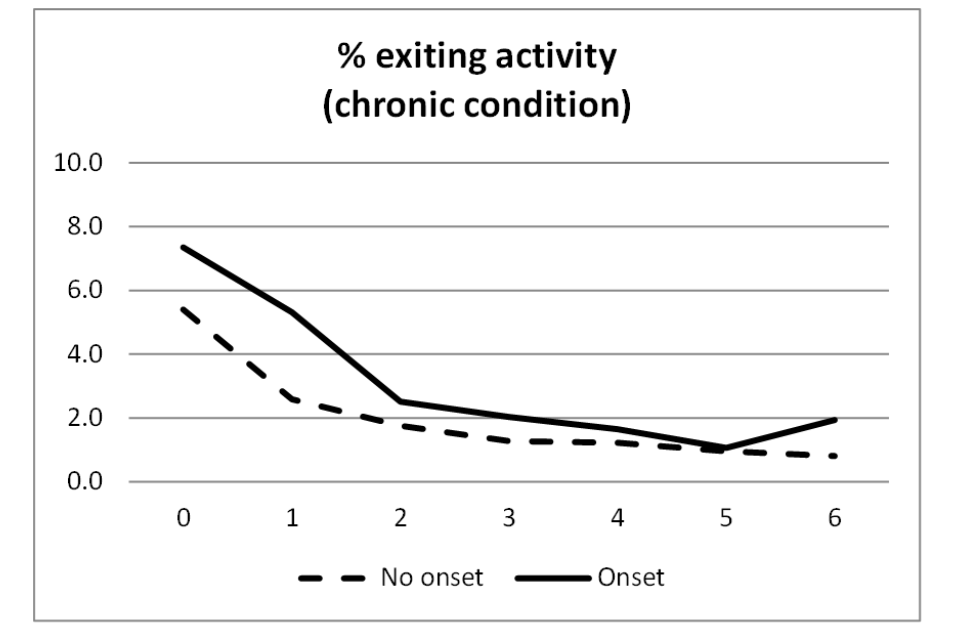
Figure A1.4 Activity entry among those at risk of experiencing an exit from poor health between Wave 1 and Wave 2, separately for those who experience the health transition (Exit) and those who do not (No exit)
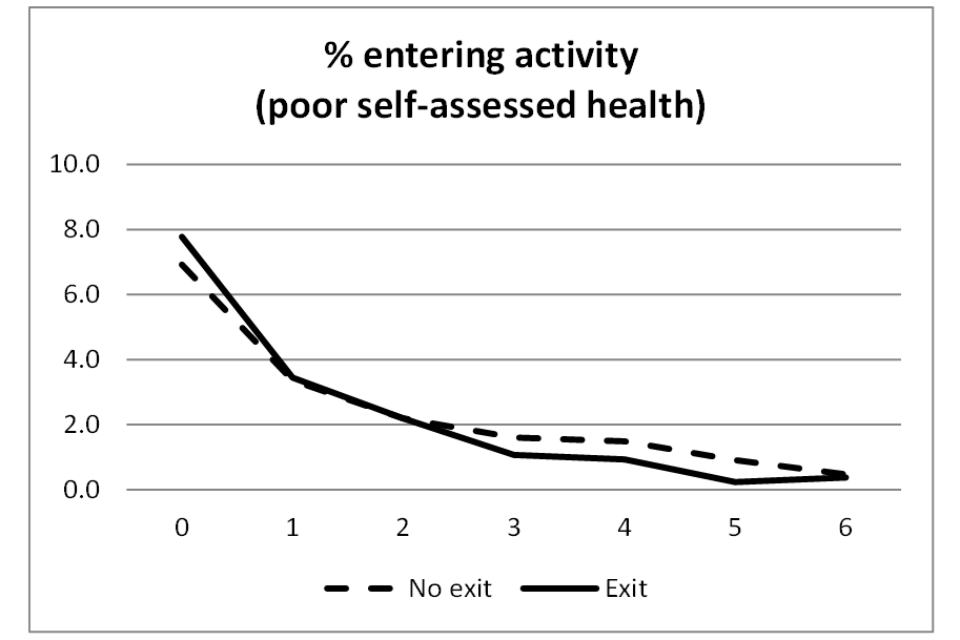
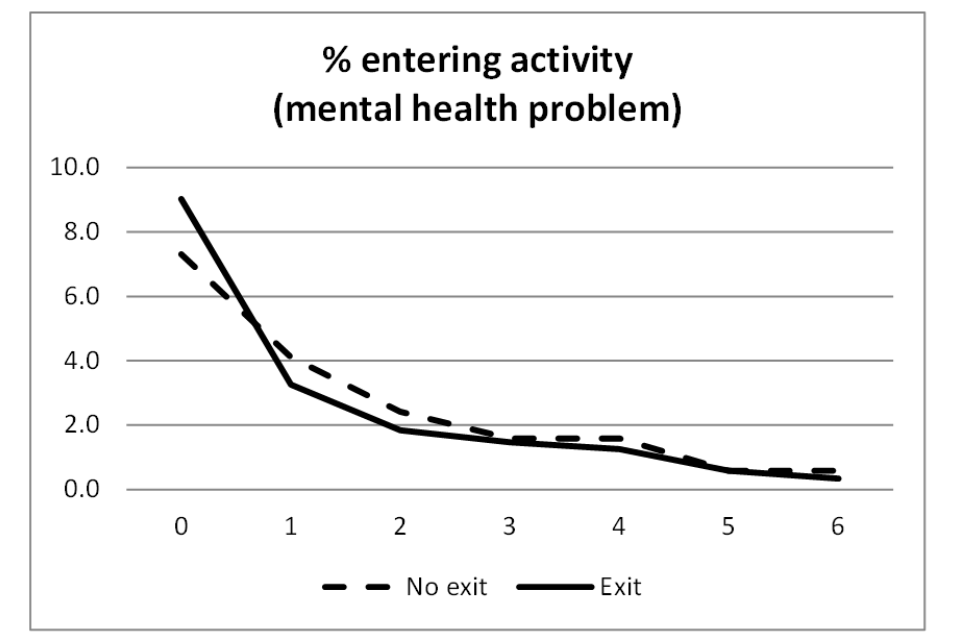
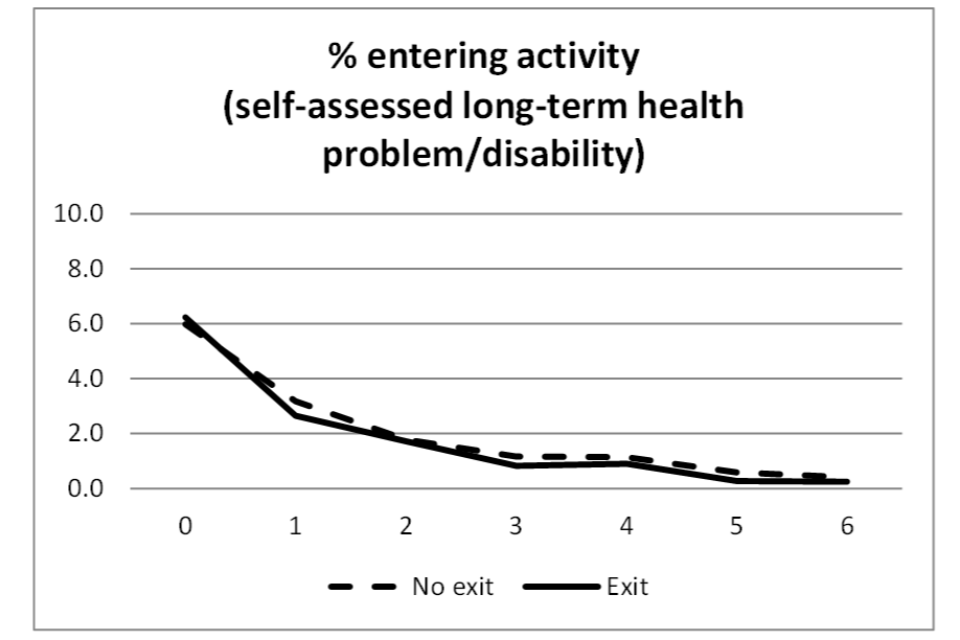
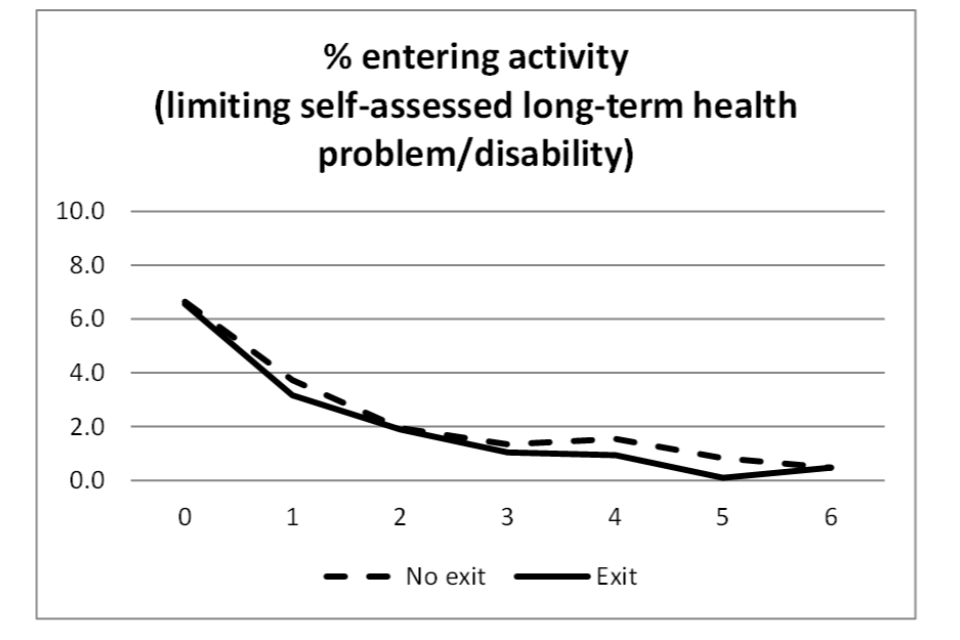
The ‘impacts’ shown in Figures 1.1 through to 1.4 are only indicative of the effect of health transitions on work transitions. This is because the impacts in question are based on unconditional differences in proportions (baseline compositional differences between those who experienced the health transitions and those who did not are not controlled for). Furthermore, individuals who underwent health transitions between USoc Wave 1 and Wave 2 may not be representative of the entire population who experience health transitions.
In order to explore the generalisability of findings to all individuals who underwent health transitions, indicative impacts on employment exits and entries were investigated for other cohorts (groups of individuals who experienced health transitions between Wave 2 and Wave 3, between Wave 4 and Wave 5, etc.). The results for employment exit following negative health transitions (see Figure A1.5) suggest that the size of the impact varies considerably depending on the cohort and health construct concerned. At some points in time, some cohorts show an impact difference of up to 2ppts (for example, onset of a (limiting) long-term illness or disability between Wave 2 and Wave 3 and between Wave 3 and Wave 4). Considering the small effect sizes generally observed, differences in impact of this magnitude are to be considered large. This suggests that more generalisable inference on the impact of health transitions on work transitions should be produced by including multiple cohorts, as in so doing it would be possible to account for possible time effects (the effects of experiencing a health transition at different points in time).
While showing some degree of variability across the 6 cohorts considered, the impact of positive health transitions on employment entry (Figure A1.6) varies to a lesser extent compared to negative health transitions. The effect size variability is lowest for exits from a mental health problem and from a self-assessed long-term illness or disability, as demonstrated by the fact that the trajectories observed for the different cohorts tend to overlap.
Figure A1.5 Employment exit following onset of poor health in different periods (for different cohorts)
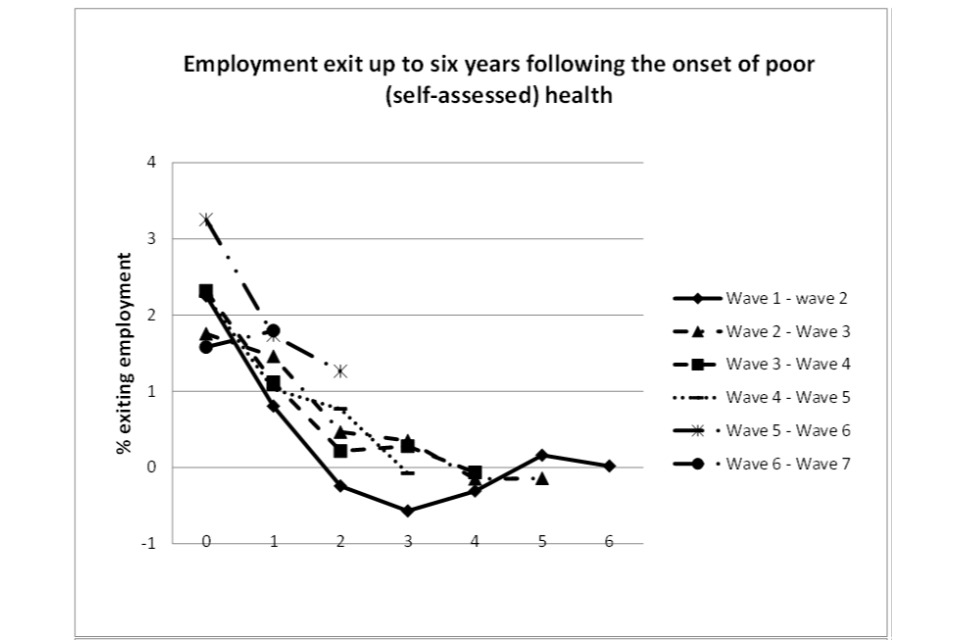
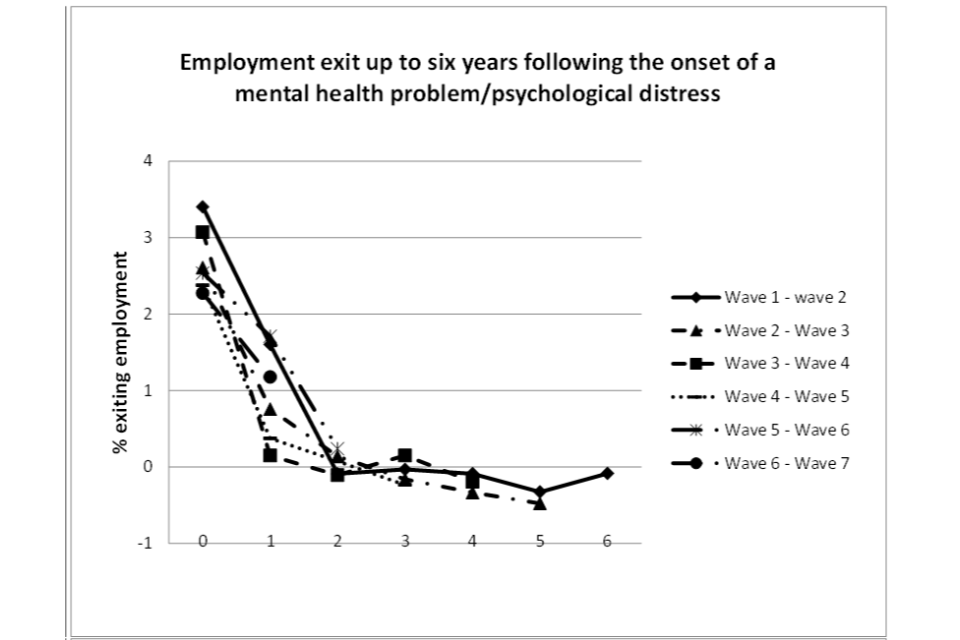
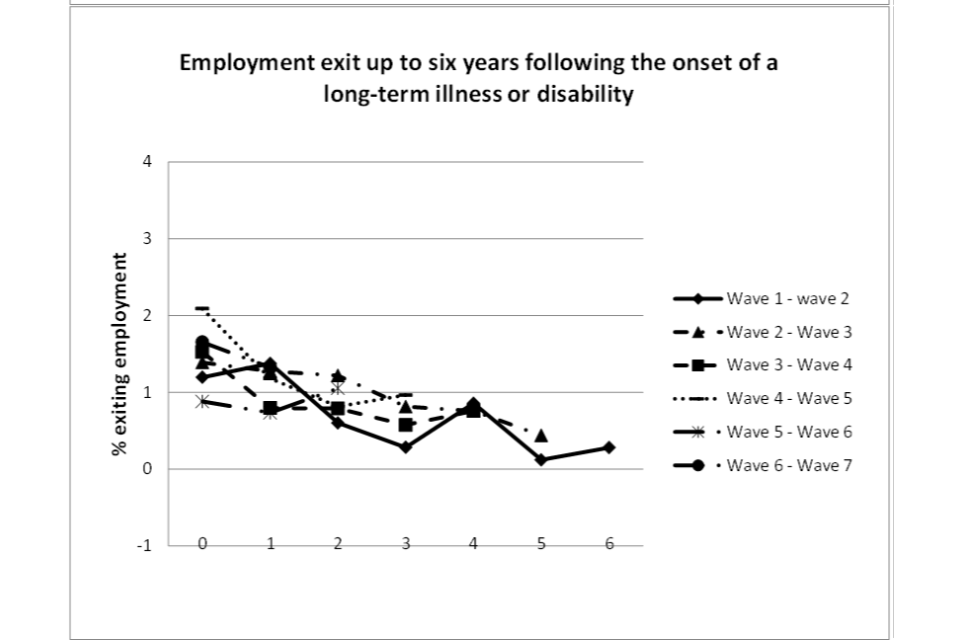
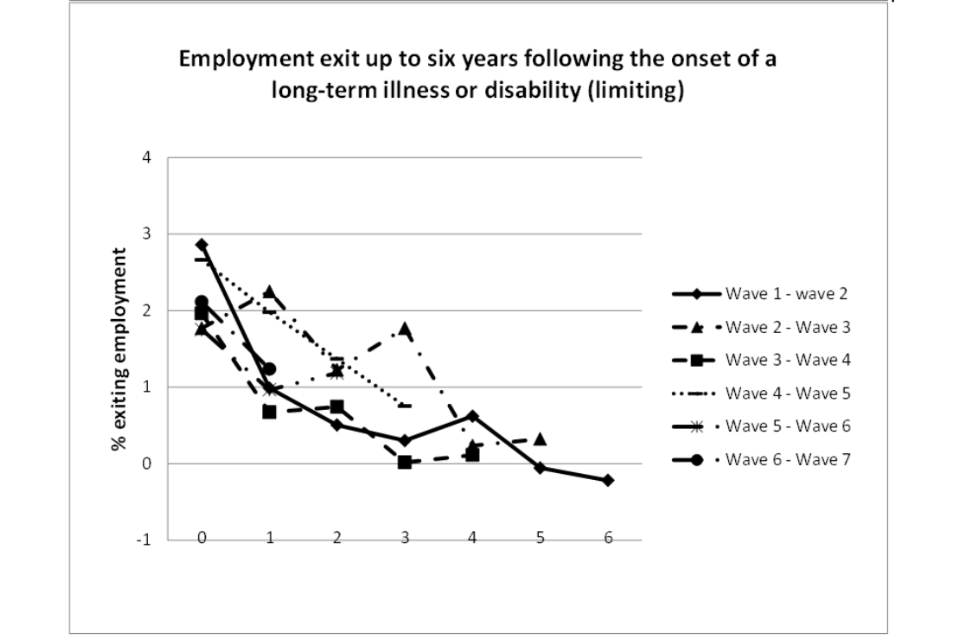
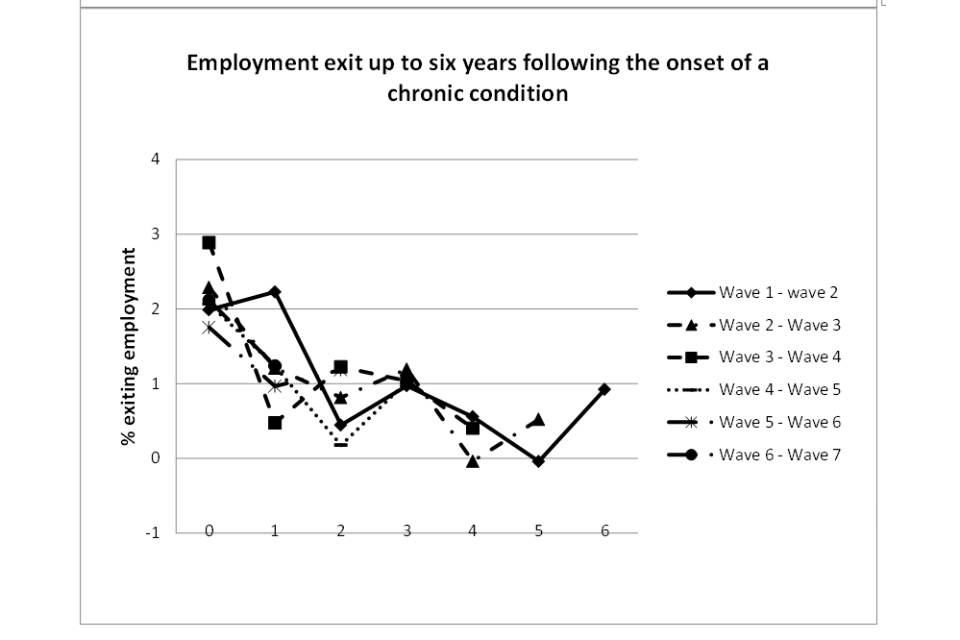
Figure A1.6 Employment entry following the exit from poor health in different periods (for different cohorts)
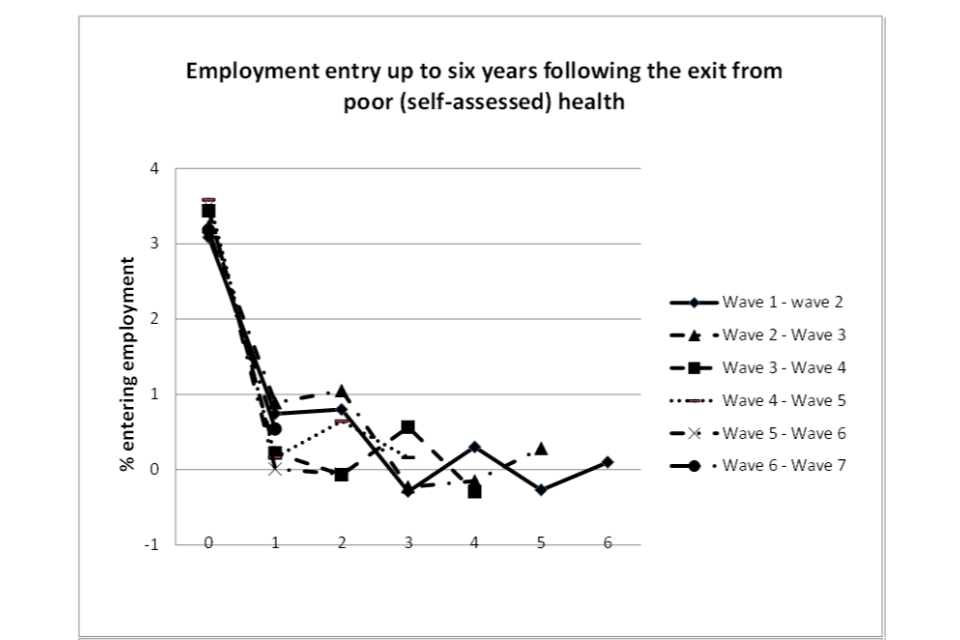
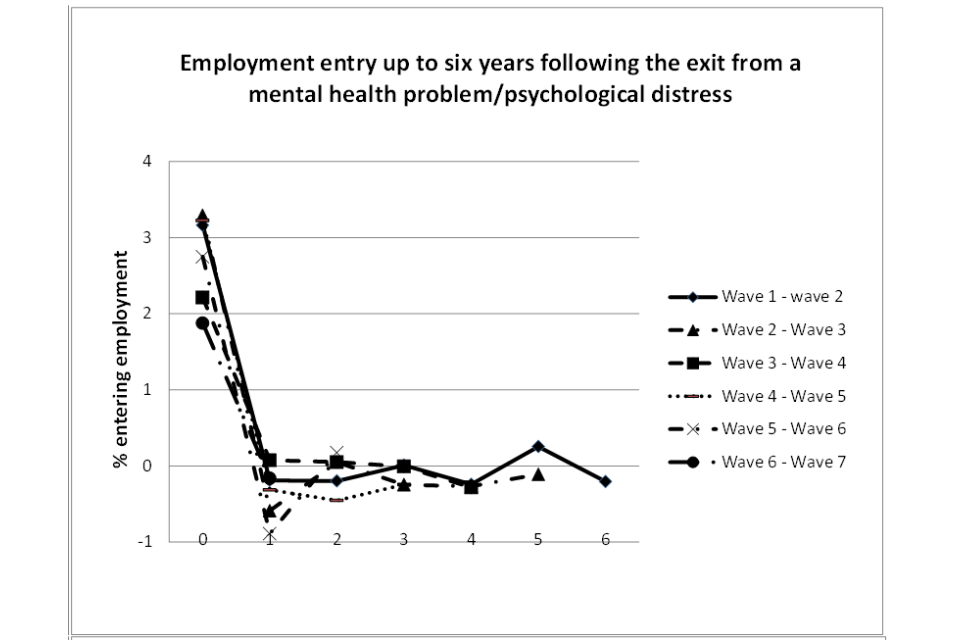
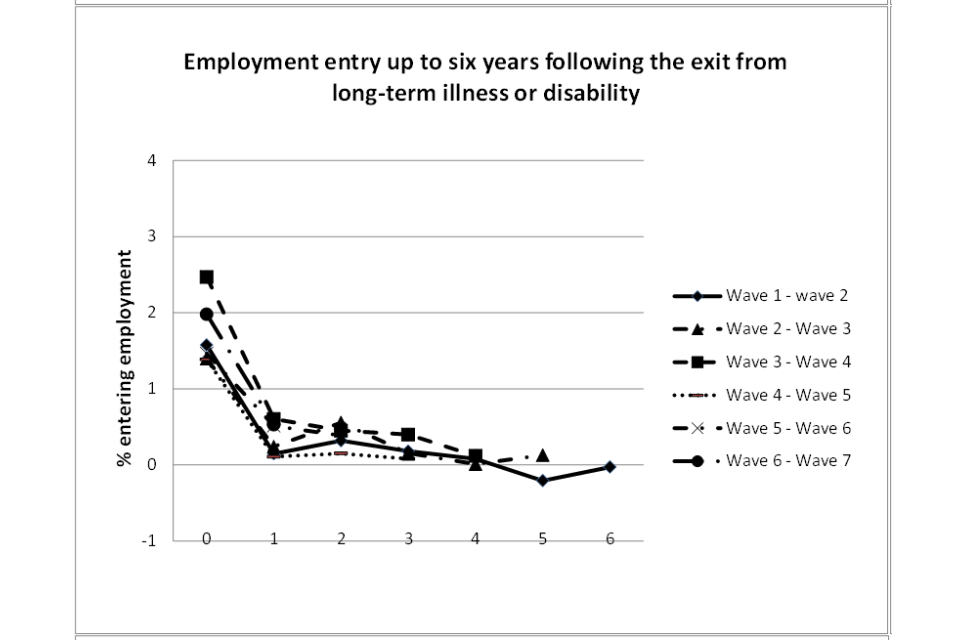
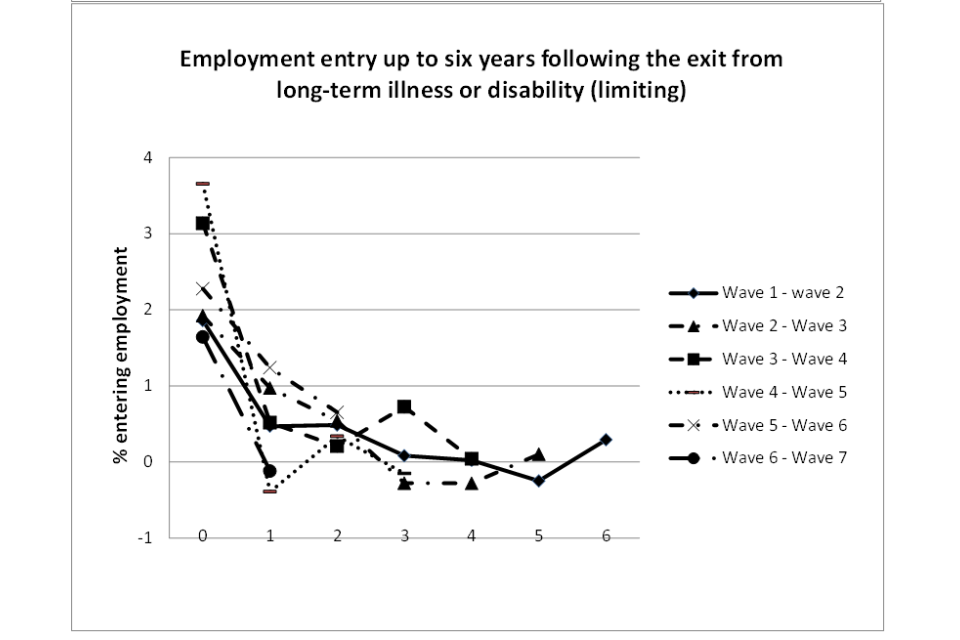
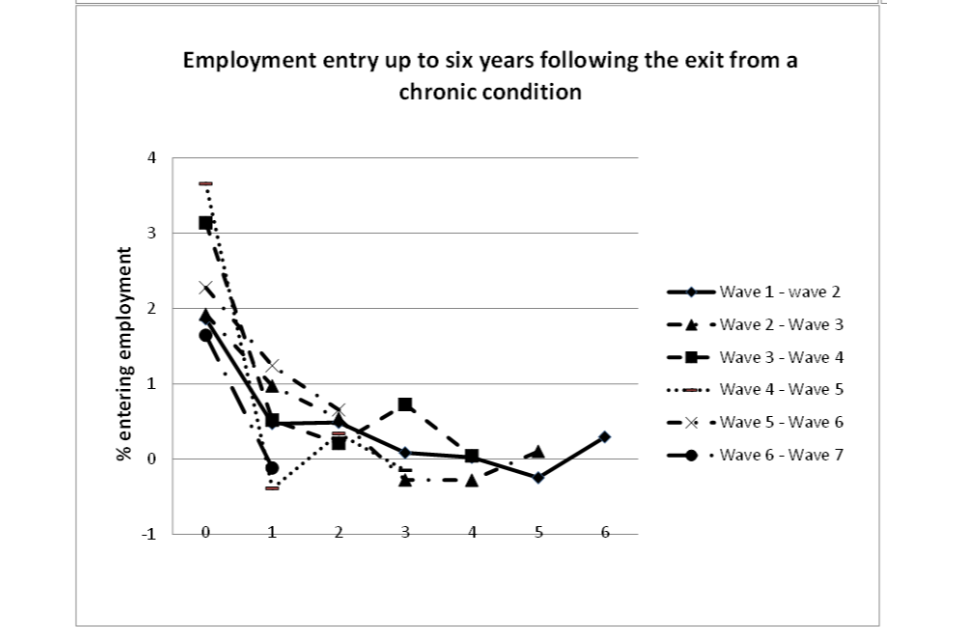
7.2. Appendix 2 - Sense-checking against the UK Labour Force Survey
The UK Longitudinal Labour Force Survey (LFS) offers quarterly data on health and work transitions for a period of 5 consecutive quarters. For the 3 health conditions which are consistently included in both USoc and the LFS (diabetes, depression and epilepsy), the latter allows a validation of whether the volume of transitions are over/under-estimated in the USoc analysis.
Table A2.1 shows health transitions in the LFS for the 3 chronic conditions for which the definitions appear to be comparable with the ones identified in USoc: diabetes, depression and epilepsy. The top panel shows the count for onset, no onset (continuous good health), no offset (continuous poor health), and missing, found in the LFS, where the LFS quarters have been matched to each USoc wave. Wave ‘3’ for the LFS, for example, therefore covers the USoc interview dates of 7th January 2011 to 12th July 2013. The lower panel shows the corresponding proportions.
Table A2.1 LFS health transitions (Waves 3 to 7 correspond to the USoc survey dates)
Diabetes:
| Wave | Onset | Percentage onset | No onset | Percentage no onset | No offset | Percentage no offset | Missing | Percentage missing |
|---|---|---|---|---|---|---|---|---|
| 3 | 204 | 0.1 | 164,867 | 65.5 | 2,815 | 1.1 | 83,685 | 33.3 |
| 4 | 240 | 0.1 | 162,604 | 65.0 | 2,683 | 1.1 | 84,774 | 33.9 |
| 5 | 270 | 0.1 | 157,502 | 64.4 | 2,571 | 1.1 | 84,287 | 34.5 |
| 6 | 341 | 0.2 | 148,157 | 64.6 | 2,376 | 1.0 | 78,353 | 34.2 |
| 7 | 304 | 0.2 | 130,261 | 64.0 | 2,216 | 1.1 | 70,837 | 34.8 |
Depression:
| Wave | Onset | Percentage onset | No onset | Percentage no onset | No offset | Percentage no offset | Missing | Percentage missing |
|---|---|---|---|---|---|---|---|---|
| 3 | 584 | 0.2 | 165,000 | 65.6 | 2,088 | 0.8 | 83,899 | 33.4 |
| 4 | 756 | 0.3 | 161,781 | 64.6 | 2,686 | 1.1 | 85,078 | 34.0 |
| 5 | 785 | 0.3 | 155,998 | 63.8 | 3,210 | 1.3 | 84,637 | 34.6 |
| 6 | 810 | 0.4 | 146,487 | 63.9 | 3,297 | 1.4 | 78,633 | 34.3 |
| 7 | 761 | 0.4 | 128,493 | 63.1 | 3,231 | 1.6 | 71,133 | 34.9 |
Epilepsy:
| Wave | Onset | Percentage onset | No onset | Percentage no onset | No offset | Percentage no offset | Missing | Percentage missing |
|---|---|---|---|---|---|---|---|---|
| 3 | 37 | 0.0 | 167,423 | 65.6 | 639 | 0.3 | 83,472 | 33.2 |
| 4 | 50 | 0.0 | 165,115 | 66.0 | 622 | 0.3 | 84,514 | 33.8 |
| 5 | 47 | 0.0 | 160,018 | 65.4 | 559 | 0.2 | 84,006 | 34.3 |
| 6 | 57 | 0.0 | 150,616 | 65.7 | 508 | 0.2 | 78,046 | 34.1 |
| 7 | 55 | 0.0 | 132,572 | 65.1 | 428 | 0.2 | 70,563 | 34.7 |
Totals:
| Wave | Total | Percentage |
|---|---|---|
| 3 | 251,571 | 100.0 |
| 4 | 250,301 | 100.0 |
| 5 | 244,630 | 100.0 |
| 6 | 229,227 | 100.0 |
| 7 | 203,618 | 100.0 |
Table A2.2 shows the count and proportions of health transitions observed in USoc. A comparison between Table A2.1 and Table A2.2 shows that the proportions in each cell are broadly similar between the 2 data sources. The proportion of people reporting an onset appears to be, if anything, slightly higher in USoc than in the LFS. Therefore, at least as far as these 3 health problems are concerned it does not appear that USoc underreports the extent of health transitions relative to the LFS, which is a larger survey, and arguably more nationally representative than USoc.
Table A2.2 USoc health transitions, Waves 3 to 7
Diabetes:
| Wave | Onset | Percentage onset | No onset | Percentage no onset | No offset | Percentage no offset | Missing | Percentage missing |
|---|---|---|---|---|---|---|---|---|
| 3 | 178 | 0.4 | 33,338 | 67.0 | 1,056 | 2.1 | 15,165 | 30.5 |
| 4 | 137 | 0.3 | 31,402 | 66.6 | 1,137 | 2.4 | 14,473 | 30.7 |
| 5 | 141 | 0.3 | 30,223 | 67.3 | 1,138 | 2.5 | 13,397 | 29.8 |
| 6 | 138 | 0.3 | 26,686 | 59.0 | 1,085 | 2.4 | 17,340 | 38.3 |
| 7 | 145 | 0.3 | 27,229 | 64.7 | 1,195 | 2.8 | 13,573 | 32.2 |
Depression:
| Wave | Onset | Percentage onset | No onset | Percentage no onset | No offset | Percentage no offset | Missing | Percentage missing |
|---|---|---|---|---|---|---|---|---|
| 3 | 374 | 0.8 | 32,595 | 65.5 | 1,603 | 3.2 | 15,165 | 30.5 |
| 4 | 282 | 0.6 | 30,581 | 64.9 | 1,813 | 3.9 | 14,473 | 30.7 |
| 5 | 229 | 0.5 | 29,324 | 65.3 | 1,949 | 4.3 | 13,397 | 29.8 |
| 6 | 176 | 0.4 | 25,871 | 57.2 | 1,862 | 4.1 | 17,340 | 38.3 |
| 7 | 173 | 0.4 | 26,557 | 62.9 | 1,909 | 4.5 | 13,573 | 32.2 |
Epilepsy:
| Wave | Onset | Percentage onset | No onset | Percentage no onset | No offset | Percentage no offset | Missing | Percentage missing |
|---|---|---|---|---|---|---|---|---|
| 3 | 33 | 0.1 | 34,322 | 69.0 | 217 | 0.4 | 15,165 | 30.5 |
| 4 | 17 | 0.0 | 32,431 | 68.8 | 228 | 0.5 | 144,773 | 30.7 |
| 5 | 15 | 0.0 | 31,257 | 69.6 | 230 | 0.5 | 13,397 | 29.8 |
| 6 | 16 | 0.0 | 27,661 | 61.1 | 232 | 0.5 | 17,340 | 38.3 |
| 7 | 9 | 0.0 | 28,391 | 67.3 | 239 | 0.6 | 13,573 | 32.2 |
Totals:
| Wave | Total | Percentage |
|---|---|---|
| 3 | 49,737 | 100.00 |
| 4 | 47,149 | 100.00 |
| 5 | 44,899 | 100.00 |
| 6 | 45,249 | 100.00 |
| 7 | 42,212 | 100.00 |
7.3. Appendix 3 - Choice between the logistic and linear regression models
A primary decision in the assessment of the impact of health transitions on work transitions was the choice between the linear regression model, commonly known as Ordinary Least Squares (OLS), and the logistic regression model approach (Hellevik, 2007; Long, 1997).
Theoretical considerations suggest that the latter is to be preferred to the former (see What’s So Special About Logit?). Notably, the logistic probability regression model can address 2 main shortcomings of the linear probability regression approach: 1 - the possibility that probability predictions are outside the 0-1 range, and; 2 - the heteroscedasticity of the regression residuals (non-constant variance).
However, corrections for heteroscedasticity (the ‘robust standard errors’ option in statistical packages) can easily be implemented within OLS models.
It has also been noted that when the purpose of the regression model is not predicting probabilities but assessing the statistical association between a given covariate and the binary dependent variable, linear probability models are preferable as the results are easier to interpret. OLS regression coefficients represent percentage point changes while logistic model coefficients are normally expressed in terms of odds ratios, which some argue do not lend themselves to easy interpretation.[footnote 48]
Another important consideration in favour of the linear regression model is that the logistic model is much slower to run because it is fit by an iterative process of maximum likelihood.
A final consideration concerns the extent to which the model used fits the data. As a rule of thumb, if the probability of the event studied is expected to be smaller than 0.2 or greater than 0.8, then using a logistic model is most appropriate (an explanation is provided at Linear vs. Logistic Probability Models: Which is Better, and When?). The observed (unconditional) probabilities associated with work transitions are well below 20% (see Tables 2.5 and 2.6 in the report), and this is the main reason that the logistic model is preferred to the OLS model in this study to estimate the impact of health transitions on work transitions.
7.4. Appendix 4 - Survival analysis: construction of durations
In theory, to be able to calculate survival times, both the start and end of the duration being assessed should be known (the exact time point in time that individuals start and end experiencing good or poor health).
However, survival analysis methods can accommodate the fact that, for some individuals, the end of the spell is unknown. This situation, known as ‘right-censoring’, typically arises when individuals leave the sample before the end of the observation period due to being lost to follow-up or withdrawing from the study.[footnote 49] The general assumption is that right-censoring is non-informative, that is, the time people are observed as leaving the study before their spell is completed is statistically independent of (and therefore cannot be explained by) their failure time.
The time to develop a chronic condition can easily be computed as the healthy spell starts at birth and individuals remain in good health continuously until they report having been diagnosed with a chronic condition by a doctor at any of the 8 USoc waves. However, when the onset of, or exit from, poor health is based on a construct other than chronic conditions, assessing spell lengths using USoc data presents a complication. For example, the fact that someone reported good (self-assessed) health in the first 4 USoc waves and poor (self-assessed) health in the fifth wave does not necessarily mean that they have been healthy for only 4 waves. The real duration will depend on the number of years in which these individuals have enjoyed good health prior to Wave 1 interview. Unfortunately, we can only rely on the information reported at Wave 1 or later waves, and this means that the start of ongoing spells at Wave 1 remain unknown, and the spell length potentially underestimated.
To avoid this problem, when the indicator of health is based on a construct other than chronic conditions, a negative or positive health shock (onset of poor health or exit from poor health) will be used to mark the start of the duration studied. For example, the duration ‘time in good health’ will be measured as the time between the exit from poor health (initial positive health shock) and the onset of poor health (negative health shock), and will be identified by the sequence poor-good-poor health. Throughout this report we will also refer to this duration as ‘time to relapse into poor health’. Similarly, the sequence good-poor-good health (initial negative health shock followed by a positive health transition) will denote the duration ‘time in poor health’.
The duration ‘time to relapse after a positive health shock’ is defined by the number of consecutive USoc waves in which individuals reported being in good health, where the first of these waves is preceded by a wave in which they reported poor health and the last is followed by a wave in which they are either observed as being in poor health or not being observed at all due to exiting the survey or being lost to follow-up (right censoring). We can illustrate this with some examples. Denoting good health with 1 and poor health with 0 at any wave, the sequence 01110 across the first 5 USoc waves indicates a 3-year ‘good health’ spell before relapsing into poor health. Instead, the sequence 0010 observed over the first 4 USoc waves indicates a one-year healthy spell. If we denote missing health information with M, the sequences 0111M and 001M indicate 3- and one-year ‘good health’ (right-censored) spells, respectively.
The duration ‘time to recover after a negative health shock’ is defined in a similar way. The only difference is that the spell length is defined by the number of consecutive USoc waves in which individuals reported poor health (number of 0s rather than 1s). For example, the sequences 10001 (or 1000M) and 1101 (or 110M) indicate that individuals remained in poor health for 3 and one years, respectively, before recovering from it.
As is clear from the examples above, a spell or duration is defined by 2 elements:
i. a survival start date; and
ii. either a survival end date (corresponding to the time that the individual experiences the failure) or a right-censored observation (the person no longer features in the dataset, or they do but no information is available to distinguish between failing or surviving at/beyond that time point)
It is important to note that people can start and/or end their spells at different points in time (at different USoc waves) and what actually matters is the length of their spell.
Measuring the duration ‘time to develop a chronic condition’ is more straightforward as this duration coincides with the respondent’s age at the end of the spell, when they either experience onset of a chronic condition or are right-censored. However, in this case we need to account for the bias generated by delayed entry - a phenomenon also known as ‘left-truncation’. Delayed entry occurs when individuals are observed after they become at risk of failing (that is, after their duration has started). Failing to control for delayed entry generally results in biased durations.
Finally, it is worth noting that multiple durations per individual can be observed in USoc. For example, if we denote good health with 1 and poor health with 0, a sequence 01110 followed by a sequence 010 would indicate a 3-year healthy spell followed by a one-year healthy spell. While survival analysis methods can accommodate multiple spells, we limit the current analysis to the first duration for each person.
7.5. Appendix 5 - Survival analysis methods
Kaplan-Meier method to estimate survival functions
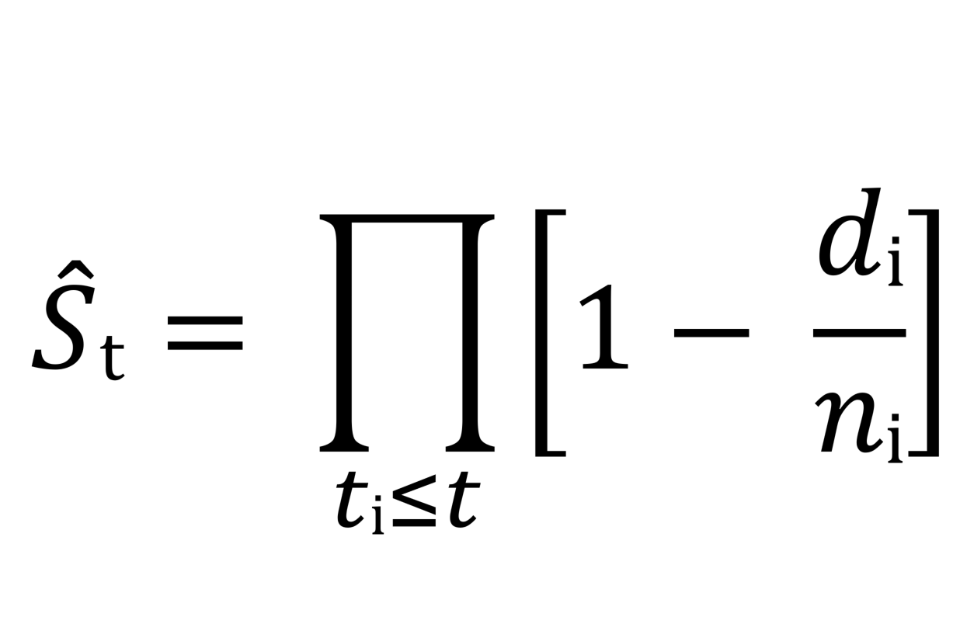
A survival (or survivor) function indicates the probability of surviving beyond any given time ti (for example, the probability of remaining healthy for more than 1, 2 or 3 years after being successfully treated for a physical condition). Kaplan and Meier (1958) suggested estimating survival probabilities using the product-limit estimator:
where S(t) is the probability of surviving past the time point ti (or beyond the i-th time interval), ni is the number of individuals at risk just prior to ti (at the beginning of the i-th time interval), and di is the number of subjects who fail at time point i (at the end of the i-th interval). If we think of the duration ti as composed of subsequent time intervals, then S(ti) is the probability that someone survives the i-th time interval on the condition that they were present at the start of the same interval (and therefore survived all previous intervals). For this reason S(ti) results from the product of conditional probabilities.[footnote 50]
Let us illustrate how the probability of survival is calculated with an example based on the duration ‘time in poor health’ using the mental health construct. Table A5.1 shows the number of individuals who are at risk of recovering from poor mental health at the beginning of each interval (At risk), the number who recover by the end of the same interval (Fail) and the number who become right-censored. The probability of remaining in poor health (surviving) past the first year is 0.534. This probability is obtained as 1 minus the ratio of the number who failed by the end of year 1 (7,074 people) to the number at risk at the start of the same year (15,172 people). The probability of surviving past the second year is 0.336, and is obtained by multiplying 0.630 (which is 1 minus the ratio of the number who failed by the end of year 2 (1,517 people) to the number at risk at the beginning of the same year (4,102 people)) by the probability of surviving in the first year (0.534). The probabilities of surviving 3, 4, etc. years are obtained in the same way, conditioning on the probabilities of surviving all previous intervals.
It is important to consider that long durations may dominate means. Therefore, using medians is preferable when exploring central trends in the context of time-to-event analysis.
Table A5.1 Probability of remaining in poor mental health
| Time | At risk | Fail | Right-censored | Survivor function | Std. error | 95% conf. interval | |
|---|---|---|---|---|---|---|---|
| 1 | 15172 | 7074 | 3996 | 0.5337 | 0.0041 | 0.5258 | 0.5416 |
| 2 | 4102 | 1517 | 1064 | 0.3364 | 0.0048 | 0.327 | 0.3457 |
| 3 | 1521 | 449 | 386 | 0.2371 | 0.0052 | 0.227 | 0.2473 |
| 4 | 686 | 153 | 221 | 0.1842 | 0.0055 | 0.1735 | 0.1951 |
| 5 | 312 | 61 | 116 | 0.1482 | 0.0061 | 0.1365 | 0.1603 |
| 6 | 135 | 13 | 85 | 0.1339 | 0.0066 | 0.1212 | 0.1472 |
| 7 | 37 | 0 | 37 | 0.1339 | 0.0066 | 0.1212 | 0.1472 |
Source: Authors’ calculations based on data from Understanding Society
Complementary log-log regression model
A complementary log-log hazard rate is a function of survival time (t) and a set of time-invariant and/or time-varying covariates (Xit)[footnote 51]:
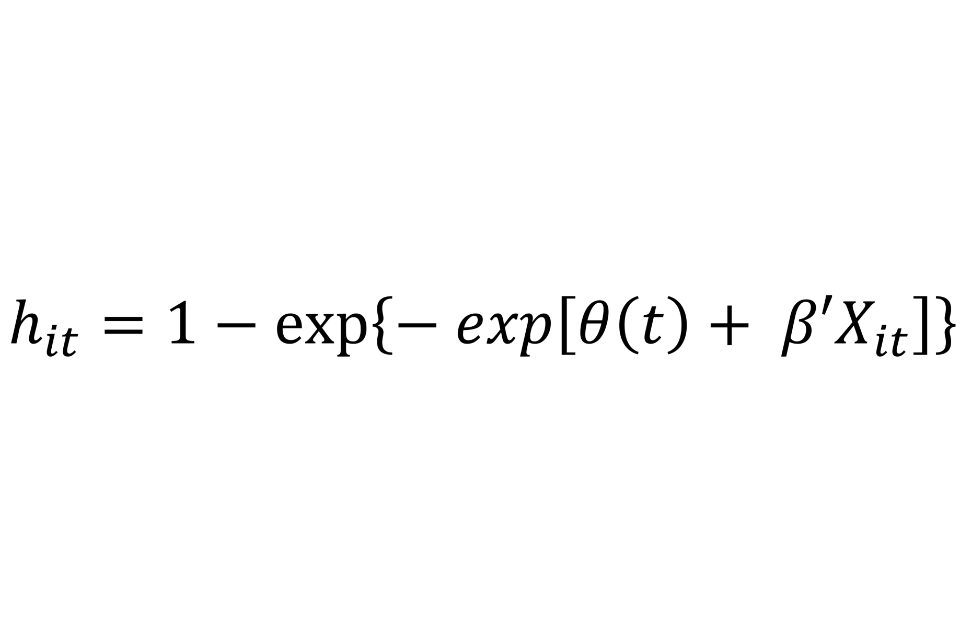
It is a proportional hazard model, implying that a unit increase in a given covariate produces a multiplicative effect on the hazard rate (for example, getting medical treatment halves the hazard rate for a heart attack occurring). The regression output shown in this report uses a parametric specification of the discrete-time duration (the logarithm of the elapsed survival time is used as a covariate in the regression model).
7.6. Appendix 6 – Additional tables and figures
Table A6.1 Impact of onset of poor health on contemporaneous work transitions, by qualifications (degree versus no degree)
| Onset of poor general health | Employment exit | Activity exit | Satisfied to dissatisfied with job | High to low paid job | Permanent to temporary job | Full to part-time job |
|---|---|---|---|---|---|---|
| Degree | 1.7 | 1.3 | 4.2 *** | 1.0 | -0.3 | -0.2 |
| No degree | 4.7 *** | 3.7 *** | 1.0 | 0.9 | -0.2 | 0.1 |
| Difference | -3.0 *** | -2.3 ** | 3.1 ** | 0.1 | 0.0 | -0.3 |
| Onset of poor mental health | Employment exit | Activity exit | Satisfied to dissatisfied with job | High to low paid job | Permanent to temporary job | Full to part-time job |
|---|---|---|---|---|---|---|
| Degree | 2.5 *** | 2.1 *** | 14.4 *** | -0.4 | 0.4 | 0.2 |
| No degree | 6.0 *** | 5.0 *** | 9.3 *** | -0.4 | 0.4 | 1.0 *** |
| Difference | -3.5 *** | -2.9 *** | 5.0 *** | 0.0 | 0.0 | -0.9 |
| Onset of a long-term disability/illness | Employment exit | Activity exit | Satisfied to dissatisfied with job | High to low paid job | Permanent to temporary job | Full to part-time job |
|---|---|---|---|---|---|---|
| Degree | 2.5 *** | 2.2 *** | 0.7 | 0.6 | -0.4 | 0.5 |
| No degree | 1.8 *** | 1.3 *** | 1.3 | 1.1 ** | 0.2 | 1.1 *** |
| Difference | 0.6 | 0.8 | -0.5 | -0.6 | -0.6 | -0.6 |
| Onset of a long-term disability/illness (limiting) | Employment exit | Activity exit | Satisfied to dissatisfied with job | High to low paid job | Permanent to temporary job | Full to part-time job |
|---|---|---|---|---|---|---|
| Degree | 4.2 *** | 3.4 *** | 2.1 | -0.5 | -0.5 | 0.5 |
| No degree | 3.7 *** | 2.9 *** | 2.1 *** | 1.3 ** | 0.1 | 1.1 ** |
| Difference | 0.5 | 0.6 | -0.1 | -1.8 ** | -0.6 | -0.6 |
| Onset of one or more chronic condition | Employment exit | Activity exit | Satisfied to dissatisfied with job | High to low paid job | Permanent to temporary job | Full to part-time job |
|---|---|---|---|---|---|---|
| Degree | 2.4 ** | 1.6 | 0.4 | 0.1 | -0.2 | 0.7 |
| No degree | 3.9 *** | 2.6 *** | 1.9 *** | 0.4 | 0.0 | 0.6 |
| Difference | -1.5 | -1.0 | -1.4 | -0.2 | -0.2 | 0.2 |
*** and ** denote statistical significance at the 1 and 5% level, respectively.
Table A6.2 Impact of onset of poor health on contemporaneous work transitions, by workplace size (large versus small to medium)
| Onset of poor general health | Employment exit | Activity exit | Satisfied to dissatisfied with job | High to low paid job | Permanent to temporary job | Full to part-time job |
|---|---|---|---|---|---|---|
| 200+ employees | 2.5 *** | 2.0 *** | 4.1 *** | 0.9 | -0.4 | 0.3 |
| Less than 200 employees | 4.5 *** | 3.4 *** | 0.8 | 0.8 | -0.1 | -0.1 |
| Difference | -2.0 ** | -1.4 | 3.3 *** | 0.1 | -0.2 | 0.4 |
| Onset of poor mental health | Employment exit | Activity exit | Satisfied to dissatisfied with job | High to low paid job | Permanent to temporary job | Full to part-time job |
|---|---|---|---|---|---|---|
| 200+ employees | 2.5 *** | 2.2 *** | 12.2 *** | 0.3 | 0.2 | 0.9 ** |
| Less than 200 employees | 5.8 *** | 4.8 *** | 10.4 *** | -0.7 | 0.4 | 0.7 |
| Difference | -3.3 *** | -2.5 *** | 1.8 | 1.1 | -0.2 | 0.3 |
| Onset of a long-term disability/illness | Employment exit | Activity exit | Satisfied to dissatisfied with job | High to low paid job | Permanent to temporary job | Full to part-time job |
|---|---|---|---|---|---|---|
| 200+ employees | 1.7 *** | 1.4 *** | 1.7 | 0.9 | -0.2 | 1.2 ** |
| Less than 200 employees | 2.1 *** | 1.5 *** | 0.9 | 1.0 | 0.1 | 0.8 ** |
| Difference | -0.3 | -0.1 | 0.8 | 0.0 | -0.3 | 0.4 |
| Onset of a long-term disability/illness (limiting) | Employment exit | Activity exit | Satisfied to dissatisfied with job | High to low paid job | Permanent to temporary job | Full to part-time job |
|---|---|---|---|---|---|---|
| 200+ employees | 3.1 *** | 2.5 *** | 3.7 *** | -0.2 | -0.8 ** | 1.3 ** |
| Less than 200 employees | 3.9 *** | 3.1 *** | 1.4 | 1.3 ** | 0.2 | 0.8 |
| Difference | -0.9 | -0.6 | 2.3 | -1.5 | -1.0 ** | 0.5 |
| Onset of one or more chronic condition | Employment exit | Activity exit | Satisfied to dissatisfied with job | High to low paid job | Permanent to temporary job | Full to part-time job |
|---|---|---|---|---|---|---|
| 200+ employees | 1.4 | 1.1 | 0.8 | 0.8 | -0.3 | 0.6 |
| Less than 200 employees | 4.3 *** | 2.8 *** | 1.8 | 0.0 | 0.1 | 0.6 |
| Difference | -2.9 *** | -1.7 | -1.0 | 0.8 | -0.4 | 0.0 |
*** and ** denote statistical significance at the 1 and 5% level, respectively.
Table A6.3 Impact of onset of poor health on contemporaneous work transitions, by occupation (unskilled versus skilled)
| Onset of poor general health | Employment exit | Activity exit | Satisfied to dissatisfied with job | High to low paid job | Permanent to temporary job | Full to part-time job |
|---|---|---|---|---|---|---|
| Skilled | 3.7 *** | 3.1 *** | 2.2 *** | 0.9 | -0.2 | -0.2 |
| Unskilled | 5.2 *** | 3.2 *** | 0.7 | 1.4 | -0.3 | 0.5 |
| Difference | -1.4 | -0.1 | 1.4 | -0.5 | 0.1 | -0.7 |
| Onset of poor mental health | Employment exit | Activity exit | Satisfied to dissatisfied with job | High to low paid job | Permanent to temporary job | Full to part-time job |
|---|---|---|---|---|---|---|
| Skilled | 4.3 *** | 3.6 *** | 11.6 *** | -0.3 | 0.4 | 0.6 |
| Unskilled | 7.5 *** | 5.9 *** | 7.6 *** | -1.2 | 0.3 | 1.5 ** |
| Difference | -3.2 *** | -2.3 ** | 4.0 *** | 1.0 | 0.1 | -0.9 |
| Onset of a long-term disability/illness | Employment exit | Activity exit | Satisfied to dissatisfied with job | High to low paid job | Permanent to temporary job | Full to part-time job |
|---|---|---|---|---|---|---|
| Skilled | 2.0 *** | 1.6 *** | 1.1 | 0.8 | -0.1 | 0.5 |
| Unskilled | 3.2 *** | 2.3 ** | 1.5 | 2.2 ** | 0.6 | 2.5 *** |
| Difference | -1.2 | -0.7 | -0.4 | -1.5 | -0.7 | -2.0 ** |
| Onset of a long-term disability/illness (limiting) | Employment exit | Activity exit | Satisfied to dissatisfied with job | High to low paid job | Permanent to temporary job | Full to part-time job |
|---|---|---|---|---|---|---|
| Skilled | 3.5 *** | 2.8 *** | 2.1 *** | 0.7 | -0.2 | 0.9 ** |
| Unskilled | 5.8 *** | 4.4 *** | 1.9 | 2.1 | 0.6 | 1.1 |
| Difference | -2.3 | -1.6 | 0.2 | -1.4 | -0.9 | -0.2 |
| Onset of one or more chronic condition | Employment exit | Activity exit | Satisfied to dissatisfied with job | High to low paid job | Permanent to temporary job | Full to part-time job |
|---|---|---|---|---|---|---|
| Skilled | 3.7 *** | 2.6 *** | 1.5 | 0.1 | -0.3 | 0.3 |
| Unskilled | 3.0 ** | 1.8 | 1.5 | 1.2 | 0.8 | 1.8 |
| Difference | 0.7 | 0.8 | 0.0 | -1.1 | -1.1 | -1.6 |
*** and ** denote statistical significance at the 1 and 5% level, respectively.
Table A6.4 Impact of onset of poor health on contemporaneous work transitions, by home ownership (homeowner versus non-owner)
| Onset of poor general health | Employment exit | Activity exit | Satisfied to dissatisfied with job | High to low paid job | Permanent to temporary job | Full to part-time job |
|---|---|---|---|---|---|---|
| Owns home outright | 4.1 *** | 3.0 ** | 1.9 | 1.6 | -1.1 ** | 1.1 |
| No homeowner | 3.9 *** | 3.1 *** | 1.8 ** | 0.7 | 0.0 | -0.2 |
| Difference | 0.1 | 0.0 | 0.1 | 0.9 | -0.3 | 1.3 |
| Onset of poor mental health | Employment exit | Activity exit | Satisfied to dissatisfied with job | High to low paid job | Permanent to temporary job | Full to part-time job |
|---|---|---|---|---|---|---|
| Owns home outright | 5.8 *** | 4.6 *** | 9.4 *** | -0.3 | 0.1 | 1.0 |
| No homeowner | 4.6 *** | 3.9 *** | 11.3 *** | -0.4 | 0.4 | 0.7 ** |
| Difference | 1.2 | 0.7 | -1.9 | 0.1 | -0.3 | 0.3 |
| Onset of a long-term disability/illness | Employment exit | Activity exit | Satisfied to dissatisfied with job | High to low paid job | Permanent to temporary job | Full to part-time job |
|---|---|---|---|---|---|---|
| Owns home outright | 0.7 | 0.4 | 0.4 | 2.1 ** | -0.1 | 2.0 *** |
| No homeowner | 2.4 *** | 1.9 *** | 1.3 ** | 0.7 | 0.0 | 0.7 |
| Difference | -1.7 | -1.6 | -0.9 | 1.5 | -0.1 | 1.3 |
| Onset of a long-term disability/illness (limiting) | Employment exit | Activity exit | Satisfied to dissatisfied with job | High to low paid job | Permanent to temporary job | Full to part-time job |
|---|---|---|---|---|---|---|
| Owns home outright | 3.7 *** | 2.9 ** | 0.5 | 1.2 | 1.2 | 0.5 |
| No homeowner | 3.9 *** | 3.1 *** | 2.5 *** | 0.7 | -0.4 | 1.1 ** |
| Difference | -0.2 | -0.2 | -1.9 | 0.5 | 1.6 ** | -0.6 |
| Onset of one or more chronic condition | Employment exit | Activity exit | Satisfied to dissatisfied with job | High to low paid job | Permanent to temporary job | Full to part-time job |
|---|---|---|---|---|---|---|
| Owns home outright | 4.5 *** | 3.5 ** | 2.4 | -0.9 | -0.4 | 0.8 |
| No homeowner | 3.2 *** | 2.0 *** | 1.2 | 0.6 | 0.1 | 0.6 |
| Difference | 1.2 | 1.5 | 1.2 | -1.4 | -0.4 | 0.2 |
*** and ** denote statistical significance at the 1 and 5% level, respectively.
Table A6.5 Characteristics of individuals who recovered from poor health
Table A6.5
| Self-assessed (general) health | Mental health or psychological distress | Self-assessed long-standing illness or disability | Self-assessed long-standing illness or disability (limiting) | |
|---|---|---|---|---|
| Male (%) | 43.31 [0.01] | 38.7 | 44.0 [0.0] | 41.8 |
| Age median (mean), in years | 44 (42.7) | 41 (40.2) | 45 (43.8) | 46 (44.5) |
| Age is between 16 and 24 (%) | 13.1 | 16.3 | 11.3 | 10.1 |
| Age is between 25 and 34 (%) | 16.2 | 19.6 | 14.7 | 14.3 |
| Age is between 35 and 49 (%) | 34.7 | 35.4 | 35.2 | 34.5 |
| Age is between 50 and 59 (%) | 24.2 | 20.9 | 26.0 | 27.0 |
| Age is between 60 and 64 (%) | 11.8 | 7.8 | 12.8 | 14.2 |
| Married or in a civil partnership (%) | 45.3 | 47.2 [0.2] | 51.1 [5.9] | 52.1 [1.3] |
| Highest qualification: Degree (%) | 19.4 [0.9] | 27.9 [0.9] | 24.2 [1.2] | 21.4 [1.1] |
| Highest qualification: Other higher (%) | 11.1 [0.9] | 11.7 [0.9] | 12.2 [1.2] | 12.2 [1.1] |
| Highest qualification: A-level (%) | 21.9 [0.9] | 24.0 [0.9] | 22.3 [1.2] | 21.4 [1.1] |
| Highest qualification: GCSE (%) | 24.8 [0.9] | 21.4 [0.9] | 22.4 [1.2] | 23.3 [1.1] |
| Highest qualification: Other lower (%) | 9.8 [0.9] | 7.2 [0.9] | 8.6 [1.2] | 9.8 [1.1] |
| No qualification (%) | 12.1 [0.9] | 7.0 [0.9] | 9.0 [1.2] | 10.9 [1.1] |
| White ethnicity (%) | 76.5 [3.0] | 81.8 [1.3] | 80.0 [2.4] | 81.3 [1.2] |
| Any children aged under 16 (%) | 33.1 [7.1] | 35.8 | 32.5 [5.7] | 32.0 [1.1] |
| Homeowner (%) | 20.2 [2.3] | 18.9 [2.5] | 22.9 [2.2] | 22.9 [2.5] |
| Mortgage (%) | 39.9 [2.3] | 46.5 [2.5] | 44.9 [2.2] | 40.5 [2.5] |
| Renting (%) | 37.6 [2.3] | 32.1 [2.5] | 30.0 [2.2] | 34.0 [2.5] |
| Employed (%) | 61.2 | 65.6 [0.0] | 69.3 [0.0] | 63.5 [0.0] |
| Just experienced employment entry | 5.1 [0.0] | 4.13 [0.0] | 4.7 [0.1] | 4.6 [0.1] |
| Just experienced employment exit | 6.2 [0.0] | 6.4 [0.0] | 5.3 [0.1] | 6.2 [0.1] |
| Active (%) | 65.4 [3.5] | 57.3 [4.5] | 72.0 [3.5] | 67.0 [3.6] |
| Region: North East (%) | 3.7 [0.1] | 3.8 [0.1] | 3.8 [0.1] | 3.9 [0.1] |
| Region: North West (%) | 9.8 [0.1] | 10.6 [0.1] | 9.9 [0.1] | 10.0 [0.1] |
| Region: Yorkshire and the Humber (%) | 8.9 [0.1] | 8.2 [0.1] | 8.3 [0.1] | 8.4 [0.1] |
| Region: East Midlands (%) | 7.8 [0.1] | 7.3 [0.1] | 7.8 [0.1] | 7.7 [0.1] |
| Region: West Midlands (%) | 9.2 [0.1] | 8.6 [0.1] | 8.5 [0.1] | 8.6 [0.1] |
| Region: East of England (%) | 8.3 [0.1] | 8.5 [0.1] | 8.5 [0.1] | 8.0 [0.1] |
| Region: London (%) | 14.0 [0.1] | 12.3 [0.1] | 13.1 [0.1] | 12.4 [0.1] |
| Region: South East (%) | 10.9 [0.1] | 12.1 [0.1] | 11.6 [0.1] | 11.5 [0.1] |
| Region: South West (%) | 7.1 [0.1] | 8.1 [0.1] | 8.0 [0.1] | 7.7 [0.1] |
| Region: Wales | 6.9 [0.1] | 6.6 [0.1] | 7.0 [0.1] | 7.0 [0.1] |
| Region: Scotland | 7.2 [0.1] | 8.2 [0.1] | 8.2 [0.1] | 8.3 [0.1] |
| Region: Northern Ireland | 6.2 [0.1] | 5.7 [0.1] | 5.4 [0.1] | 6.4 [0.1] |
| Sample size | 10,517 | 15,172 | 14,481 | 10,260 |
Individual characteristics are observed at the start of the poor health spell. Proportion with missing information on the variable of interest reported in square brackets.
Table A6.6 Characteristics of individuals who relapsed into poor health and of individuals who developed a chronic condition
| Self-assessed (general) health | Mental health or psychological distress | Self-assessed long-standing illness or disability | Self-assessed long-standing illness or disability (limiting) | One or more chronic conditions | |
|---|---|---|---|---|---|
| Male (%) | 43.4 | 38.2 [0.0] | 44.1 | 41.2 | 48.0 |
| Age median (mean), in years | 44 (42.6) | 41 (40.4) | 45 (43.8) | 46 (44.7) | 36 (36.7) |
| Age is between 16 and 24 (%) | 13.1 | 16.0 | 11.2 | 9.7 | 21.5 |
| Age is between 25 and 34 (%) | 16.5 | 19.4 | 14.6 | 13.9 | 24.5 |
| Age is between 35 and 49 (%) | 34.5 | 35.4 | 35.7 | 35.1 | 35.6 |
| Age is between 50 and 59 (%) | 24.3 | 21.2 | 25.4 | 26.5 | 13.6 |
| Age is between 60 and 64 (%) | 11.6 | 8.1 | 13.1 | 14.7 | 4.9 |
| Married or in a civil partnership (%) | 45.4 [6.8] | 47.1 [0.2] | 51.0 [6.1] | 51.6 [2.3] | 47.73 [0.0] |
| Highest qualification: Degree (%) | 19.2 [0.9] | 28.4 [1.0] | 25.3 [0.8] | 22.1 [0.7] | 26.3 [0.2] |
| Highest qualification: Other higher (%) | 11.0 [0.9] | 12.0 [1.0] | 12.1 [0.8] | 12.2 [0.7] | 10.8 [0.2] |
| Highest qualification: A-level (%) | 22.2 [0.9] | 23.8 [1.0] | 22.1 [0.8] | 20.9 [0.7] | 21.6 [0.2] |
| Highest qualification: GCSE (%) | 24.8 [0.9] | 21.0 [1.0] | 22.4 [0.8] | 23.4 [0.7] | 23.1 [0.2] |
| Highest qualification: Other lower (%) | 9.9 [0.9] | 7.1 [1.0] | 8.5 [0.8] | 9.7 [0.7] | 7.5 [0.2] |
| No qualification (%) | 12.0 [0.9] | 6.7 [1.0] | 8.8 [0.8] | 11.0 [0.7] | 10.5 [0.2] |
| White ethnicity (%) | 76.3 [2.9] | 81.7 [1.3] | 81.2 [2.4] | 82.8 [0.9] | 68.6 [6.2] |
| Any children aged under 16 (%) | 33.2 [6.6] | 36.1 | 32.0 [6.0] | 31.7 [2.2] | 35.3 [10.3] |
| Homeowner (%) | 20.6 [2.2] | 18.9 [2.4] | 23.8 [2.2] | 23.6 [2.2] | 16.6 [2.2] |
| Mortgage (%) | 39.6 [2.2] | 46.5 [2.4] | 45.0 [2.2] | 41.3 [2.2] | 46.3 [2.2] |
| Renting (%) | 37.6 [2.2] | 32.2 [2.4] | 29.1 [2.2] | 32.9 [2.2] | 34.9 [2.2] |
| Employed (%) | 63.0 [0.0] | 68.0 [0.0] | 70.3 [0.0] | 64.8 | 67.7 [0.0] |
| Just experienced employment entry | 6.7 [0.1] | 8.5 [0.0] | 5.4 [0.1] | 5.8 [0.0] | NA |
| Just experienced employment exit | 4.6 [0.1] | 4.0 [0.0] | 4.3 [0.1] | 4.5 [0.0] | NA |
| Active (%) | 66.7 [2.9] | 70.1 [4.1] | 72.9 [3.1] | 68.0 [3.0] | 70.0 [4.2] |
| Region: North East (%) | 3.7 [0.1] | 3.7 [0.1] | 3.6 [0.0] | 3.8 [0.1] | 3.7 |
| Region: North West (%) | 10.3 [0.1] | 10.7 [0.1] | 9.9 [0.0] | 10.1 [0.1] | 9.9 |
| Region: Yorkshire and the Humber (%) | 8.9 [0.1] | 8.3 [0.1] | 8.5 [0.0] | 8.5 [0.1] | 8.5 |
| Region: East Midlands (%) | 7.9 [0.1] | 7.6 [0.1] | 7.7 [0.0] | 7.8 [0.1] | 7.1 |
| Region: West Midlands (%) | 9.0 [0.1] | 8.8 [0.1] | 8.2 [0.0] | 8.6 [0.1] | 9.0 |
| Region: East of England (%) | 8.3 [0.1] | 8.4 [0.1] | 8.4 [0.0] | 7.9 [0.1] | 8.5 |
| Region: London (%) | 14.2 [0.1] | 12.5 [0.1] | 13.2 [0.0] | 11.8 [0.1] | 20.0 |
| Region: South East (%) | 10.5 [0.1] | 12.2 [0.1] | 12.1 [0.0] | 11.6 [0.1] | 11.8 |
| Region: South West (%) | 7.1 [0.1] | 7.9 [0.1] | 7.8 [0.0] | 7.7 [0.1] | 6.8 |
| Region: Wales | 6.7 [0.1] | 6.4 [0.1] | 6.6 [0.0] | 7.2 [0.1] | 4.0 |
| Region: Scotland | 7.1 [0.1] | 7.9 [0.1] | 8.7 [0.0] | 8.6 [0.1] | 6.5 |
| Region: Northern Ireland | 6.2 [0.1] | 5.7 [0.1] | 5.3 [0.0] | 6.3 [0.1] | 4.3 |
| Sample size | 9,880 | 15,359 | 13,514 | 9,382 | 26,524 |
Individual characteristics are observed at the start of the good health spell (for ‘One or more chronic conditions’ they are observed at Wave 1 interview). Proportion with missing information on the variable of interest reported in square brackets.
Figure A6.7 Survivor functions for time in poor health, by gender
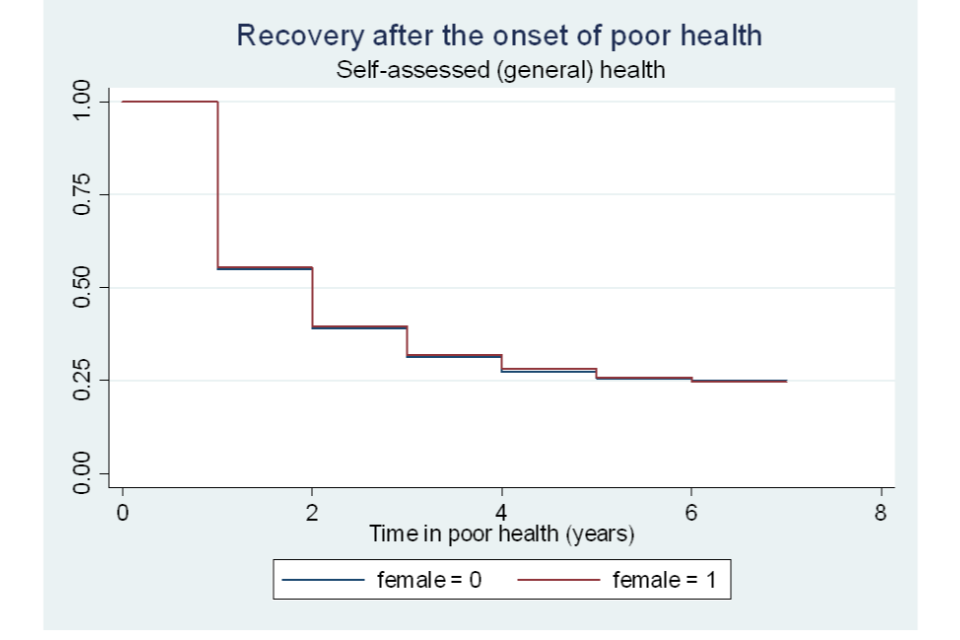
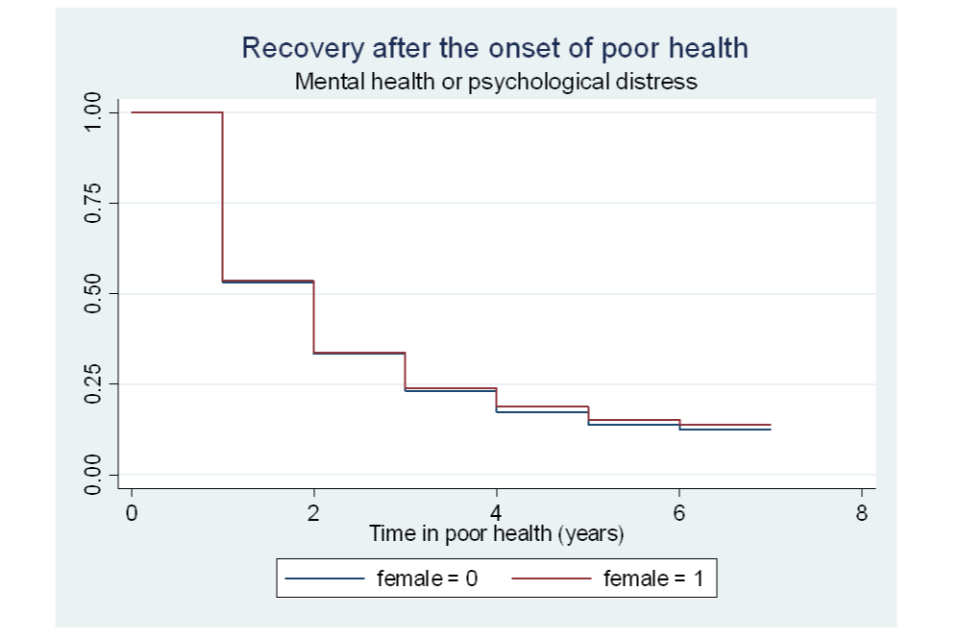
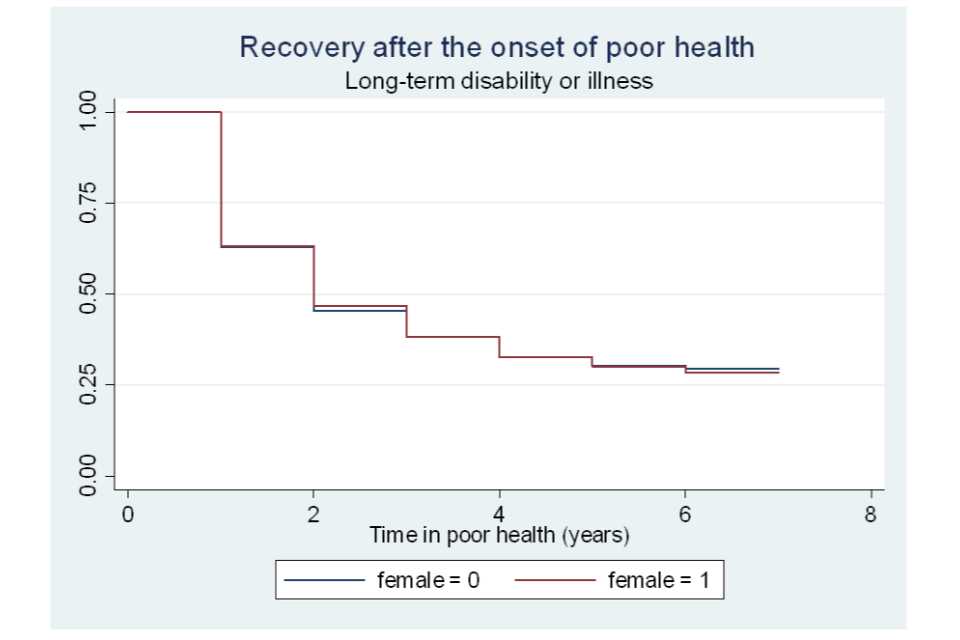
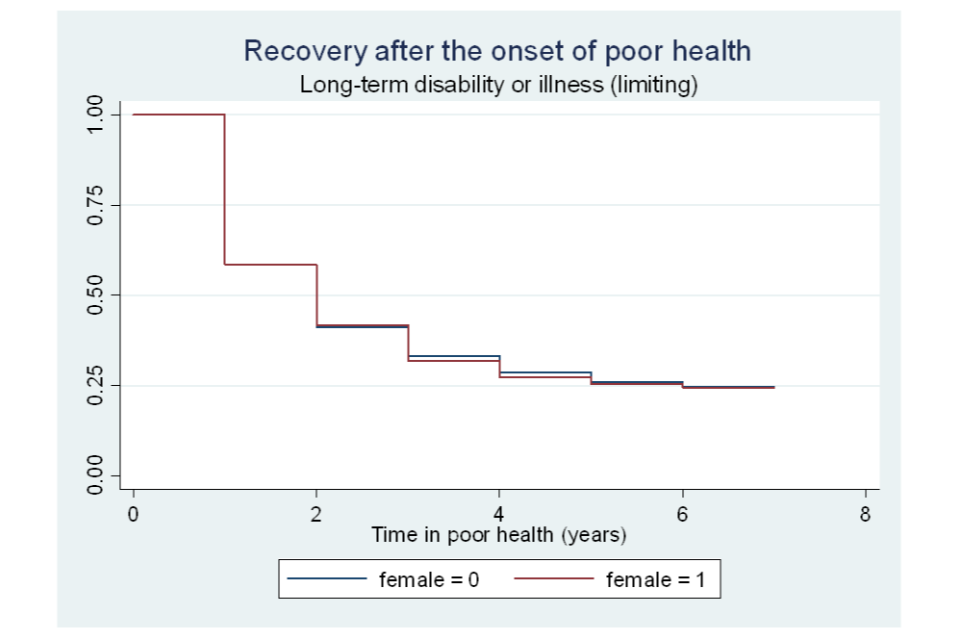
Figure A6.8 Survivor functions for time in poor health, by age category
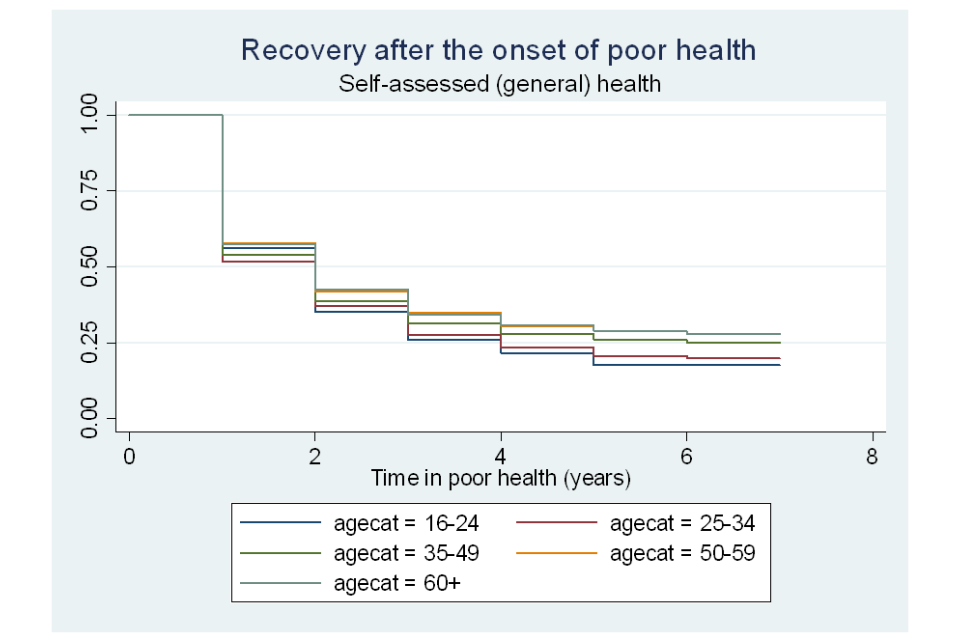
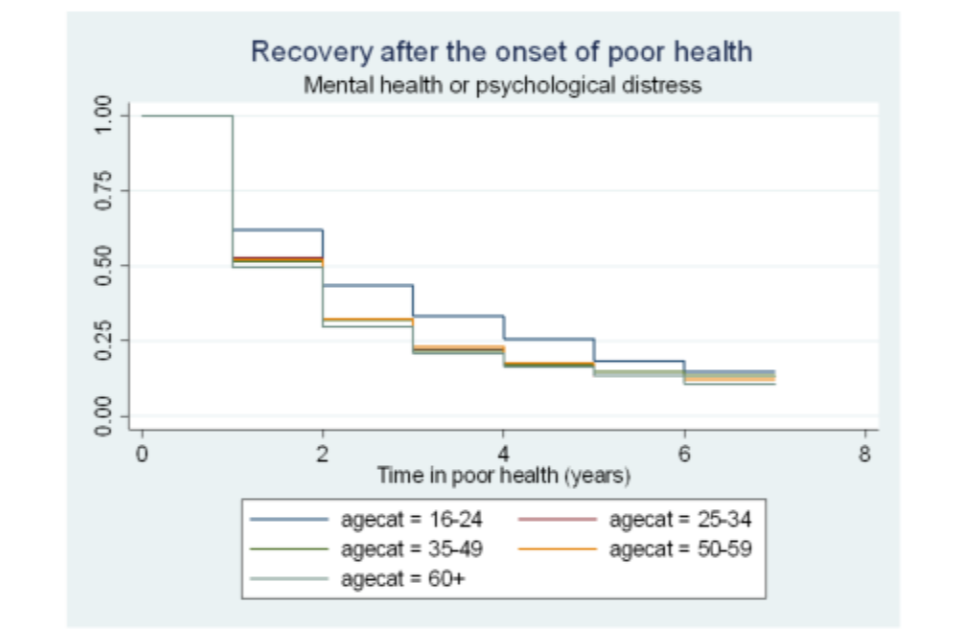
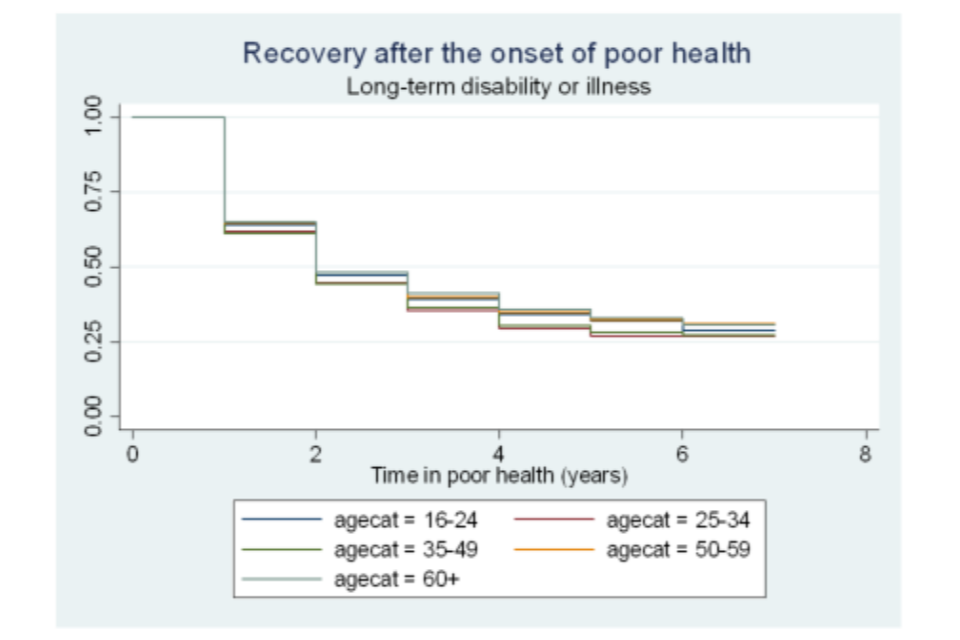
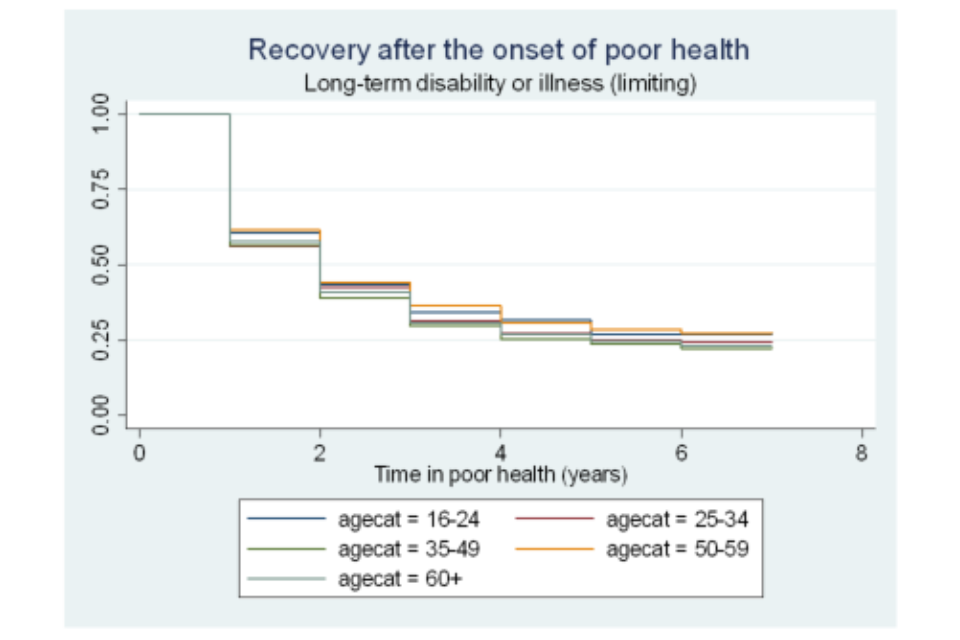
Figure A6.9 Survivor functions for time in poor health, by ethnic group
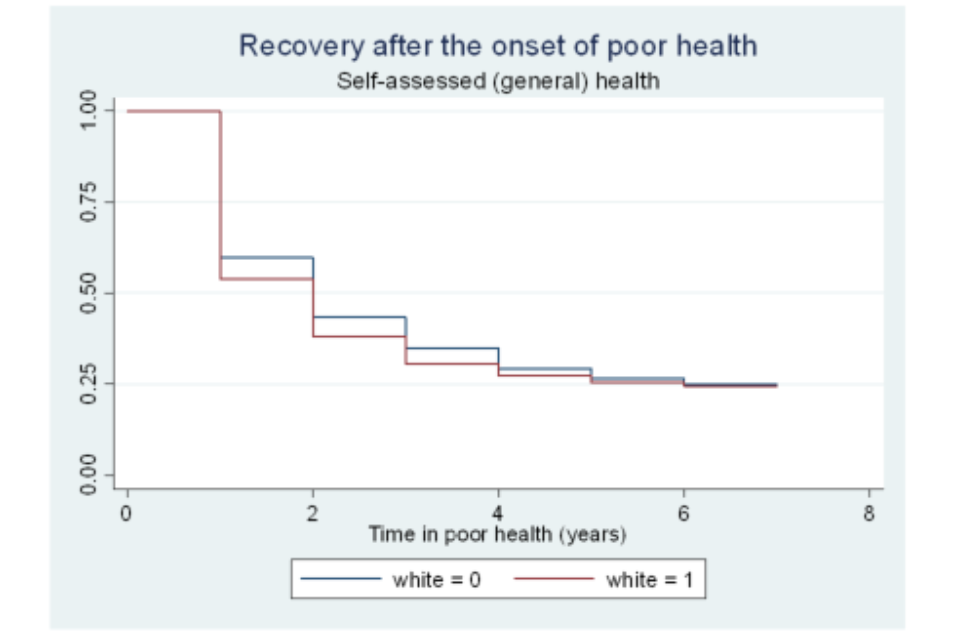
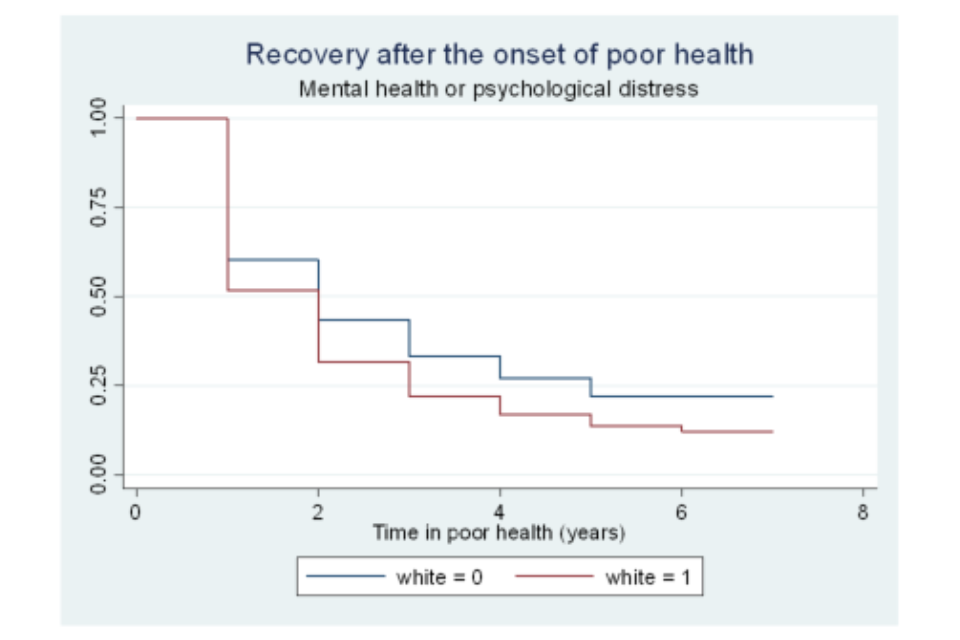
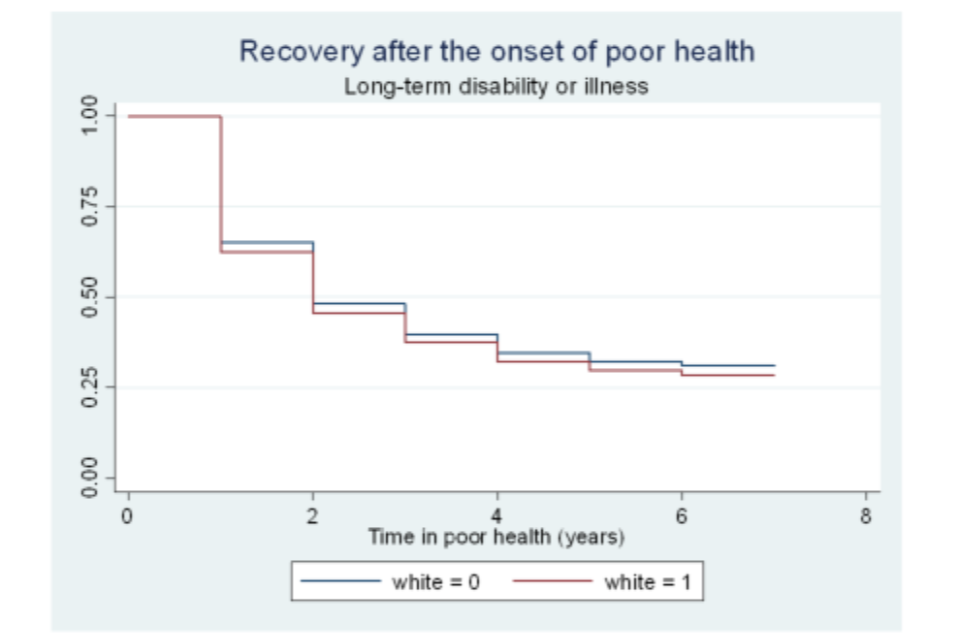
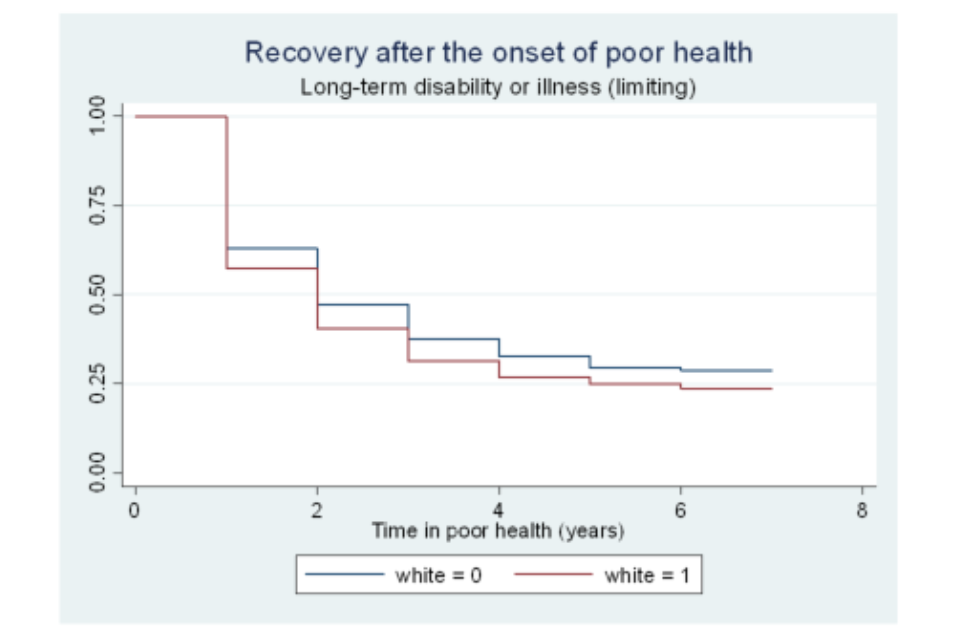
Figure A6.10 Survivor functions for time in poor health, by highest educational qualification
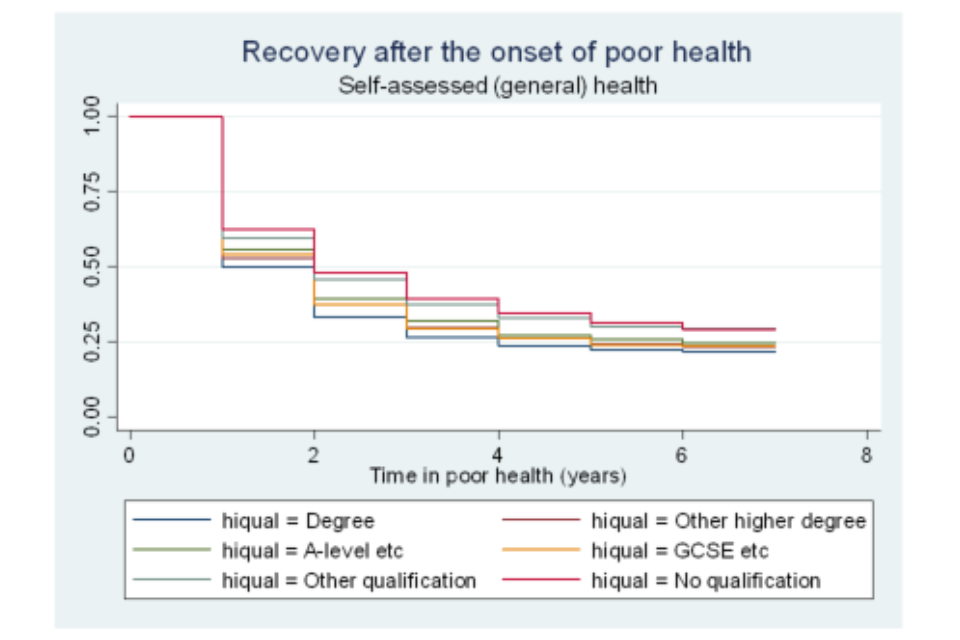
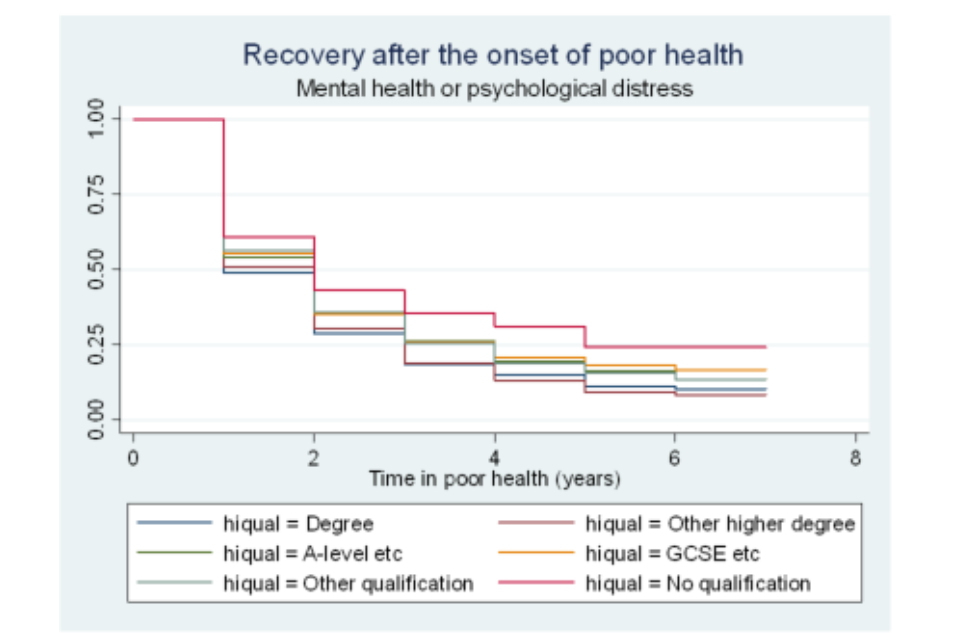
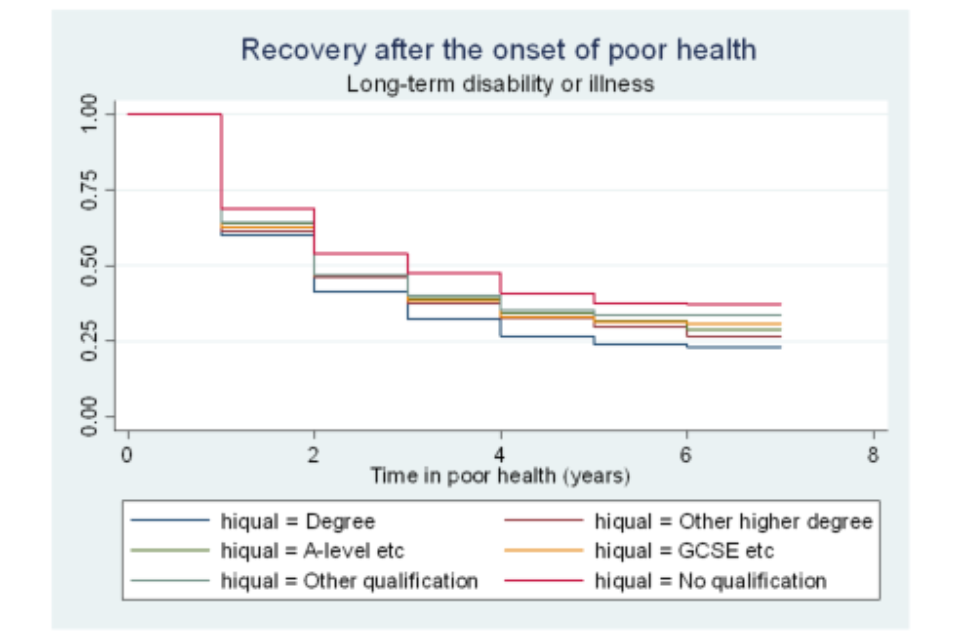
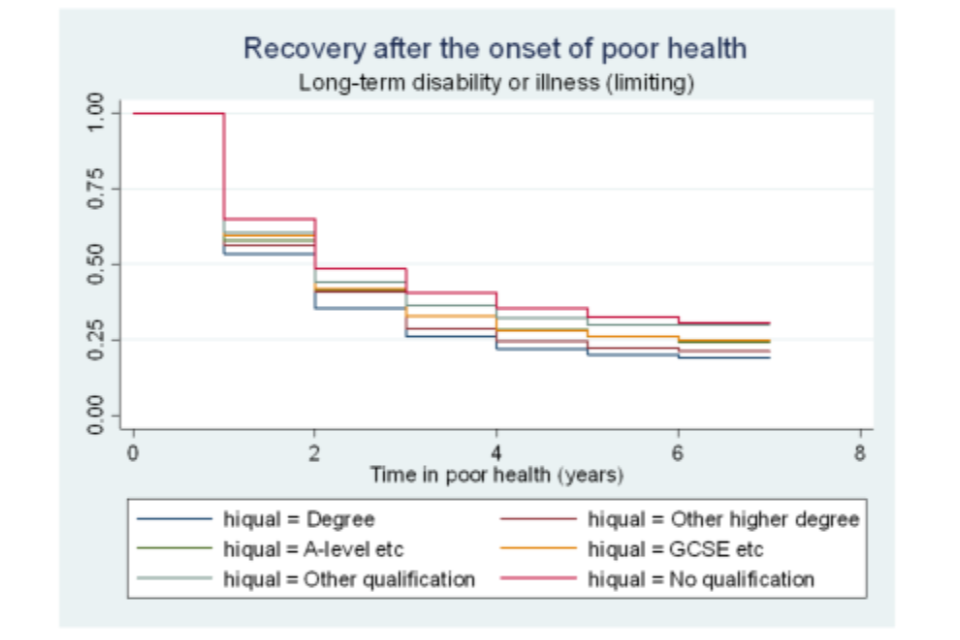
Figure A6.11 Survivor functions for time in poor health, by employment status

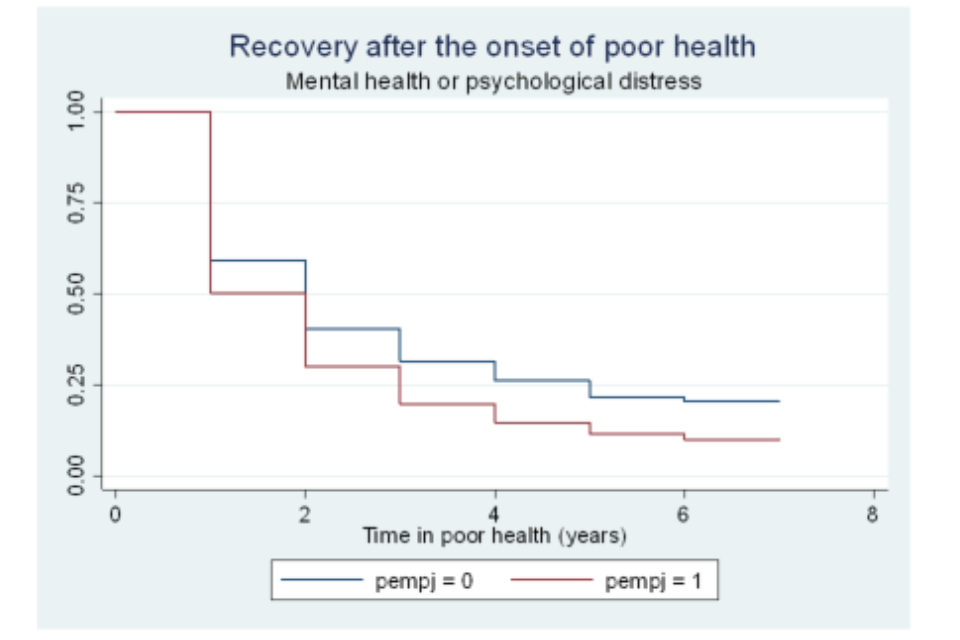
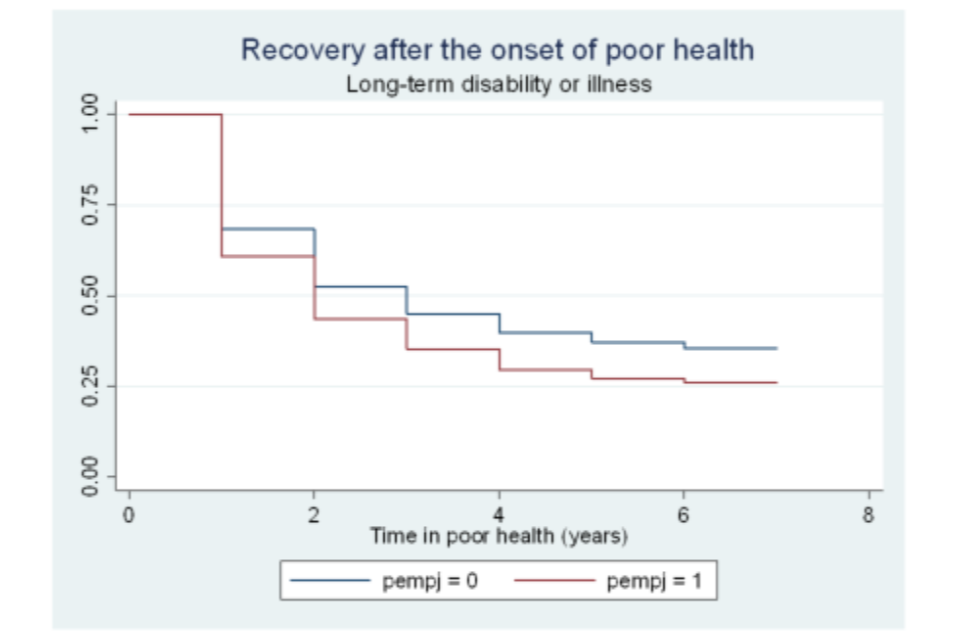
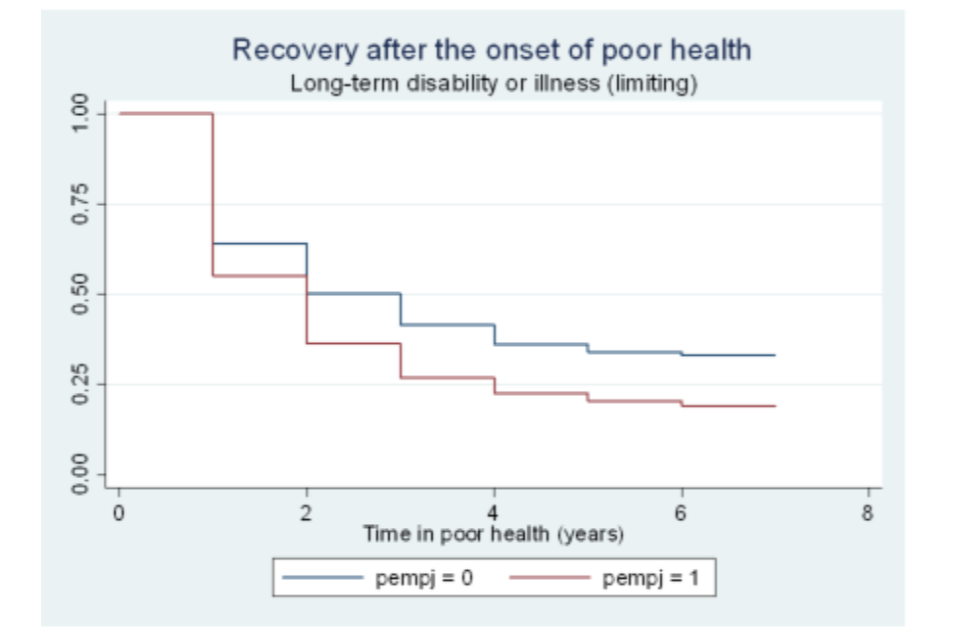
Figure A6.12 Survivor functions for time in poor health, by activity status
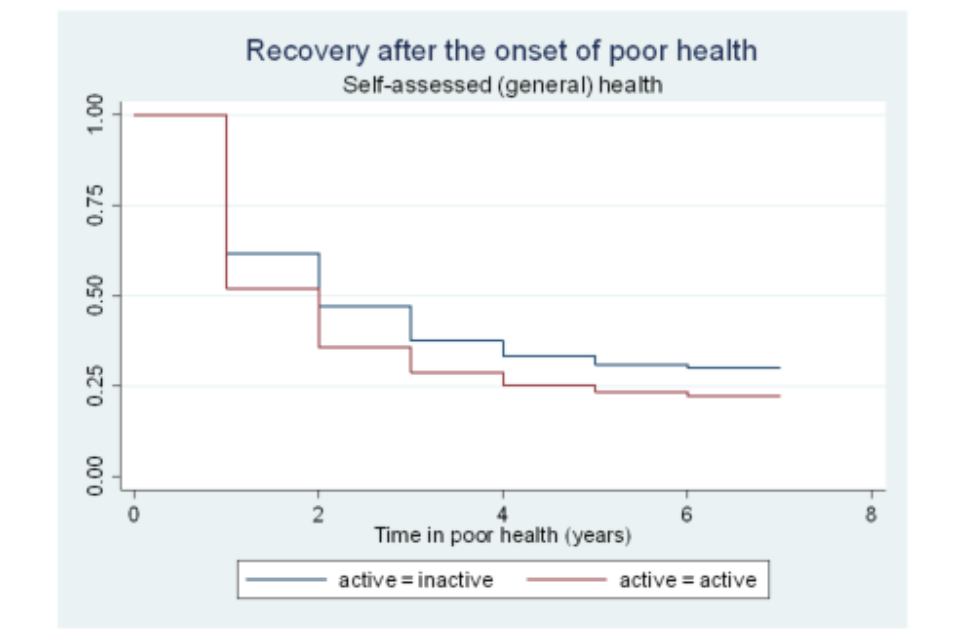
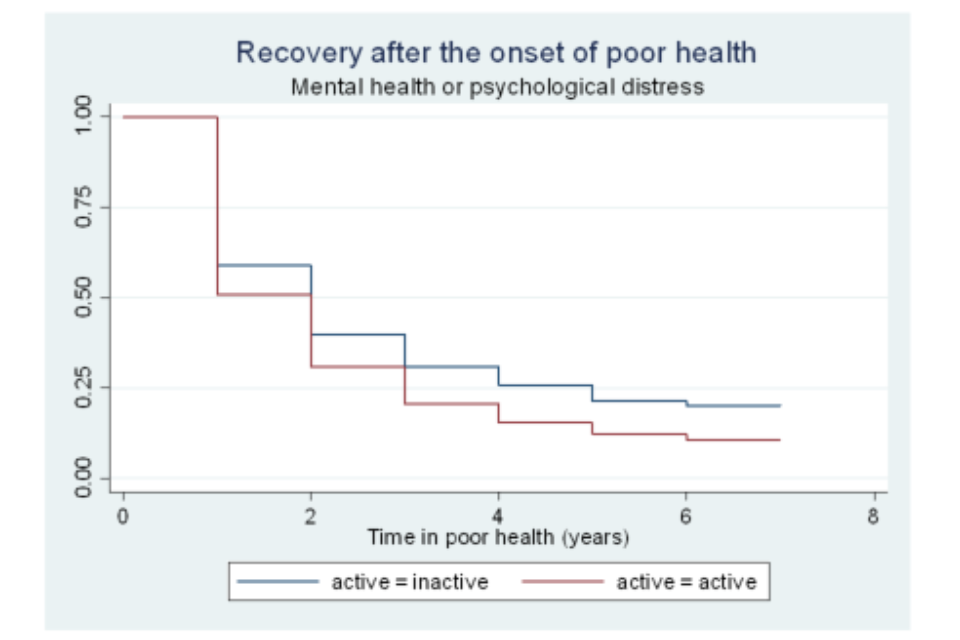
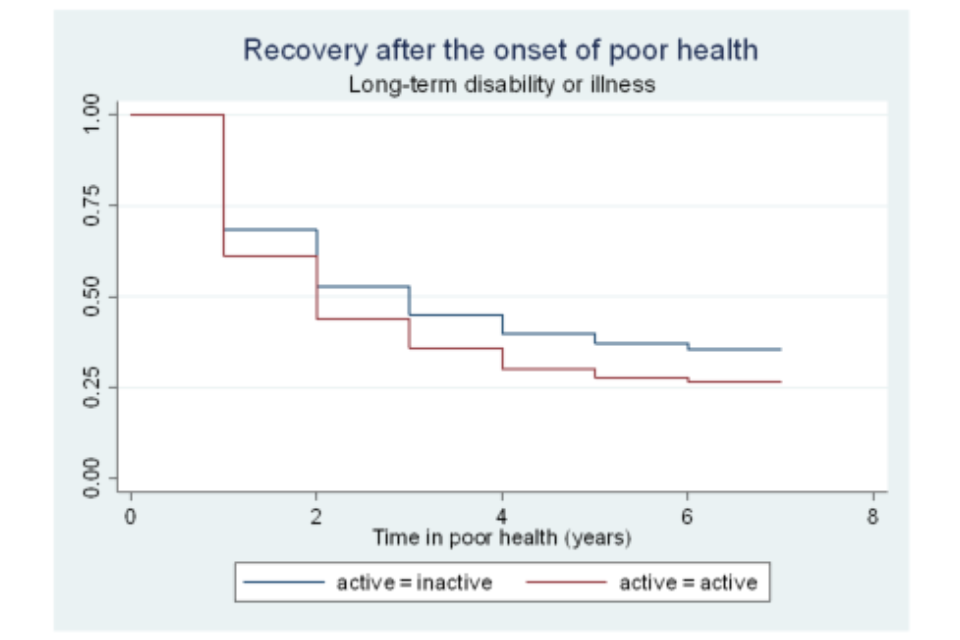
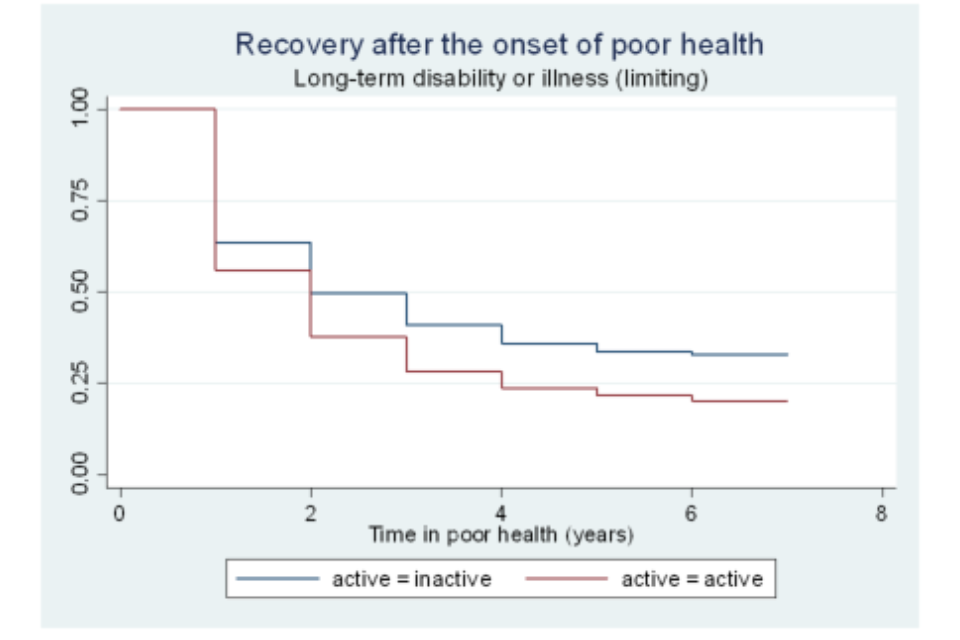
Figure A6.13 Survivor functions for time in poor health, by marital status
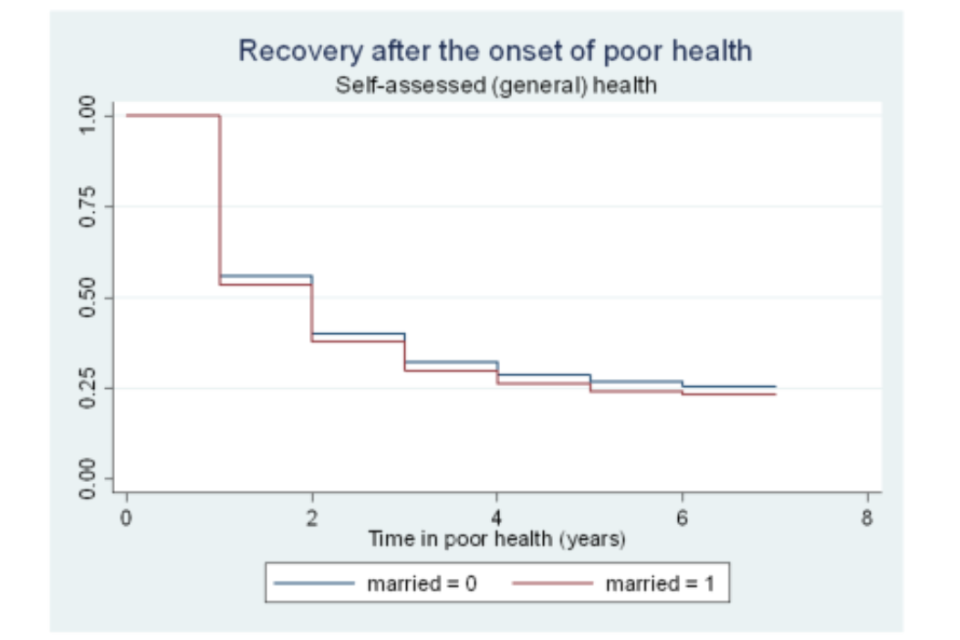
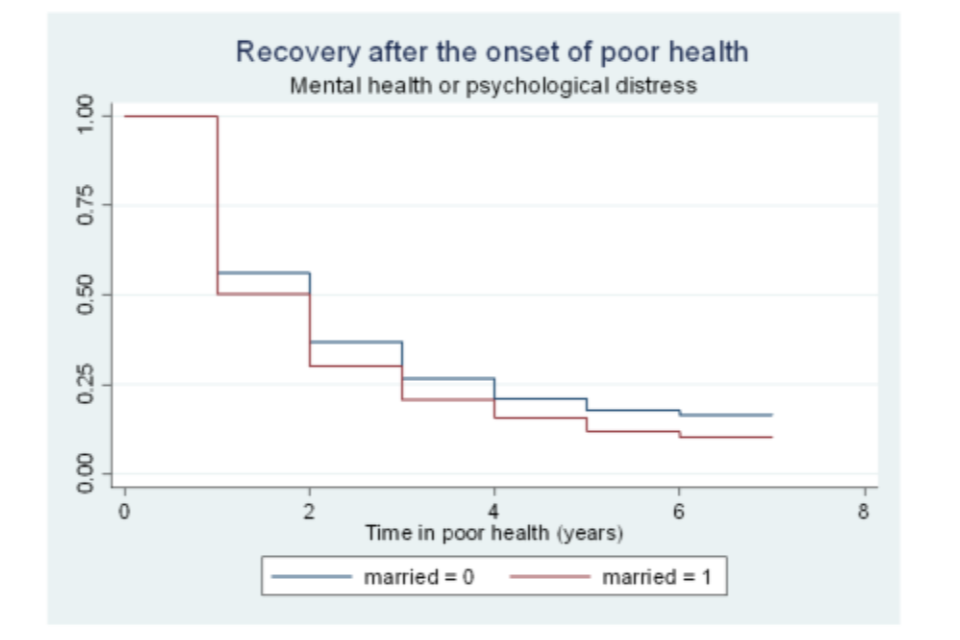
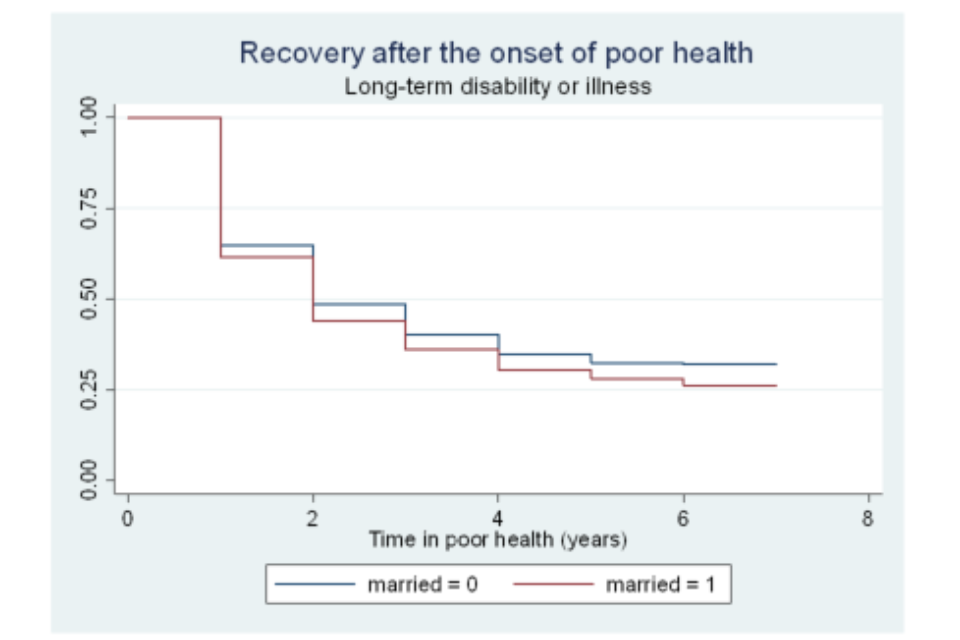
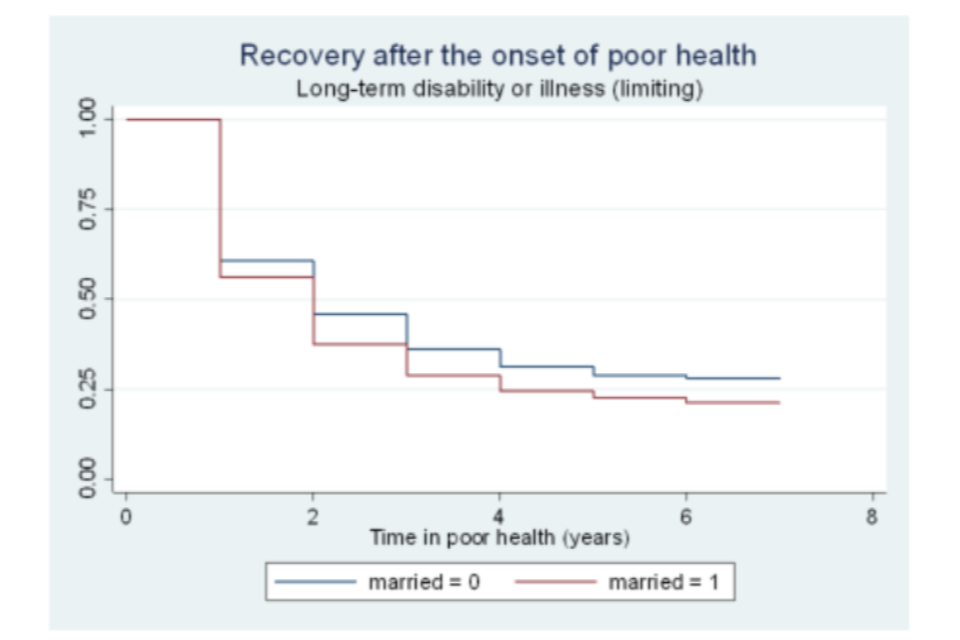
Figure A6.14 Survivor functions for time in poor health, by whether has children
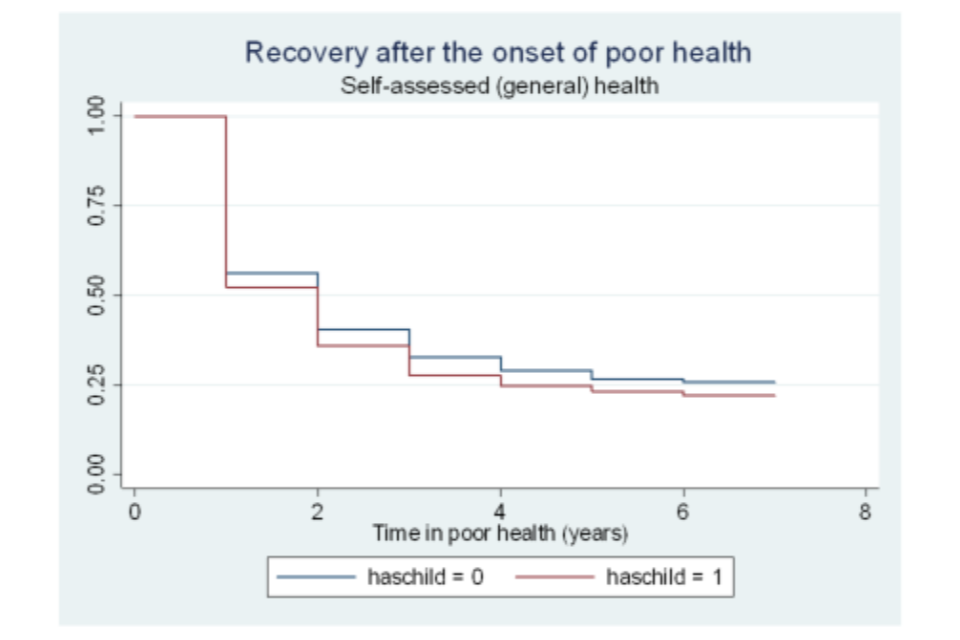
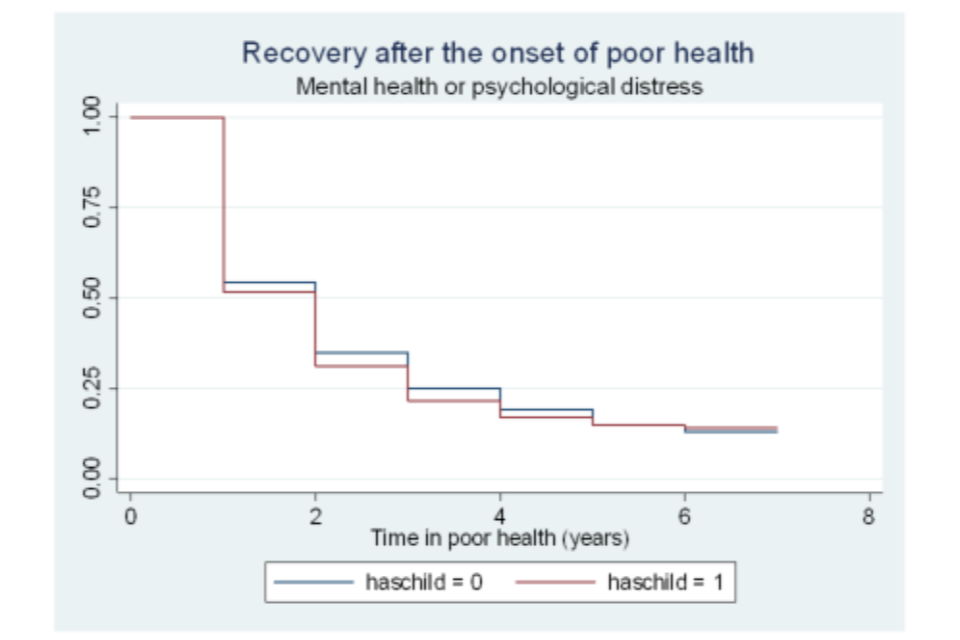
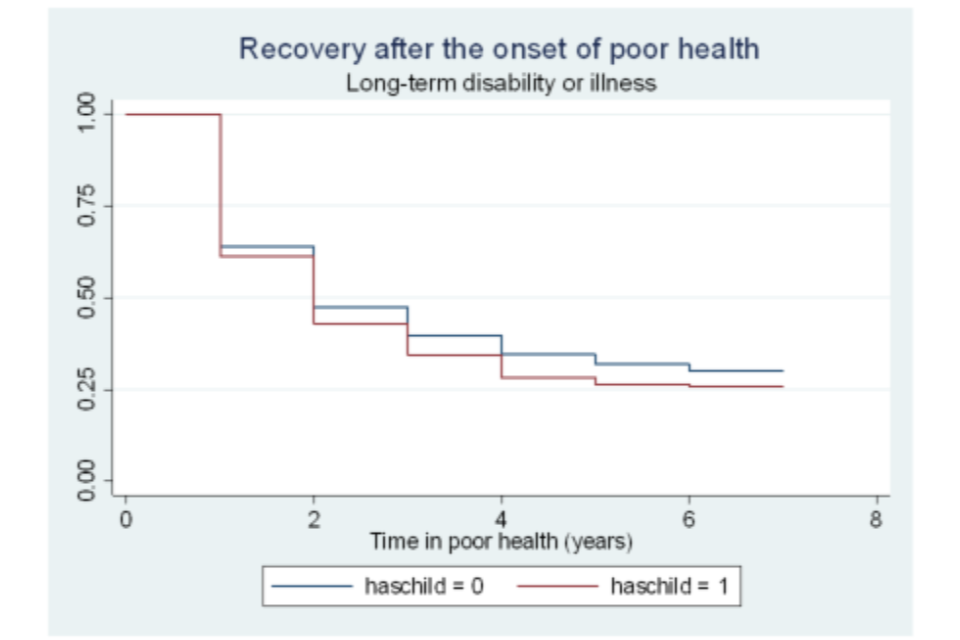
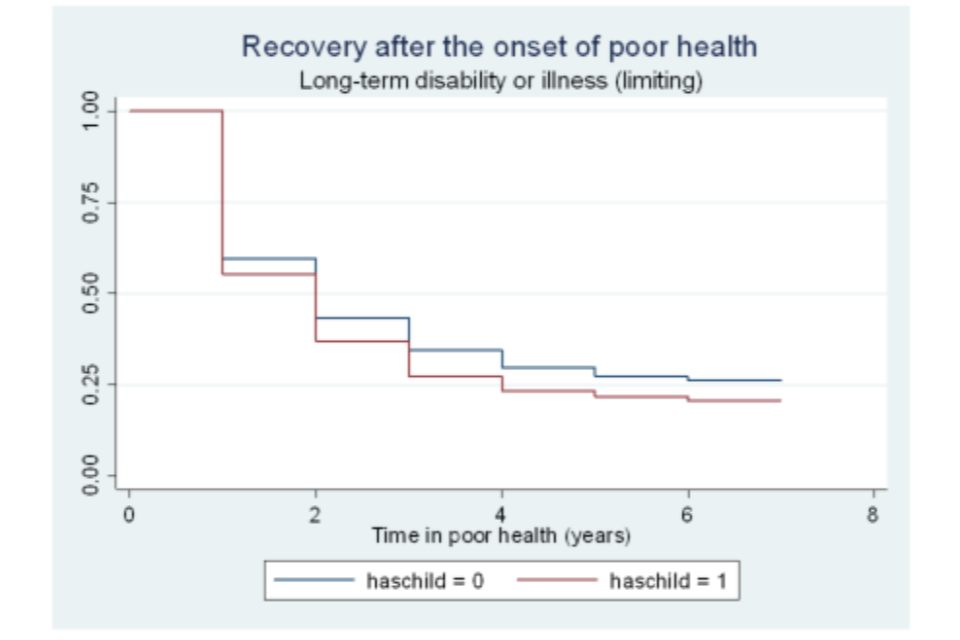
Figure A6.15 Survivor functions for time in poor health, by region
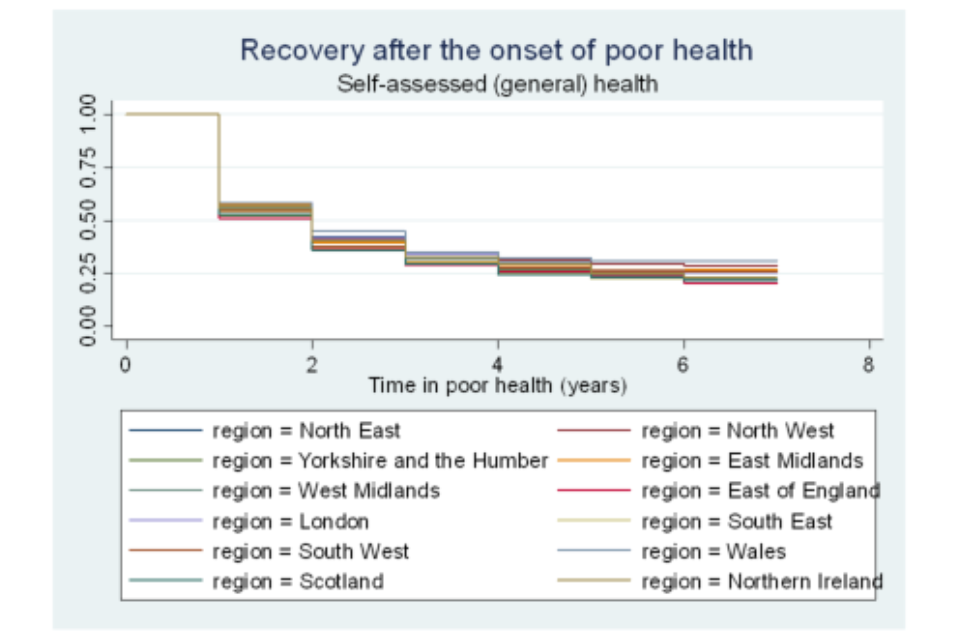
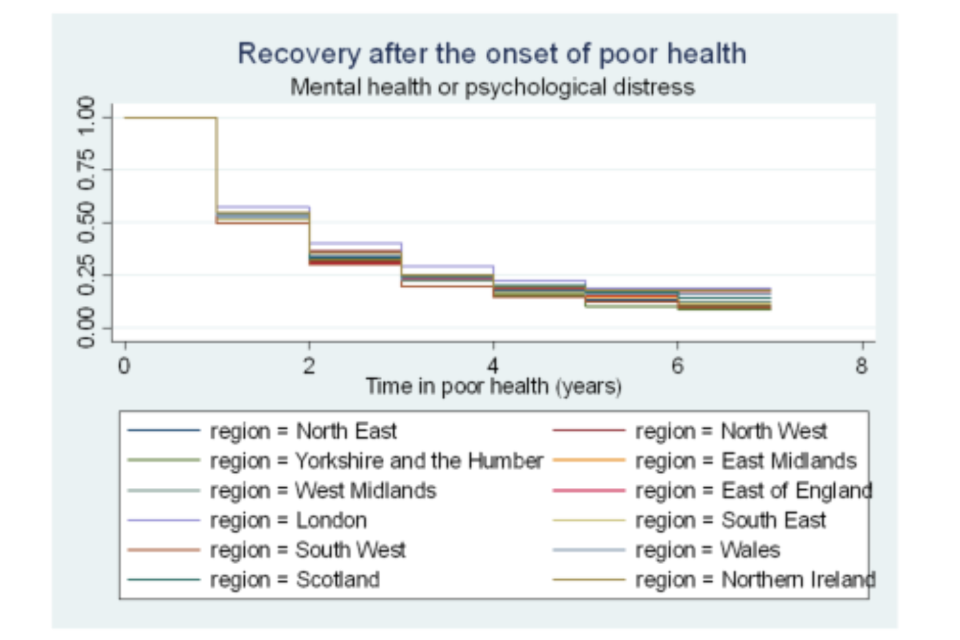
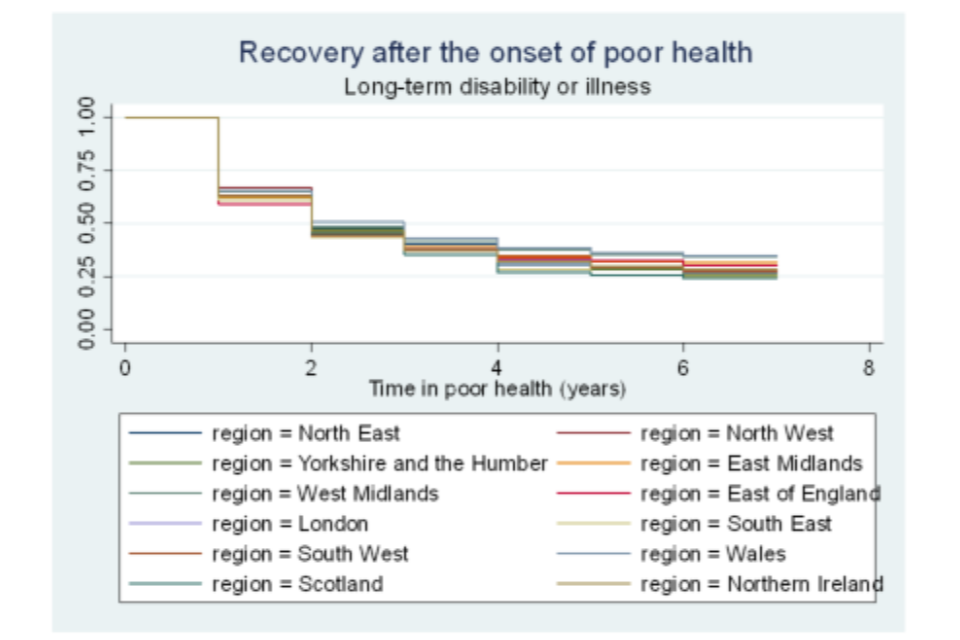
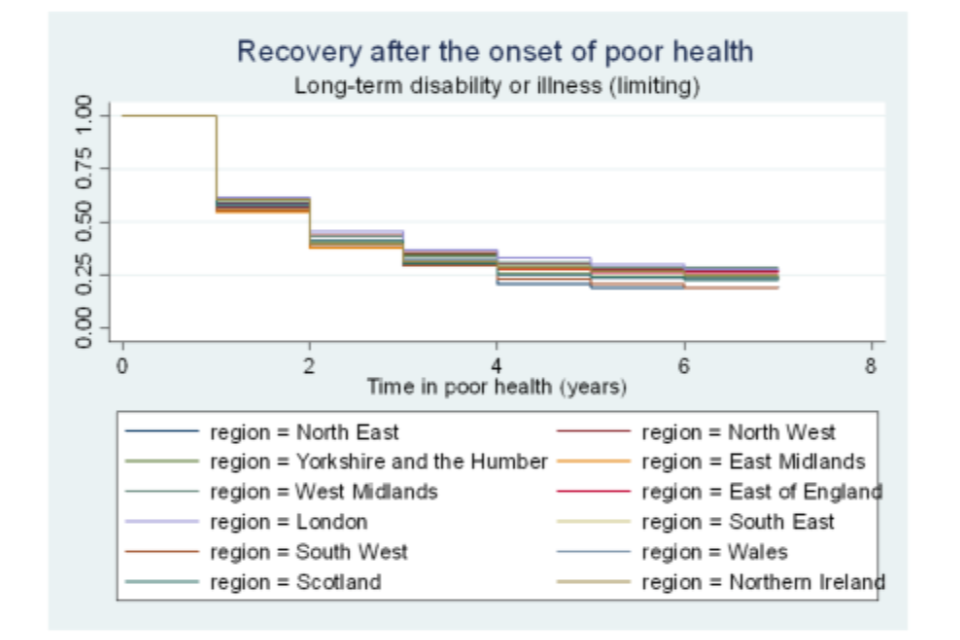
Figure A6.16 Survivor functions for time in poor health, by home-ownership status
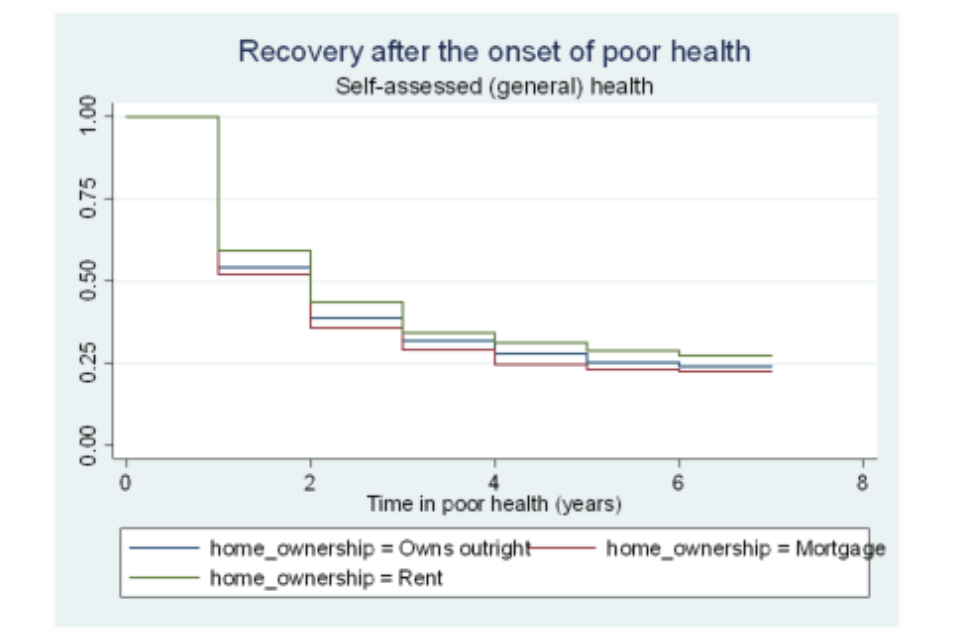
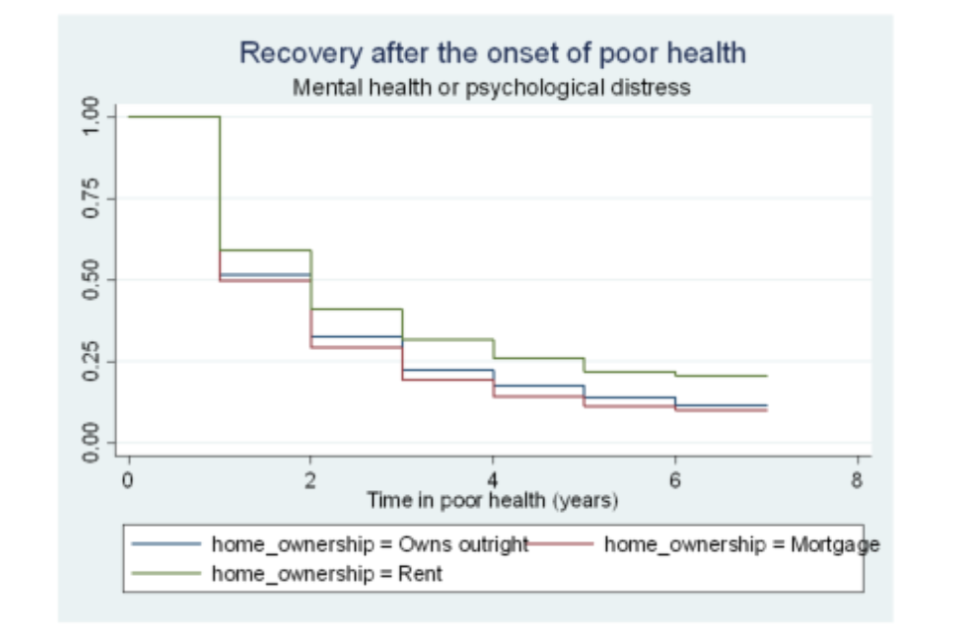
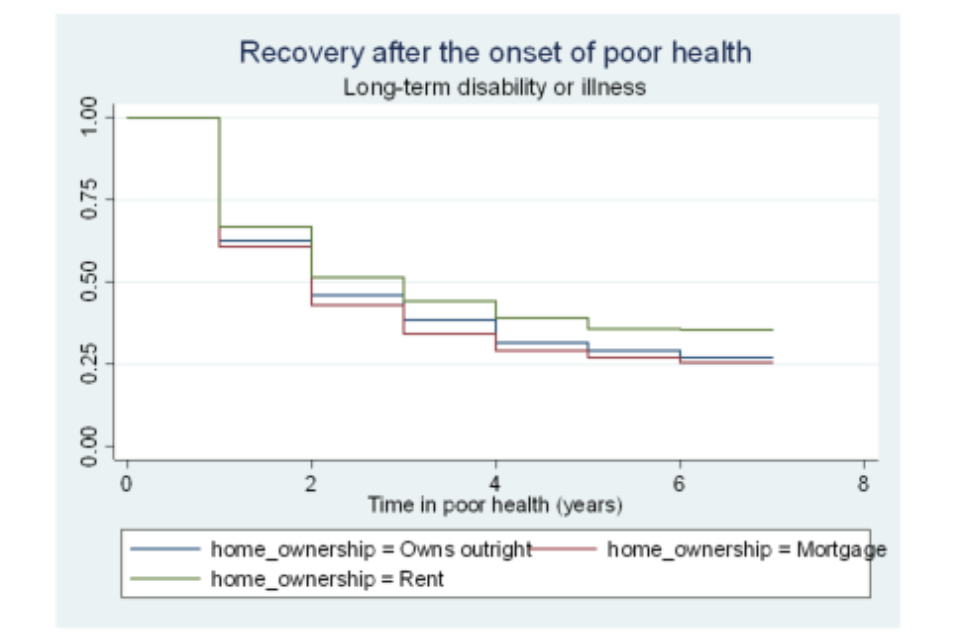
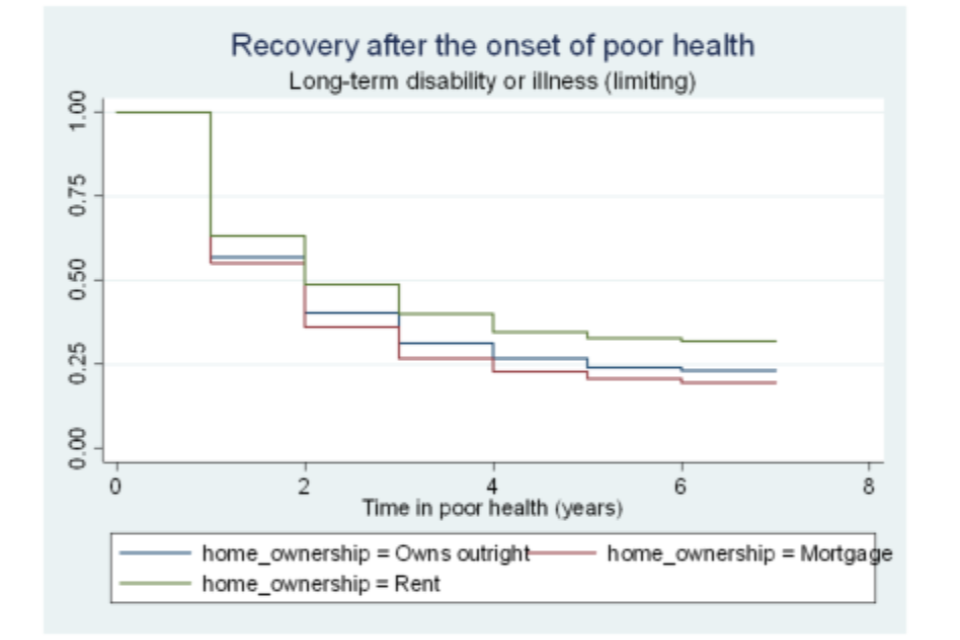
Figure A6.17 Survivor functions for time in good health, by gender
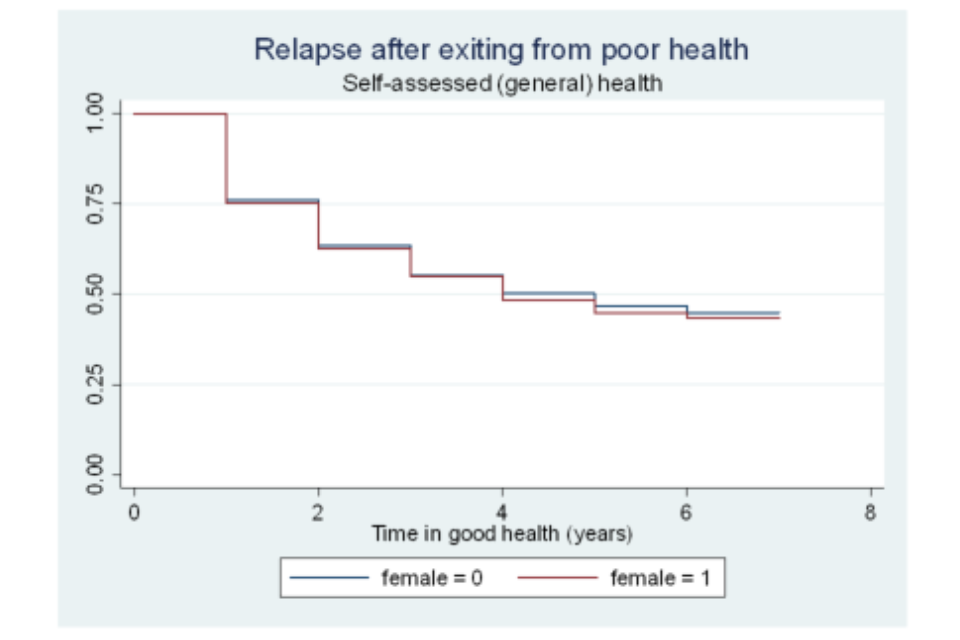

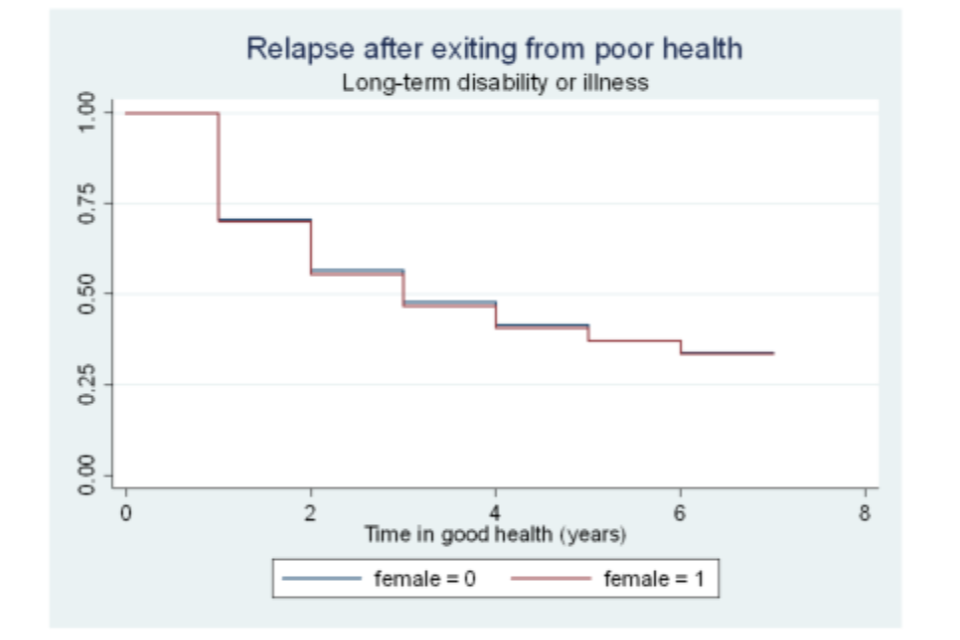
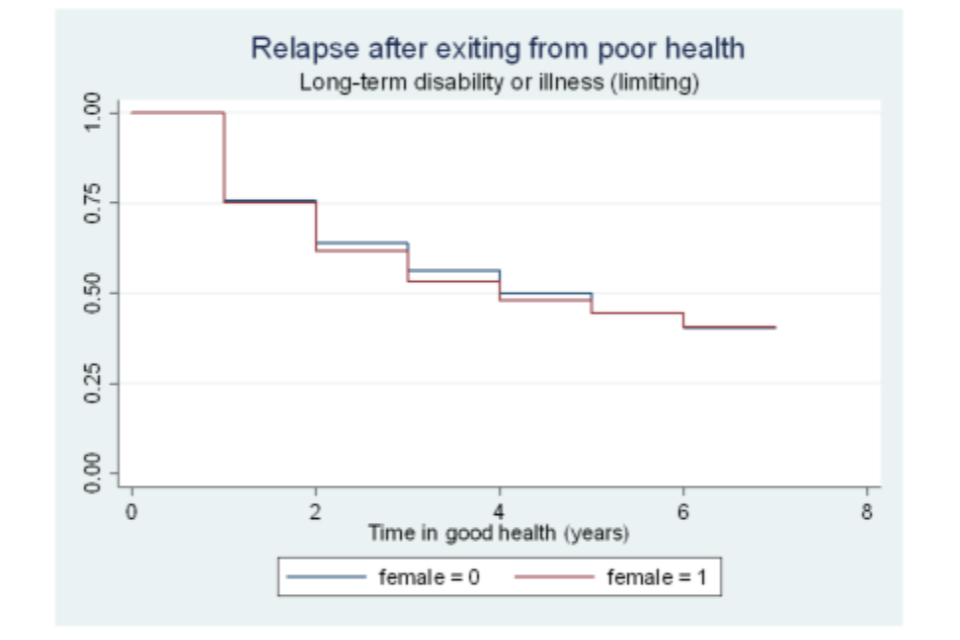
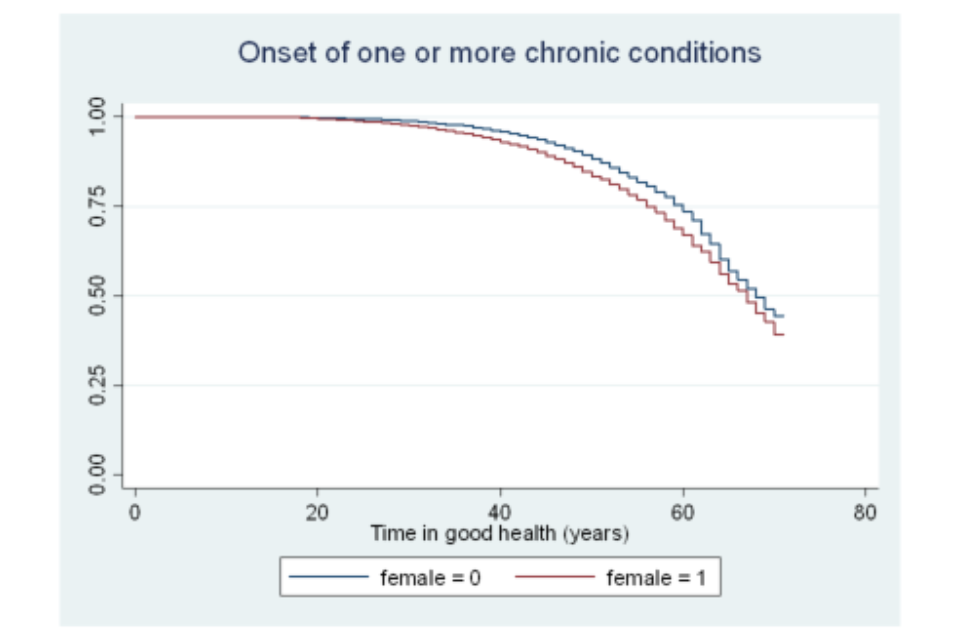
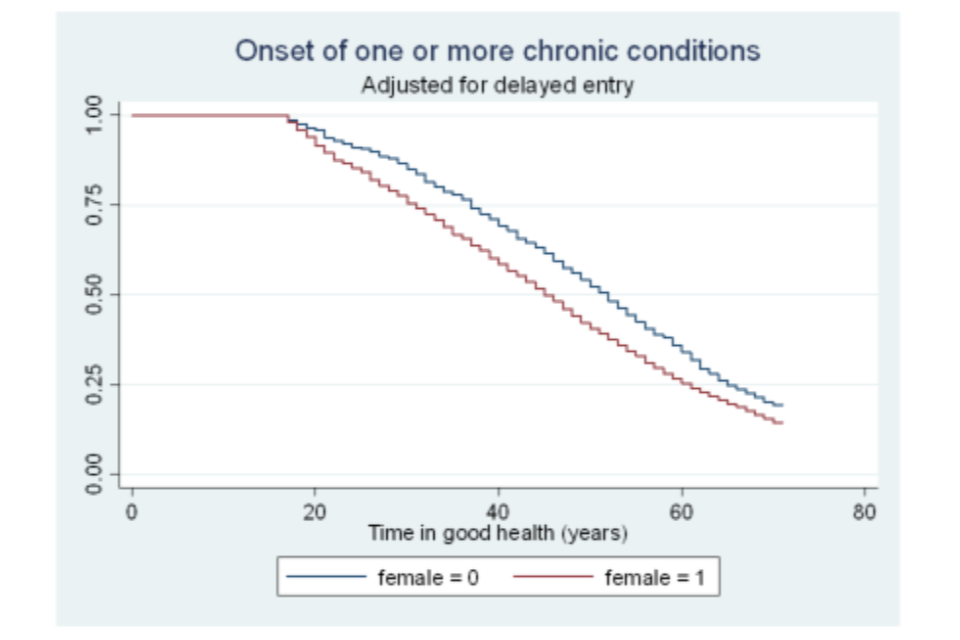
Figure A6.18 Survivor functions for time in good health, by age category
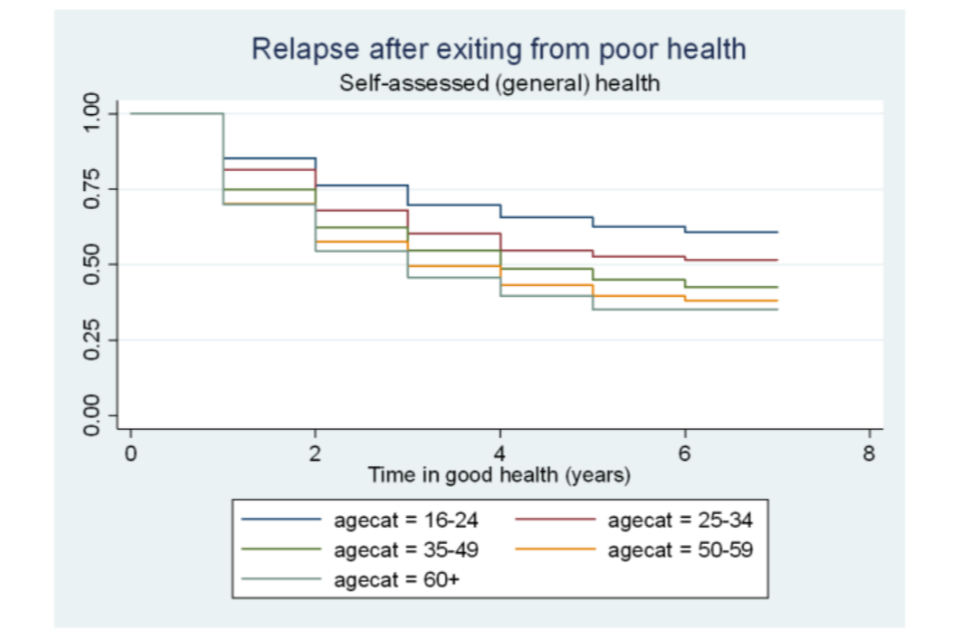
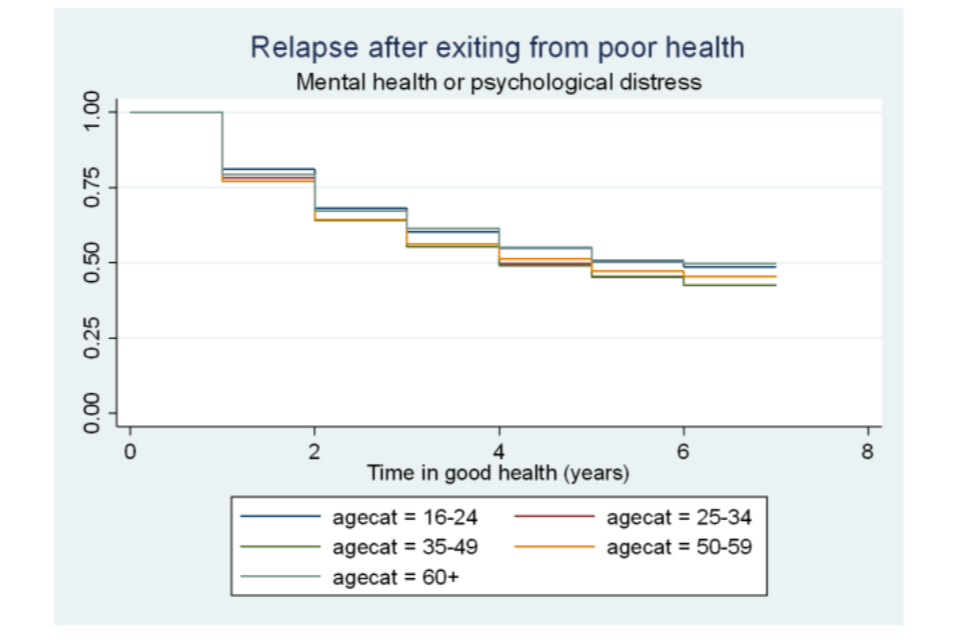
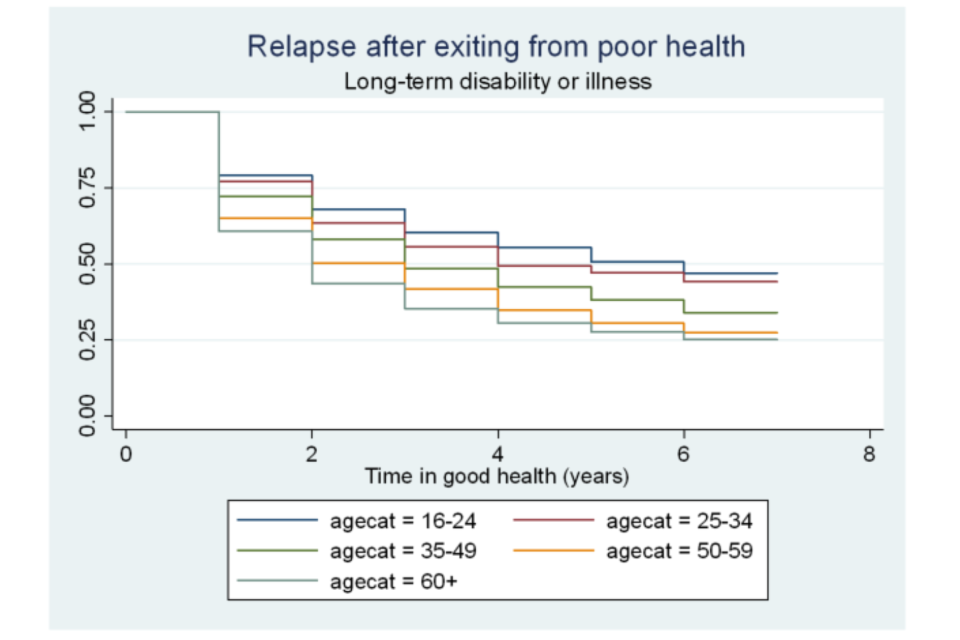
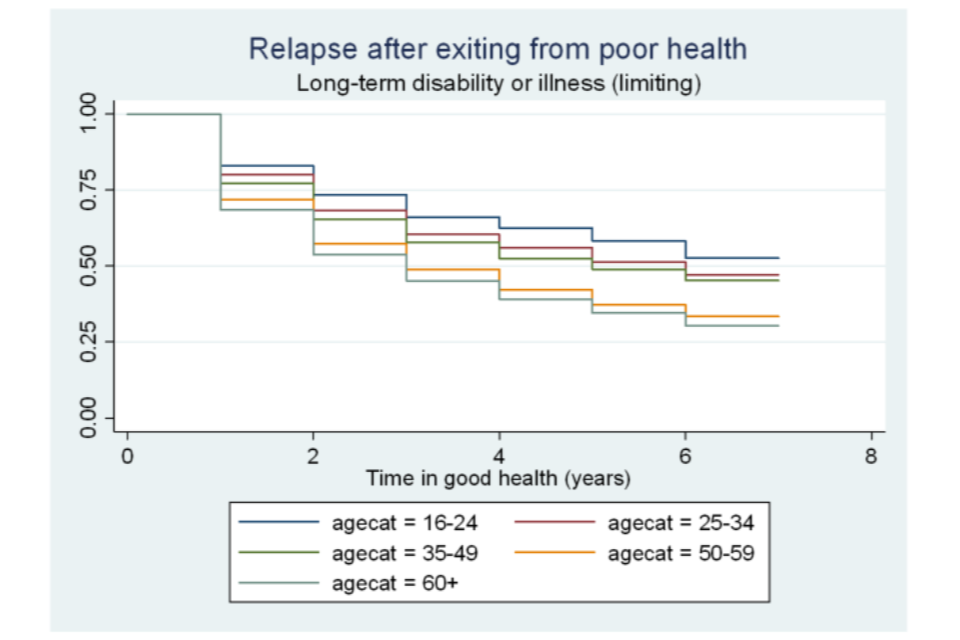
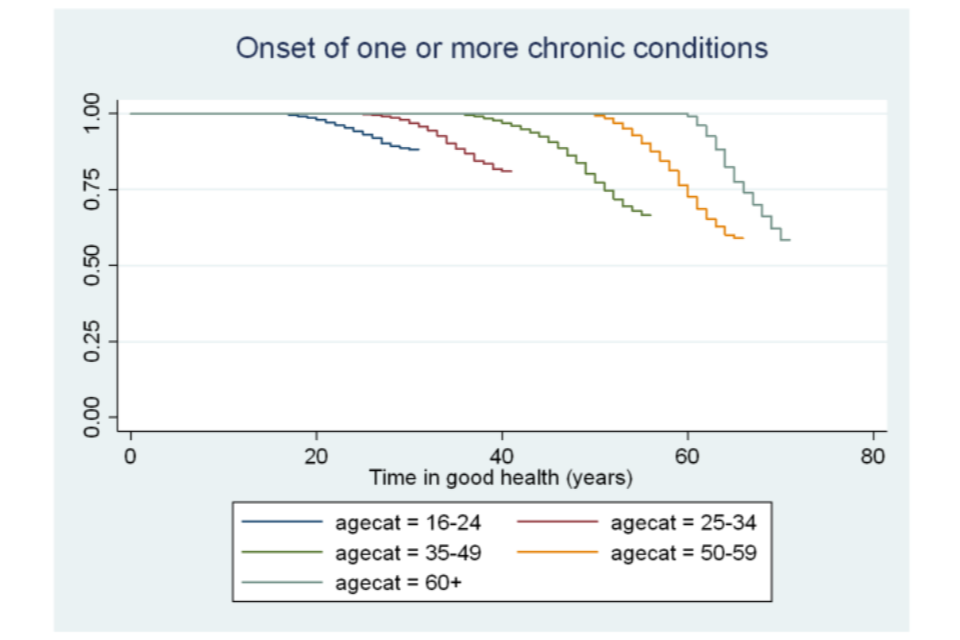
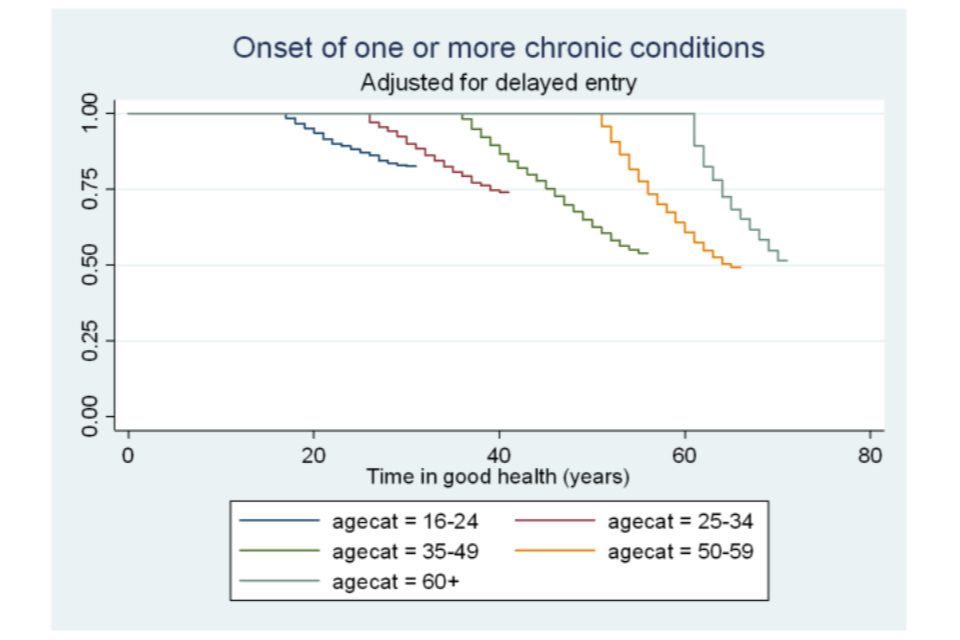
Figure A6.19 Survivor functions for time in good health, by ethnic group
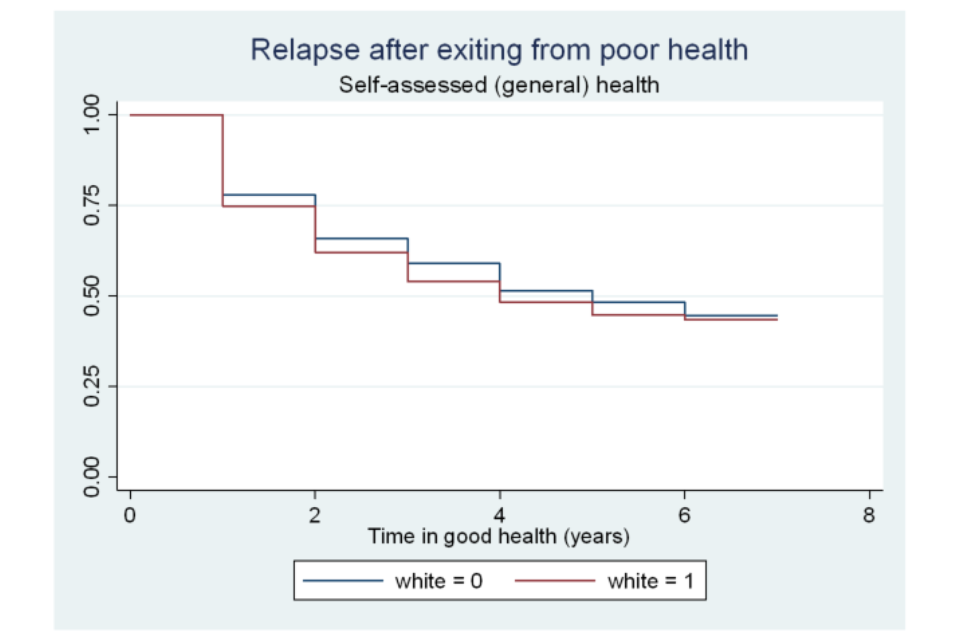
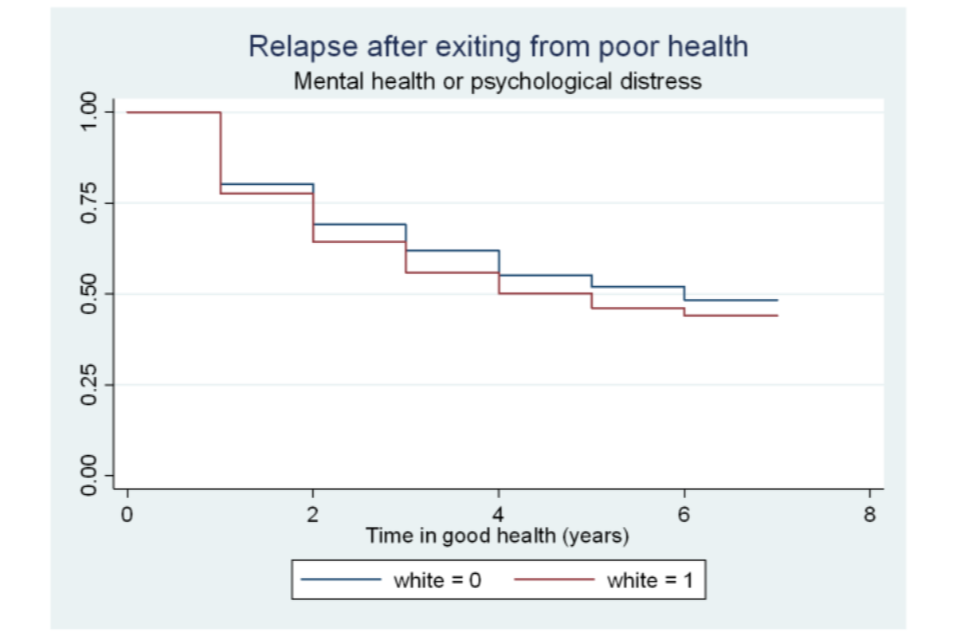
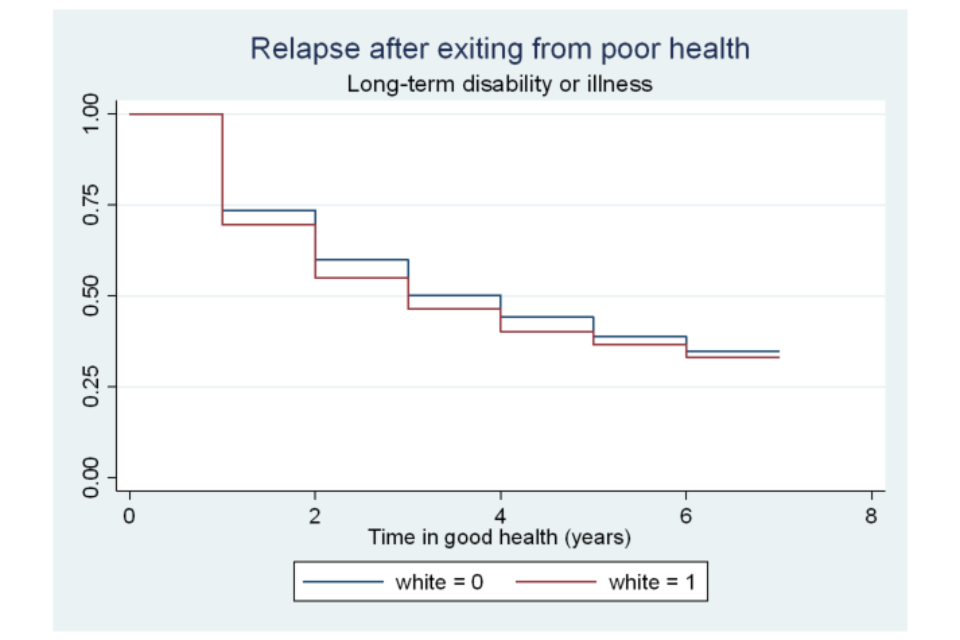
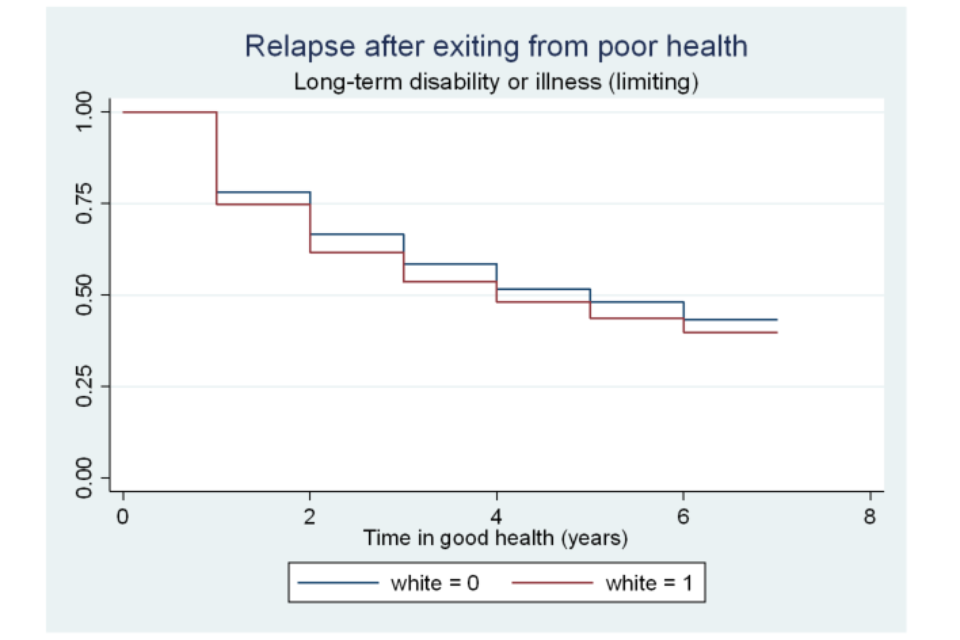
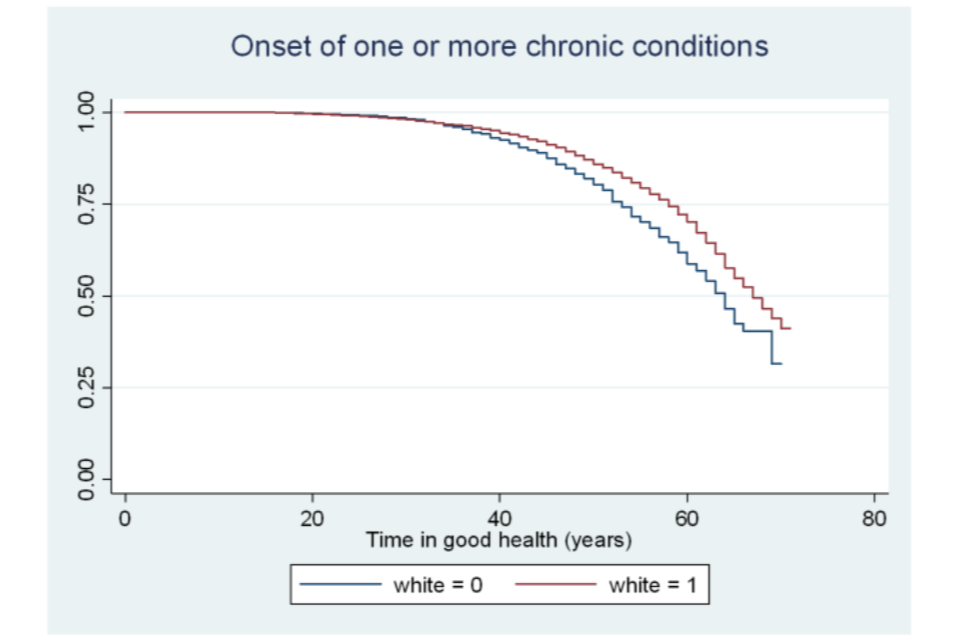
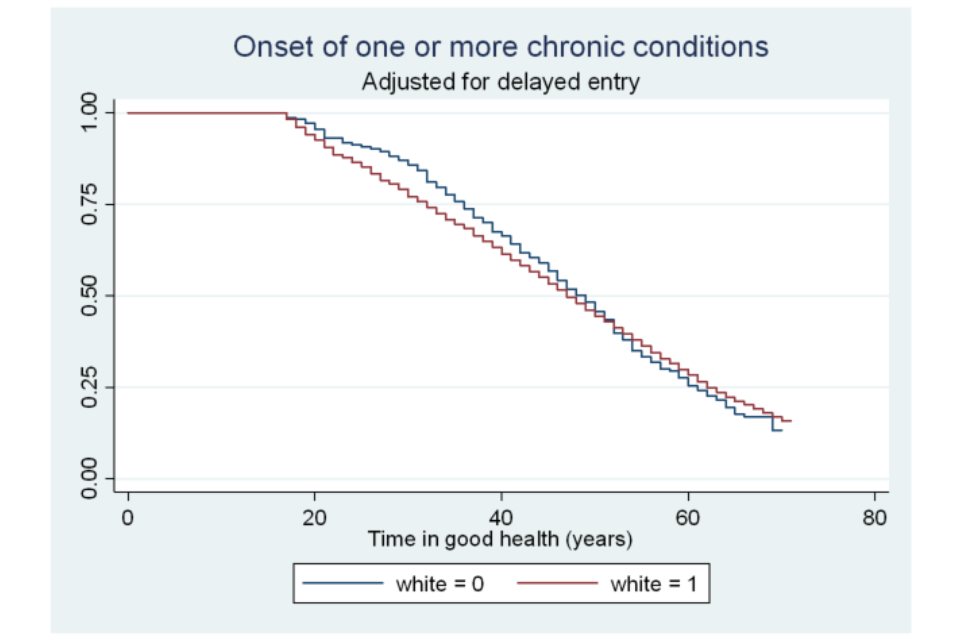
Figure A6.20 Survivor functions for time in good health, by highest educational qualification
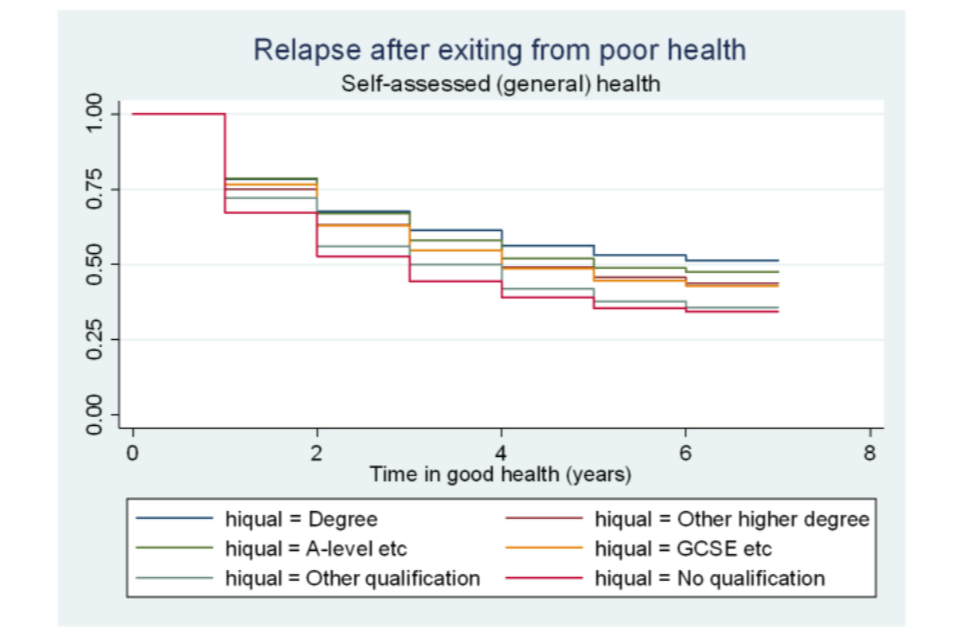
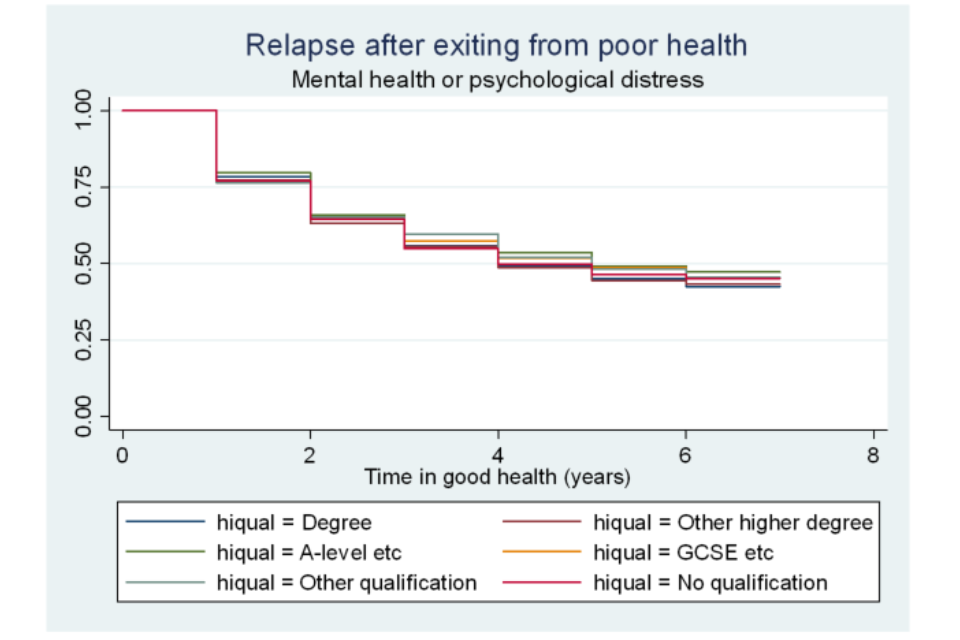
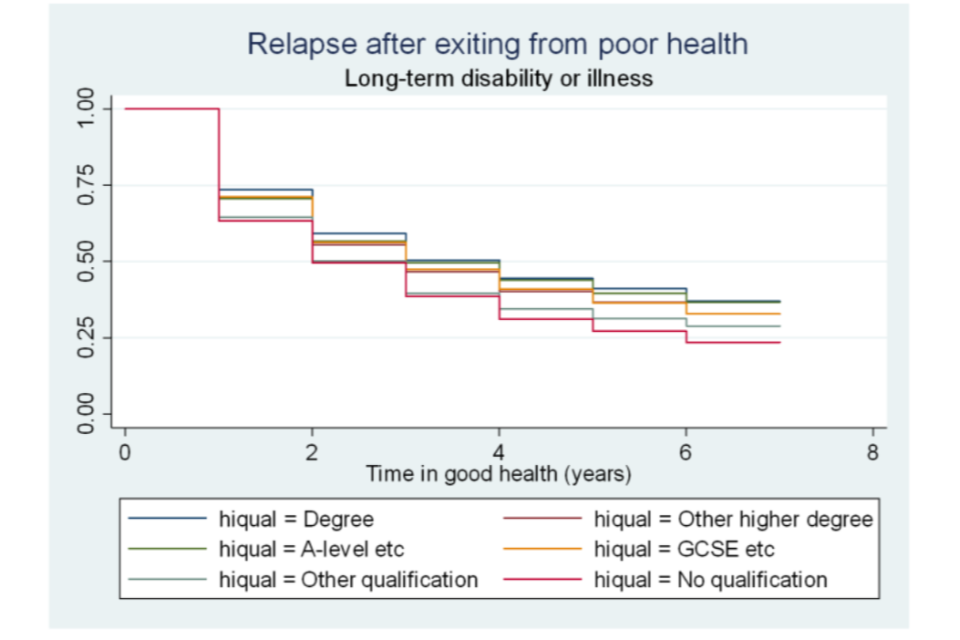
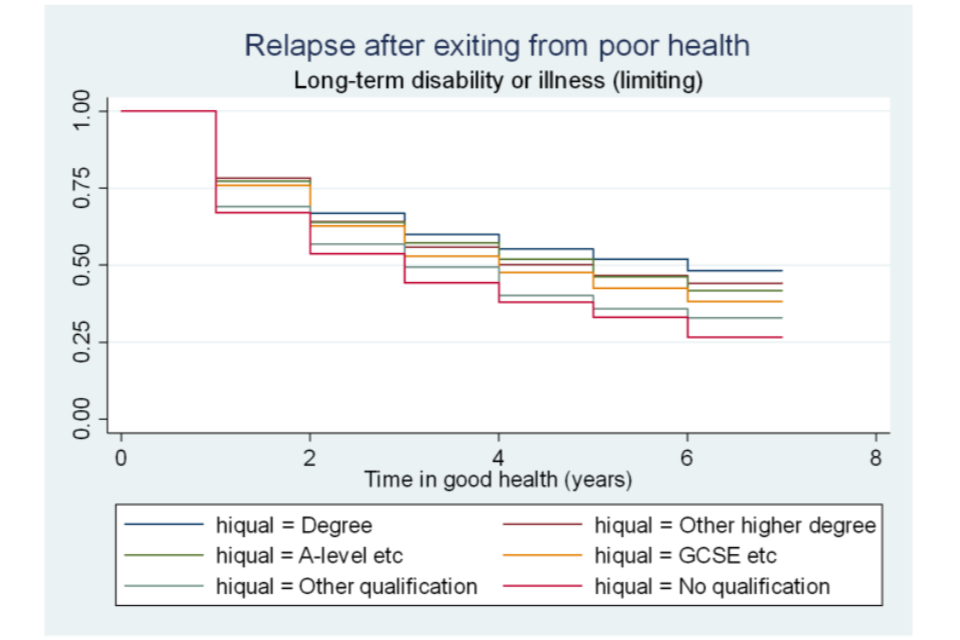
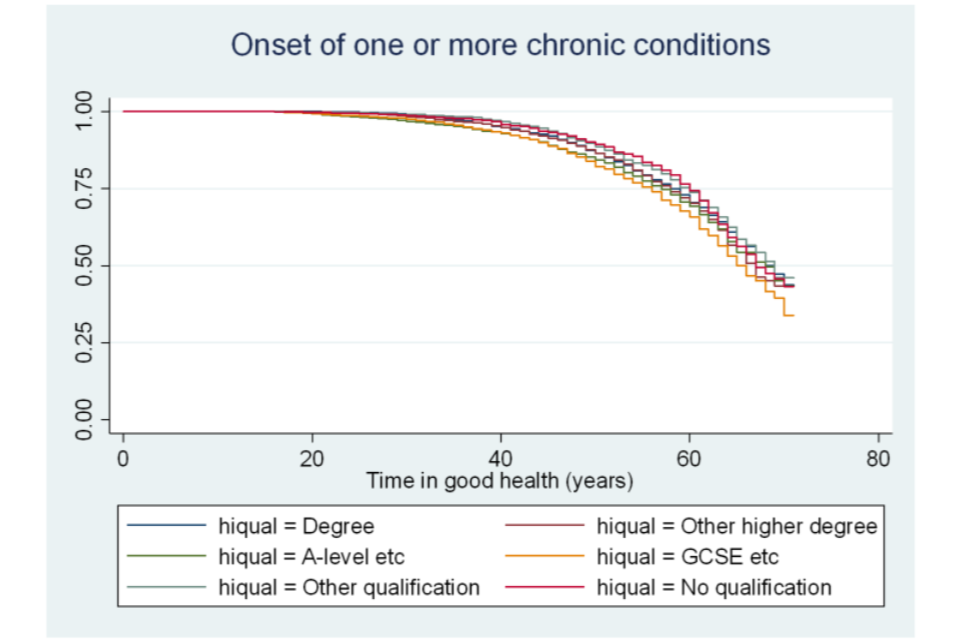
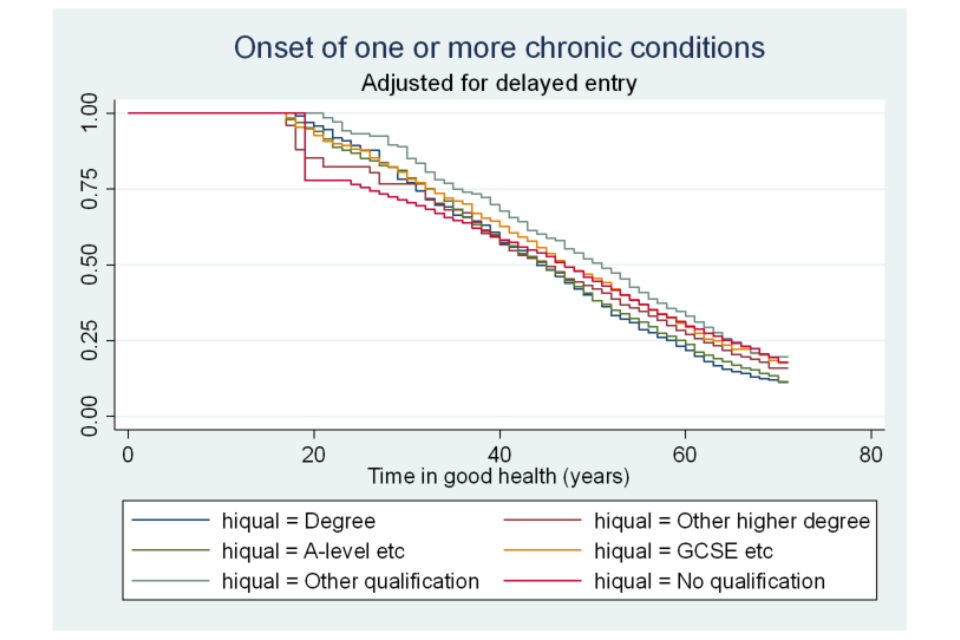
Figure A6.21 Survivor functions for time in good health, by employment status
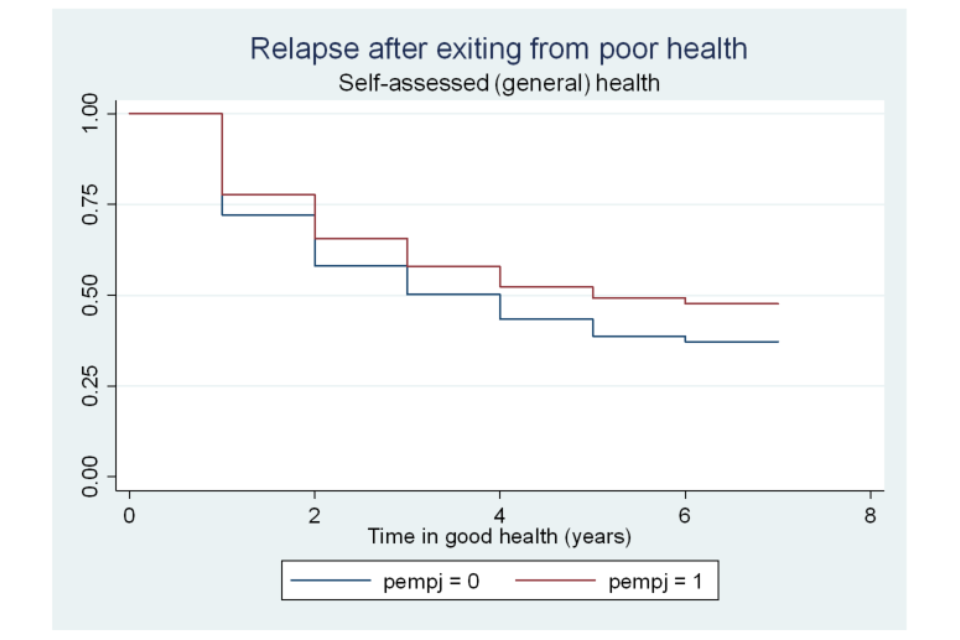
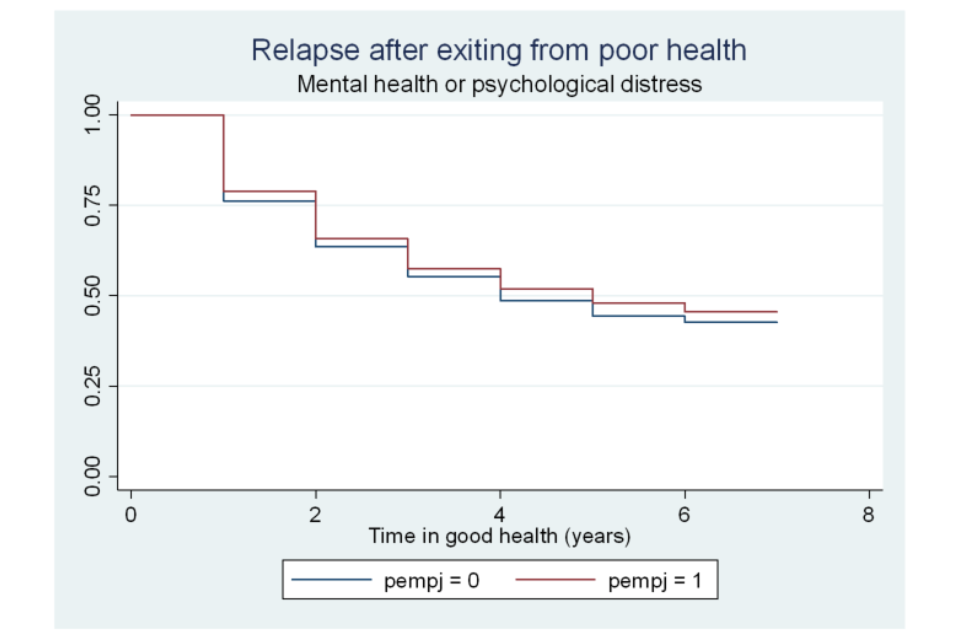
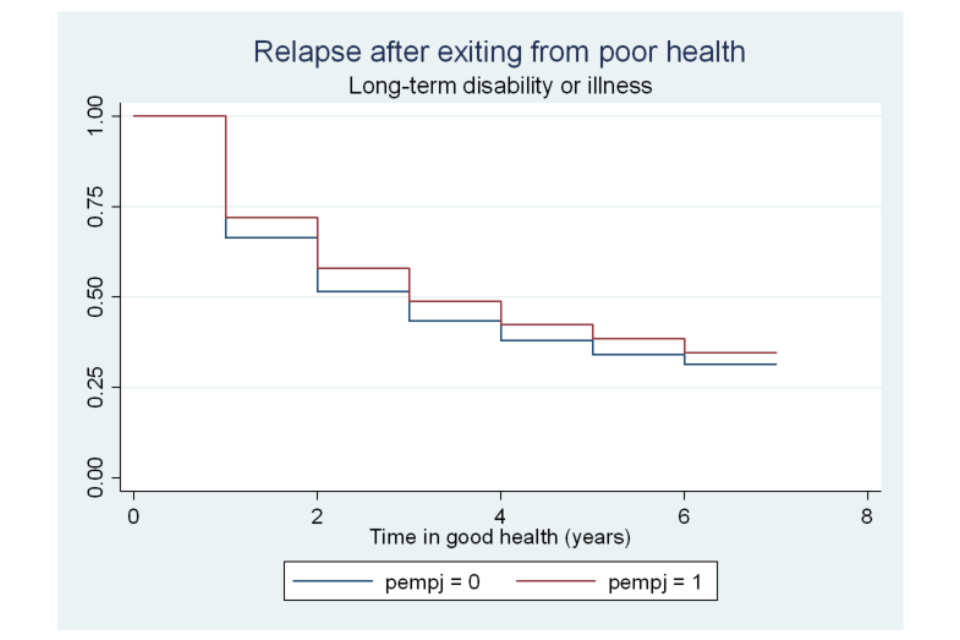
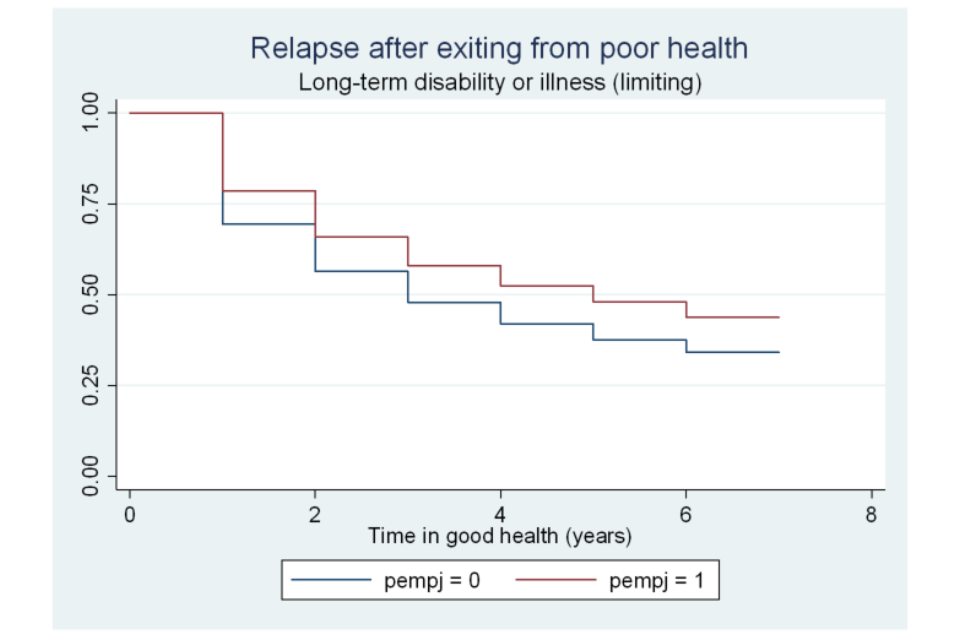
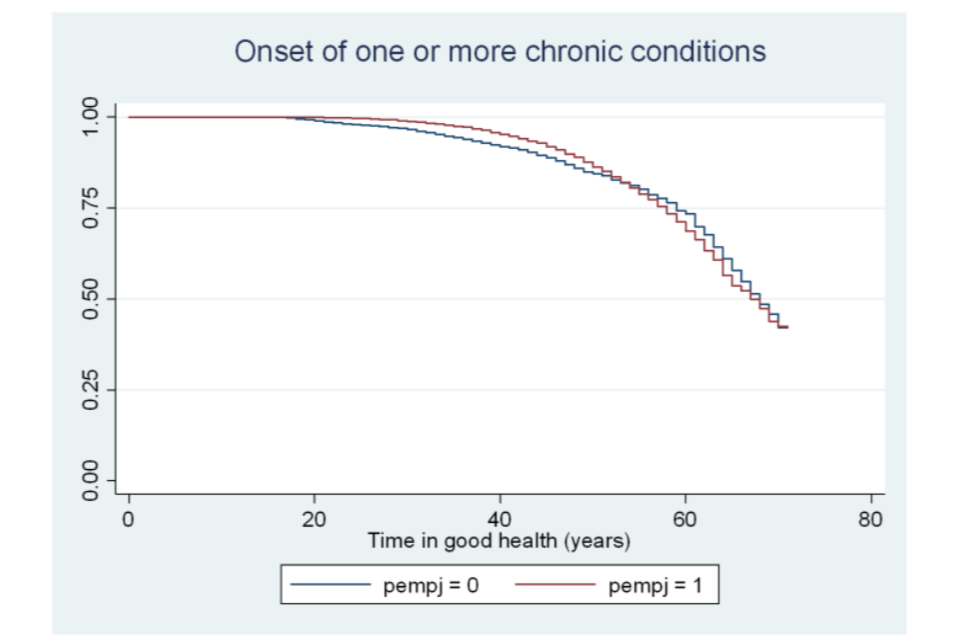

Figure A6.22 Survivor functions for time in good health, by activity status
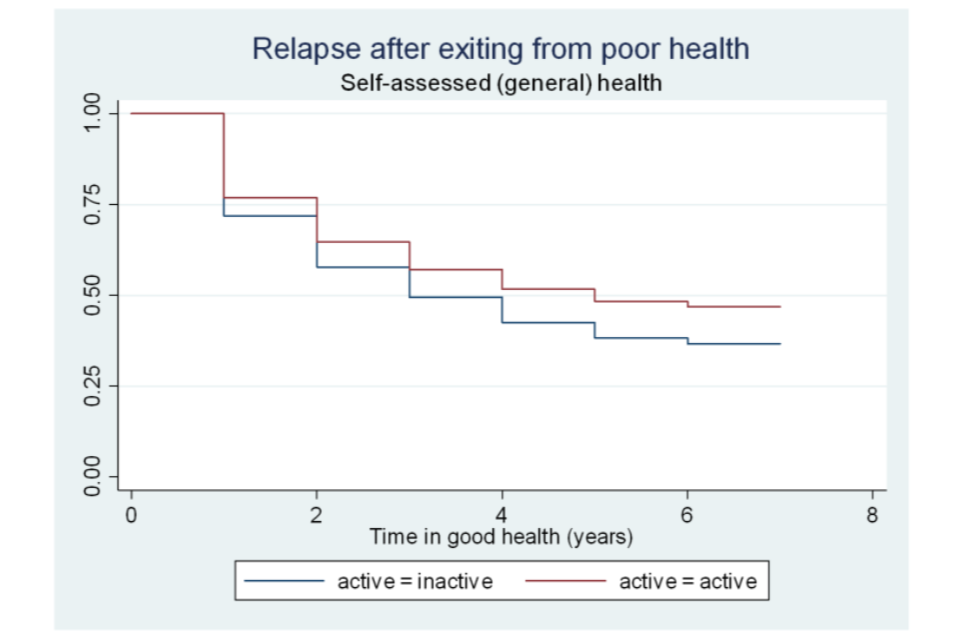
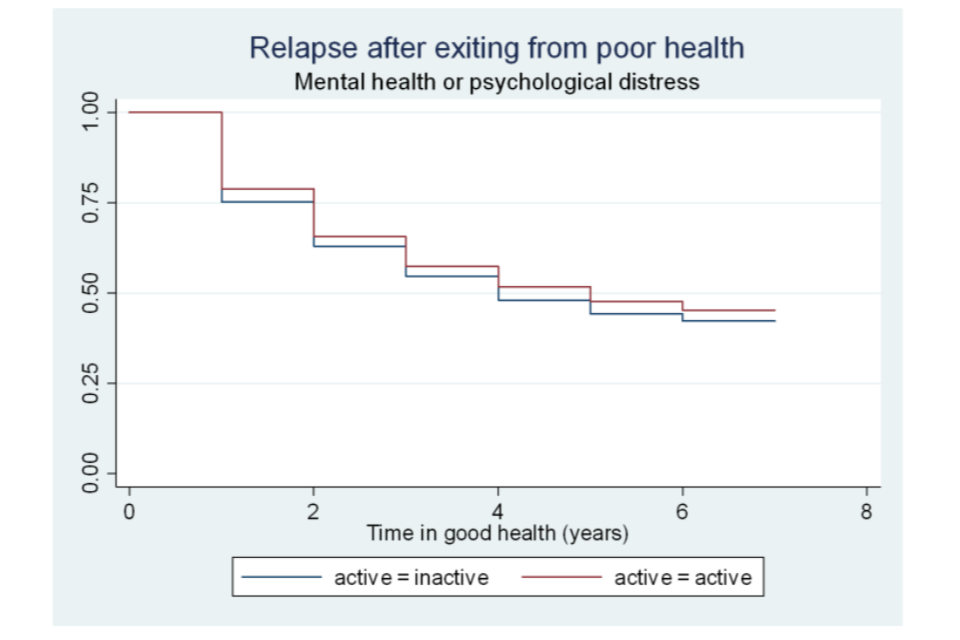
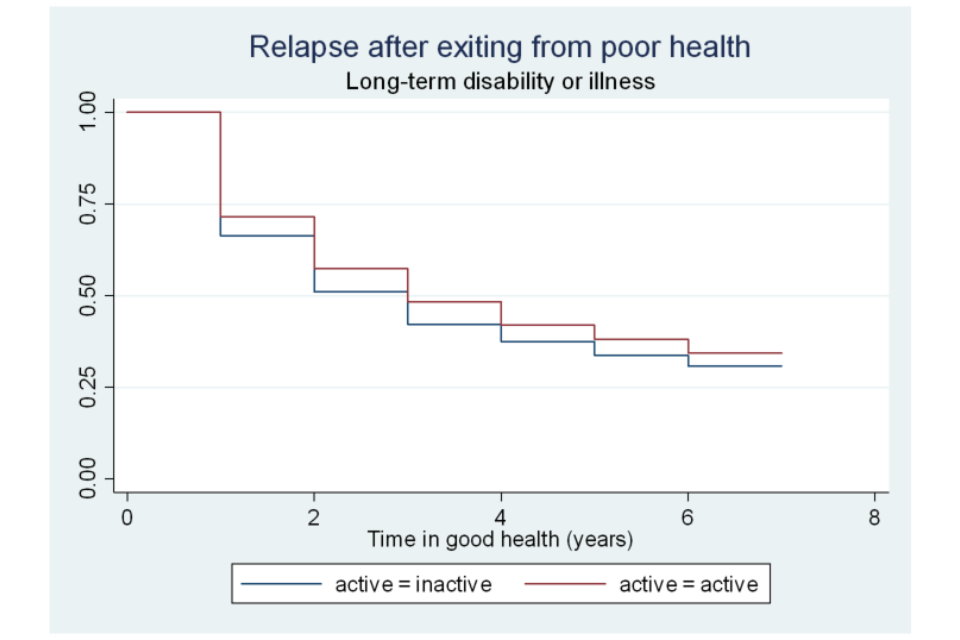
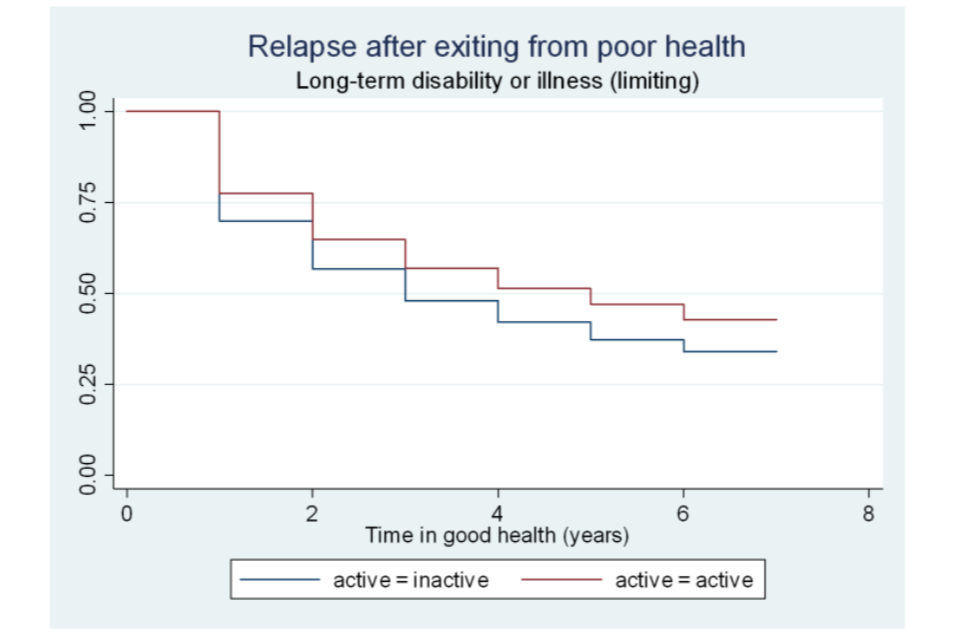
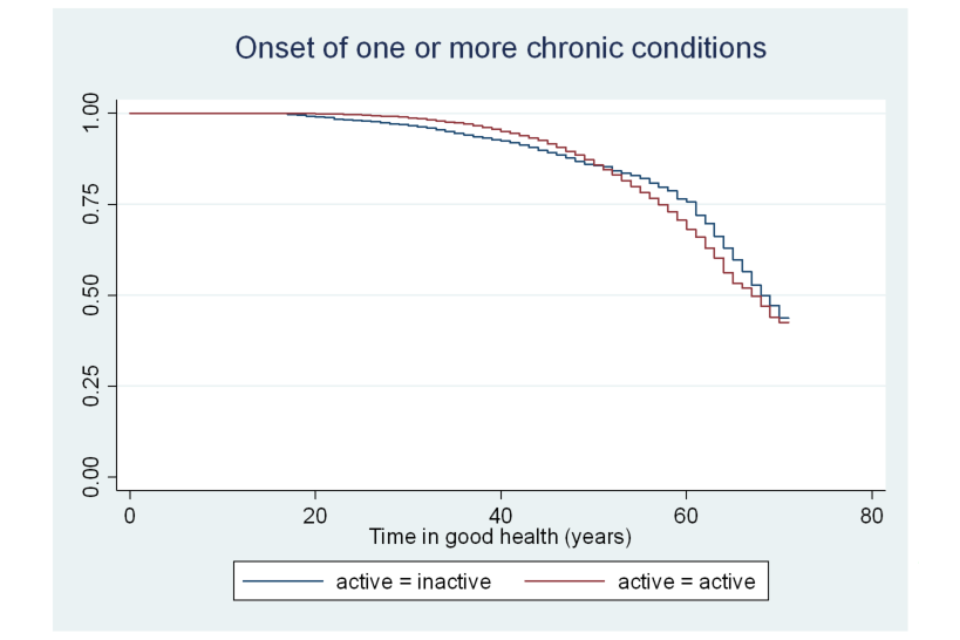
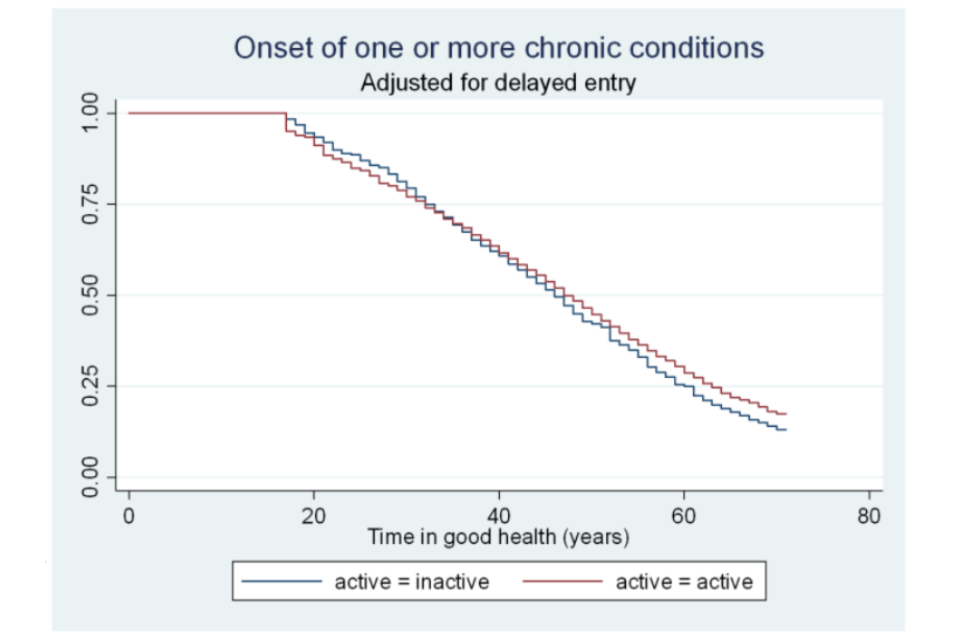
Figure A6.23 Survivor functions for time in good health, by marital status
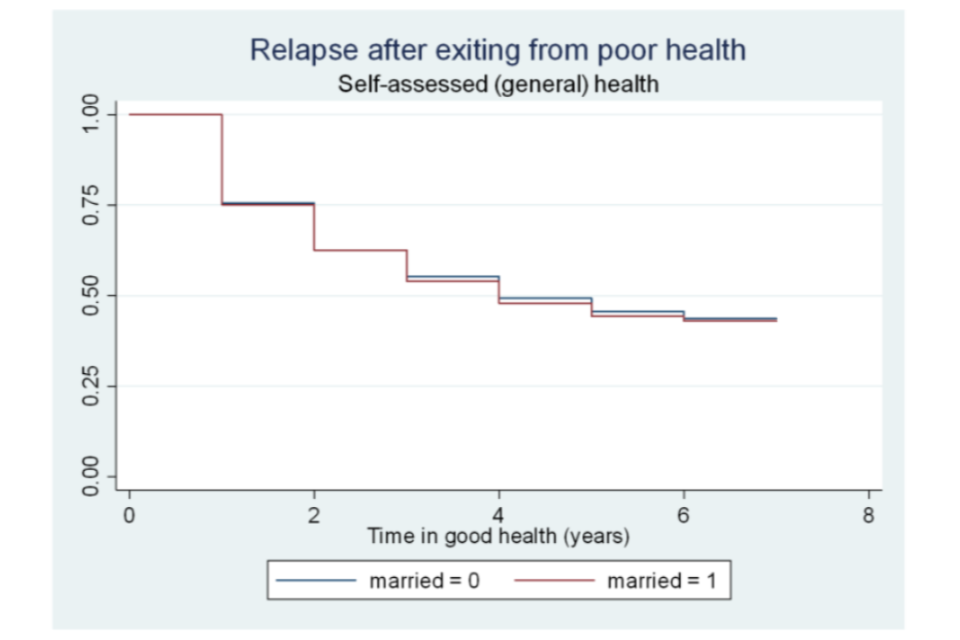
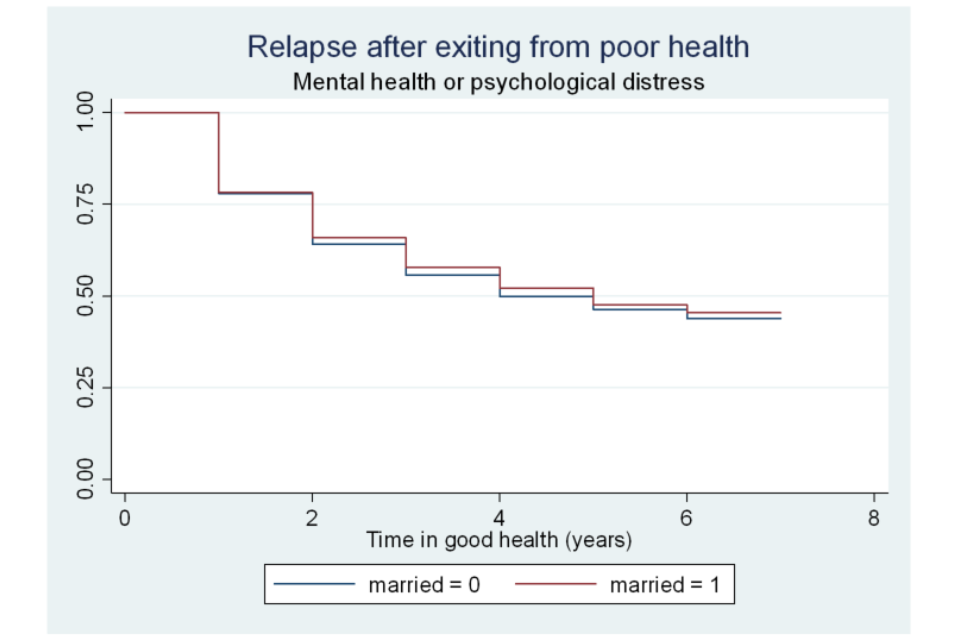
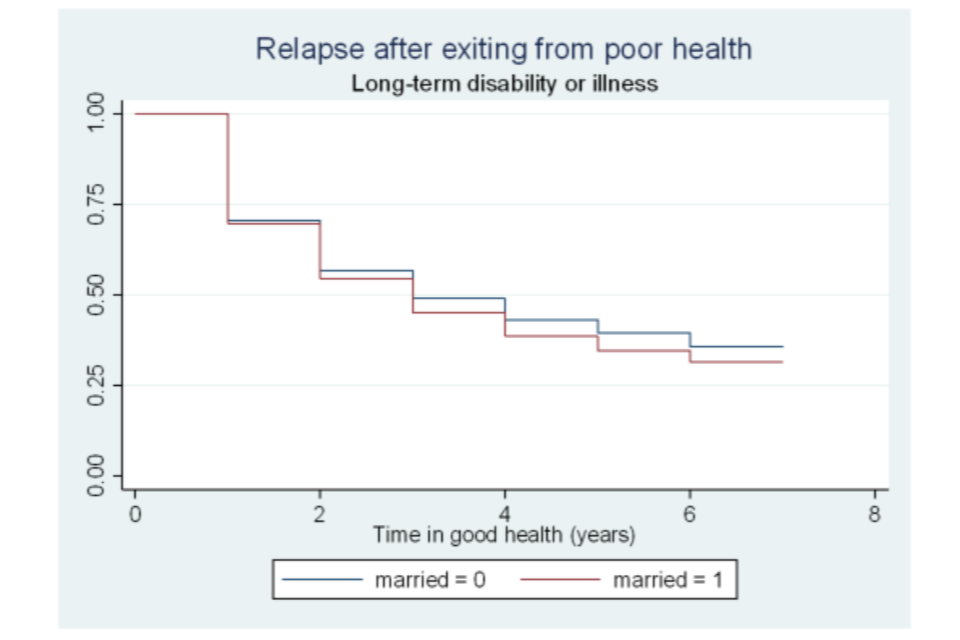
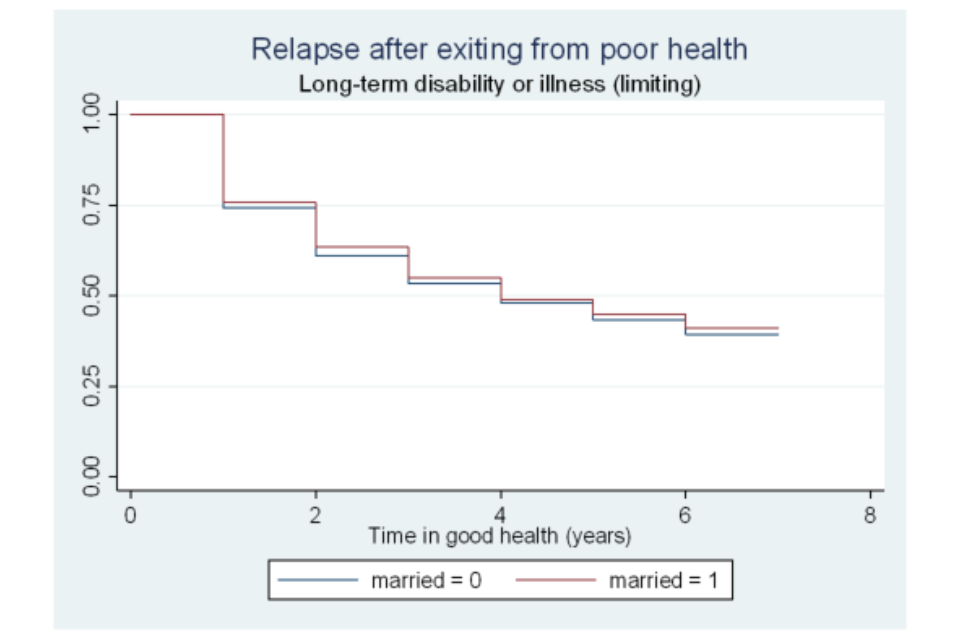
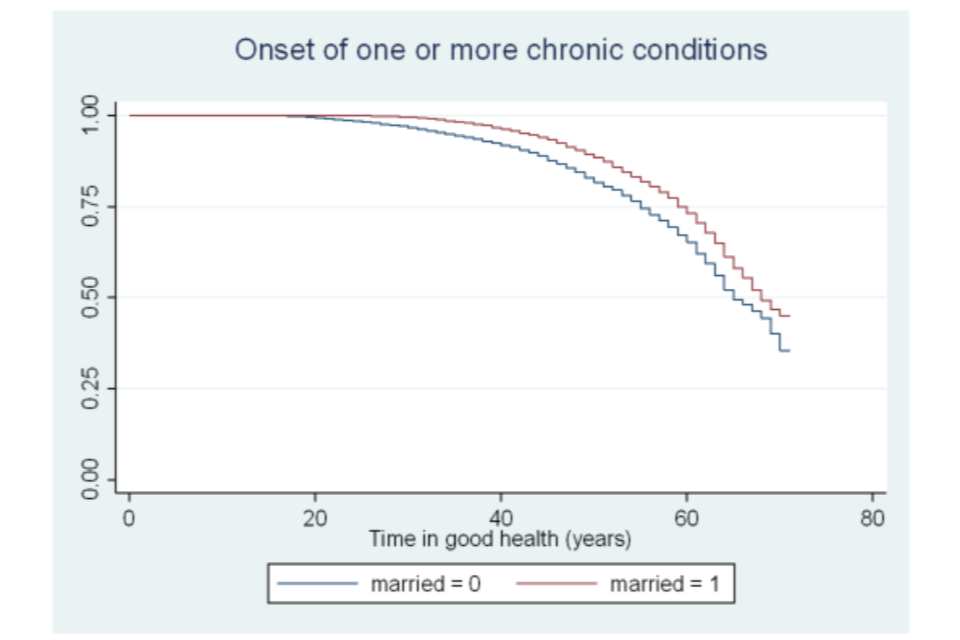
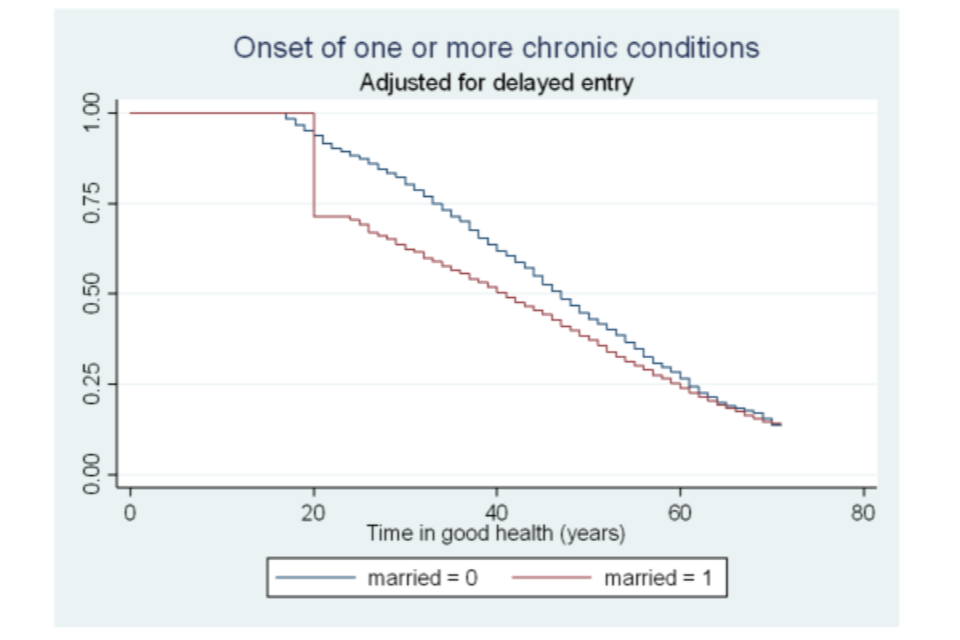
Figure A6.24 Survivor functions for time in good health, by whether has children
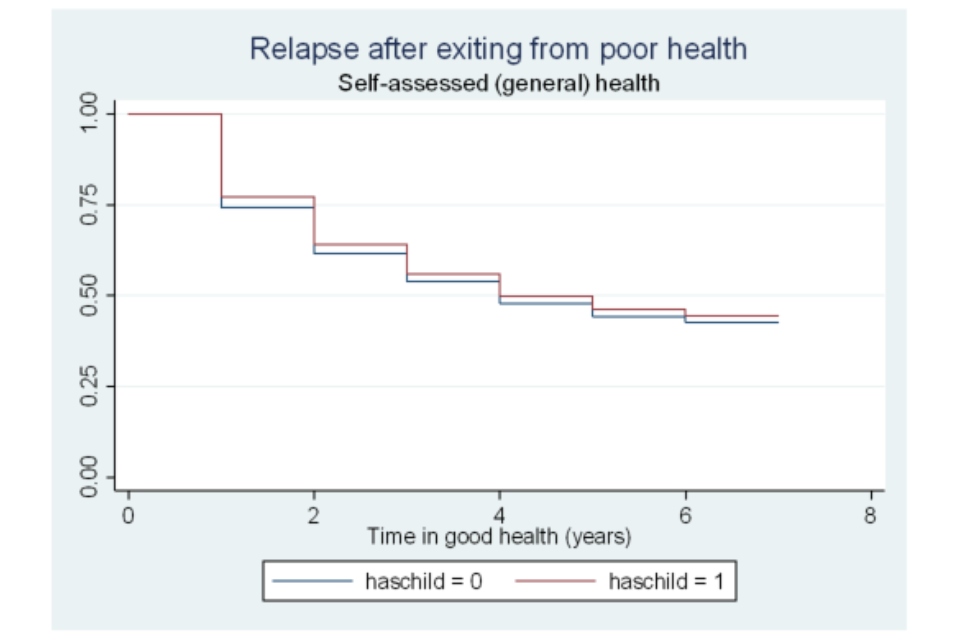
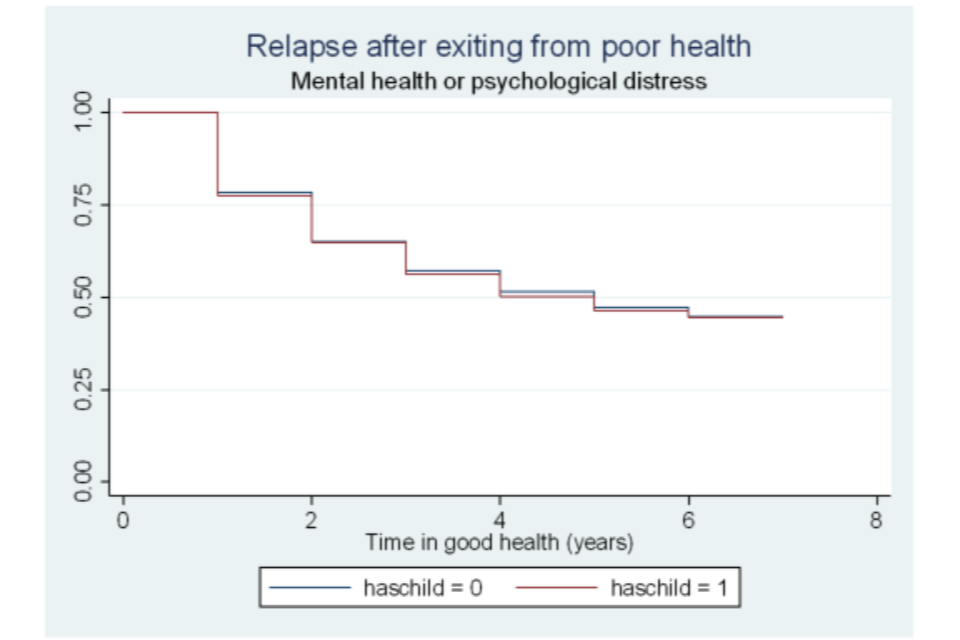
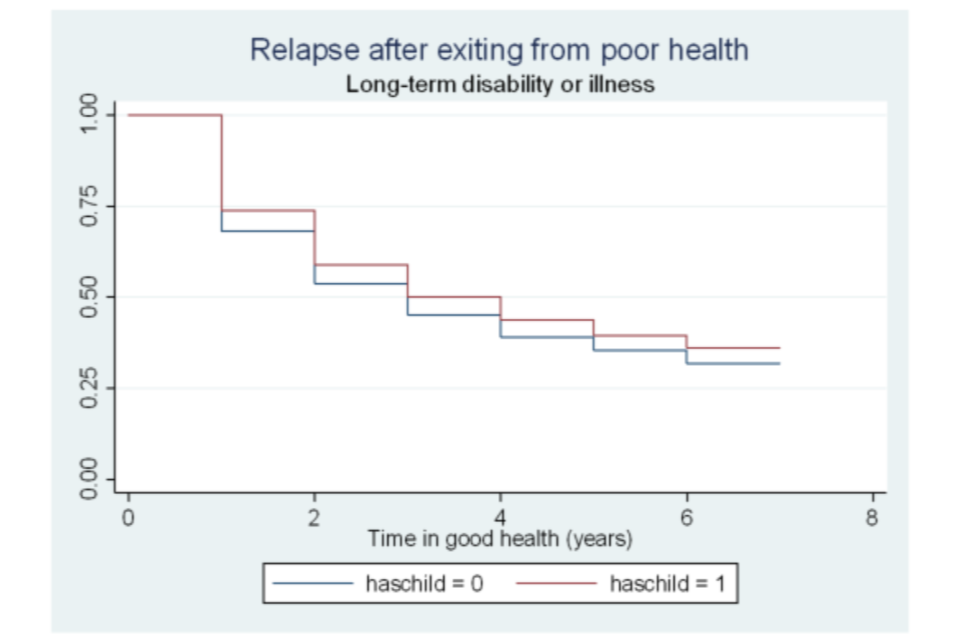
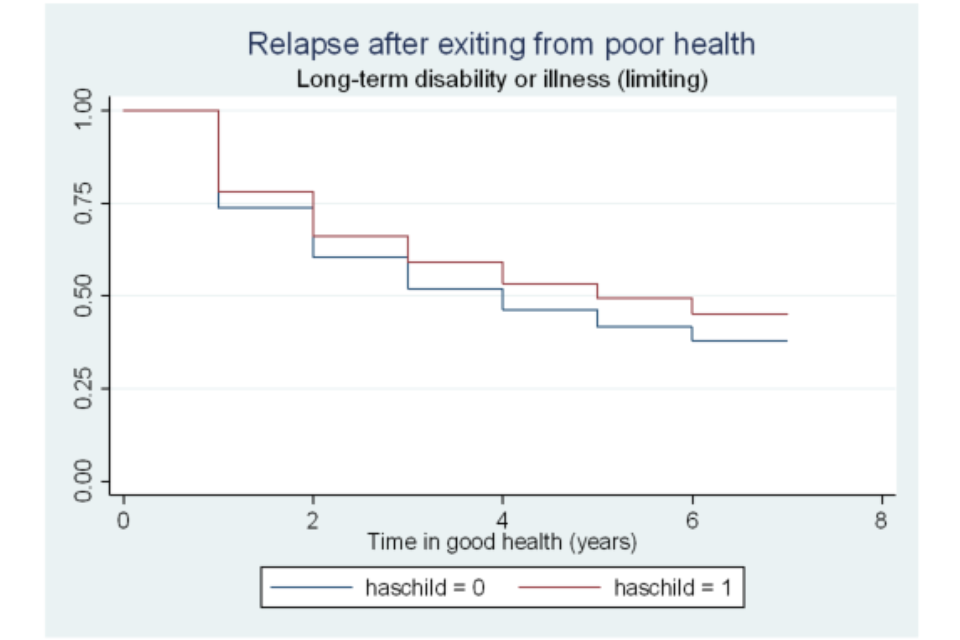
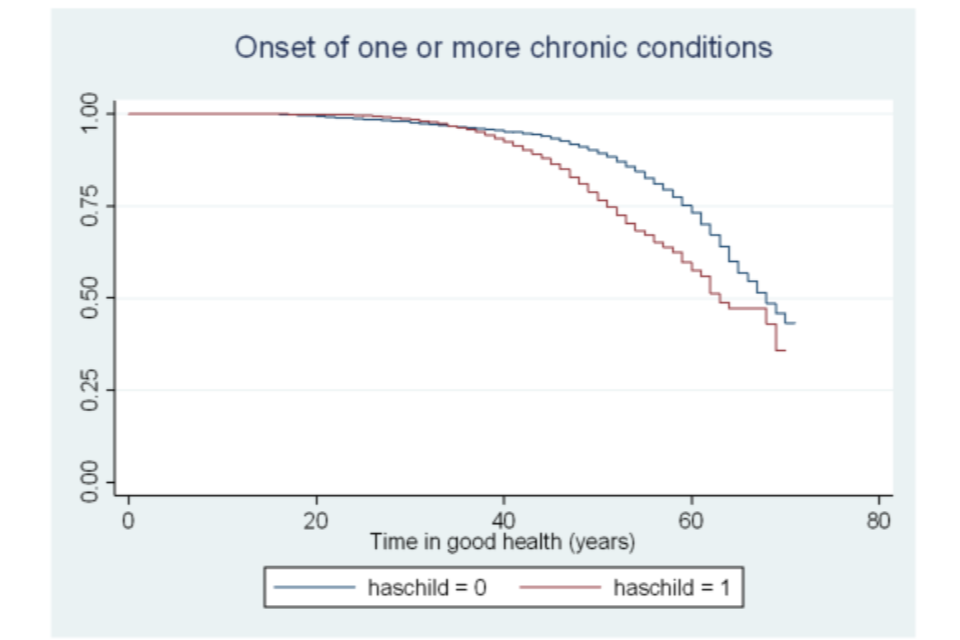
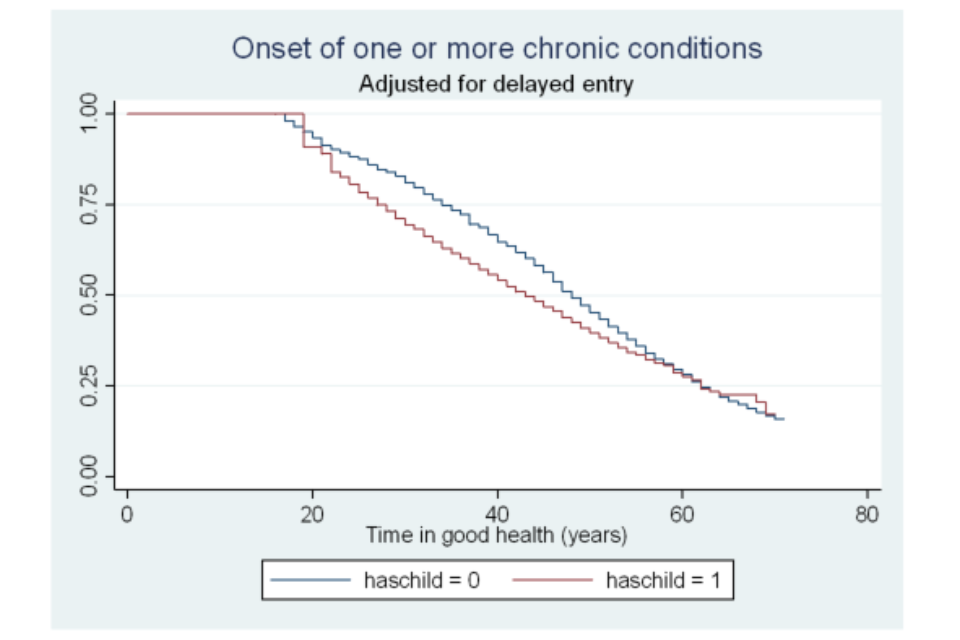
Figure A6.25 Survivor functions for time in good health, by region
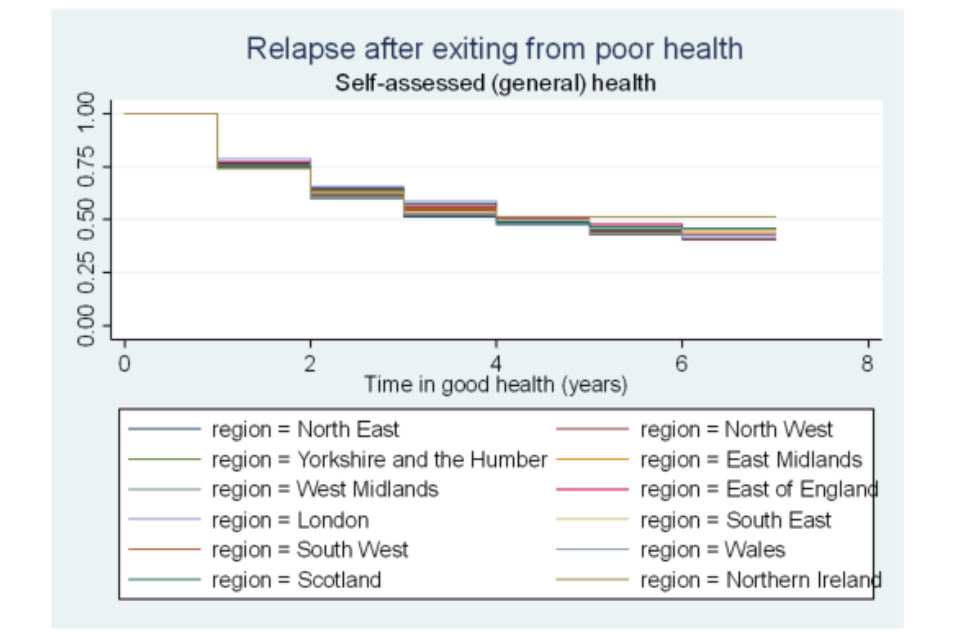
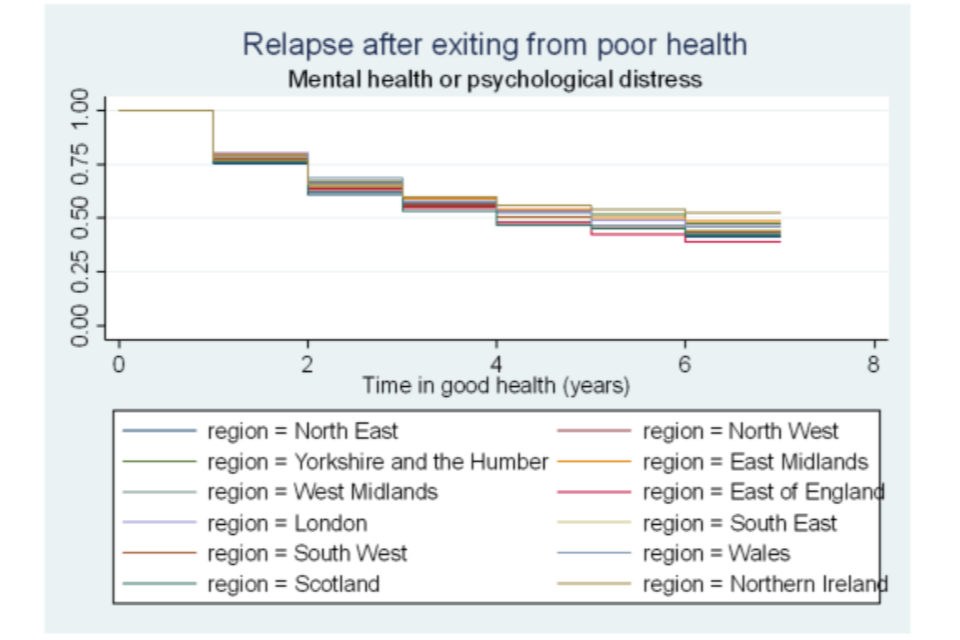
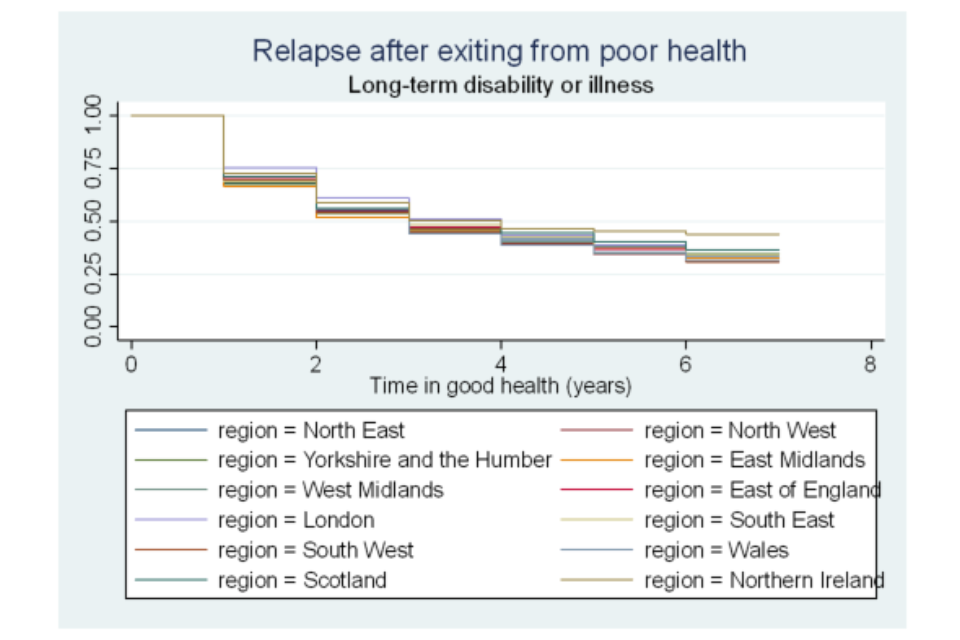
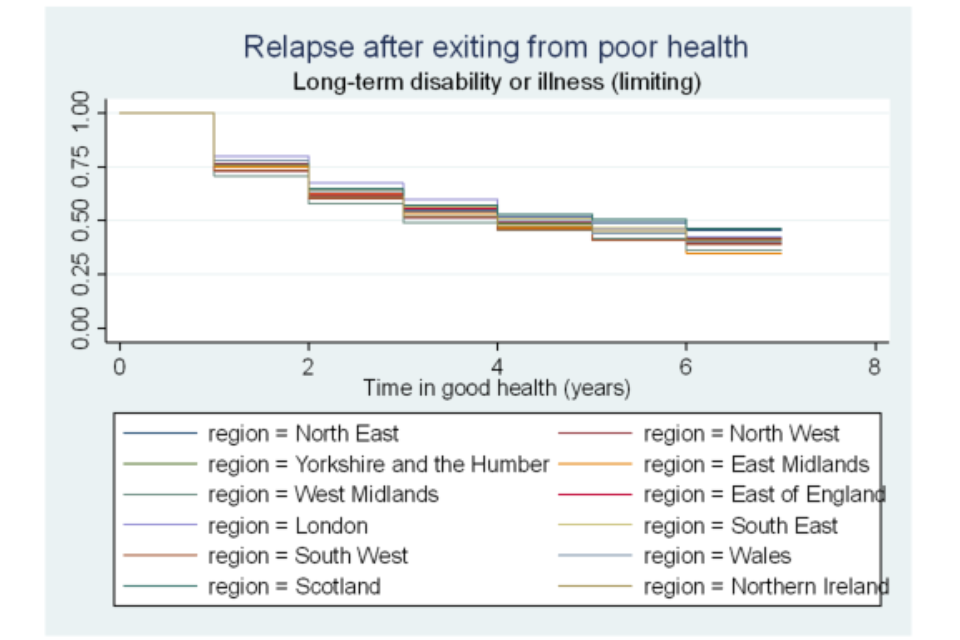
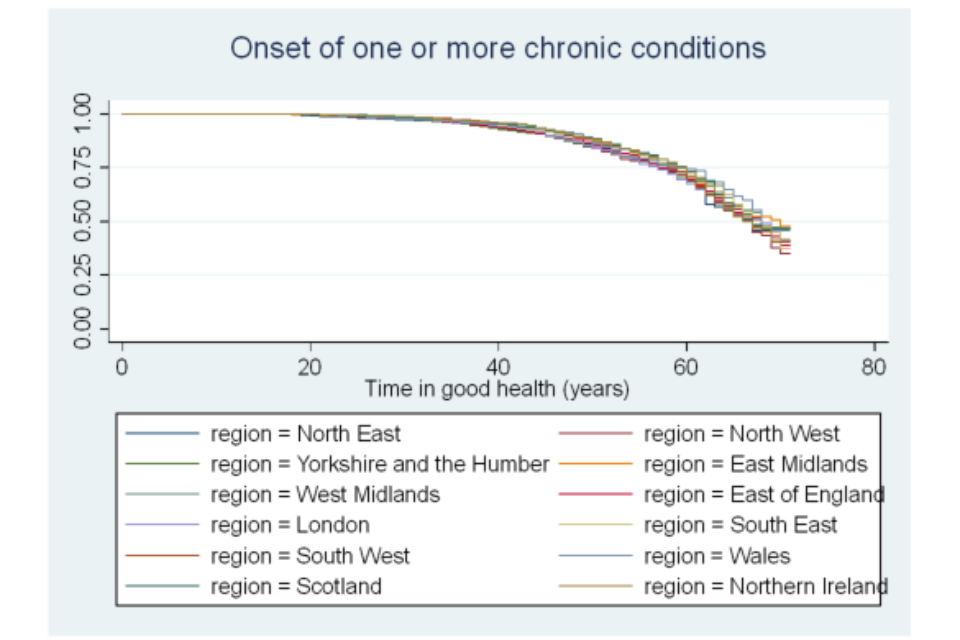

Figure A6.26 Survivor functions for time in good health, by home-ownership status
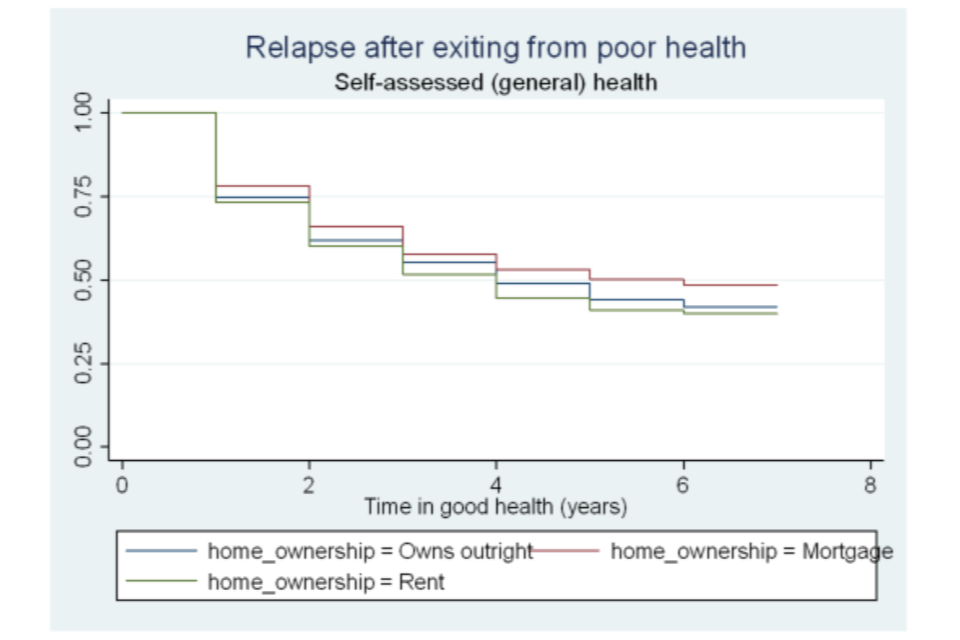
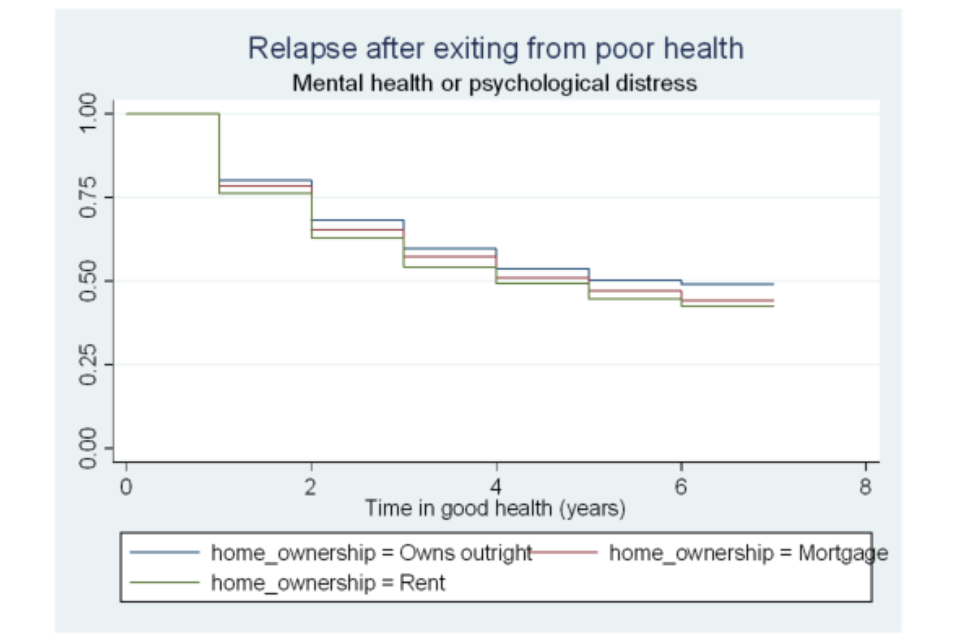
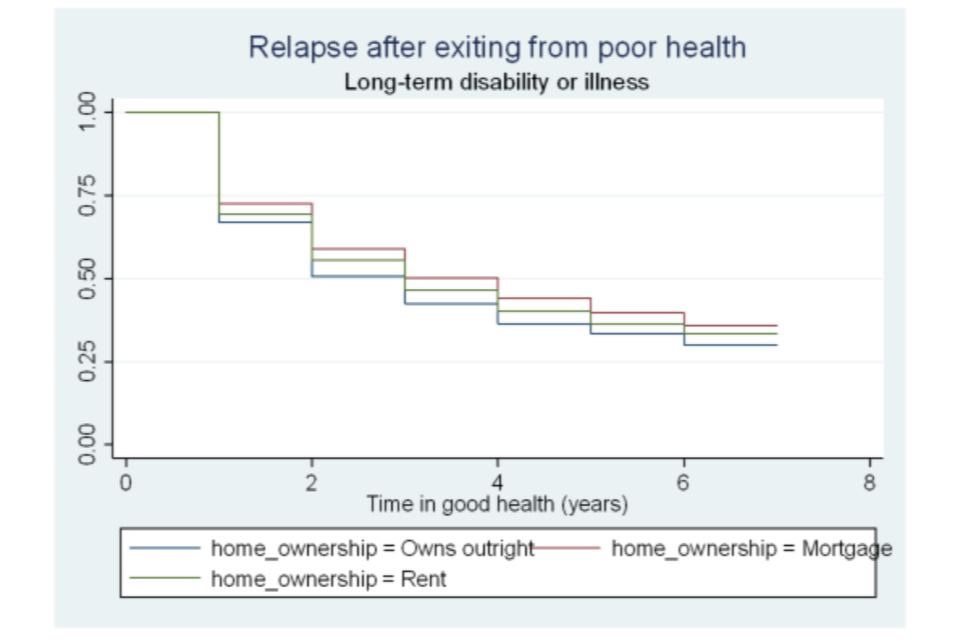
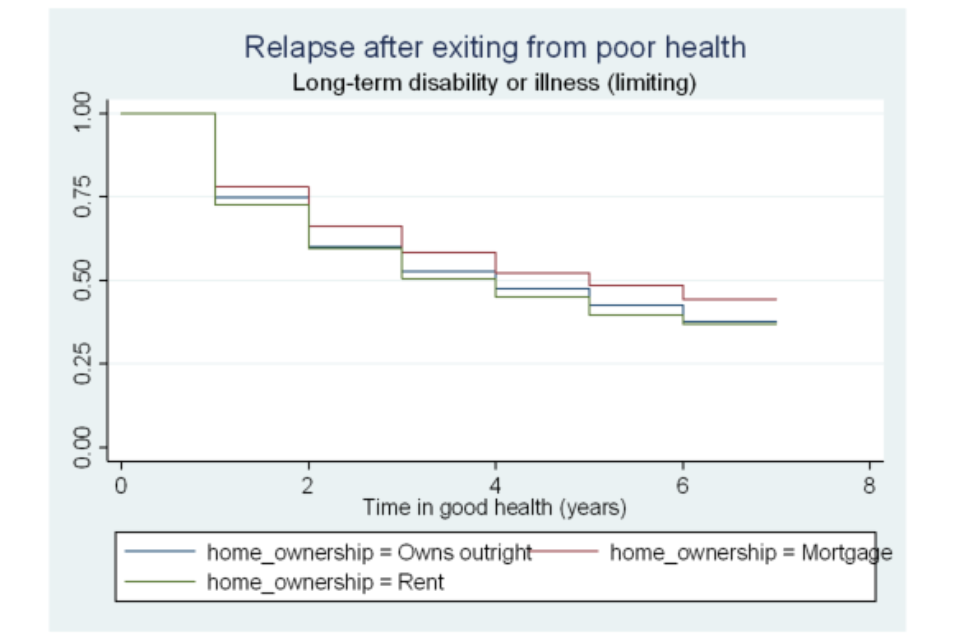
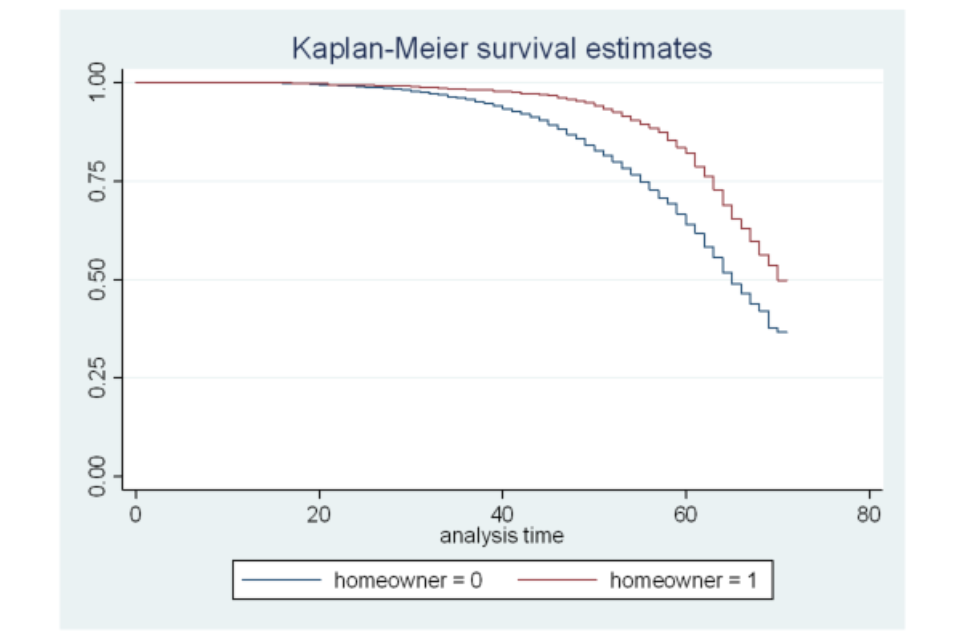
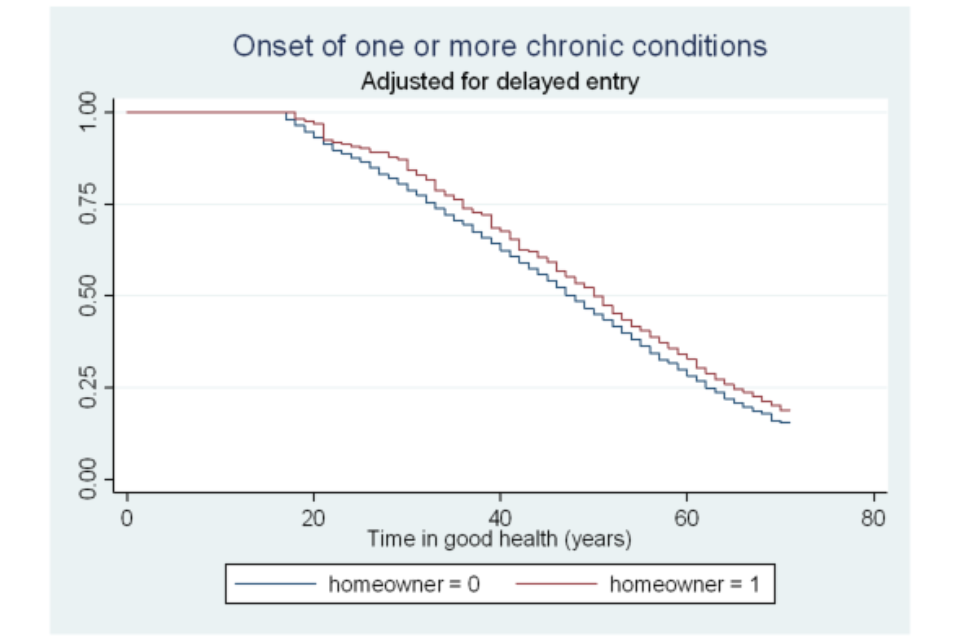
Table A6.27 Testing the equality of survivor functions across groups (relapse time and time to develop a chronic conditions); log-rank tests
| Self-assessed (general) health | Mental health or psychological distress | Self-assessed long-standing illness or disability | Self-assessed long-standing illness or disability (limiting) | One or more chronic conditions | |
|---|---|---|---|---|---|
| Gender | 1.22 | 34.57*** | 0.7 | 1.58 | 18.69*** |
| Age categories | 197.20*** | 23.55*** | 306.13*** | 169.54*** | 56.24*** |
| Married status | 0.45 | 3.03 | 11.13*** | 2.85 | 8.01*** |
| Highest qualifications | 105.54*** | 7.38 | 80.62*** | 105.40*** | 47.79*** |
| White ethnicity (%) | 8.91*** | 17.77*** | 12.39*** | 9.65*** | 1.29 |
| Any children aged under 16 | 6.22** | 0.78 | 34.02*** | 35.21*** | 0.58 |
| Home ownership | 37.98*** | 21.81*** | 48.57*** | 41.30*** | 28.56*** |
| Employed | 63.81*** | 11.51*** | 37.74*** | 98.74*** | 17.49*** |
| Active | 52.02*** | 14.98*** | 32.37*** | 67.37*** | 7.65*** |
| Regions | 8.32 | 21.30** | 29.90*** | 26.24*** | 13.30 |
Chi square statistics (*** and ** denote statistical significance at the 1 and 5% level, respectively); individual characteristics are observed at the start of the spell (at Wave 1 interview for those who experience the onset of chronic conditions).
Table A6.28 Estimating the discrete-time hazard of recovering from poor health (treating time-variant variables as time-invariant)
| Self-assessed (general) health | Mental health or psychological distress | Long-term disability or illness | Long-term disability or illness (limiting) | |||||
|---|---|---|---|---|---|---|---|---|
| Age category: Aged 25 to 34 | -0.083 | 0.176 | *** | -0.044 | -0.061 | |||
| Age category: Aged 35 to 49 | -0.203 | *** | 0.148 | *** | -0.105 | ** | -0.101 | |
| Age category: Aged 50 to 59 | -0.257 | *** | 0.172 | *** | -0.211 | *** | -0.227 | *** |
| Age category: Aged 60 to 64 | -0.149 | ** | 0.313 | *** | -0.137 | ** | -0.031 | |
| Male | -0.007 | 0.007 | -0.004 | -0.023 | ||||
| White ethnicity | 0.139 | *** | 0.223 | *** | 0.070 | 0.087 | ** | |
| Highest qualifications: Degree | -0.175 | *** | -0.266 | *** | -0.144 | *** | -0.131 | ** |
| Highest qualifications: Other higher degree | -0.173 | *** | -0.131 | *** | -0.056 | -0.104 | ||
| Highest qualifications: A-level | -0.057 | -0.114 | *** | -0.055 | -0.071 | |||
| Highest qualifications: GCSE | -0.129 | *** | -0.071 | ** | -0.097 | *** | -0.082 | |
| Highest qualifications: Other qualification | -0.077 | 0.001 | -0.076 | -0.027 | ||||
| Employed | 0.270 | *** | 0.160 | *** | 0.206 | *** | 0.273 | *** |
| Married | 0.045 | 0.038 | 0.079 | *** | 0.101 | *** | ||
| Has children aged under 16 | 0.116 | *** | 0.055 | ** | 0.090 | *** | 0.123 | *** |
| Home-ownership status: Homeowner | 0.146 | *** | 0.145 | *** | 0.208 | *** | 0.185 | *** |
| Home-ownership status: Mortgage | 0.104 | *** | 0.183 | *** | 0.153 | *** | 0.166 | *** |
| North East | -0.135 | 0.000 | -0.102 | 0.056 | ||||
| North West | -0.050 | -0.036 | -0.179 | *** | -0.008 | |||
| Yorkshire and the Humber | 0.031 | 0.053 | -0.077 | -0.022 | ||||
| East Midlands | -0.067 | 0.062 | -0.094 | 0.095 | ||||
| West Midlands | 0.003 | 0.035 | -0.169 | *** | -0.023 | |||
| East of England | 0.020 | 0.032 | -0.078 | 0.032 | ||||
| South East | -0.020 | 0.033 | -0.049 | 0.059 | ||||
| South West | -0.054 | 0.082 | -0.094 | 0.087 | ||||
| Wales | -0.129 | -0.021 | -0.209 | *** | 0.034 | |||
| Scotland | 0.010 | -0.036 | -0.065 | 0.036 | ||||
| Northern Ireland | -0.044 | -0.070 | -0.065 | -0.013 | ||||
| Log (survival time) | -0.958 | *** | -0.572 | *** | -0.799 | *** | -0.801 | *** |
| Constant | -0.626 | *** | -0.994 | *** | -0.866 | *** | -0.896 | *** |
| Number of observations | 15,384 | 20,953 | 23,610 | 15,649 |
*** and ** denote statistical significance at the 1 and 5% level, respectively.
Table A6.29 Estimating the discrete-time hazard of relapsing into poor health and developing one or more chronic conditions (treating time-variant variables as time-invariant)
| Self-assessed (general) health | Mental health or psychological distress | Long-term disability or illness | Long-term disability or illness (limiting) | Chronic conditions | ||||||
|---|---|---|---|---|---|---|---|---|---|---|
| Age category: Aged 25 to 34 | 0.382 | *** | 0.225 | *** | 0.261 | *** | 0.373 | *** | - | - |
| Age category: Aged 35 to 49 | 0.687 | *** | 0.263 | *** | 0.509 | *** | 0.570 | *** | - | - |
| Age category: Aged 50 to 59 | 0.839 | *** | 0.209 | *** | 0.714 | *** | 0.836 | *** | - | - |
| Age category: Aged 60 to 64 | 0.813 | *** | 0.042 | 0.763 | *** | 0.801 | *** | - | - | |
| Male | -0.002 | -0.152 | *** | -0.008 | -0.017 | -0.138 | *** | |||
| White ethnicity | 0.104 | ** | 0.187 | *** | 0.074 | 0.123 | ** | -0.011 | ||
| Highest qualifications: Degree | 0.238 | *** | -0.071 | 0.178 | *** | 0.265 | *** | 0.401 | *** | |
| Highest qualifications: Other higher degree | 0.186 | *** | -0.063 | 0.138 | *** | 0.217 | *** | 0.271 | *** | |
| Highest qualifications: A-level | 0.141 | *** | -0.058 | 0.072 | 0.122 | ** | 0.305 | *** | ||
| Highest qualifications: GCSE | 0.087 | -0.055 | 0.102 | *** | 0.103 | ** | 0.195 | *** | ||
| Highest qualifications: Other qualification | 0.152 | ** | 0.005 | 0.082 | 0.051 | 0.190 | *** | |||
| Employed | -0.280 | *** | -0.160 | *** | -0.167 | *** | -0.294 | *** | -0.134 | *** |
| Married | -0.063 | -0.043 | -0.022 | -0.126 | *** | -0.068 | ||||
| Has children aged under 16 | -0.035 | -0.050 | -0.073 | ** | -0.077 | -0.059 | ||||
| Home-ownership status: Homeowner | -0.225 | *** | -0.181 | *** | -0.130 | *** | -0.238 | *** | -0.235 | *** |
| Home-ownership status: Mortgage | -0.170 | *** | -0.087 | *** | -0.131 | *** | -0.158 | *** | -0.205 | *** |
| North East | 0.013 | 0.097 | 0.084 | 0.028 | 0.125 | |||||
| North West | 0.099 | 0.031 | 0.141 | ** | 0.149 | ** | 0.147 | |||
| Yorkshire and the Humber | 0.020 | -0.018 | 0.153 | ** | 0.121 | 0.090 | ||||
| East Midlands | 0.073 | -0.048 | 0.148 | ** | 0.102 | -0.061 | ||||
| West Midlands | 0.102 | 0.079 | 0.142 | ** | 0.233 | *** | -0.008 | |||
| East of England | -0.063 | 0.097 | 0.094 | 0.085 | 0.161 | ** | ||||
| South East | 0.070 | 0.031 | 0.087 | 0.082 | 0.009 | |||||
| South West | 0.073 | 0.034 | 0.103 | 0.171 | ** | 0.057 | ||||
| Wales | 0.073 | -0.033 | 0.068 | 0.025 | -0.068 | |||||
| Scotland | -0.020 | 0.088 | 0.011 | -0.047 | 0.007 | |||||
| Northern Ireland | -0.015 | -0.088 | -0.079 | 0.092 | -0.121 | |||||
| Log (survival time) | -0.732 | *** | -0.627 | *** | -0.703 | *** | -0.665 | *** | 1.363 | *** |
| Constant | -1.769 | *** | -1.419 | *** | -1.509 | *** | -1.746 | *** | -8.358 | *** |
| Number of observations | 20,299 | 32,021 | 27,006 | 21,086 | 90,762 |
*** and ** denote statistical significance at the 1 and 5% level, respectively.
Table A6.30 Estimating the discrete-time hazard of recovering after onset of poor health (exponentiated coefficients)
Self-assessed (general) health:
| Exp. Coeff. (time invarying covariates) | Exp. Coeff. (time varying covariates) | |||
|---|---|---|---|---|
| Age category: Aged 25 to 34 | 0.920 | 0.918 | ||
| Age category: Aged 35 to 49 | 0.816 | *** | 0.814 | *** |
| Age category: Aged 50 to 59 | 0.773 | *** | 0.777 | *** |
| Age category: Aged 60 to 64 | 0.861 | ** | 0.870 | ** |
| Male | 0.993 | 0.992 | ||
| White ethnicity | 1.149 | *** | 1.148 | *** |
| Highest qualifications: Degree | 0.839 | *** | 0.849 | *** |
| Highest qualifications: Other higher degree | 0.841 | *** | 0.858 | *** |
| Highest qualifications: A-level | 0.945 | 0.946 | ||
| Highest qualifications: GCSE | 0.879 | *** | 0.881 | *** |
| Highest qualifications: Other qualification | 0.926 | 0.932 | ||
| Employed | 1.310 | *** | 1.354 | *** |
| Married | 1.046 | 1.033 | ||
| Has children aged under 16 | 1.123 | *** | 1.131 | *** |
| Home-ownership status: Homeowner | 1.157 | *** | 1.157 | *** |
| Home-ownership status: Mortgage | 1.109 | *** | 1.104 | *** |
| North East | 0.874 | 0.871 | ||
| North West | 0.951 | 0.947 | ||
| Yorkshire and the Humber | 1.032 | 1.043 | ||
| East Midlands | 0.935 | 0.929 | ||
| West Midlands | 1.003 | 0.984 | ||
| East of England | 1.020 | 1.014 | ||
| South East | 0.980 | 0.979 | ||
| South West | 0.947 | 0.949 | ||
| Wales | 0.879 | 0.886 | ||
| Scotland | 1.010 | 1.008 | ||
| Northern Ireland | 0.957 | 0.950 | ||
| Log (survival time) | 0.384 | *** | 0.391 | *** |
| Constant | 0.535 | *** | 0.525 | *** |
| Number of observations | 15,384 | 15,331 |
Mental health or psychological distress:
| Exp. Coeff. (time invarying covariates) | Exp. Coeff. (time varying covariates) | |||
|---|---|---|---|---|
| Age category: Aged 25 to 34 | 1.192 | *** | 1.199 | *** |
| Age category: Aged 35 to 49 | 1.159 | *** | 1.178 | *** |
| Age category: Aged 50 to 59 | 1.187 | *** | 1.207 | *** |
| Age category: Aged 60 to 64 | 1.368 | *** | 1.396 | *** |
| Male | 1.007 | 1.007 | ||
| White ethnicity | 1.250 | *** | 1.249 | *** |
| Highest qualifications: Degree | 0.766 | *** | 0.762 | *** |
| Highest qualifications: Other higher degree | 0.878 | *** | 0.883 | *** |
| Highest qualifications: A-level | 0.892 | *** | 0.899 | *** |
| Highest qualifications: GCSE | 0.932 | ** | 0.938 | ** |
| Highest qualifications: Other qualification | 1.001 | 0.995 | ||
| Employed | 1.174 | *** | 1.169 | *** |
| Married | 1.039 | 1.029 | ||
| Has children aged under 16 | 1.056 | ** | 1.059 | ** |
| Home-ownership status: Homeowner | 1.156 | *** | 1.150 | *** |
| Home-ownership status: Mortgage | 1.201 | *** | 1.197 | *** |
| North East | 1.000 | 1.008 | ||
| North West | 0.965 | 0.965 | ||
| Yorkshire and the Humber | 1.054 | 1.058 | ||
| East Midlands | 1.064 | 1.077 | ||
| West Midlands | 1.035 | 1.037 | ||
| East of England | 1.032 | 1.031 | ||
| South East | 1.034 | 1.036 | ||
| South West | 1.085 | 1.101 | ||
| Wales | 0.979 | 0.966 | ||
| Scotland | 0.964 | 0.967 | ||
| Northern Ireland | 0.932 | 0.932 | ||
| Log (survival time) | 0.564 | *** | 0.568 | *** |
| Constant | 0.370 | *** | 0.367 | *** |
| Number of observations | 20,953 | 20,936 |
Long-term disability or illness:
| Exp. Coeff. (time invarying covariates) | Exp. Coeff. (time varying covariates) | |||
|---|---|---|---|---|
| Age category: Aged 25 to 34 | 0.957 | 0.950 | ||
| Age category: Aged 35 to 49 | 0.900 | ** | 0.891 | ** |
| Age category: Aged 50 to 59 | 0.810 | *** | 0.808 | *** |
| Age category: Aged 60 to 64 | 0.872 | ** | 0.888 | ** |
| Male | 0.996 | 0.995 | ||
| White ethnicity | 1.073 | 1.065 | ||
| Highest qualifications: Degree | 0.866 | *** | 0.874 | *** |
| Highest qualifications: Other higher degree | 0.946 | 0.948 | ||
| Highest qualifications: A-level | 0.947 | 0.945 | ||
| Highest qualifications: GCSE | 0.907 | *** | 0.911 | *** |
| Highest qualifications: Other qualification | 0.927 | 0.935 | ||
| Employed | 1.228 | *** | 1.272 | *** |
| Married | 1.082 | *** | 1.076 | *** |
| Has children aged under 16 | 1.094 | *** | 1.113 | *** |
| Home-ownership status: Homeowner | 1.231 | *** | 1.217 | *** |
| Home-ownership status: Mortgage | 1.165 | *** | 1.159 | *** |
| North East | 0.903 | 0.918 | ||
| North West | 0.836 | *** | 0.848 | *** |
| Yorkshire and the Humber | 0.926 | 0.934 | ||
| East Midlands | 0.910 | 0.928 | ||
| West Midlands | 0.844 | *** | 0.856 | *** |
| East of England | 0.925 | 0.939 | ||
| South East | 0.952 | 0.971 | ||
| South West | 0.910 | 0.926 | ||
| Wales | 0.812 | *** | 0.826 | *** |
| Scotland | 0.937 | 0.939 | ||
| Northern Ireland | 0.937 | 0.957 | ||
| Log (survival time) | 0.450 | *** | 0.450 | *** |
| Constant | 0.421 | *** | 0.408 | *** |
| Number of observations | 23,610 | 23,588 |
Long-term disability or illness (limiting):
| Exp. Coeff. (time invarying covariates) | Exp. Coeff. (time varying covariates) | |||
|---|---|---|---|---|
| Age category: Aged 25 to 34 | 0.941 | 0.916 | ||
| Age category: Aged 35 to 49 | 0.904 | 0.874 | ** | |
| Age category: Aged 50 to 59 | 0.797 | *** | 0.780 | *** |
| Age category: Aged 60 to 64 | 0.969 | 0.958 | ||
| Male | 0.977 | 0.977 | ||
| White ethnicity | 1.091 | ** | 1.096 | ** |
| Highest qualifications: Degree | 0.878 | ** | 0.893 | ** |
| Highest qualifications: Other higher degree | 0.901 | 0.912 | ||
| Highest qualifications: A-level | 0.931 | 0.942 | ||
| Highest qualifications: GCSE | 0.921 | 0.920 | ** | |
| Highest qualifications: Other qualification | 0.973 | 0.977 | ||
| Employed | 1.313 | *** | 1.360 | *** |
| Married | 1.107 | *** | 1.116 | *** |
| Has children aged under 16 | 1.131 | *** | 1.145 | *** |
| Home-ownership status: Homeowner | 1.203 | *** | 1.195 | *** |
| Home-ownership status: Mortgage | 1.180 | *** | 1.184 | *** |
| North East | 1.057 | 1.051 | ||
| North West | 0.992 | 0.993 | ||
| Yorkshire and the Humber | 0.978 | 0.977 | ||
| East Midlands | 1.100 | 1.101 | ||
| West Midlands | 0.978 | 0.984 | ||
| East of England | 1.032 | 1.038 | ||
| South East | 1.060 | 1.060 | ||
| South West | 1.091 | 1.095 | ||
| Wales | 1.034 | 1.030 | ||
| Scotland | 1.037 | 1.036 | ||
| Northern Ireland | 0.987 | 0.990 | ||
| Log (survival time) | 0.449 | *** | 0.459 | *** |
| Constant | 0.408 | *** | 0.400 | *** |
| Number of observations | 15,649 | 15,628 |
*** and ** denote statistical significance at the 1 and 5% level, respectively.
Table A6.31 Estimating the discrete-time hazard of relapsing after exiting poor health (exponentiated coefficients)
Self-assessed (general) health:
| Exp. Coeff. (time invarying covariates) | Exp. Coeff. (time varying covariates) | |||
|---|---|---|---|---|
| Age category: Aged 25 to 34 | 1.465 | *** | 1.458 | *** |
| Age category: Aged 35 to 49 | 1.988 | *** | 1.982 | *** |
| Age category: Aged 50 to 59 | 2.315 | *** | 2.296 | *** |
| Age category: Aged 60 to 64 | 2.256 | *** | 2.220 | *** |
| Male | 0.998 | 0.997 | ||
| White ethnicity | 1.109 | ** | 1.105 | |
| Highest qualifications: Degree | 1.269 | *** | 1.265 | *** |
| Highest qualifications: Other higher degree | 1.204 | *** | 1.195 | *** |
| Highest qualifications: A-level | 1.151 | *** | 1.159 | *** |
| Highest qualifications: GCSE | 1.091 | 1.099 | ||
| Highest qualifications: Other qualification | 1.164 | ** | 1.159 | ** |
| Employed | 0.755 | *** | 0.762 | *** |
| Married | 0.939 | 0.936 | ||
| Has children aged under 16 | 0.965 | 0.951 | ||
| Home-ownership status: Homeowner | 0.798 | *** | 0.778 | *** |
| Home-ownership status: Mortgage | 0.844 | *** | 0.829 | *** |
| North East | 1.013 | 1.012 | ||
| North West | 1.104 | 1.110 | ||
| Yorkshire and the Humber | 1.02 | 1.019 | ||
| East Midlands | 1.075 | 1.092 | ||
| West Midlands | 1.108 | 1.118 | ||
| East of England | 0.939 | 0.950 | ||
| South East | 1.073 | 1.057 | ||
| South West | 1.076 | 1.079 | ||
| Wales | 1.076 | 1.079 | ||
| Scotland | 0.980 | 0.979 | ||
| Northern Ireland | 0.985 | 0.981 | ||
| Log (survival time) | 0.481 | *** | 0.481 | *** |
| Constant | 0.17 | *** | 0.174 | *** |
| Number of observations | 20,299 | 20,271 |
Mental health or psychological distress:
| Exp. Coeff. (time invarying covariates) | Exp. Coeff. (time varying covariates) | |||
|---|---|---|---|---|
| Age category: Aged 25 to 34 | 1.252 | *** | 1.247 | *** |
| Age category: Aged 35 to 49 | 1.301 | *** | 1.301 | *** |
| Age category: Aged 50 to 59 | 1.232 | *** | 1.236 | *** |
| Age category: Aged 60 to 64 | 1.043 | 1.042 | ||
| Male | 0.859 | *** | 0.855 | *** |
| White ethnicity | 1.206 | *** | 1.201 | *** |
| Highest qualifications: Degree | 0.931 | 0.924 | ||
| Highest qualifications: Other higher degree | 0.939 | 0.934 | ||
| Highest qualifications: A-level | 0.944 | 0.946 | ||
| Highest qualifications: GCSE | 0.946 | 0.948 | ||
| Highest qualifications: Other qualification | 1.005 | 0.998 | ||
| Employed | 0.852 | *** | 0.846 | *** |
| Married | 0.958 | 0.955 | ||
| Has children aged under 16 | 0.951 | 0.955 | ||
| Home-ownership status: Homeowner | 0.834 | *** | 0.825 | *** |
| Home-ownership status: Mortgage | 0.917 | *** | 0.920 | ** |
| North East | 1.102 | 1.098 | ||
| North West | 1.031 | 1.022 | ||
| Yorkshire and the Humber | 0.982 | 0.963 | ||
| East Midlands | 0.953 | 0.965 | ||
| West Midlands | 1.082 | 1.085 | ||
| East of England | 1.102 | 1.096 | ||
| South East | 1.032 | 1.032 | ||
| South West | 1.035 | 1.024 | ||
| Wales | 0.968 | 0.955 | ||
| Scotland | 1.092 | 1.079 | ||
| Northern Ireland | 0.915 | 0.912 | ||
| Log (survival time) | 0.534 | *** | 0.538 | *** |
| Constant | 0.242 | *** | 0.246 | *** |
| Number of observations | 32,021 | 31,976 |
Long-term disability or illness:
| Exp. Coeff. (time invarying covariates) | Exp. Coeff. (time varying covariates) | |||
|---|---|---|---|---|
| Age category: Aged 25 to 34 | 1.298 | *** | 1.324 | *** |
| Age category: Aged 35 to 49 | 1.664 | *** | 1.706 | *** |
| Age category: Aged 50 to 59 | 2.043 | *** | 2.090 | *** |
| Age category: Aged 60 to 64 | 2.144 | *** | 2.176 | *** |
| Male | 0.992 | 0.995 | ||
| White ethnicity | 1.077 | 1.085 | ||
| Highest qualifications: Degree | 1.195 | *** | 1.177 | *** |
| Highest qualifications: Other higher degree | 1.147 | *** | 1.143 | *** |
| Highest qualifications: A-level | 1.075 | 1.065 | ||
| Highest qualifications: GCSE | 1.107 | *** | 1.119 | *** |
| Highest qualifications: Other qualification | 1.086 | 1.062 | ||
| Employed | 0.846 | *** | 0.832 | *** |
| Married | 0.978 | 0.964 | ||
| Has children aged under 16 | 0.930 | ** | 0.931 | ** |
| Home-ownership status: Homeowner | 0.878 | *** | 0.865 | *** |
| Home-ownership status: Mortgage | 0.877 | *** | 0.872 | *** |
| North East | 1.088 | 1.058 | ||
| North West | 1.152 | ** | 1.151 | ** |
| Yorkshire and the Humber | 1.165 | ** | 1.166 | ** |
| East Midlands | 1.160 | ** | 1.164 | ** |
| West Midlands | 1.153 | ** | 1.154 | ** |
| East of England | 1.098 | 1.105 | ||
| South East | 1.091 | 1.087 | ||
| South West | 1.108 | 1.115 | ||
| Wales | 1.070 | 1.070 | ||
| Scotland | 1.011 | 1.021 | ||
| Northern Ireland | 0.924 | 0.926 | ||
| Log (survival time) | 0.495 | *** | 0.498 | *** |
| Constant | 0.221 | *** | 0.221 | *** |
| Number of observations | 27,006 | 26,893 |
Long-term disability or illness (limiting)
| Exp. Coeff. (time invarying covariates) | Exp. Coeff. (time varying covariates) | |||
|---|---|---|---|---|
| Age category: Aged 25 to 34 | 1.452 | *** | 1.476 | *** |
| Age category: Aged 35 to 49 | 1.768 | *** | 1.794 | *** |
| Age category: Aged 50 to 59 | 2.306 | *** | 2.310 | *** |
| Age category: Aged 60 to 64 | 2.228 | *** | 2.182 | *** |
| Male | 0.983 | 0.988 | ||
| White ethnicity | 1.131 | ** | 1.132 | ** |
| Highest qualifications: Degree | 1.303 | *** | 1.279 | *** |
| Highest qualifications: Other higher degree | 1.242 | *** | 1.242 | *** |
| Highest qualifications: A-level | 1.13 | ** | 1.129 | ** |
| Highest qualifications: GCSE | 1.108 | ** | 1.115 | ** |
| Highest qualifications: Other qualification | 1.052 | 1.018 | ||
| Employed | 0.745 | *** | 0.725 | *** |
| Married | 0.882 | 0.881 | *** | |
| Has children aged under 16 | 0.925 | 0.907 | ** | |
| Home-ownership status: Homeowner | 0.788 | *** | 0.774 | *** |
| Home-ownership status: Mortgage | 0.854 | *** | 0.843 | *** |
| North East | 1.029 | 1.006 | ||
| North West | 1.161 | ** | 1.158 | |
| Yorkshire and the Humber | 1.129 | 1.125 | ||
| East Midlands | 1.107 | 1.112 | ||
| West Midlands | 1.263 | *** | 1.251 | *** |
| East of England | 1.089 | 1.066 | ||
| South East | 1.086 | 1.039 | ||
| South West | 1.187 | ** | 1.181 | ** |
| Wales | 1.025 | 1.020 | ||
| Scotland | 0.954 | 0.956 | ||
| Northern Ireland | 1.096 | 1.074 | ||
| Log (survival time) | 0.514 | *** | 0.519 | *** |
| Constant | 0.174 | *** | 0.182 | *** |
| Number of observations | 21,086 | 20,978 |
Chronic condition:
| Exp. Coeff. (time invarying covariates) | Exp. Coeff. (time varying covariates) | |||
|---|---|---|---|---|
| Age category: Aged 25 to 34 | - | - | - | - |
| Age category: Aged 35 to 49 | - | - | - | - |
| Age category: Aged 50 to 59 | - | - | - | - |
| Age category: Aged 60 to 64 | - | - | - | - |
| Male | 0.871 | *** | 0.874 | *** |
| White ethnicity | 0.989 | 0.969 | ||
| Highest qualifications: Degree | 1.494 | *** | 1.562 | *** |
| Highest qualifications: Other higher degree | 1.311 | *** | 1.327 | *** |
| Highest qualifications: A-level | 1.356 | *** | 1.386 | *** |
| Highest qualifications: GCSE | 1.215 | *** | 1.278 | *** |
| Highest qualifications: Other qualification | 1.209 | *** | 1.262 | *** |
| Employed | 0.875 | *** | 0.878 | *** |
| Married | 0.935 | 0.926 | ||
| Has children aged under 16 | 0.943 | 0.943 | ||
| Home-ownership status: Homeowner | 0.790 | *** | 0.777 | *** |
| Home-ownership status: Mortgage | 0.815 | *** | 0.773 | *** |
| North East | 1.133 | 1.157 | ||
| North West | 1.159 | 1.161 | ||
| Yorkshire and the Humber | 1.094 | 1.152 | ||
| East Midlands | 0.941 | 0.946 | ||
| West Midlands | 0.992 | 1.004 | ||
| East of England | 1.174 | ** | 1.182 | ** |
| South East | 1.009 | 1.025 | ||
| South West | 1.059 | 1.034 | ||
| Wales | 0.934 | 0.924 | ||
| Scotland | 1.007 | 1.041 | ||
| Northern Ireland | 0.886 | 0.916 | ||
| Log (survival time) | 3.906 | *** | 3.893 | *** |
| Constant | 0.000 | *** | 0.000 | *** |
| Number of observations | 90,762 | 90,903 |
*** and ** denote statistical significance at the 1 and 5% level, respectively.
Table A6.32 Impact of onset of poor health on employment exit
Poor general health:
| Years after onset | 0 years | 1 year | 2 years | 3 years | ||||
|---|---|---|---|---|---|---|---|---|
| Onset of poor health | 3.9 | *** | 1.8 | *** | 0.6 | * | 0.5 | * |
| Male | -0.4 | -1.0 | *** | -0.8 | *** | -0.8 | *** | |
| Age | -0.1 | 0.1 | *** | 0.1 | *** | 0.1 | *** | |
| Married | -1.2 | -0.3 | -0.2 | 0.1 | ||||
| Other qualification | -1.0 | -0.6 | 0.7 | -0.5 | ||||
| GCSE | -1.6 | -0.4 | 0.5 | -0.3 | ||||
| A-levels | -1.3 | ** | -0.5 | 0.7 | * | -0.3 | ||
| Other higher qualification | -2.1 | *** | -0.3 | 1.1 | ** | -0.4 | ||
| Degree | -1.1 | -0.1 | 1.3 | *** | -0.3 | |||
| North West | 0.1 | ** | -1.1 | -0.7 | -0.8 | |||
| Yorkshire | -0.4 | * | -0.8 | -0.8 | -0.8 | |||
| East Midlands | -0.6 | *** | -1.3 | -0.5 | -0.4 | |||
| West Midlands | 0.0 | -2.0 | ** | -1.2 | * | -0.6 | ||
| East England | -0.7 | -1.7 | ** | -0.2 | -1.1 | * | ||
| London | 1.1 | -1.4 | -0.4 | -0.7 | ||||
| South East | -1.0 | -1.2 | 0.1 | -0.5 | ||||
| South West | -0.8 | -1.8 | ** | -0.4 | -0.6 | |||
| Wales | 1.1 | -1.2 | -0.4 | -0.1 | ||||
| Scotland | 0.1 | -2.0 | ** | -1.1 | * | -1.2 | ** | |
| Northern Ireland | -0.5 | -2.4 | *** | -0.6 | -1.5 | ** | ||
| White ethnicity | -1.8 | -1.2 | ** | 0 | 0.1 | |||
| Has kids aged over 16 | 1.2 | 0.0 | 0 | -0.5 | ** | |||
| Home owner | 1.7 | 0.8 | ** | 1.1 | *** | 0.4 | ||
| Workplace size 25-199 | -1.4 | -0.1 | -0.3 | -0.2 | ||||
| Workplace size >200 | -1.6 | *** | -0.5 | 0 | -0.3 | |||
| Managerial or technical | -0.3 | *** | 0.9 | 0.1 | -0.3 | |||
| Skilled non-manual | 1.1 | *** | 0.3 | 0.1 | -0.4 | |||
| Skilled manual | -0.4 | *** | 0.5 | 0.4 | -0.2 | |||
| Partly skilled | 1.7 | *** | 1.3 | * | 0.7 | -0.2 | ||
| Unskilled | 3.3 | 0.3 | 1.2 | 0.3 | ||||
| Logarithm of hourly pay | -1.7 | -0.7 | *** | -0.1 | 0.1 | |||
| Number of observations | 23735 | 23735 | 23735 | 23735 |
Mental health problem:
| Years after onset | 0 years | 1 year | 2 years | 3 years | |||
|---|---|---|---|---|---|---|---|
| Onset of poor health | 4.9 | *** | 1.6 | *** | 0.3 | 0.8 | |
| Male | -0.5 | -0.5 | * | -0.6 | ** | -0.5 | |
| Age | 0 | 0.1 | *** | 0.1 | *** | 0.1 | |
| Married | -0.9 | ** | -0.3 | -0.4 | 0.1 | ||
| Other qualification | 0.2 | -0.4 | 0.2 | -0.1 | |||
| GCSE | -0.7 | -0.3 | 0.4 | 0.6 | |||
| A-levels | -0.8 | -0.2 | 0.3 | 0.4 | |||
| Other higher qualification | -1.2 | -0.2 | 0.5 | 0.7 | |||
| Degree | -0.2 | -0.3 | 0.6 | 0.6 | |||
| North West | 0.6 | 0.8 | -1.8 | ** | 0.3 | ||
| Yorkshire | -0.7 | 0.5 | -1.6 | ** | 0.4 | ||
| East Midlands | -0.3 | 0.7 | -0.8 | 0.4 | |||
| West Midlands | -0.7 | -0.6 | -1.7 | ** | 0.7 | ||
| East England | -0.8 | -0.3 | -1.3 | 0.3 | |||
| London | 1.1 | -0.1 | -1.4 | * | 0.5 | ||
| South East | -0.6 | -0.2 | -0.8 | 0.7 | |||
| South West | -1 | -0.8 | -1.5 | ** | 0.5 | ||
| Wales | 0.1 | -0.2 | -1.7 | ** | 0.8 | ||
| Scotland | -0.1 | -0.7 | -1.4 | * | -0.3 | ||
| Northern Ireland | -0.2 | -0.4 | -1.7 | ** | -0.2 | ||
| White ethnicity | -1.4 | ** | -1.2 | ** | -0.6 | 0.4 | |
| Has kids aged over 16 | 1.5 | *** | 0.2 | 0.1 | -0.4 | ||
| Home owner | 1.4 | *** | 0.5 | 1.1 | *** | 0.5 | |
| Workplace size 25-199 | -1.5 | *** | 0 | -0.5 | * | 0.1 | |
| Workplace size >200 | -1.8 | *** | -0.4 | -0.2 | -0.2 | ||
| Managerial or technical | 0.4 | 0.6 | 0.8 | * | 0 | ||
| Skilled non-manual | 1.1 | 0.7 | 0.3 | -0.1 | |||
| Skilled manual | 0.3 | 0.5 | 0.3 | 0.1 | |||
| Partly skilled | 2.6 | *** | 0.9 | 1.2 | ** | 0.3 | |
| Unskilled | 3.6 | *** | 0.8 | 1.3 | * | 0.3 | |
| Logarithm of hourly pay | -1.6 | *** | -0.6 | ** | -0.3 | * | 0.1 |
| Number of observations | 22926 | 22926 | 22926 | 22926 |
Long-term illness or disability
| Years after onset | 0 years | 1 year | 2 years | 3 years | ||||
|---|---|---|---|---|---|---|---|---|
| Onset of poor health | 2 | *** | 1.7 | *** | 0.3 | 0.3 | ||
| Male | -0.7 | ** | -0.9 | *** | -1 | *** | -0.5 | ** |
| Age | -0.1 | ** | 0 | *** | 0.1 | *** | 0.1 | *** |
| Married | -1.1 | *** | 0.1 | -0.3 | 0.3 | |||
| Other qualification | -0.9 | 0 | 0.5 | -0.2 | ||||
| GCSE | -1.1 | -0.5 | 0.2 | 0.2 | ||||
| A-levels | -0.9 | -0.7 | 0.6 | 0.3 | ||||
| Other higher qualification | -2.1 | ** | -0.7 | 1 | * | 0.1 | ||
| Degree | -0.9 | -0.3 | 0.6 | 0.2 | ||||
| North West | -0.1 | 0 | 0.1 | -0.3 | ||||
| Yorkshire | -0.4 | 0.1 | 0.5 | -0.7 | ||||
| East Midlands | -0.8 | -0.5 | 0.3 | -0.3 | ||||
| West Midlands | -0.3 | -1.2 | -0.2 | -0.6 | ||||
| East England | -1.2 | -0.6 | 0.5 | -0.3 | ||||
| London | 0.7 | -0.2 | 0.4 | -0.4 | ||||
| South East | -0.9 | -0.2 | 0.7 | 0.3 | ||||
| South West | -0.9 | -0.7 | -0.3 | -0.4 | ||||
| Wales | 0.5 | 0.1 | 0 | 0 | ||||
| Scotland | -0.8 | -0.8 | -0.6 | -0.6 | ||||
| Northern Ireland | -0.8 | -1.4 | * | 0 | -1 | |||
| White ethnicity | -3.2 | *** | -1.5 | *** | 0.1 | -0.1 | ||
| Has kids aged over 16 | 1.9 | *** | -0.1 | -0.1 | -0.4 | * | ||
| Home owner | 1.1 | ** | 0.8 | ** | 0.8 | ** | 0.3 | |
| Workplace size 25-199 | -1.4 | *** | 0 | -0.2 | 0 | |||
| Workplace size >200 | -1.7 | *** | -0.5 | 0 | -0.3 | |||
| Managerial or technical | -0.1 | 0.6 | 0.1 | 0.4 | ||||
| Skilled non-manual | 0.5 | 0.4 | -0.1 | 0.5 | ||||
| Skilled manual | -0.5 | 0.1 | 0.3 | 0.4 | ||||
| Partly skilled | 1.5 | * | 1 | 0.7 | 0.5 | |||
| Unskilled | 3.5 | *** | 0.1 | 0.4 | 1 | |||
| Logarithm of hourly pay | -1.6 | *** | -0.9 | *** | -0.1 | 0 | ||
| Number of observations | 22336 | 22336 | 22336 | 22336 |
*** and ** denote statistical significance at the 1 and 5% level, respectively.
Table A6.32 (continued) Impact of onset of poor health on employment exit
Functional impairment:
| Years after onset | 0 years | 1 year | 2 years | 3 years | ||||
|---|---|---|---|---|---|---|---|---|
| Onset of poor health | 3.8 | *** | 2.1 | *** | 0.9 | *** | 0.9 | *** |
| Male | -0.7 | ** | -0.7 | ** | -0.9 | *** | -0.7 | *** |
| Age | 0 | 0.1 | *** | 0.1 | *** | 0.1 | *** | |
| Married | -1.3 | *** | -0.4 | -0.1 | 0.4 | ** | ||
| Other qualification | -0.7 | -0.5 | 0.8 | -0.1 | ||||
| GCSE | -1.5 | ** | -0.6 | 0.6 | -0.1 | |||
| A-levels | -1.3 | * | -0.8 | 0.5 | 0.2 | |||
| Other higher qualification | -2.2 | *** | -0.5 | 0.9 | * | 0.2 | ||
| Degree | -1 | -0.2 | 1.1 | ** | 0.3 | |||
| North West | 0.4 | -0.4 | -0.8 | -0.2 | ||||
| Yorkshire | -0.6 | -0.4 | -0.2 | -0.3 | ||||
| East Midlands | -0.6 | -0.8 | -0.5 | -0.1 | ||||
| West Midlands | 0.4 | -1.8 | ** | -1.3 | * | 0 | ||
| East England | -1 | -1 | -0.2 | -0.3 | ||||
| London | 0.8 | -0.9 | -0.6 | -0.1 | ||||
| South East | -1 | -0.5 | 0 | 0.2 | ||||
| South West | -0.9 | -1.6 | ** | -0.5 | -0.3 | |||
| Wales | 0.5 | -0.7 | -0.7 | 0.3 | ||||
| Scotland | -0.1 | -1.3 | -1.4 | ** | -0.5 | |||
| Northern Ireland | -0.3 | -1.6 | * | -0.8 | -1.2 | ** | ||
| White ethnicity | -2.7 | *** | -1.4 | *** | -0.1 | 0.1 | ||
| Has kids aged over 16 | 1.6 | *** | -0.1 | -0.1 | -0.3 | |||
| Home owner | 1.6 | *** | 0.9 | *** | 0.7 | ** | 0.2 | |
| Workplace size 25-199 | -1.6 | *** | -0.1 | -0.2 | -0.3 | |||
| Workplace size >200 | -1.5 | *** | -0.4 | -0.1 | -0.5 | ** | ||
| Managerial or technical | -0.3 | 0.8 | -0.2 | 0.3 | ||||
| Skilled non-manual | 0.1 | 0.8 | -0.2 | 0.2 | ||||
| Skilled manual | -1.1 | 0.6 | 0.1 | 0.3 | ||||
| Partly skilled | 1.3 | 1.5 | ** | 0.6 | 0.5 | |||
| Unskilled | 3.2 | *** | 0.4 | 0.1 | 0.8 | |||
| Logarithm of hourly pay | -1.6 | *** | -0.8 | *** | -0.2 | -0.1 | ||
| Number of observations | 23395 | 23395 | 23395 | 23395 |
Chronic condition:
| Years after onset | 0 years | 1 year | 2 years | 3 years | ||||
|---|---|---|---|---|---|---|---|---|
| Onset of poor health | 3.5 | *** | 1.3 | ** | 0.3 | 1.1 | *** | |
| Male | -0.7 | * | -0.7 | ** | -0.8 | *** | -0.8 | *** |
| Age | -0.1 | *** | 0 | ** | 0.1 | *** | 0.1 | *** |
| Married | -1.1 | *** | -0.2 | -0.3 | 0.2 | |||
| Other qualification | -0.6 | -1.1 | 0.4 | 0.1 | ||||
| GCSE | -1 | -1.4 | * | 0.4 | 0.1 | |||
| A-levels | -1.3 | -2 | *** | 0.8 | * | 0.4 | ||
| Other higher qualification | -2.6 | *** | -1.7 | ** | 0.8 | 0.6 | ||
| Degree | -1.4 | -1.2 | 1.1 | ** | 0.6 | |||
| North West | -1.1 | 0.9 | -0.5 | 0.3 | ||||
| Yorkshire | -1.6 | 1.1 | -0.5 | -0.5 | ||||
| East Midlands | -1.5 | 1 | -0.1 | 0.4 | ||||
| West Midlands | -1.3 | -0.3 | -1.3 | * | 0.3 | |||
| East England | -2.1 | * | -0.4 | -0.2 | -0.2 | |||
| London | 0.5 | 0.5 | -0.2 | 0.3 | ||||
| South East | -1.4 | 0.4 | 0.2 | 0.4 | ||||
| South West | -1.6 | -0.7 | -0.5 | -0.1 | ||||
| Wales | -0.1 | 0.2 | -0.4 | 0.4 | ||||
| Scotland | -1.4 | 0 | -0.6 | -0.5 | ||||
| Northern Ireland | -1.1 | -0.6 | -0.4 | -0.7 | ||||
| White ethnicity | -2 | *** | -0.8 | 0 | 0.3 | |||
| Has kids aged over 16 | 1.5 | *** | -0.4 | 0.2 | -0.4 | * | ||
| Home owner | 1.4 | *** | 0.7 | * | 0.8 | ** | 0.5 | * |
| Workplace size 25-199 | -1.5 | *** | 0 | -0.4 | 0.2 | |||
| Workplace size >200 | -1.7 | *** | -0.5 | -0.3 | -0.3 | |||
| Managerial or technical | -1.1 | 0.9 | -0.1 | 0.1 | ||||
| Skilled non-manual | -0.1 | 0.9 | -0.4 | 0.1 | ||||
| Skilled manual | -1.5 | 0.5 | 0.2 | 0.5 | ||||
| Partly skilled | 0.6 | 1.2 | * | 0.8 | 0 | |||
| Unskilled | 2.9 | ** | 0.5 | 0.9 | 0.7 | |||
| Logarithm of hourly pay | -1.9 | *** | -0.7 | *** | 0 | 0.1 | ||
| Number of observations | 18843 | 18843 | 18843 | 18843 |
*** and ** denote statistical significance at the 1 and 5% level, respectively.
Table A6.33 Impact of the onset of poor health on activity exit
Poor general health:
| Years after onset | 0 years | 1 year | 2 years | 3 years | ||||
|---|---|---|---|---|---|---|---|---|
| Onset of poor health | 3.1 | *** | 1.5 | *** | 0.7 | ** | 0.8 | ** |
| Male | -0.5 | -1.2 | *** | -0.7 | *** | -0.8 | *** | |
| Age | 0 | 0.1 | *** | 0.1 | *** | 0.1 | *** | |
| Married | -0.8 | -0.2 | -0.1 | 0.3 | ||||
| Other qualification | -0.8 | -0.9 | 0.7 | -0.2 | ||||
| GCSE | -1 | -0.8 | 0.3 | -0.1 | ||||
| A-levels | -0.7 | ** | -0.7 | 0.6 | -0.2 | |||
| Other higher qualification | -1.3 | ** | -0.7 | 0.9 | ** | -0.3 | ||
| Degree | -0.5 | -0.5 | 1 | ** | -0.1 | |||
| North West | 0.1 | -1.6 | * | -0.3 | -1 | |||
| Yorkshire | -0.1 | -1.1 | -0.1 | -1.1 | * | |||
| East Midlands | -0.1 | * | -1.6 | * | 0.1 | -1 | ||
| West Midlands | 0 | -2.6 | *** | -0.3 | -1 | |||
| East England | -0.1 | -1.7 | ** | 0 | -1.5 | ** | ||
| London | 1.1 | -1.1 | 0 | -1.2 | * | |||
| South East | -0.4 | -1.5 | * | 0.4 | -0.7 | |||
| South West | -0.6 | -1.8 | ** | 0 | -0.6 | |||
| Wales | 1.1 | -1.6 | * | -0.1 | -0.3 | |||
| Scotland | 0.5 | -2.3 | *** | -0.7 | -1.3 | ** | ||
| Northern Ireland | -0.2 | -2.4 | *** | -0.1 | -1.6 | ** | ||
| White ethnicity | -1.2 | -0.8 | * | 0.1 | 0.2 | |||
| Has kids aged over 16 | 1.2 | 0 | 0.1 | -0.5 | ** | |||
| Home owner | 1.8 | 0.9 | *** | 0.9 | *** | 0.3 | ||
| Workplace size 25-199 | -1 | -0.2 | -0.1 | -0.1 | ||||
| Workplace size >200 | -1.3 | ** | -0.4 | 0 | -0.1 | |||
| Managerial or technical | -0.2 | *** | 1 | ** | -0.1 | -0.2 | ||
| Skilled non-manual | 1 | *** | 0.7 | 0 | -0.5 | |||
| Skilled manual | -0.5 | *** | 1.1 | * | -0.1 | -0.1 | ||
| Partly skilled | 1.4 | *** | 1.4 | ** | 0.4 | -0.1 | ||
| Unskilled | 2.3 | 1.3 | * | 0.6 | 0.7 | |||
| Logarithm of hourly pay | -1.4 | -0.5 | ** | -0.1 | 0 | |||
| Number of observations | 23735 | 23735 | 23735 | 23735 |
Mental health problem:
| Years after onset | 0 years | 1 year | 2 years | 3 years | ||||
|---|---|---|---|---|---|---|---|---|
| Onset of poor health | 4.1 | *** | 1.7 | *** | 0.3 | 0.8 | *** | |
| Male | -0.7 | ** | -0.7 | *** | -0.5 | ** | -0.6 | *** |
| Age | 0 | 0.1 | *** | 0.1 | *** | 0.1 | *** | |
| Married | -0.7 | ** | -0.2 | -0.3 | 0.3 | |||
| Other qualification | 0.3 | -0.4 | -0.2 | 0.2 | ||||
| GCSE | -0.9 | -0.3 | 0.3 | 0.7 | * | |||
| A-levels | -0.7 | 0 | 0 | 0.5 | ||||
| Other higher qualification | -0.9 | -0.1 | 0.1 | 0.6 | ||||
| Degree | 0 | -0.1 | 0.4 | 0.5 | ||||
| North West | 0.1 | 0.1 | -0.9 | -0.2 | ||||
| Yorkshire | -0.9 | 0.5 | -1.1 | 0 | ||||
| East Midlands | -0.4 | 0.3 | -0.3 | -0.1 | ||||
| West Midlands | -0.9 | -1 | -1.1 | 0.5 | ||||
| East England | -0.5 | -0.5 | -0.8 | 0 | ||||
| London | 0.9 | -0.6 | -0.7 | 0.3 | ||||
| South East | -0.6 | -0.6 | -0.2 | 0.2 | ||||
| South West | -1.2 | -1.1 | -0.7 | 0.3 | ||||
| Wales | 0 | -0.6 | -1.3 | * | 0.4 | |||
| Scotland | -0.3 | -0.6 | -0.9 | -0.6 | ||||
| Northern Ireland | -0.2 | -0.9 | -1.1 | -0.3 | ||||
| White ethnicity | -1.1 | ** | -1 | * | -0.4 | 0.5 | * | |
| Has kids aged over 16 | 1.6 | *** | 0.3 | 0.1 | -0.5 | ** | ||
| Home owner | 1.2 | *** | 0.6 | * | 1 | *** | 0.5 | ** |
| Workplace size 25-199 | -1.3 | *** | -0.1 | -0.3 | 0.2 | |||
| Workplace size >200 | -1.6 | *** | -0.2 | -0.2 | -0.2 | |||
| Managerial or technical | 0.2 | 0.9 | * | 0.8 | * | -0.3 | ||
| Skilled non-manual | 1 | 1.2 | ** | 0.3 | -0.4 | |||
| Skilled manual | 0.2 | 1.1 | * | 0.1 | -0.3 | |||
| Partly skilled | 2.2 | *** | 1 | * | 1.3 | ** | 0.2 | |
| Unskilled | 2.6 | ** | 1.4 | * | 0.9 | 0.5 | ||
| Logarithm of hourly pay | -1.3 | *** | -0.5 | ** | -0.4 | ** | 0.2 | |
| Number of observations | 22926 | 22926 | 22926 | 22926 |
Long-term illness or disability:
| Years after onset | 0 years | 1 year | 2 years | 3 years | ||||
|---|---|---|---|---|---|---|---|---|
| Onset of poor health | 1.6 | *** | 1.5 | *** | 0.4 | 0.3 | ||
| Male | -1 | *** | -0.8 | *** | -0.9 | *** | -0.6 | *** |
| Age | -0.1 | ** | 0 | *** | 0.1 | *** | 0.1 | *** |
| Married | -0.7 | ** | 0.2 | 0 | 0.4 | * | ||
| Other qualification | -0.7 | -0.2 | 0.3 | 0.3 | ||||
| GCSE | -0.7 | -0.6 | 0 | 0.3 | ||||
| A-levels | -0.5 | -0.5 | 0.3 | 0.5 | ||||
| Other higher qualification | -1.5 | ** | -0.7 | 0.6 | 0.2 | |||
| Degree | -0.5 | -0.4 | 0.2 | 0.4 | ||||
| North West | -0.4 | -0.1 | 0.3 | -0.3 | ||||
| Yorkshire | -0.3 | 0 | 0.9 | -1 | ||||
| East Midlands | -0.8 | -0.8 | 0.9 | -0.6 | ||||
| West Midlands | -0.4 | -1.3 | * | 0.4 | -0.7 | |||
| East England | -0.9 | -0.7 | 0.6 | -0.4 | ||||
| London | 0.5 | 0.4 | 0.4 | -0.7 | ||||
| South East | -0.6 | -0.2 | 1 | * | 0 | |||
| South West | -0.7 | -0.5 | 0.2 | -0.4 | ||||
| Wales | 0.2 | 0.2 | 0.4 | -0.2 | ||||
| Scotland | -0.4 | -1 | -0.2 | -0.7 | ||||
| Northern Ireland | -0.6 | -1.3 | * | 0.4 | -1.1 | * | ||
| White ethnicity | -2.3 | *** | -1 | ** | -0.2 | 0 | ||
| Has kids aged over 16 | 1.9 | *** | 0 | 0 | -0.4 | * | ||
| Home owner | 0.9 | ** | 1 | *** | 0.6 | ** | 0.3 | |
| Workplace size 25-199 | -1 | *** | 0 | 0.1 | 0.1 | |||
| Workplace size >200 | -1.6 | *** | -0.3 | 0.2 | -0.1 | |||
| Managerial or technical | 0 | 0.9 | * | 0 | 0.3 | |||
| Skilled non-manual | 0.5 | 1 | * | -0.2 | 0.2 | |||
| Skilled manual | -0.2 | 0.5 | 0 | 0.5 | ||||
| Partly skilled | 1.2 | 1.6 | *** | 0.4 | 0.5 | |||
| Unskilled | 2.6 | ** | 1 | 0.1 | 1.3 | * | ||
| Logarithm of hourly pay | -1.2 | *** | -0.8 | *** | 0 | 0 | ||
| Number of observations | 22336 | 22336 | 22336 | 22336 |
*** and ** denote statistical significance at the 1 and 5% level, respectively.
Table A6.33 (continued) Impact of the onset of poor health on activity exit
Functional impairment:
| Years after onset | 0 years | 1 year | 2 years | 3 years | ||||
|---|---|---|---|---|---|---|---|---|
| Onset of poor health | 3 | *** | 2.2 | *** | 0.8 | ** | 1.1 | *** |
| Male | -0.8 | ** | -0.7 | *** | -0.8 | *** | -0.9 | *** |
| Age | 0 | 0.1 | *** | 0.1 | *** | 0.1 | *** | |
| Married | -0.9 | ** | -0.4 | -0.1 | 0.6 | *** | ||
| Other qualification | -0.6 | -0.5 | 0.4 | 0.1 | ||||
| GCSE | -1 | -0.7 | 0.4 | -0.1 | ||||
| A-levels | -0.7 | -0.7 | 0.3 | 0.3 | ||||
| Other higher qualification | -1.3 | * | -0.7 | 0.5 | 0.2 | |||
| Degree | -0.4 | -0.3 | 0.7 | 0.4 | ||||
| North West | 0.3 | -0.7 | -0.2 | -0.5 | ||||
| Yorkshire | -0.7 | -0.4 | 0.3 | -0.7 | ||||
| East Midlands | -0.4 | -1 | 0.1 | -0.6 | ||||
| West Midlands | 0.4 | -1.7 | ** | -0.7 | -0.2 | |||
| East England | -0.5 | -1 | 0.1 | -0.6 | ||||
| London | 0.7 | -0.4 | -0.3 | -0.6 | ||||
| South East | -0.6 | -0.7 | 0.6 | -0.2 | ||||
| South West | -0.7 | -1.7 | ** | 0.2 | -0.3 | |||
| Wales | 0.6 | -0.8 | -0.2 | -0.2 | ||||
| Scotland | 0.3 | -1.6 | ** | -0.9 | -0.7 | |||
| Northern Ireland | -0.1 | -1.5 | * | -0.3 | -1.4 | ** | ||
| White ethnicity | -2 | *** | -1 | ** | -0.1 | 0.1 | ||
| Has kids aged over 16 | 1.6 | *** | 0 | -0.2 | -0.3 | |||
| Home owner | 1.5 | *** | 1.1 | *** | 0.6 | * | 0.3 | |
| Workplace size 25-199 | -1.2 | *** | 0 | -0.2 | -0.1 | |||
| Workplace size >200 | -1.3 | *** | -0.2 | -0.1 | -0.3 | |||
| Managerial or technical | -0.2 | 1 | ** | -0.3 | 0.2 | |||
| Skilled non-manual | 0.3 | 1.1 | * | -0.3 | 0.2 | |||
| Skilled manual | -0.7 | 0.6 | -0.2 | 0.5 | ||||
| Partly skilled | 1.2 | 1.7 | *** | 0.3 | 0.6 | |||
| Unskilled | 2.5 | ** | 1 | -0.3 | 1.4 | * | ||
| Logarithm of hourly pay | -1.3 | *** | -0.8 | *** | -0.1 | 0 | ||
| Number of observations | 23395 | 23395 | 23395 | 23395 |
Chronic condition:
| Years after onset | 0 years | 1 year | 2 years | 3 years | ||||
|---|---|---|---|---|---|---|---|---|
| Onset of poor health | 2.3 | *** | 1.5 | *** | 0.4 | 1 | *** | |
| Male | -0.7 | ** | -0.9 | *** | -0.8 | *** | -0.8 | *** |
| Age | -0.1 | *** | 0 | * | 0.1 | *** | 0.1 | *** |
| Married | -0.6 | -0.2 | -0.3 | 0.4 | * | |||
| Other qualification | -0.7 | -1 | 0.2 | 0.5 | ||||
| GCSE | -0.6 | -1.4 | ** | 0 | 0.2 | |||
| A-levels | -0.8 | -1.7 | ** | 0.4 | 0.6 | |||
| Other higher qualification | -1.7 | ** | -1.8 | ** | 0.3 | 0.5 | ||
| Degree | -0.7 | -1.1 | 0.5 | 0.6 | ||||
| North West | -1.2 | 0.4 | -0.1 | 0.3 | ||||
| Yorkshire | -1.4 | 0.6 | 0.3 | -0.8 | ||||
| East Midlands | -1 | 0.5 | 0.3 | -0.2 | ||||
| West Midlands | -1.3 | -0.5 | -0.8 | 0 | ||||
| East England | -1.7 | * | -0.5 | -0.1 | -0.5 | |||
| London | 0 | 1.2 | 0 | -0.2 | ||||
| South East | -1.3 | 0.1 | 0.4 | 0.1 | ||||
| South West | -1.5 | -0.8 | -0.2 | 0 | ||||
| Wales | -0.4 | 0.2 | -0.1 | 0.2 | ||||
| Scotland | -1.1 | -0.4 | -0.4 | -0.4 | ||||
| Northern Ireland | -1.1 | -0.6 | -0.1 | -0.8 | ||||
| White ethnicity | -1.7 | *** | -0.4 | -0.1 | 0.3 | |||
| Has kids aged over 16 | 1.4 | *** | -0.3 | 0.1 | -0.5 | ** | ||
| Home owner | 1.2 | ** | 0.9 | ** | 0.7 | ** | 0.4 | |
| Workplace size 25-199 | -1.2 | *** | 0 | -0.1 | 0.2 | |||
| Workplace size >200 | -1.5 | *** | -0.1 | -0.2 | -0.3 | |||
| Managerial or technical | -0.8 | 1.1 | ** | -0.2 | 0 | |||
| Skilled non-manual | 0.2 | 1 | * | -0.5 | 0 | |||
| Skilled manual | -0.9 | 0.6 | -0.2 | 0.6 | ||||
| Partly skilled | 0.6 | 1.3 | ** | 0.4 | 0.2 | |||
| Unskilled | 2.3 | * | 0.9 | 0.3 | 1.5 | * | ||
| Logarithm of hourly pay | -1.5 | *** | -0.7 | *** | -0.2 | 0.3 | ||
| Number of observations | 18843 | 18843 | 18843 | 18843 |
*** and ** denote statistical significance at the 1 and 5% level, respectively.
Table A6.34 Impact of onset of poor health on moving from a satisfactory to a dissatisfactory job
Poor general health:
| Years after onset | 0 years | 1 year | 2 years | 3 years | ||||
|---|---|---|---|---|---|---|---|---|
| Onset of poor health | 1.8 | *** | 1.5 | *** | 0.7 | -0.4 | ||
| Male | 0.5 | -0.4 | -0.4 | -0.4 | * | |||
| Age | 0 | 0 | 0 | * | 0 | |||
| Married | -0.5 | 0.1 | -0.3 | 0.1 | ||||
| Other qualification | 2 | -0.2 | -0.6 | 0.9 | ||||
| GCSE | 1.3 | 1 | 0.1 | 0.5 | ||||
| A-levels | 1.3 | 1.4 | * | -0.2 | 0.8 | |||
| Other higher qualification | 1 | 1.2 | 0 | 0.8 | ||||
| Degree | 0.4 | * | 1.6 | * | 0.4 | 0.8 | ||
| North West | 0.6 | -0.9 | -0.2 | -0.4 | ||||
| Yorkshire | -1 | -2.3 | ** | -1.2 | -0.7 | |||
| East Midlands | -1.1 | -1.3 | 0 | 0.3 | ||||
| West Midlands | 0.1 | -1.3 | 0 | -0.4 | ||||
| East England | 0.3 | -1.6 | -0.3 | -0.6 | ||||
| London | -0.8 | -1.1 | -1.3 | * | -1.1 | |||
| South East | -0.9 | -1.8 | * | -0.7 | -0.1 | |||
| South West | -0.7 | -1.8 | * | 0 | -0.8 | |||
| Wales | -0.7 | -0.3 | -0.6 | -0.7 | ||||
| Scotland | -1.5 | -2.5 | ** | -0.5 | -0.6 | |||
| Northern Ireland | -1.5 | -2.4 | ** | -0.9 | -0.6 | |||
| White ethnicity | 0.3 | 2.1 | *** | 0.6 | 0.5 | * | ||
| Has kids aged over 16 | -0.6 | -0.6 | -0.1 | -0.4 | ||||
| Home owner | -1.2 | -0.9 | * | -0.5 | 0.1 | |||
| Workplace size 25-199 | 1.3 | 1.1 | *** | -0.1 | 0.5 | * | ||
| Workplace size >200 | 1.9 | 0.8 | * | 0.3 | 0 | |||
| Managerial or technical | 1 | 0.1 | -0.1 | 0.2 | ||||
| Skilled non-manual | 1.3 | ** | 0.6 | -0.3 | 0 | |||
| Skilled manual | 1.7 | ** | 0.1 | 0.3 | -0.2 | |||
| Partly skilled | -0.6 | *** | 1 | -0.1 | -0.7 | |||
| Unskilled | 0.8 | -0.5 | -0.2 | -0.6 | ||||
| Logarithm of hourly pay | 0.3 | 0.5 | 0.3 | 0.2 | ||||
| Number of observations | 23735 | 23735 | 23735 | 23735 |
Mental health problem:
| Years after onset | 0 years | 1 year | 2 years | 3 years | ||||
|---|---|---|---|---|---|---|---|---|
| Onset of poor health | 11 | *** | 0.3 | -0.3 | -0.2 | |||
| Male | 1.3 | *** | -0.6 | -0.5 | * | -0.1 | ||
| Age | 0 | ** | 0 | ** | 0 | 0 | ** | |
| Married | -0.4 | 0.6 | -0.6 | ** | 0.2 | |||
| Other qualification | 2.6 | * | -0.6 | -0.3 | 1 | |||
| GCSE | 1 | 0.3 | 0.8 | 0.6 | ||||
| A-levels | 0.4 | 0.8 | 0.4 | 0.4 | ||||
| Other higher qualification | 1.2 | 0.4 | 0.5 | 0.4 | ||||
| Degree | -0.3 | 0.4 | 0.4 | 0.5 | ||||
| North West | -1.7 | -0.7 | 0.5 | 0.1 | ||||
| Yorkshire | -3.1 | ** | -2.1 | ** | -0.3 | 0.1 | ||
| East Midlands | -1.9 | -0.3 | 0.4 | 0.6 | ||||
| West Midlands | -1 | 0.4 | 0.4 | 0.4 | ||||
| East England | -1 | -0.6 | 0 | -0.1 | ||||
| London | -1.8 | 0.1 | -0.9 | -0.3 | ||||
| South East | -3 | ** | -0.7 | 0.4 | -0.1 | |||
| South West | -2.8 | ** | -1.8 | * | 0.4 | -0.5 | ||
| Wales | -2.4 | * | -0.1 | 0.2 | 0.2 | |||
| Scotland | -3.1 | ** | -1.5 | 0.6 | -0.3 | |||
| Northern Ireland | -4.1 | *** | -2 | * | -0.5 | 0.1 | ||
| White ethnicity | 2 | *** | 1.4 | *** | 0.3 | 0.4 | ||
| Has kids aged over 16 | -0.9 | * | -0.4 | 0.1 | -0.5 | ** | ||
| Home owner | -1.9 | *** | 0 | -0.5 | 0.1 | |||
| Workplace size 25-199 | 2.1 | *** | 1 | ** | 0.1 | 0.5 | * | |
| Workplace size >200 | 2.1 | *** | 0.2 | 0.1 | -0.2 | |||
| Managerial or technical | -0.4 | 2.2 | *** | 0.1 | 0.3 | |||
| Skilled non-manual | 0.7 | 1.6 | ** | 0.3 | -0.5 | |||
| Skilled manual | -0.5 | 1.9 | ** | 0.5 | -0.4 | |||
| Partly skilled | -1.8 | 1.9 | ** | 0.5 | -1 | * | ||
| Unskilled | -2.4 | * | 0.6 | -0.3 | -0.7 | |||
| Logarithm of hourly pay | 0.2 | 0.8 | ** | 0.7 | *** | 0.4 | * | |
| Number of observations | 22926 | 22926 | 22926 | 22926 |
Long-term illness or disability
| Years after onset | 0 years | 1 year | 2 years | 3 years | ||||
|---|---|---|---|---|---|---|---|---|
| Onset of poor health | 1.1 | ** | 0.4 | 0 | -0.2 | |||
| Male | 0.3 | -0.5 | -0.6 | ** | -0.1 | |||
| Age | 0 | 0 | 0 | 0 | ||||
| Married | -0.8 | * | 0 | -0.6 | ** | -0.1 | ||
| Other qualification | 3.7 | *** | -0.5 | -0.2 | 0 | |||
| GCSE | 1 | -0.1 | 0.2 | 0 | ||||
| A-levels | 0.9 | 0.9 | -0.3 | 0.3 | ||||
| Other higher qualification | 1 | 0.2 | -0.2 | 0.2 | ||||
| Degree | -0.4 | 1 | -0.2 | 0.2 | ||||
| North West | -0.4 | 0.5 | -0.2 | -0.3 | ||||
| Yorkshire | -0.7 | -2 | ** | -0.5 | -0.6 | |||
| East Midlands | -1.2 | -1.1 | 1 | 0.2 | ||||
| West Midlands | -0.2 | -0.2 | 0.3 | -0.4 | ||||
| East England | -0.3 | -0.6 | -0.2 | -0.2 | ||||
| London | -1.5 | -0.9 | -0.8 | -0.7 | ||||
| South East | -1.6 | -1 | -0.3 | -0.1 | ||||
| South West | -1.1 | -0.7 | 0.7 | -0.7 | ||||
| Wales | -1 | 0.4 | -0.3 | -0.6 | ||||
| Scotland | -2.4 | * | -1.2 | -0.1 | -0.3 | |||
| Northern Ireland | -2.4 | * | -1.4 | -0.4 | -0.8 | |||
| White ethnicity | -0.7 | 1.9 | *** | 1 | *** | 0.5 | ||
| Has kids aged over 16 | -0.3 | -0.4 | -0.1 | -0.6 | ** | |||
| Home owner | -1.4 | ** | -0.8 | * | -0.6 | 0.3 | ||
| Workplace size 25-199 | 1.2 | ** | 1 | ** | 0.1 | 0.6 | ** | |
| Workplace size >200 | 1.9 | *** | 0.7 | 0.4 | 0.2 | |||
| Managerial or technical | 1.1 | 0.2 | 0.4 | 0.5 | ||||
| Skilled non-manual | 1.2 | 0.3 | 0.1 | 0.4 | ||||
| Skilled manual | 0.7 | 0 | 0.7 | 0.3 | ||||
| Partly skilled | -1.1 | 0.7 | 0.4 | -0.2 | ||||
| Unskilled | 1.9 | -1.1 | 0.1 | -0.4 | ||||
| Logarithm of hourly pay | 0 | 0.5 | 0.4 | 0.3 | ||||
| Number of observations | 22336 | 22336 | 22336 | 22336 |
*** and ** denote statistical significance at the 1 and 5% level, respectively.
Table A6.34 (continued) Impact of the onset of poor health on moving from a satisfactory to a dissatisfactory job
Functional impairment:
| Years after onset | 0 years | 1 year | 2 years | 3 years | ||||
|---|---|---|---|---|---|---|---|---|
| Onset of poor health | 2.1 | *** | 0.9 | * | -0.2 | -0.5 | ||
| Male | 0.4 | -0.7 | ** | -0.6 | ** | -0.3 | ||
| Age | 0 | 0 | * | 0 | 0 | |||
| Married | -0.8 | * | 0 | -0.4 | 0 | |||
| Other qualification | 2.6 | ** | -0.8 | 0.4 | 0.5 | |||
| GCSE | 0.9 | -0.1 | 0.4 | 0.2 | ||||
| A-levels | 0.6 | 0.4 | 0.2 | 0.6 | ||||
| Other higher qualification | 0.4 | -0.3 | 0.2 | 0.6 | ||||
| Degree | -0.5 | 0.3 | 0.4 | 0.3 | ||||
| North West | 0.1 | -0.6 | -0.2 | -0.3 | ||||
| Yorkshire | -0.3 | -2.5 | ** | -0.4 | -0.8 | |||
| East Midlands | -0.6 | -1.3 | 0.6 | 0.3 | ||||
| West Midlands | 0.3 | -1.2 | 0.5 | -0.5 | ||||
| East England | -0.2 | -1.2 | 0 | -0.3 | ||||
| London | -0.9 | -1.2 | -0.6 | -0.8 | ||||
| South East | -0.8 | -1.9 | * | -0.4 | -0.1 | |||
| South West | -0.5 | -2 | * | 0.7 | -0.8 | |||
| Wales | -0.6 | -0.1 | -0.8 | -0.7 | ||||
| Scotland | -1.6 | -2.2 | ** | 0.1 | -0.4 | |||
| Northern Ireland | -1.9 | -2.1 | * | -0.2 | -1.2 | * | ||
| White ethnicity | 0 | 2 | *** | 1 | *** | 0.4 | ||
| Has kids aged over 16 | -0.4 | -0.3 | -0.1 | -0.4 | ||||
| Home owner | -1.6 | *** | -0.6 | -0.6 | * | 0.1 | ||
| Workplace size 25-199 | 1 | ** | 1 | ** | -0.1 | 0.6 | ** | |
| Workplace size >200 | 1.8 | *** | 0.3 | 0.4 | -0.2 | |||
| Managerial or technical | 0.9 | 0 | -0.1 | 0.2 | ||||
| Skilled non-manual | 1.7 | * | -0.1 | -0.6 | -0.1 | |||
| Skilled manual | 0.9 | 0.1 | 0.2 | -0.3 | ||||
| Partly skilled | -0.4 | 0.4 | -0.3 | -0.5 | ||||
| Unskilled | 0.9 | -1.1 | -0.8 | -0.6 | ||||
| Logarithm of hourly pay | -0.1 | 1 | *** | 0.2 | 0.3 | |||
| Number of observations | 23395 | 23395 | 23395 | 23395 |
Chronic condition:
| Years after onset | 0 years | 1 year | 2 years | 3 years | ||||
|---|---|---|---|---|---|---|---|---|
| Onset of poor health | 1.5 | * | 0.1 | 0.6 | 0.3 | |||
| Male | 0.6 | -0.4 | -0.6 | ** | -0.1 | |||
| Age | 0 | 0 | 0 | 0 | ||||
| Married | -0.7 | 0.1 | -0.7 | ** | 0.2 | |||
| Other qualification | 2.1 | -0.1 | -0.6 | 0 | ||||
| GCSE | 1.3 | 0.1 | -0.2 | 0.1 | ||||
| A-levels | 1.1 | 0.3 | -0.3 | 0 | ||||
| Other higher qualification | 1.1 | 0.7 | -0.6 | -0.2 | ||||
| Degree | 0.2 | 0.9 | 0 | 0 | ||||
| North West | 1.1 | 0 | 0.6 | -0.1 | ||||
| Yorkshire | -0.2 | -1.5 | -0.4 | -0.7 | ||||
| East Midlands | -0.5 | -0.4 | 1.2 | 0.6 | ||||
| West Midlands | 1.1 | -0.2 | 0.6 | -0.9 | ||||
| East England | 0.8 | -1.1 | 0.1 | -0.4 | ||||
| London | -0.5 | -0.4 | -0.6 | -0.8 | ||||
| South East | -0.5 | -1.4 | 0.3 | 0 | ||||
| South West | -0.1 | -1.1 | 0.9 | -1.3 | * | |||
| Wales | 0.2 | 0.8 | -0.1 | -0.8 | ||||
| Scotland | -1.4 | -2.1 | * | 0.4 | -0.7 | |||
| Northern Ireland | -1.2 | -1.5 | -0.6 | -0.7 | ||||
| White ethnicity | 0.2 | 2.1 | *** | 0.8 | * | 0.7 | * | |
| Has kids aged over 16 | -0.7 | -0.5 | 0.1 | -0.5 | ** | |||
| Home owner | -0.8 | -0.5 | -0.4 | 0.1 | ||||
| Workplace size 25-199 | 1.2 | ** | 0.5 | -0.2 | 0.6 | ** | ||
| Workplace size >200 | 1.7 | *** | 0.1 | 0.3 | -0.1 | |||
| Managerial or technical | 0.3 | 0.9 | -0.2 | 0.6 | ||||
| Skilled non-manual | 1 | 1.5 | * | -0.4 | 0.2 | |||
| Skilled manual | 1 | 0.2 | 0.2 | 0.2 | ||||
| Partly skilled | -1.3 | 1.9 | ** | -0.2 | -0.4 | |||
| Unskilled | 1.6 | -0.3 | -1 | -0.6 | ||||
| Logarithm of hourly pay | -0.2 | 0.8 | ** | 0.3 | 0.3 | |||
| Number of observations | 18843 | 18843 | 18843 | 18843 |
*** and ** denote statistical significance at the 1 and 5% level, respectively.
Table A6.35 Impact of onset of poor health on moving from a permanent to a temporary job
Poor general health:
| Years after onset | 0 years | 1 year | 2 years | 3 years | ||||
|---|---|---|---|---|---|---|---|---|
| Onset of poor health | 0.9 | * | 0.5 | -0.4 | * | 0 | ||
| Male | -2.5 | -0.9 | *** | -0.6 | *** | -0.1 | ||
| Age | -0.1 | 0 | 0 | 0 | ||||
| Married | -0.4 | 0.6 | *** | -0.1 | 0.1 | |||
| Other qualification | 0 | 0.8 | 0.1 | 0.1 | ||||
| GCSE | -1 | *** | 0.4 | 0 | 0.3 | |||
| A-levels | -1.2 | *** | 0.2 | 0.1 | 0.2 | |||
| Other higher qualification | -1.7 | 0.2 | 0 | 0 | ||||
| Degree | -3 | -0.6 | -0.3 | 0.2 | ||||
| North West | 0.9 | 0.4 | -0.2 | 0.2 | ||||
| Yorkshire | 1.7 | 0.1 | -0.2 | 0.3 | ||||
| East Midlands | -0.4 | ** | 0.7 | -0.2 | 0 | |||
| West Midlands | 1.1 | *** | -0.4 | -0.5 | 0.1 | |||
| East England | 0.2 | -0.3 | -0.2 | 0.2 | ||||
| London | -0.7 | * | -0.4 | -0.9 | * | 0 | ||
| South East | 0.6 | -0.2 | -0.4 | 0.1 | ||||
| South West | 0.1 | 0.2 | 0.3 | 0.3 | ||||
| Wales | 1.6 | 0.3 | -0.2 | 0.5 | ||||
| Scotland | 0.4 | -0.5 | -0.7 | -0.1 | ||||
| Northern Ireland | 0.6 | -0.1 | -1.1 | ** | 0.5 | |||
| White ethnicity | -1.6 | -0.5 | -0.1 | 0 | ||||
| Has kids aged over 16 | 0.3 | * | 0.1 | 0.1 | 0 | |||
| Home owner | 0.4 | 0.5 | 0.2 | 0 | ||||
| Workplace size 25-199 | -1.4 | 0 | -0.2 | -0.1 | ||||
| Workplace size >200 | -2.9 | *** | -0.5 | * | -0.6 | *** | -0.2 | |
| Managerial or technical | 1.2 | 0.8 | ** | 0.4 | 0.3 | |||
| Skilled non-manual | 4.6 | 1.6 | *** | 0.6 | ** | 0.5 | ** | |
| Skilled manual | 5.9 | *** | 1.9 | *** | 1.2 | *** | 0.2 | |
| Partly skilled | 7.1 | *** | 2 | *** | 1.1 | *** | 0.7 | ** |
| Unskilled | 8.7 | *** | 1.5 | ** | 0.9 | 0.5 | ||
| Logarithm of hourly pay | 1.9 | *** | 0.1 | 0.1 | 0.1 | |||
| Number of observations | 23735 | 23735 | 23735 | 23735 |
Mental health problem:
| Years after onset | 0 years | 1 year | 2 years | 3 years | ||||
|---|---|---|---|---|---|---|---|---|
| Onset of poor health | -0.4 | 0.1 | 0 | 0.5 | *** | |||
| Male | -2.1 | *** | -1.1 | *** | -0.5 | *** | -0.1 | |
| Age | -0.1 | *** | 0 | 0 | 0 | |||
| Married | 0 | 0.7 | *** | -0.2 | 0.1 | |||
| Other qualification | 1.3 | 0.7 | -0.5 | 0.4 | ||||
| GCSE | -0.2 | 0.2 | -0.2 | 0.2 | ||||
| A-levels | -0.8 | 0.3 | -0.3 | 0 | ||||
| Other higher qualification | -1.3 | -0.1 | -0.4 | -0.1 | ||||
| Degree | -2.5 | *** | -0.6 | -0.6 | -0.1 | |||
| North West | -0.3 | 0.9 | -0.1 | 0 | ||||
| Yorkshire | 0.7 | 0.6 | 0 | 0.1 | ||||
| East Midlands | 0 | 0.9 | 0.2 | 0 | ||||
| West Midlands | 0.3 | 0.1 | -0.2 | 0.6 | * | |||
| East England | -0.2 | 0.3 | 0 | 0.3 | ||||
| London | -0.8 | 0.1 | -0.5 | 0.2 | ||||
| South East | -0.4 | 0.5 | 0.2 | 0.3 | ||||
| South West | -0.1 | 1 | 0.1 | 0.8 | ** | |||
| Wales | 1.2 | 0.6 | 0.1 | 0.2 | ||||
| Scotland | -1.1 | -0.3 | -0.1 | 0.2 | ||||
| Northern Ireland | -0.1 | 0 | -0.1 | 0.4 | ||||
| White ethnicity | -2.1 | *** | -0.8 | * | 0 | 0.1 | ||
| Has kids aged over 16 | -0.2 | 0 | 0 | 0.2 | ||||
| Home owner | 0.8 | * | 0.4 | 0 | 0 | |||
| Workplace size 25-199 | -1.3 | *** | -0.5 | ** | 0 | 0 | ||
| Workplace size >200 | -2.9 | *** | -1 | *** | -0.3 | -0.1 | ||
| Managerial or technical | 1.6 | *** | 0.8 | ** | 0.1 | -0.1 | ||
| Skilled non-manual | 4.6 | *** | 1.3 | *** | 0.4 | 0.2 | ||
| Skilled manual | 6 | *** | 1.9 | *** | 0.6 | -0.2 | ||
| Partly skilled | 6.6 | *** | 2 | *** | 1 | ** | 0.4 | |
| Unskilled | 9 | *** | 2.3 | *** | 0.1 | -0.4 | ||
| Logarithm of hourly pay | 1.2 | *** | 0.1 | 0.1 | 0 | |||
| Number of observations | 22926 | 22926 | 22926 | 22926 |
Long-term illness or disability:
| Years after onset | 0 years | 1 year | 2 years | 3 years | ||||
|---|---|---|---|---|---|---|---|---|
| Onset of poor health | 1 | ** | 0.4 | -0.2 | 0 | |||
| Male | -2.2 | *** | -0.9 | *** | -0.5 | *** | -0.2 | |
| Age | -0.1 | *** | 0 | 0 | 0 | |||
| Married | 0 | 0.1 | -0.1 | 0 | ||||
| Other qualification | 0.4 | 0.8 | -0.2 | 0.1 | ||||
| GCSE | -1.1 | 0.3 | -0.3 | 0 | ||||
| A-levels | -1.5 | * | 0 | 0.1 | -0.2 | |||
| Other higher qualification | -2 | ** | 0.3 | -0.3 | -0.3 | |||
| Degree | -2.9 | *** | -0.6 | -0.7 | -0.1 | |||
| North West | 1.9 | ** | 0.9 | * | -0.3 | 0.1 | ||
| Yorkshire | 3.2 | *** | 0.3 | 0 | 0 | |||
| East Midlands | 1 | 0.8 | -0.1 | -0.2 | ||||
| West Midlands | 2.1 | ** | 0.4 | -0.5 | -0.1 | |||
| East England | 2 | ** | 0.6 | -0.1 | 0.1 | |||
| London | 0.7 | -0.1 | -0.6 | -0.1 | ||||
| South East | 1.5 | * | -0.1 | -0.2 | 0 | |||
| South West | 1.3 | 0.7 | 0.3 | 0.6 | ||||
| Wales | 2.6 | *** | 1 | * | -0.1 | 0.3 | ||
| Scotland | 0.4 | 0.2 | -0.4 | -0.1 | ||||
| Northern Ireland | 2.4 | *** | 0.4 | -0.9 | * | 0.6 | ||
| White ethnicity | -1.5 | *** | -0.4 | 0.2 | 0 | |||
| Has kids aged over 16 | 0.2 | 0.4 | * | 0.1 | -0.1 | |||
| Home owner | 0.1 | 0.2 | 0.1 | 0 | ||||
| Workplace size 25-199 | -1.5 | *** | -0.1 | -0.1 | -0.1 | |||
| Workplace size >200 | -2.7 | *** | -0.3 | -0.4 | * | -0.2 | ||
| Managerial or technical | 0.9 | * | 0.5 | 0.5 | * | 0.4 | ** | |
| Skilled non-manual | 4.2 | *** | 1.5 | *** | 0.9 | *** | 0.4 | * |
| Skilled manual | 5.2 | *** | 1.6 | *** | 1.3 | *** | 0.4 | |
| Partly skilled | 7.1 | *** | 2 | *** | 1.5 | *** | 0.6 | ** |
| Unskilled | 7.7 | *** | 2.3 | *** | 1.1 | ** | 0.3 | |
| Logarithm of hourly pay | 1.7 | *** | 0.1 | 0.2 | 0.1 | |||
| Number of observations | 22336 | 22336 | 22336 | 22336 |
*** and ** denote statistical significance at the 1 and 5% level, respectively.
Table A6.35 (continued) Impact of onset of poor health on moving from a permanent to a temporary job
Functional impairment:
| Years after onset | 0 years | 1 year | 2 years | 3 years | ||||
|---|---|---|---|---|---|---|---|---|
| Onset of poor health | 0.8 | * | 0.8 | ** | 0.1 | 0 | ||
| Male | -2.6 | *** | -0.7 | *** | -0.5 | *** | -0.2 | |
| Age | -0.1 | *** | 0 | 0 | 0 | |||
| Married | -0.1 | 0.6 | *** | 0 | 0 | |||
| Other qualification | -0.1 | 0.7 | -0.2 | 0 | ||||
| GCSE | -0.9 | 0.3 | -0.2 | 0 | ||||
| A-levels | -1.5 | * | 0.3 | 0 | -0.1 | |||
| Other higher qualification | -2 | ** | 0.2 | -0.3 | -0.2 | |||
| Degree | -3.1 | *** | -0.7 | -0.7 | -0.1 | |||
| North West | 1.6 | ** | 0.6 | 0 | 0.2 | |||
| Yorkshire | 3.4 | *** | 0 | 0.3 | 0.1 | |||
| East Midlands | 0.6 | 0.8 | 0.2 | -0.1 | ||||
| West Midlands | 1.8 | ** | 0.2 | 0 | -0.1 | |||
| East England | 2.1 | ** | -0.1 | 0 | 0.3 | |||
| London | 0.4 | -0.3 | -0.4 | -0.2 | ||||
| South East | 1.4 | * | -0.3 | 0.1 | 0.2 | |||
| South West | 1.3 | 0.5 | 0.3 | 0.5 | ||||
| Wales | 2.6 | *** | 0.8 | 0 | 0.3 | |||
| Scotland | 0.2 | -0.1 | -0.5 | 0 | ||||
| Northern Ireland | 1.8 | ** | 0 | -0.8 | 0.7 | * | ||
| White ethnicity | -1.7 | *** | -0.3 | 0.2 | -0.1 | |||
| Has kids aged over 16 | -0.2 | 0.1 | 0.1 | 0 | ||||
| Home owner | 0.1 | 0.3 | 0 | 0 | ||||
| Workplace size 25-199 | -1.6 | *** | 0.1 | -0.1 | -0.2 | |||
| Workplace size >200 | -3.1 | *** | -0.4 | -0.4 | * | -0.4 | ** | |
| Managerial or technical | 1 | ** | 0.6 | * | 0.4 | 0.3 | ||
| Skilled non-manual | 4 | *** | 1.5 | *** | 0.7 | ** | 0.4 | * |
| Skilled manual | 5.6 | *** | 1.6 | *** | 1.1 | *** | 0.2 | |
| Partly skilled | 6.9 | *** | 2.2 | *** | 1.2 | *** | 0.6 | ** |
| Unskilled | 8.2 | *** | 2.5 | *** | 0.5 | 0.3 | ||
| Logarithm of hourly pay | 1.8 | *** | 0.1 | 0.1 | 0.1 | |||
| Number of observations | 23395 | 23395 | 23395 | 23395 |
Chronic condition:
| Years after onset | 0 years | 1 year | 2 years | 3 years | ||||
|---|---|---|---|---|---|---|---|---|
| Onset of poor health | 0.3 | 1.1 | ** | -0.1 | 0.1 | |||
| Male | -2.5 | *** | -0.8 | *** | -0.6 | *** | 0 | |
| Age | -0.1 | *** | 0 | 0 | 0 | |||
| Married | -0.4 | 0.6 | ** | -0.2 | 0.1 | |||
| Other qualification | 0.4 | 0.4 | 0.6 | 0 | ||||
| GCSE | -1.3 | 0.2 | -0.1 | 0 | ||||
| A-levels | -1.5 | * | 0.3 | 0.2 | -0.1 | |||
| Other higher qualification | -2.1 | ** | -0.1 | 0 | -0.2 | |||
| Degree | -2.7 | *** | -0.6 | -0.4 | -0.2 | |||
| North West | 2 | ** | 0.5 | 0 | 0.3 | |||
| Yorkshire | 3.5 | *** | -0.1 | -0.1 | 0.1 | |||
| East Midlands | 0.8 | 0.5 | -0.3 | -0.1 | ||||
| West Midlands | 1.5 | 0 | -0.2 | 0 | ||||
| East England | 1.8 | * | -0.5 | 0 | 0.1 | |||
| London | 0.8 | -0.4 | -0.8 | 0 | ||||
| South East | 1.7 | * | -0.3 | -0.5 | 0.2 | |||
| South West | 1.2 | 0.6 | 0.2 | 0.7 | * | |||
| Wales | 2.6 | *** | 0.8 | 0 | 0.5 | |||
| Scotland | 0.3 | -0.4 | -0.6 | 0 | ||||
| Northern Ireland | 1.6 | * | -0.4 | -1 | * | 0.6 | ||
| White ethnicity | -2.1 | *** | -0.5 | 0.3 | 0 | |||
| Has kids aged over 16 | 0.2 | 0.1 | 0.1 | 0 | ||||
| Home owner | 0.2 | 0.2 | 0.3 | 0.1 | ||||
| Workplace size 25-199 | -1.7 | *** | -0.1 | -0.2 | 0 | |||
| Workplace size >200 | -3.3 | *** | -0.4 | -0.5 | ** | -0.1 | ||
| Managerial or technical | 1.1 | ** | 0.7 | ** | 0.3 | 0.2 | ||
| Skilled non-manual | 4.5 | *** | 1.9 | *** | 0.6 | * | 0.4 | |
| Skilled manual | 5.6 | *** | 1.6 | *** | 0.8 | * | 0.1 | |
| Partly skilled | 7.1 | *** | 2.2 | *** | 1.1 | ** | 0.6 | * |
| Unskilled | 9 | *** | 2.5 | *** | 0.8 | 0.1 | ||
| Logarithm of hourly pay | 1.8 | *** | 0.2 | 0.1 | 0.1 | |||
| Number of observations | 18843 | 18843 | 18843 | 18843 |
*** and ** denote statistical significance at the 1 and 5% level, respectively.
Table A6.36 Impact of onset of poor health on moving from a high-paid to a low-paid job
Poor general health:
| Years after onset | 0 years | 1 year | 2 years | 3 years | ||||
|---|---|---|---|---|---|---|---|---|
| Onset of poor health | -0.2 | -0.1 | 0 | 0.1 | ||||
| Male | 0 | 0.1 | 0 | -0.1 | ||||
| Age | 0 | 0 | 0 | 0 | ||||
| Married | -0.5 | -0.3 | -0.2 | -0.1 | ||||
| Other qualification | 0.8 | -0.1 | -0.1 | -0.5 | ** | |||
| GCSE | 0.4 | -0.2 | 0 | 0 | ||||
| A-levels | 0.8 | *** | 0.3 | 0.2 | 0.1 | |||
| Other higher qualification | 1.5 | ** | 0.6 | 0.3 | 0.3 | |||
| Degree | 2.2 | * | 0.8 | ** | 0.6 | * | 0.3 | |
| North West | -0.5 | -0.2 | 0.2 | -0.3 | ||||
| Yorkshire | 0 | ** | -0.6 | 0.2 | -0.1 | |||
| East Midlands | -0.1 | *** | -0.4 | 0.3 | 0 | |||
| West Midlands | -1.1 | *** | -0.6 | -0.3 | -0.5 | |||
| East England | -0.3 | -0.1 | 0 | 0.1 | ||||
| London | 0.5 | -0.2 | 0.2 | 0 | ||||
| South East | 0 | 0 | 0.1 | 0 | ||||
| South West | -0.2 | * | -0.8 | 0 | -0.2 | |||
| Wales | -0.1 | -0.7 | -0.1 | -0.1 | ||||
| Scotland | -0.4 | -0.6 | 0.1 | -0.1 | ||||
| Northern Ireland | -0.3 | -0.4 | -0.4 | -0.5 | ||||
| White ethnicity | -0.1 | -0.1 | 0.1 | -0.1 | ||||
| Has kids aged over 16 | 0 | 0.3 | 0 | 0.2 | ||||
| Home owner | 0.3 | 0 | -0.1 | 0.2 | ||||
| Workplace size 25-199 | 0 | -0.2 | 0 | -0.1 | ||||
| Workplace size >200 | -0.5 | -0.6 | *** | 0 | 0 | |||
| Managerial or technical | -0.4 | -0.8 | * | 0.4 | 0.3 | * | ||
| Skilled non-manual | -0.9 | -0.9 | ** | 0.2 | 0.4 | * | ||
| Skilled manual | -0.3 | -1 | ** | 0 | 0.4 | * | ||
| Partly skilled | 0 | ** | -0.8 | * | 0.2 | 0.3 | ||
| Unskilled | 0.8 | 0.1 | 0.4 | 0.3 | ||||
| Logarithm of hourly pay | -0.6 | * | -0.2 | ** | -0.2 | *** | 0 | |
| Number of observations | 23735 | 23735 | 23735 | 23735 |
Mental health problem:
| Years after onset | 0 years | 1 year | 2 years | 3 years | ||||
|---|---|---|---|---|---|---|---|---|
| Onset of poor health | 0.4 | 0.5 | *** | 0 | 0.3 | ** | ||
| Male | 0.1 | -0.2 | 0 | -0.2 | * | |||
| Age | 0 | ** | 0 | ** | 0 | 0 | ||
| Married | -0.4 | * | -0.1 | 0 | -0.2 | |||
| Other qualification | 0.7 | 0.1 | -0.4 | -0.3 | ||||
| GCSE | 0.5 | 0 | -0.1 | 0.3 | ||||
| A-levels | 0.9 | ** | 0.6 | 0.1 | 0.3 | |||
| Other higher qualification | 1.1 | *** | 0.9 | ** | 0.1 | 0.3 | ||
| Degree | 1.8 | *** | 0.7 | * | 0.4 | 0.5 | * | |
| North West | 0.2 | -1.2 | ** | 0.3 | 0.2 | |||
| Yorkshire | 0.4 | -1.3 | ** | 0.2 | 0.5 | |||
| East Midlands | 0.3 | -1 | * | 0.2 | 0.4 | |||
| West Midlands | -0.7 | -1.2 | * | -0.2 | 0.6 | * | ||
| East England | 0 | -0.9 | 0.2 | 0.5 | ||||
| London | 0.4 | -0.6 | 0 | 0.5 | * | |||
| South East | 0.3 | -0.9 | 0.6 | 0.3 | ||||
| South West | 0.2 | -1.7 | *** | 0.4 | 0.3 | |||
| Wales | 0.7 | -1.8 | *** | 0.2 | 0.4 | |||
| Scotland | 0.2 | -1.3 | ** | 0.3 | 0.4 | |||
| Northern Ireland | -0.4 | -1.2 | * | -0.5 | 0.2 | |||
| White ethnicity | -0.8 | ** | 0.3 | -0.2 | 0.3 | |||
| Has kids aged over 16 | -0.3 | 0.6 | *** | 0.1 | 0 | |||
| Home owner | -0.1 | 0.3 | 0 | 0.1 | ||||
| Workplace size 25-199 | -0.1 | -0.1 | -0.1 | -0.1 | ||||
| Workplace size >200 | -0.6 | ** | -0.4 | ** | -0.1 | 0 | ||
| Managerial or technical | -0.3 | -0.6 | 0.3 | 0.4 | ** | |||
| Skilled non-manual | -0.7 | -0.9 | ** | 0.3 | 0.3 | |||
| Skilled manual | -0.7 | -0.9 | ** | 0.3 | 0.3 | |||
| Partly skilled | -0.2 | -0.8 | 0.2 | 0.5 | * | |||
| Unskilled | 0.9 | -0.4 | 0.1 | 0.6 | ||||
| Logarithm of hourly pay | -0.3 | ** | -0.1 | -0.2 | ** | 0.1 | ||
| Number of observations | 22926 | 22926 | 22926 | 22926 |
Long-term illness or disability:
| Years after onset | 0 years | 1 year | 2 years | 3 years | ||||
|---|---|---|---|---|---|---|---|---|
| Onset of poor health | 0 | 0.2 | 0 | -0.1 | ||||
| Male | 0.3 | -0.1 | -0.2 | -0.3 | *** | |||
| Age | -0.1 | *** | 0 | ** | 0 | 0 | ||
| Married | -0.3 | -0.2 | -0.3 | ** | -0.1 | |||
| Other qualification | 0.6 | -0.2 | 0.2 | -0.2 | ||||
| GCSE | 0 | -0.4 | 0.4 | ** | 0.2 | |||
| A-levels | 0.5 | 0 | 0.5 | ** | 0.4 | ** | ||
| Other higher qualification | 1.3 | *** | 0.3 | 0.7 | ** | 0.7 | *** | |
| Degree | 1.7 | *** | 0.4 | 1.2 | *** | 0.8 | *** | |
| North West | -0.6 | -0.4 | 0 | 0.1 | ||||
| Yorkshire | 0 | -0.9 | 0.4 | 0.3 | ||||
| East Midlands | -0.1 | -0.9 | 0.3 | 0.3 | ||||
| West Midlands | -1.1 | * | -0.8 | -0.4 | 0 | |||
| East England | -0.6 | -0.3 | 0 | 0.5 | ||||
| London | 0.1 | -0.6 | 0 | 0.4 | ||||
| South East | -0.3 | -0.5 | -0.1 | 0.3 | ||||
| South West | -0.1 | -0.9 | -0.2 | 0.5 | ||||
| Wales | -0.1 | -1.1 | * | -0.1 | 0.5 | |||
| Scotland | -0.3 | -0.8 | -0.1 | 0.2 | ||||
| Northern Ireland | -0.2 | -0.5 | -0.5 | -0.1 | ||||
| White ethnicity | -0.3 | -0.1 | 0.1 | 0.3 | * | |||
| Has kids aged over 16 | 0.1 | 0.2 | 0.1 | 0.1 | ||||
| Home owner | 0.4 | -0.1 | 0 | 0 | ||||
| Workplace size 25-199 | 0.1 | -0.2 | -0.2 | 0 | ||||
| Workplace size >200 | -0.5 | * | -0.4 | * | -0.4 | ** | 0.2 | |
| Managerial or technical | -0.7 | -0.4 | 0 | 0.3 | ** | |||
| Skilled non-manual | -1.1 | ** | -0.7 | 0.1 | 0.3 | |||
| Skilled manual | -1.1 | * | -0.7 | 0.1 | 0.8 | *** | ||
| Partly skilled | -0.4 | -0.8 | * | 0.2 | 0.5 | ** | ||
| Unskilled | -0.2 | 0 | 0.9 | 1.2 | * | |||
| Logarithm of hourly pay | -0.6 | *** | -0.2 | -0.1 | 0 | |||
| Number of observations | 22336 | 22336 | 22336 | 22336 |
*** and ** denote statistical significance at the 1 and 5% level, respectively.
Table A6.36 (continued) Impact of onset of poor health on moving from a high-paid to a low-paid job
Functional impairment:
| Years after onset | 0 years | 1 year | 2 years | 3 years | ||||
|---|---|---|---|---|---|---|---|---|
| Onset of poor health | -0.1 | 0.3 | 0 | -0.1 | ||||
| Male | 0 | 0 | -0.1 | -0.2 | ||||
| Age | 0 | *** | 0 | *** | 0 | 0 | ||
| Married | -0.4 | * | -0.1 | -0.2 | -0.2 | |||
| Other qualification | 0.8 | * | -0.3 | 0 | -0.3 | |||
| GCSE | 0.2 | -0.4 | 0.3 | 0.2 | ||||
| A-levels | 0.4 | 0.1 | 0.4 | 0.2 | ||||
| Other higher qualification | 1.4 | *** | 0.5 | 0.4 | 0.6 | ** | ||
| Degree | 1.9 | *** | 0.3 | 0.8 | ** | 0.6 | ** | |
| North West | -0.1 | -0.4 | -0.1 | -0.1 | ||||
| Yorkshire | 0.2 | -0.8 | 0.1 | 0.1 | ||||
| East Midlands | 0.1 | -0.8 | -0.2 | 0.1 | ||||
| West Midlands | -0.9 | -0.9 | * | -0.5 | -0.2 | |||
| East England | -0.3 | -0.2 | -0.2 | 0.4 | ||||
| London | 0.4 | -0.5 | -0.1 | 0.1 | ||||
| South East | 0.3 | -0.4 | -0.2 | 0.2 | ||||
| South West | -0.2 | -1.1 | ** | -0.1 | 0.1 | |||
| Wales | 0 | -1.2 | ** | -0.2 | 0.2 | |||
| Scotland | -0.1 | -0.7 | -0.2 | -0.1 | ||||
| Northern Ireland | -0.2 | -0.6 | -0.6 | -0.3 | ||||
| White ethnicity | -0.1 | -0.3 | 0 | 0.2 | ||||
| Has kids aged over 16 | -0.1 | 0.4 | * | 0.1 | 0.1 | |||
| Home owner | 0.3 | 0.1 | -0.1 | 0.1 | ||||
| Workplace size 25-199 | -0.1 | 0 | -0.1 | -0.1 | ||||
| Workplace size >200 | -0.7 | *** | -0.3 | -0.2 | 0 | |||
| Managerial or technical | -0.4 | -0.4 | 0.2 | 0.3 | ||||
| Skilled non-manual | -0.6 | -0.7 | 0.2 | 0.2 | ||||
| Skilled manual | -0.6 | -0.8 | * | 0 | 0.6 | * | ||
| Partly skilled | -0.1 | -0.8 | * | 0.1 | 0.4 | * | ||
| Unskilled | 0 | -0.2 | 0.3 | 0.8 | ||||
| Logarithm of hourly pay | -0.6 | *** | -0.1 | -0.1 | 0 | |||
| Number of observations | 23395 | 23395 | 23395 | 23395 |
Chronic condition:
| Years after onset | 0 years | 1 year | 2 years | 3 years | ||||
|---|---|---|---|---|---|---|---|---|
| Onset of poor health | 0 | 0.7 | * | -0.3 | -0.3 | ** | ||
| Male | 0 | 0.1 | 0 | -0.3 | * | |||
| Age | -0.1 | *** | 0 | *** | 0 | 0 | ||
| Married | -0.3 | -0.1 | -0.2 | -0.2 | ||||
| Other qualification | 0.9 | * | -0.1 | 0.1 | -0.4 | |||
| GCSE | 0.5 | -0.3 | 0.1 | 0.1 | ||||
| A-levels | 0.8 | * | 0.4 | 0.2 | 0.3 | |||
| Other higher qualification | 1.3 | *** | 0.8 | 0.4 | 0.4 | |||
| Degree | 2.3 | *** | 0.7 | 0.7 | ** | 0.3 | ||
| North West | -0.3 | -0.9 | 0.1 | 0.1 | ||||
| Yorkshire | 0.4 | -1.2 | * | 0.3 | 0.3 | |||
| East Midlands | 0.7 | -0.9 | 0.3 | 0.1 | ||||
| West Midlands | -0.8 | -1.1 | -0.2 | -0.3 | ||||
| East England | -0.2 | -0.2 | -0.4 | 0.4 | ||||
| London | 0.6 | -0.7 | 0.3 | 0.3 | ||||
| South East | 0.2 | -0.3 | -0.2 | 0.1 | ||||
| South West | 0.2 | -1.1 | * | 0.1 | 0.4 | |||
| Wales | 0 | -0.7 | -0.1 | 0.3 | ||||
| Scotland | 0.2 | -1 | 0 | 0.2 | ||||
| Northern Ireland | -0.2 | -0.6 | -0.5 | 0.1 | ||||
| White ethnicity | -0.4 | -0.3 | 0 | 0.2 | ||||
| Has kids aged over 16 | -0.1 | 0.3 | * | 0 | 0 | |||
| Home owner | 0.4 | 0.1 | 0.1 | 0 | ||||
| Workplace size 25-199 | -0.3 | -0.1 | 0.1 | 0 | ||||
| Workplace size >200 | -0.7 | ** | -0.4 | * | 0 | 0 | ||
| Managerial or technical | -0.7 | -0.9 | * | 0.2 | 0.1 | |||
| Skilled non-manual | -1.1 | * | -1.2 | ** | 0.3 | 0.2 | ||
| Skilled manual | -0.8 | -1.5 | *** | 0 | 0.4 | |||
| Partly skilled | -0.5 | -1.1 | ** | 0.4 | 0.2 | |||
| Unskilled | -0.3 | 0.1 | 0.2 | -0.1 | ||||
| Logarithm of hourly pay | -0.6 | *** | -0.2 | * | -0.1 | 0 | ||
| Number of observations | 18843 | 18843 | 18843 | 18843 |
*** and ** denote statistical significance at the 1 and 5% level, respectively.
Table A6.37 Impact of onset of poor health on moving from a full-time to a part-time job
Poor general health:
| Years after onset | 0 years | 1 year | 2 years | 3 years | ||||
|---|---|---|---|---|---|---|---|---|
| Onset of poor health | 0 | 0.1 | 0.8 | ** | 0.3 | |||
| Male | -2.3 | -1.6 | *** | -1.1 | *** | -1 | *** | |
| Age | 0 | 0 | * | 0 | 0 | |||
| Married | 0.6 | 0.8 | *** | 0.4 | ** | 0 | ||
| Other qualification | -0.5 | 0.7 | 0.1 | 0.3 | ||||
| GCSE | -0.1 | *** | 0.9 | ** | -0.5 | 0.3 | ||
| A-levels | 0.2 | 0.7 | * | -0.3 | 0.8 | ** | ||
| Other higher qualification | 0.2 | ** | 1 | ** | -0.2 | 1.2 | *** | |
| Degree | 0.7 | 1 | ** | 0 | 1 | *** | ||
| North West | 0.4 | 0.2 | -0.2 | -0.2 | ||||
| Yorkshire | 1.1 | 0.7 | 0 | -0.1 | ||||
| East Midlands | -0.2 | 0.7 | -0.3 | 0.2 | ||||
| West Midlands | 0 | 0.8 | -0.1 | -0.4 | ||||
| East England | 0.4 | 0.7 | -0.4 | 0.2 | ||||
| London | 1 | 1.3 | ** | 0 | -0.1 | |||
| South East | 0.4 | 1.2 | ** | -0.2 | 0 | |||
| South West | 0.9 | 1.4 | ** | 0 | -0.3 | |||
| Wales | 0.4 | 1.2 | ** | -0.3 | 0.6 | |||
| Scotland | 0.1 | 0.5 | -0.5 | -0.4 | ||||
| Northern Ireland | 0.2 | 0.7 | -0.1 | -0.2 | ||||
| White ethnicity | -0.5 | 0.5 | 0.1 | -0.2 | ||||
| Has kids aged over 16 | 1 | -0.9 | *** | -0.8 | *** | -0.6 | *** | |
| Home owner | -0.2 | -0.1 | -0.1 | 0 | ||||
| Workplace size 25-199 | 0.6 | -0.1 | -0.2 | 0.1 | ||||
| Workplace size >200 | -0.1 | -0.3 | -0.2 | -0.3 | ||||
| Managerial or technical | 1.2 | *** | -1.5 | ** | 0.2 | -0.7 | ||
| Skilled non-manual | 0.3 | -2.3 | *** | -0.4 | -1 | * | ||
| Skilled manual | 0.4 | ** | -2 | *** | 0.1 | -0.9 | * | |
| Partly skilled | 0.6 | -1.5 | ** | -0.5 | -1.3 | ** | ||
| Unskilled | 0 | ** | -2.4 | *** | -0.9 | -1.5 | ** | |
| Logarithm of hourly pay | -1.6 | -0.7 | *** | -0.4 | *** | -0.2 | ||
| Number of observations | 23735 | 23735 | 23735 | 23735 |
Mental health problem:
| Years after onset | 0 years | 1 year | 2 years | 3 years | ||||
|---|---|---|---|---|---|---|---|---|
| Onset of poor health | 0.8 | ** | 1.1 | *** | 0.6 | ** | 0.1 | |
| Male | -2.3 | *** | -1.4 | *** | -1.1 | *** | -0.9 | *** |
| Age | 0 | * | 0 | ** | 0 | 0 | ||
| Married | 0.6 | ** | 0.8 | *** | 0.1 | 0.1 | ||
| Other qualification | 0.2 | 0.2 | 0.7 | 0.7 | ||||
| GCSE | 0.1 | 0.3 | 0.2 | 0.5 | ||||
| A-levels | 0.3 | 0.5 | 0.4 | 0.8 | ** | |||
| Other higher qualification | 0.1 | 0.8 | 0.6 | 1.7 | *** | |||
| Degree | 1 | 0.8 | 0.4 | 1 | *** | |||
| North West | 0.7 | -1.1 | * | 0.1 | -0.5 | |||
| Yorkshire | 0.6 | -0.4 | -0.4 | -0.6 | ||||
| East Midlands | -0.2 | -0.9 | 0.1 | 0.1 | ||||
| West Midlands | -0.2 | -0.6 | -0.1 | -0.6 | ||||
| East England | 0.5 | -0.4 | -0.2 | -0.5 | ||||
| London | -0.2 | 0.1 | 0.1 | -0.6 | ||||
| South East | 0.3 | 0.1 | 0.2 | -0.1 | ||||
| South West | 0.6 | -0.4 | 0.1 | -0.1 | ||||
| Wales | -0.3 | -0.2 | 0.2 | -0.2 | ||||
| Scotland | -0.3 | -0.8 | -0.5 | -0.4 | ||||
| Northern Ireland | -0.6 | -0.5 | 0.5 | -0.3 | ||||
| White ethnicity | -0.8 | * | 0.6 | ** | -0.1 | -0.1 | ||
| Has kids aged over 16 | 0.9 | *** | -1.3 | *** | -0.8 | *** | -0.7 | *** |
| Home owner | 0.2 | 0.1 | -0.4 | * | -0.2 | |||
| Workplace size 25-199 | 0.2 | 0 | -0.4 | * | -0.4 | |||
| Workplace size >200 | -0.5 | -0.5 | ** | -0.4 | -0.2 | |||
| Managerial or technical | 0.2 | -0.9 | 0 | -0.2 | ||||
| Skilled non-manual | -0.5 | -1.5 | ** | -0.7 | -0.3 | |||
| Skilled manual | -0.5 | -1.4 | ** | -0.5 | -0.8 | * | ||
| Partly skilled | -0.1 | -0.7 | -0.9 | * | -0.6 | |||
| Unskilled | -1.4 | * | -0.9 | -1.2 | * | -1 | * | |
| Logarithm of hourly pay | -1.6 | *** | -0.7 | *** | -0.3 | ** | -0.1 | |
| Number of observations | 22926 | 22926 | 22926 | 22926 |
Long-term illness or disability:
| Years after onset | 0 years | 1 year | 2 years | 3 years | ||||
|---|---|---|---|---|---|---|---|---|
| Onset of poor health | 0.9 | *** | 0.3 | 0.4 | 0.2 | |||
| Male | -2.5 | *** | -1.8 | *** | -1.2 | *** | -0.9 | *** |
| Age | 0 | * | 0 | 0 | 0 | |||
| Married | 0.6 | ** | 0.9 | *** | 0.5 | ** | -0.1 | |
| Other qualification | -0.1 | 0.3 | 0.3 | 0.3 | ||||
| GCSE | -0.2 | 0.1 | -0.5 | 0.6 | ||||
| A-levels | 0.2 | 0.2 | -0.4 | 1 | *** | |||
| Other higher qualification | 0.5 | 0.7 | -0.3 | 1.4 | *** | |||
| Degree | 1.1 | * | 0.5 | 0.2 | 0.7 | ** | ||
| North West | 0.3 | 0.3 | 0.5 | -1 | * | |||
| Yorkshire | 0.1 | 0.9 | 0.3 | -0.8 | ||||
| East Midlands | -0.6 | 0.9 | -0.1 | -0.2 | ||||
| West Midlands | -0.4 | 1.1 | * | -0.1 | -0.6 | |||
| East England | 0.1 | 0.7 | -0.1 | -0.6 | ||||
| London | 0.4 | 1.2 | ** | 0.4 | -0.7 | |||
| South East | -0.2 | 1 | * | 0.1 | -0.3 | |||
| South West | 0.5 | 1.4 | ** | 0.2 | -0.3 | |||
| Wales | 0 | 0.8 | 0.1 | 0.4 | ||||
| Scotland | -0.4 | 0.8 | -0.1 | -0.8 | ||||
| Northern Ireland | -0.4 | 0.7 | -0.3 | 0.2 | ||||
| White ethnicity | -0.5 | 0.1 | 0 | 0.2 | ||||
| Has kids aged over 16 | 1 | *** | -0.7 | *** | -0.6 | *** | -0.5 | ** |
| Home owner | -0.3 | 0 | -0.1 | -0.3 | ||||
| Workplace size 25-199 | 0.7 | ** | -0.1 | -0.4 | * | 0 | ||
| Workplace size >200 | 0 | -0.4 | -0.4 | -0.4 | ||||
| Managerial or technical | 0.7 | -1.1 | * | 0.1 | -0.9 | |||
| Skilled non-manual | 0 | -2.2 | *** | -0.5 | -1.2 | ** | ||
| Skilled manual | 0.3 | -1.7 | ** | 0 | -1.4 | ** | ||
| Partly skilled | 0.8 | -1.6 | ** | -0.7 | -1.6 | *** | ||
| Unskilled | -0.3 | -1.8 | ** | -0.9 | -1.9 | *** | ||
| Logarithm of hourly pay | -1.5 | *** | -0.9 | *** | -0.5 | *** | -0.3 | ** |
| Number of observations | 22336 | 22336 | 22336 | 22336 |
*** and ** denote statistical significance at the 1 and 5% level, respectively.
Table A6.37 (continued) Impact of onset of poor health on moving from a full-time to a part-time job
Functional impairment:
| Years after onset | 0 years | 1 year | 2 years | 3 years | ||||
|---|---|---|---|---|---|---|---|---|
| Onset of poor health | 0.9 | ** | 0.7 | * | 0.7 | ** | 0.1 | |
| Male | -2.6 | *** | -1.7 | *** | -1.2 | *** | -0.9 | *** |
| Age | 0 | * | 0 | ** | 0 | 0 | * | |
| Married | 0.7 | ** | 0.9 | *** | 0.1 | 0 | ||
| Other qualification | -0.3 | 0.4 | -0.2 | 0.3 | ||||
| GCSE | -0.1 | 0.4 | -0.9 | * | 0.6 | * | ||
| A-levels | 0.3 | 0.4 | -0.8 | 1 | *** | |||
| Other higher qualification | 0.6 | 0.8 | -0.4 | 1.2 | *** | |||
| Degree | 0.9 | 0.7 | -0.3 | 1.1 | *** | |||
| North West | 0.8 | 0 | 0.3 | -0.5 | ||||
| Yorkshire | 0.9 | 0.8 | 0.3 | -0.4 | ||||
| East Midlands | -0.4 | 0.7 | 0.1 | -0.1 | ||||
| West Midlands | 0.2 | 1 | * | 0.1 | -0.3 | |||
| East England | 0.7 | 0.5 | -0.1 | -0.1 | ||||
| London | 0.9 | 1.3 | ** | 0.4 | -0.4 | |||
| South East | 0.3 | 1.2 | ** | 0.3 | 0 | |||
| South West | 0.5 | 1.4 | ** | 0.4 | 0.1 | |||
| Wales | 0.7 | 1.1 | * | -0.2 | 0.4 | |||
| Scotland | 0 | 0.6 | -0.3 | -0.5 | ||||
| Northern Ireland | -0.1 | 0.4 | -0.3 | 0.2 | ||||
| White ethnicity | -0.4 | 0.5 | -0.1 | 0.1 | ||||
| Has kids aged over 16 | 1 | *** | -1 | *** | -0.6 | *** | -0.7 | *** |
| Home owner | -0.3 | -0.1 | 0.1 | -0.4 | * | |||
| Workplace size 25-199 | 0.5 | -0.1 | -0.2 | -0.2 | ||||
| Workplace size >200 | -0.3 | -0.3 | -0.2 | -0.5 | ** | |||
| Managerial or technical | 0.8 | -1.2 | * | 0.3 | -0.7 | |||
| Skilled non-manual | 0.1 | -2.2 | *** | -0.4 | -1.1 | ** | ||
| Skilled manual | 0.5 | -1.8 | ** | 0.3 | -1.2 | ** | ||
| Partly skilled | 0.5 | -1.7 | ** | -0.5 | -1.1 | ** | ||
| Unskilled | -0.4 | -2 | ** | -0.6 | -1.6 | ** | ||
| Logarithm of hourly pay | -1.5 | *** | -0.7 | *** | -0.4 | *** | -0.2 | * |
| Number of observations | 23395 | 23395 | 23395 | 23395 |
Chronic condition:
| Years after onset | 0 years | 1 year | 2 years | 3 years | ||||
|---|---|---|---|---|---|---|---|---|
| Onset of poor health | 0.6 | 0.9 | * | 0.8 | ** | 0.2 | ||
| Male | -2.3 | *** | -1.9 | *** | -1.1 | *** | -1 | *** |
| Age | 0 | ** | -0.1 | *** | 0 | 0 | ||
| Married | 0.5 | 1.2 | *** | 0.3 | -0.1 | |||
| Other qualification | 0.3 | 0.4 | 0.6 | -0.1 | ||||
| GCSE | -0.2 | 0.9 | * | 0 | 0 | |||
| A-levels | 0.7 | 0.7 | 0.1 | 0.6 | ||||
| Other higher qualification | 0.6 | 1.1 | * | 0.3 | 0.7 | |||
| Degree | 1 | 0.9 | * | 0.7 | 0.7 | |||
| North West | 0.8 | -0.4 | 0.4 | 0 | ||||
| Yorkshire | 1.1 | 0.6 | 0 | 0.4 | ||||
| East Midlands | 0.1 | 1 | -0.1 | 0.4 | ||||
| West Midlands | 0.3 | 0.7 | 0.2 | 0.5 | ||||
| East England | 0.7 | 0.6 | -0.1 | 0.2 | ||||
| London | 0.8 | 1 | 0.4 | 0.3 | ||||
| South East | 0.5 | 1.5 | ** | 0.2 | 0.6 | |||
| South West | 0.8 | 1 | 0.5 | 0.1 | ||||
| Wales | 1.2 | 1 | -0.2 | 1.1 | * | |||
| Scotland | 0.4 | 0.3 | -0.5 | 0.3 | ||||
| Northern Ireland | 0.1 | 0.4 | -0.1 | 0.5 | ||||
| White ethnicity | -0.7 | 0.6 | * | 0 | -0.1 | |||
| Has kids aged over 16 | 1 | *** | -1 | *** | -0.6 | *** | -0.4 | ** |
| Home owner | -0.1 | 0.2 | -0.2 | -0.1 | ||||
| Workplace size 25-199 | 0.8 | *** | 0.1 | -0.5 | * | 0.2 | ||
| Workplace size >200 | 0.1 | -0.2 | -0.4 | -0.1 | ||||
| Managerial or technical | 1.6 | *** | -1.7 | ** | 0.2 | -0.8 | ||
| Skilled non-manual | 0.7 | -2.4 | *** | -0.2 | -1 | * | ||
| Skilled manual | 0.8 | -1.9 | ** | 0.1 | -1 | |||
| Partly skilled | 1.2 | * | -1.9 | ** | -0.4 | -1.2 | ** | |
| Unskilled | 0.9 | -1.5 | -0.7 | -1.5 | ** | |||
| Logarithm of hourly pay | -1.4 | *** | -0.9 | *** | -0.4 | *** | -0.4 | *** |
| Number of observations | 18843 | 18843 | 18843 | 18843 |
*** and **: statistically significant at the 1 and 5% level, respectively.
-
see Bartley (1994) for a review. ↩
-
The reversed causal relationship between health state and work transitions is explored by Curnock et al. (2016), who used the first 4 waves of Understanding Society (USoc) to assess the impact of employment and welfare transitions on health for recipients of out-of-work disability benefits in the UK. The impact on health of employment and welfare transitions for those receiving out of work disability benefits in the UK ↩
-
There is an established international literature on the impact of unemployment on health. See, for example, Flint et al. (2013) using British data, Tøge and Blekesaune (2015) using European cross-country data, Browning and Heinesen (2012) using Danish data, and Schmitz (2011) and Marcus (2013) using German data. ↩
-
The terms negative and positive, when referred to health and work transitions, are purely conventional. They denote a switch between 2 opposite, mutually exclusive health states or work conditions, where the final state/condition is considered better than the initial one. For example, moving from poor to good health is considered as a positive health transition, likewise moving from not-employed to employed or from a part- to a full-time job (moving to a full-time job may not denote a positive change for some individuals). ↩
-
According to the Equality Act 2010 a person is defined as having a disability if they have a physical or mental impairment that has a ‘substantial’ and ‘long-term’ negative effect on their ability to perform normal day-to-day activities. A long-term effect is one that has lasted, or is likely to last, for at least 12 months. ↩
-
See Understanding Society survey timeline for USoc and BHPS’s survey implementation dates. ↩
-
The question on self-assessed health was asked through face-to-face interview in all 8 USoc waves, and became part of the self-completion questionnaire from Wave 2 onwards. Where subjects responded using both instruments (face-to-face interview and self-completion questionnaire) we prioritised and used the latter instrument. However, face-to-face responses were used when information was missing from self-completion answers. Using self-completion instrument is preferred because previous research has shown that when face-to-face survey instruments are used, people in poor health are inclined to under-report ill-health because they feel ashamed of their health state (for example, Bharadwaj et al. (2017) find that mental illness is more likely to be under-reported in surveys than other health conditions due to the respondents’ fear of being stigmatised or socially sanctioned). ↩
-
The GHQ is a 12-item questionnaire generally used to identify non-psychotic and minor psychiatric conditions – see definitions section for details. There is no objective consensus on which cut-off to use for identification of conditions. However, for general population use the 2/3 cut-off is most commonly used in the literature (Cano et al, 2001). ↩
-
See definitions section for the list of functional impairments. ↩
-
The chronic conditions considered are listed in the table of definitions. ↩
-
As these conditions are persistent by definition, once they are reported at a given wave it is assumed that they are observed in all subsequent waves for the same individual. ↩
-
See Quality and Methodology Information of ‘Labour market overview, UK: May 2019‘ (Section 7). This definition of employment is adopted also by the Work and Health Unit (for example, see Characteristics of disabled people in employment: data for April to June 2017. ↩
-
The ONS use a definition of low pay in line with that defined by the OECD, which is below two-thirds of median hourly earnings. High pay is defined as more than 1.5 times median hourly earnings. ↩
-
We recognise that a binary indicator for ethnicity is not ideal. However, sample sizes preclude the inclusion of a more granular breakdown. ↩
-
Government Office Regions, now referred to as Regions, are the highest tier of sub-national division in England. Nine regions had officially devolved government functions between 1994 and 2011. Although they no longer fulfil this role they continue to be used for statistical and some administrative purposes. ↩
-
Unfortunately, we could not use the same definition of large employer as the EU and Companies House (according to which small employers have 1 to 49 employees, medium 50 to 249 and large 250 or more) because the USoc questionnaire uses the following bands: 1 to 2, 3 to 9, 10 to 24, 25 to 49, 50 to 99, 10 to 199, 200 to 499, 500 to 999, and 1000 or more. We used the 200 employees threshold to define large workplaces as it is the closest to 250. Note that USoc allows respondents who do not know the exact size of their workplace to indicate whether they believe the number of employees is fewer than 25 or 25 or more. This information is used to increase sample sizes for workplaces with 1 to 24 employees, and this is the reason that small workplaces are defined as having 1 to 24 (instead of 1 to 49) employees. ↩
-
See table of definitions. ↩
-
More uncertainty surrounds the impact estimates for the exit from poor (mental) health as missing information on individuals’ health affects both those who experience the exit and those who do not. As it is difficult to predict whether under-reporting of poor health is more serious an issue for the former compared to the latter group, it is hard to speculate whether the real impact is over- or under-estimated. ↩
-
As explained by Meyer and Mok (2013) and Jones et al. (2018), including only the subset of individuals at risk of making the health transition improves the precision of the estimated coefficients of the control variables included in the multivariate regression where the effect of the health transition on the work transition is estimated. ↩
-
Impact estimates obtained by means of logistic models in the presence of ‘rare events’ (in our case work transitions as they are experienced by a very low number of individuals) may be misleading. This is because the maximum likelihood estimation method used in such models is known to suffer from small-sample bias. Penalised likelihood is a general approach to reducing small-sample bias (see King and Zeng (2001); a general discussion is available at Statistical Horizens: Logistical Regression for Rare Events. ↩
-
Cohorts are groups of individuals who experienced health transitions over different time periods. ↩
-
The choice of this model over alternative ones (notably, the linear regression model) is explained in Appendix 3. ↩
-
For a detailed explanation of the counterfactual approach to impact evaluation see, for example, Blundell and Costa Dias (2000). ↩
-
The health transition dummy indicates the impact of experiencing a health transition, regardless of when this transition occurs. Each time dummy shows the additional contribution to the impact of the time period in which the health transition takes place. ↩
-
On average, across all individuals, the time observed between any 2 USoc consecutive interview dates is 367.2 days. Therefore, in this report we will refer to the time difference between 2 waves as one year. See Appendix 4 for more details about the constructions of the durations. ↩
-
See Appendix 4 for more technical explanations of the survival analysis methodologies. ↩
-
See Appendix 4 for more details on these methods. ↩
-
See Appendix 4 for an explanation of how the probabilities of survival are calculated. ↩
-
The optimal matching algorithm derives a measure of dissimilarity between 2 sequences as a function of the number and type of operations on the elements of these sequences that are necessary to transform one sequence into the other. Such operations can be combinations of insertions/deletions and substitutions of elements. ↩
-
The full results of the logit regression estimates, including the statistical association between the other covariates and work transitions, are provided in Appendix 6. ↩
-
It is possible that the smaller sample sizes used in the estimation of impacts on in-work transitions compared to out of employment and activity transitions are responsible for the lack of significance for most impacts (statistical significance for small impacts can only be detected using a large number of observations). ↩
-
The role of moderators within the regression framework adopted to estimate overall impacts is explored by adding, among the regressors, 4 interaction terms (each term is obtained as the product of the health transition dummy variable and a binary indicator for the specific characteristic). ↩
-
The USoc questionnaire refers to a workplace more generally, without distinguishing between different business structures such as firms or plants. ↩
-
The full results, showing the impact estimates for each subgroup, are reported in Tables A6.4 to A6.7 in Appendix 6. ↩
-
Table A6.27 in the Appendix 6 profiles samples with respect to individual characteristic observed at the start of the relevant spell for relapse durations (or at Wave 1 when the duration is ‘time to develop one or more chronic conditions’). ↩
-
The number in brackets refers to the proportion of the sample aged over 64 at spell end. ↩
-
Delayed entry is a form of sample selection whereby those who are exposed to the risk of failing (in this case the occurrence of an onset) for longer are over-represented, and this biases survival rates upwards. ↩
-
The Peto-Peto-Prentice tests (not reported here, available on request) produce the same results as the log-rank tests in virtually all cases. These tests would be the most appropriate ones under the assumption that hazard functions vary in ways other than proportionally and are robust to different censoring patterns across groups. ↩
-
The probabilities associated with the log-rank tests are higher than 5%, indicating that the null hypothesis of no difference between the 2 functions cannot be rejected at this level. ↩
-
The probabilities associated with the log-rank tests are smaller than 5%, suggesting different survivals across the subgroups. To understand which of the subgroups survive longer, one needs to look at the by-subgroup survival functions reported in Appendix 6 (Figures A6.7 to A6.26). ↩
-
The results obtained treating all variables as time-invariant (i.e., using time-invariant variables and the value of time-variant variables at the start of the individuals’ spells) are qualitatively (in terms of the sign of the coefficients) and quantitatively (coefficient magnitude) very similar to those presented in this section (see Tables A6.28 and A6.29 in the Appendix 6). This suggests that, whereas the analysis allows the variables defined as time-varying (e.g., educational qualifications, employment status and ownership type) to change over time, the characteristics they reflect are in reality quite stable over the timeframe observed. Note that the variables denoting age categories are measured at spell start (i.e., they are treated as time-invariant) because they vary in a constant, predictable way (one-unit increase every year) and therefore their time variation does not have any explanatory power on hazard rates. ↩
-
The results reported in Tables 4.11 and 4.12 are re-proposed in Appendix 6 using exponentiated coefficients (see Tables A6.30 and A6.31). Exponentiated coefficients can be interpreted as hazard ratios, and measures the effect that a one-unit change in a given covariate has on the instantaneous hazard. For example, an exponentiated coefficient of 1.149 in Table A6.30 for the variable ‘White ethnicity’ (first column) suggests that the hazard of recovery is 14.9% higher for white people compared to people from other ethnic groups (the difference between the exponentiated coefficient and 1). For exponentiated coefficients smaller than 1, the (negative) effect is obtained subtracting the same coefficients from 1. ↩
-
Generally, the coefficients for home-owners are higher than those for people who own the property in which they live through mortgage (the only exception is recovery from poor mental health). Note that this specification of housing extends the categories used in section 4.1 as the models consistently supported a significant, albeit smaller effect for mortgage holders. ↩
-
Non-linear effects are observed as the hazard of recovery initially decreases and then increases with age. ↩
-
However, also in this case non-linear effects are observed. ↩
-
A relative small proportion also indicate permanent dissatisfaction with work. ↩
-
The fact that both the health and work transitions happened at some unspecified time between Wave 1 and Wave 2 means that, for some people, what we call ‘contemporaneous’ work transitions have actually happened before the health transitions. Unfortunately, given the structure of the data, it is not possible to identify such instances. Nor is it possible to account for anticipation effects, whereby the labour market effect of the health transition materialises before the health transition takes place. ↩
-
An odds ratio is the ratio between the probability of success and the probability of failure). ↩
-
It is also possible for some individuals that the study ends before the event of interest has occurred. Also in this case it will be impossible to determine whether the duration ends in correspondence of the individuals’ last observation or later on. ↩
-
For more detailed guidance on how to derive Kaplan-Meier curves see Rich et al. (2010). ↩
-
See Prentice and Gloecker (1978) and Garcia-Gomez et al. (2009) for further details on this method. ↩