2022 Global Accounts of private registered providers
Updated 7 March 2023
Applies to England

© Crown copyright 2023
This publication is licensed under the terms of the Open Government Licence v3.0 except where otherwise stated. To view this licence, visit nationalarchives.gov.uk/doc/open-government-licence/version/3 or write to the Information Policy Team, The National Archives, Kew, London TW9 4DU, or email: psi@nationalarchives.gov.uk.
Where we have identified any third party copyright information you will need to obtain permission from the copyright holders concerned.
This publication is available at https://www.gov.uk/government/publications/2022-global-accounts-of-private-registered-providers/2022-global-accounts-of-private-registered-providers
Executive summary
The Global Accounts cover the year up to the end of March 2022. Over the course of the year restrictions associated with the coronavirus pandemic were gradually lifted. However, the recovery from the pandemic, coupled with the ongoing effects of Brexit and Russia’s invasion of Ukraine towards the end of the period, all contributed to an increasingly uncertain macro-economic environment. This publication demonstrates that private registered providers (referred to as providers in this document) generally responded well to the challenges faced in the reporting year and are in a reasonably strong position to respond to more difficult operating conditions in the future.
Last year’s Global Accounts set out the disruptive impact of the early national lockdowns on investment in new and existing stock. With many restrictions eased and eventually lifted, total spend on new supply has recovered to £12.3bn in 2022, a 12% increase on the previous year. The number of social homes completed in the year also increased by 9,000 to 49,000.
Investment in existing stock has increased to record levels. Total spend on repairs and maintenance has increased to £6.5bn. This is a 20% growth on last year’s lockdown impacted figure but also significantly above pre-pandemic levels. The record level of investment is partially driven by ‘catch-up’ spend relating to works delayed during the pandemic and macro-economic factors. However, building safety and stock quality were also important drivers.
Increased expenditure on existing stock has had an impact on financial performance. The ‘underlying surplus’ (excluding movements in fair value) fell slightly from £2.6bn to £2.4bn.
This decrease was mainly attributable to a fall in the operating surplus from core social housing lettings activity. The surplus generated from renting social properties fell by £0.4bn to £4.2bn. Associated operating costs increased by 7% with the greatest increases in repairs and maintenance spend. Permitted rent increases for the year were linked to CPI inflation of 0.5% in September 2020 plus 1%.
Over 90% of the sector’s operating surplus is generated through SHL activity. The deterioration in performance is therefore the primary driver for the overall operating margin falling to 19%, the lowest level reported since 2011.
The impact of this on the underlying surplus was offset by a £0.3bn increase in the profit recognised on the sale of properties held for rent (known as fixed asset sales). This includes staircasing sales and sales to tenants through the Right to Buy and Right to Acquire schemes. In combination, these categories of fixed asset sale were responsible for 75% of the total increase.
The regulator uses a measure of interest cover that includes all major repairs spend as a key indicator of financial viability. Including capitalised costs, an increase in total repairs spend of £1.1bn has resulted in EBITDA MRI[footnote 1] interest cover deteriorating by 24 percentage points to 128%. Levels of interest cover have deteriorated from a peak of more than 170% in 2018 and are set to reduce further as the sector continues to invest in existing stock and the cost of finance increases. The regulator will continue to engage with providers where we have concerns over financial viability and covenant positions.
In mitigation, the sector continues to demonstrate strong liquidity in aggregate. Debt reported on balance sheets increased by £2.9bn (3%) to £89.2bn in 2022. The funding markets remained active, and the sector remains an attractive proposition for investors. Including refinancing, the sector agreed new facilities of £12.5bn in the year to March 2022. Despite the Bank of England base rate increasing from 0.1% to 0.75% between December 2021 and March 2022, the effective interest rate (excluding one-off breakage costs) dropped from 4.0% in 2021 to 3.8% in 2022.
The Global Accounts for 2022 demonstrates a resilient financial performance in the face of testing economic and operating conditions. However, deteriorating margins, lower levels of interest cover and reduced capacity to manage downside risks are indicative of the challenges we expect providers to face in the future.
Events after March 2022 highlight the uncertainty of the operating environment. Inflation in excess of 10%, a tight labour market and shortages in both material and labour have placed upward pressure on core costs. Following a Government consultation, rent increases will now be capped at 7% for one year from March 2023 for most social and Affordable rented homes.
The Financial Forecast Annex shows that the sector remains committed to future investment. Latest available plans include more spend on new supply and record projected investment in existing stock. The latter is increasingly driven by energy efficiency factors, stock quality considerations, building and fire safety works along with longer-term investment associated with decarbonisation.
In the recent past, the sector’s capacity to invest has benefitted from historically low interest rates. Since March 2022 however, the base rate has increased from 0.75% to 3.5%. Market forecasts point to further increases towards a peak of around 5% in the second half of 2023.
Higher interest rates are likely to have a negative impact on the housing market. Including both current and fixed asset disposals, total sales receipts reported by the sector were £6.6bn in 2022 and are projected to increase. Sales exposure remains a key risk for many providers, particularly those reliant on first tranche shared ownership and outright market sale receipts.
In response to the unprecedented level of uncertainty we expect providers to adapt plans and consider the implications of potential trade-offs. It is vital they continue to manage their resources and risks effectively to ensure that their financial viability is maintained, and that they remain capable of delivering effective services and on their responsibilities to tenants.
Introduction
1.1. The 2022 Global Accounts of registered providers (Global Accounts) provides a financial overview of the social housing sector based on an analysis of the regulatory returns of private registered providers. The publication excludes social housing stock held by local authorities.
1.2. The social housing sector is diverse in both the size of providers that operate within it and the range of activities each undertakes. In total, there are around 1,400 active providers, of which the majority have fewer than 1,000 homes. This publication is concerned with the financial analysis of 204 large provider groups which own or manage at least 1,000 social homes, together representing more than 95% of the sector’s stock.
1.3. The underlying dataset used to produce the Global Accounts is subject to change as the number of providers above or below the 1,000 homes cut-off changes each year. In addition, one provider has not been able to finalise financial statements in time to be included in this year’s publication. Where the impact on year-on-year movements is material, this is explained in the notes section of the document.
1.4. The provision of homes for rent is the main activity of the sector. Many providers also generate income from the sale of homes, by providing homes for ownership either on a shared ownership basis or for outright sale. This activity exposes providers to a different risk profile to that for traditional renting and has changed the financial profile of several providers.
1.5. Most large providers are part of a group structure; these can include multiple registered providers and non-registered entities. The development of properties for outright sale and other non-social housing activity is often delivered by non-registered entities or joint ventures within group structures. This leads to differences between the accounts prepared by registered entities (entity level) and those prepared on a consolidated group basis (consolidated level). This publication presents results both at consolidated and entity level.
1.6. Further differences exist between providers. While most providers have some supported housing or housing for older people, there are a small but significant number of primarily specialist providers. These providers face additional challenges in securing care and support contracts from local authorities and other public bodies. A sub-set of supported housing providers operate a lease-based business model. These providers hold long-term leases for the housing stock they manage rather than owning it outright and only comprise a small part of the sector.
1.7. The vast majority of providers are designated as not-for-profit. The Global Accounts dataset includes the results of four for-profit providers which hold more than 1,000 units. Together these currently comprise a small but growing part of the sector.
1.8. A financial review of the 2021/22 Global Accounts is presented in Part 2. Part 3 comprises the aggregate financial statements. Part 4 contains notes to the primary statements showing further detail of key entries and balances.
1.9. The Annex includes an analysis of providers’ latest financial forecasts. This compares aggregate current projections and business plans against those submitted in previous years.
Financial review
Operating environment
2.1. The reporting period covered by this Global Accounts included the final stages of the national lockdown implemented as the country emerged from COVID-19. The range of measures introduced by the Government to mitigate the impacts of the pandemic were also phased out during the year.
- England began a phased exit from the third national lockdown on 8 March 2021, which included a four-step plan known as the roadmap out of lockdown[footnote 2].
- However, 30 November 2021 saw the introduction of ‘Plan B’ measures, as set out in the Government’s autumn and winter plan, in response to the Omicron variant. This included compulsory face coverings in most public indoor venues and the return to working from home guidelines.
- All remaining coronavirus restrictions were removed from 19 January 2022. The legal requirement to self-isolate after a positive covid test was removed from 24 February, with the £500 support payment for those on low incomes also being removed from this date.
- Enhanced Statutory Sick Pay and Employment and Support Allowance provisions for those sick or self-isolating due to COVID-19 ended on 24 March 2022.
2.2. A combination of external factors including the pandemic, the end of the Brexit transition period and an increase in demand drove up prices for essential materials in the construction sector and caused supply shortages. Materials such as cement, timber and steel experienced longer delivery lead times, resulting in delays at development sites[footnote 3]. The labour market also experienced supply shortages.
2.3. Inflationary pressures had already been increasing globally since 2021, as countries began to recover from the pandemic and the demand for goods and energy outpaced supply. Towards the end of the period covered this was exacerbated by Russia’s invasion of neighbouring Ukraine on 24 February 2022. The war led to further increases in global energy prices and shortages of certain commodities, increasing inflation and drastically reducing global growth forecasts.
2.4. Across the UK, average construction costs on new properties increased by 10.7%[footnote 4] over the 12-month period to 31 March 2022. Construction output gradually increased in the year and by March 2022 was at the highest monthly rate of growth since records began in 2014, 4.3%[footnote 5] higher than the same point in the previous year. This was reflected by a 25% increase in the number of new home registrations in 2021 compared to the previous year[footnote 6] (statistics reported for the calendar year). Housing repair and maintenance prices grew 5.1% in the year to March 2022[footnote 7], which was also the strongest rate of growth since records began in 2014.
2.5. In a bid to boost the housing market the Chancellor announced a temporary rise in the stamp duty threshold to £500,000 from July 2020 to June 2021. Further transitional relief of £250,000 remained in place until the end of September[footnote 8].
2.6. The average house price in England during the period covered by the Global Accounts increased by 9.9%[footnote 9]. There were notable regional variations in housing market performance. East Midlands was the fastest growing region with annual growth of 12.4%, and London for the second consecutive year saw the lowest annual growth, where prices increased by 4.8%.
2.7. The number of property transactions increased by 15% in the year, with the sharpest increases seen in the final month of the increase in the stamp duty threshold and the first month of the stamp duty transitional relief. Following that, in the final two-quarters of the year the number of residential transactions returned to pre-pandemic averages.
2.8. Due to growing concerns over inflation, on 16 December 2021 the Bank of England raised the base rate to 0.25%, the first increase in three years. This was followed by two further increases on 3 February 2022 to 0.5% and on 17 March to 0.75%. The Sterling Overnight Index Average, also increased over the year, from 0.05% to 0.69%[footnote 10].
2.9. During the period covered in this publication the sector remained an attractive proposition for investors. Providers agreed £12.5bn of new facilities in the year, with capital market funding accounting for £7.4bn of this.
2.10. Since March 2022 the BOE base rate has increased from 0.75% to 3.5% at December 2022. Market forecasts point to the BOE base rate rising further to a short-lived peak of around 5% in the second half of 2023. Providers are primarily debt funded and fix interest rates (for more than one year) on more than 80% of all borrowing. A 3% increase in base rate could theoretically increase interest costs of variable rate financing by approximately £900m per year. In addition to the cost of variable rate debt rising, refinancing will also become more expensive. Therefore, it is imperative that providers continue to effectively manage interest rate risk and plan for further interest rate increases in the future.
2.11. The annual CPI inflation rate increased in each of the 12 months to March 2022[footnote 11], rising from 0.7% at the start, to 7.0% at the end of the period. The largest contribution to the annual increase came from housing and household services (principally from electricity, gas and other fuels) and transport. Inflation is expected to peak at a 40-year high of 11.1%[footnote 12] in the fourth quarter of 2022, revised up from the peak of 8.7% forecast in March.
2.12. Average weekly wages increased by 7.0%[footnote 13] in the 12-month period covered by the Global Accounts, although there were significant variations seen between sectors with the private sector seeing higher growth levels than the public sector.
2.13. The Coronavirus Job Retention Scheme was introduced in March 2020 to allow employers to claim grant to cover the salary costs of furloughed workers. The scheme was extended until 30 September 2021[footnote 14] with claimants receiving 80% of their usual salary for hours not worked (up to £2,500 per month). However, from July 2021 changes were made to the scheme which meant that employers had to contribute towards wage costs.
2.14. The number of people on Universal Credit was 4.8 million[footnote 15] at March 2022, a decline from the figures reported for March 2021 of 5.2 million but higher than the number reported at the last count date before the coronavirus pandemic of 2.5 million. However, these figures are to some degree inflated by the continued roll out of Universal Credit. The Department for Work and Pensions’ intention is to move all legacy benefits and tax credit claimants across to Universal Credit by the end of 2024. The number of households on Universal Credit in England claiming housing entitlement with a social rented landlord increased from 1.1 million in March 2021[footnote 16] to 1.2 million in March 2022.
2.15. In the Global Accounts reporting period annual maximum rent increases of CPI +1% were allowed for the majority of properties. Permitted rent increases were based on the September 2020 CPI of 0.5%.
2.16. In August 2022, the Government launched a consultation on social housing rents which proposed a ceiling on the maximum increase that could be applied. While a rent cap reflects a departure from the CPI +1% policy set out in the 2020 Rent Standard, without this intervention, rents could potentially have been increased by up to 11.1% from April 2023. In November the Government announced that the maximum permissible rent increase for existing tenants will be limited to 7% between 1 April 2023 and 31 March 2024 for general needs Social Rent and Affordable Rent homes.
2.17. Coronavirus caused the biggest economic shock in modern history. The Government and BOE introduced policies designed to mitigate some of the negative economic impacts from the pandemic. The overall resilience of the housing sector and the effectiveness of the measures introduced has meant that providers were generally able to weather the economic storm relatively unscathed.
2.18. Despite this, the period after that covered in this publication has seen record levels of inflation, further interest rate increases and delays in the supply of construction materials along with labour shortages. Challenging economic conditions are likely to prevail for an extended period with many commentators predicting a period of recession. For the UK, the International Monetary Fund revised the annual gross domestic product growth forecast for 2023 downward from 1.2% in April 2022 to 0.3% in October 2022.
2.19. The United Kingdom’s credit rating outlook was revised to negative from stable[footnote 17]. This, along with cost and financial pressures in the sector, resulted in some providers also having their outlook changed to negative[footnote 18]. Further revisions are likely across the social housing sector[footnote 19] as inflation, interest rates and a significant increase in building safety and decarbonisation works continue to weaken the sector’s operating performance. The trajectory of macro-economic indicators and their impact on providers and tenants is uncertain. It is more important than ever for providers to closely monitor and update plans to reflect ongoing economic and operating risks.
Financial highlights
Investment in new supply
2.20. The initial COVID-19 lockdown periods of 2020 resulted in a temporary pause on most construction sites. This was reflected in a drop in investment in new supply in the 12 months up to March 2021. Although some restrictions remained in place through to January 2022, construction activity was permitted to continue throughout the period covered by this publication.
2.21. Total investment in new supply was £12.3bn, including social housing properties, properties developed for sale and investment properties. This was a 12% increase on spend of £10.9bn in 2021.
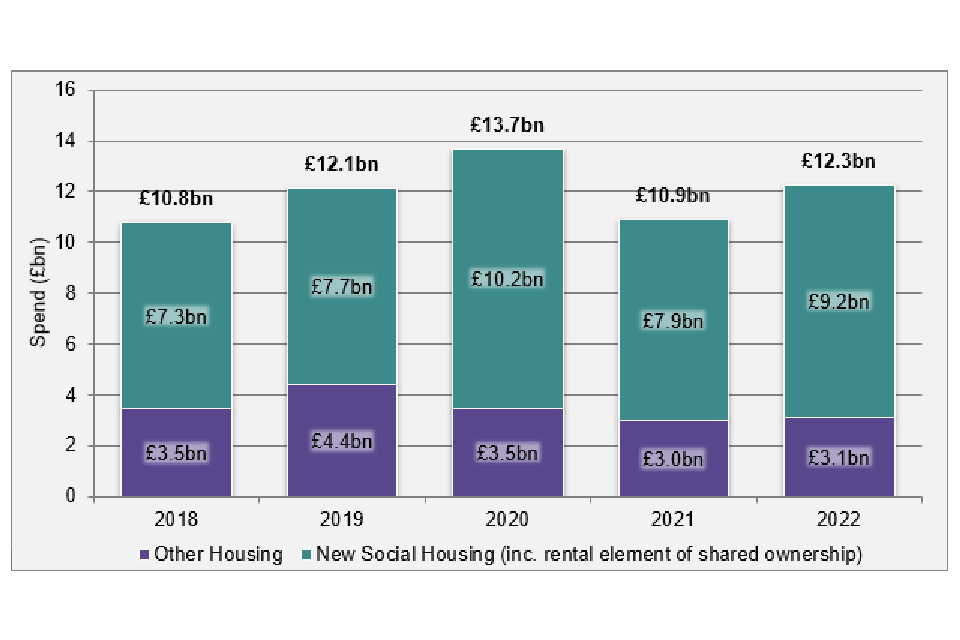
Figure 1: Investment in new supply
2.22. Although an increase relative to the prior year, total investment in new supply was below the pre-pandemic peak reported in 2020. Nevertheless, investment in social housing remains strong in comparison to non-social housing. In the year ending March 2022 construction works were affected by supply chain issues, impacting the availability of both materials and labour. Many providers referenced scheme delays and development programme slippage over this period in their Quarterly Survey[footnote 20] submissions.
2.23. In aggregate, the sector invested £9.2bn in new social housing properties for rent (including the rental element of shared ownership properties), delivering 49,000 new units. This is a significant increase on the 40,000 units completed in 2021. Net of demolitions and disposals, the total number of social homes owned by providers increased by 1% to 2,770,000.
2.24. In addition to the £9.2bn invested in social housing properties for rent, providers spent a further £3.1bn on the supply of properties developed for sale and units classified as investment properties.
- In 2022, estimated spend on properties developed for outright sale and the expected first tranche element of shared ownership properties was £2.7bn (2021: £2.7bn).
- Properties held for market rent and other properties held primarily for non-social housing purposes[footnote 21] are categorised as investment properties in financial statements. Investment in the supply of such new properties was £0.4bn (2021: £0.3bn).
Spend on existing stock
2.25. As was the case with spend on new supply, investment in existing stock also dropped in 2021 as a consequence of pandemic related delays and stoppages. However, in 2022 total repairs and maintenance spend recovered and increased to record levels, significantly above the pre-pandemic figures.
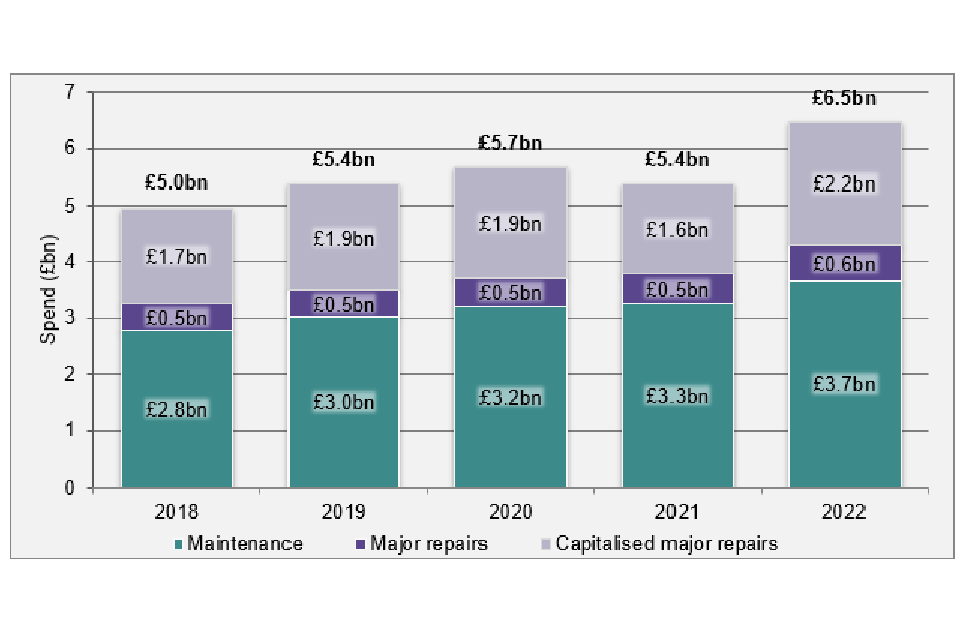
Figure 2: Total major repairs and maintenance spend (consolidated)
2.26. Total repairs and maintenance spend increased by 20% to £6.5bn. Capitalised investment in existing stock (that which adds to the reporting value of the asset) increased by 39% to £2.2bn. Repairs and maintenance disclosed as expenditure in the Statement of Comprehensive Income (SOCI) increased by 13% to £4.3bn. In 2022, more than 80% of providers reported a 5% or greater increase in repairs and maintenance spend on a per unit basis.
2.27. The steep increase in spend in 2022 is partially attributable to ‘catch-up’ spend relating to works delayed during the pandemic. However, there were several other contributing factors. For some large providers, the delivery of fire and building safety works were a significant driver for increased spend. Others referenced supply chain issues and labour shortages as a factor in cost growth.
2.28. Latest business plans show a further commitment to investment in existing stock. Increases in forecast spend are, to a greater extent, driven by stock quality and decarbonisation factors. Providers must continue to ensure that stock meets current and evolving requirements. In some cases, this will mean finding a balance between maintaining financial resilience while delivering essential services.
Housing assets
2.29. Increased investment in new supply and record levels of capitalised repair works have led to the total value of housing assets held by the sector increasing by £7.0bn to £187.1bn.
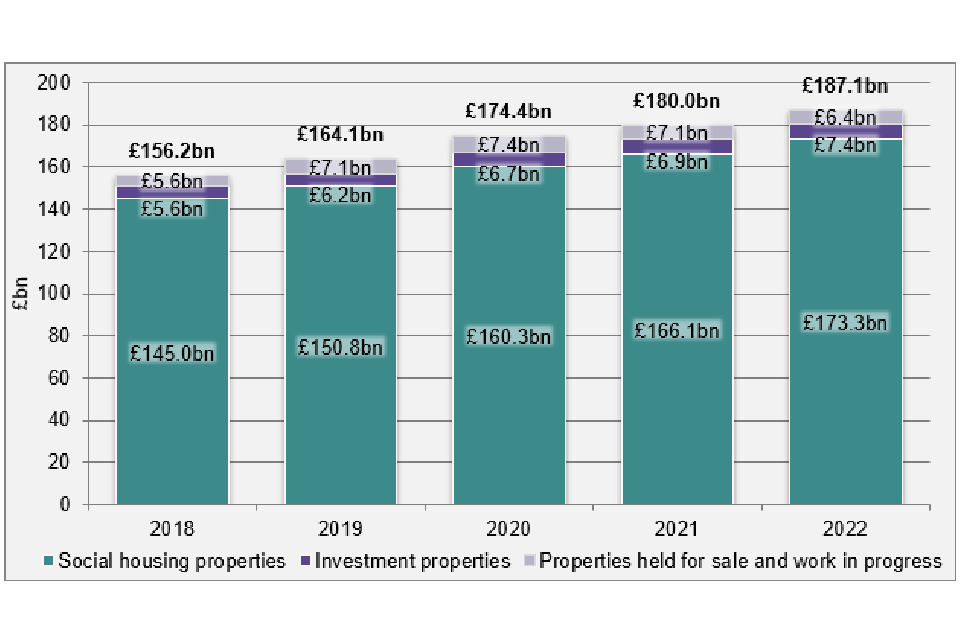
Figure 3: Housing assets (consolidated)
2.30. Housing assets include £173.3bn of social housing properties held for rent and under construction, £7.4bn of investment properties (predominantly market rent) and £6.4bn of properties held for sale. The latter mainly relates to land and properties under construction.
2.31. The Annex shows that latest business plans include increased levels of investment. Total capital commitments reported in financial statements at the end of 2022 were £41.4bn, a 7% increase on last year, of which £21.2bn had been contracted.
Debt and funding
2.32. The investment in existing properties and new supply was primarily funded through operating surpluses, debt and capital grant. Total debt in the sector increased by £2.9bn (3%) to £89.2bn. This was commensurate with the comparable increase reported in 2021 (£3.2bn).
2.33. New grant totalling £1.5bn was received during the year. As at 31 March 2022, total capital grant recognised on the balance sheet was £39.1bn.
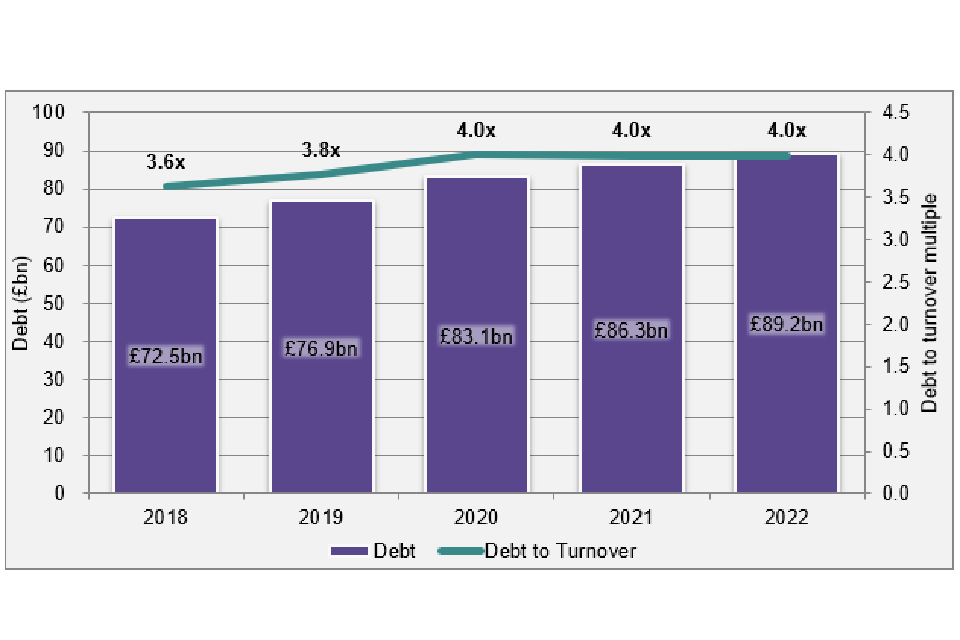
Figure 4: Total debt (consolidated)
2.34. Including refinancing, in the year to March 2022, the sector agreed new facilities of £12.5bn. Although below the record £15.1bn raised in the previous year, the amount of new funding agreed in 2022 was significantly above the long-term average. At the end of March 2022, available undrawn facilities were £29.8bn (March 2021 £27.8bn)[footnote 22].
2.35. Providers continued to access funding through the capital markets, with £7.4bn raised in the year (2021: £9.8bn). In comparison, new bank lending of £4.6bn was arranged in the year (2021: £4.8bn). As of 31 March 2022, around 51% of existing facilities were in the form of bank loans.
2.36. The BOE base rate has moved from 0.75% in March 22 to 3.50% at the end of the year with further increases likely. In aggregate, 80% of sector debt is held at fixed interest rates for more than one year. However, exposure to interest rate risk varies from provider to provider. Although the sector remains an attractive prospect for investors, providers must be prepared for a period of higher interest rates.
2.37. Reported levels of indebtedness remained stable in the year. The increase in debt of 3% was in line with the growth in turnover and slightly below the 4% increase in the net book value of social housing assets. Debt per unit has increased marginally by 2%.
Table 1: Indebtedness metrics
| Consolidated | Entity | |||
|---|---|---|---|---|
| Defined in brackets | 2022 | 2021 | 2022 | 2021 |
| Gearing (debt as % of social housing assets) | 51% | 52% | 52% | 52% |
| Debt to turnover (as a multiple) | 4.0 | 4.0 | 4.3 | 4.4 |
| Debt per unit (£ per social housing unit) | 31,586 | 30,939 | 31,179 | 30,405 |
Underlying surplus
2.38. Based on the consolidated financial statements, the surplus reported in 2022 was £4.0bn, an increase on the £2.9bn reported in 2021.
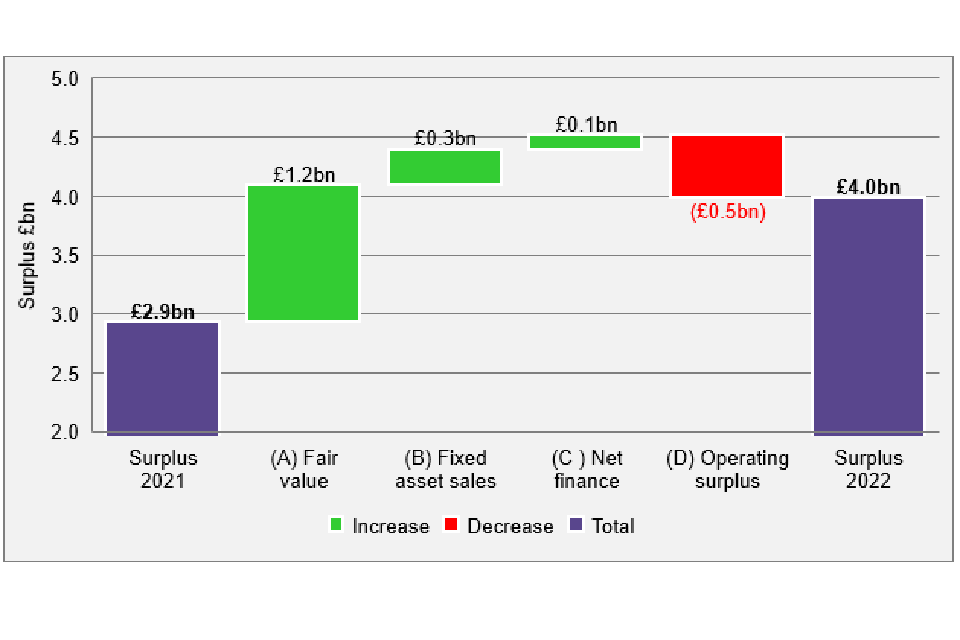
Figure 5: The main factors impacting the reported surplus (consolidated)
2.39. As can be seen from the figure above, the reported surplus fluctuates year-on-year as a result of movements in fair value. This is particularly true in consolidated financial statements which often include fair value gains from group merger activity. The underlying surplus, excluding these ‘non-cash’ gains and losses decreased from £2.6bn in 2021 to £2.4bn in 2022.
2.40. Each of the key drivers behind the reported surplus are examined in turn further down.
2.41. (A) Fair value gains (excluded from the underlying surplus) increased by £1.2bn:
- In 2022 there were a number of significant business combinations (mergers) resulting in fair value gains of £1.2bn. In 2021 there were fewer mergers and associated fair value gains were just £0.1bn.
- Other non-cash items reported in the surplus include movements in the fair value of financial instruments and investment properties. In total the sector reported a gain on these items of £0.4bn (2021: £0.2bn).
2.42. (B) An increase in the profit recognised from fixed asset sales of £0.3bn:
- Fixed asset sales mainly relate to the sale of properties held for rent or the retained element of shared ownership units. In 2022 the sector reported a profit on fixed asset sales of £1.2bn (2021: £0.9bn).
- Sales to tenants, either through Right to Buy / Right to Acquire or staircasing by shared ownership tenants, resulted in a profit of £0.6bn, a £0.2bn increase on the comparable figure from 2021.
- The surplus attributable to other fixed asset sales increased from £0.5bn in 2021 to £0.6bn in 2022. This includes strategic void disposals and the sale of properties between providers.
2.43. (C) A decrease in net finance costs of £0.1bn:
- Net finance costs, including interest payable (and similar charges) and interest receivable, decreased from £3.3bn in 2021 to £3.2bn in 2022.
- The decrease is partially attributable to lower loan breakage costs in 2022 of £250m (2021: £340m).
2.44. (D) A decrease in the operating surplus of £0.5bn:
- The surplus from operating activities fell from £4.9bn in 2021 to £4.4bn in 2022.
- This was mainly due to SHL activity which accounts for more than 90% of the total operating surplus generated by the sector. The operating surplus from SHL decreased from £4.6bn to £4.2bn.
- The reduction in operating profit from SHL was largely attributable to increased repairs and maintenance costs.
- The operating surplus on all other activities, including both shared ownership first tranche sales and outright market sales, was £0.3bn (2021: £0.4bn).
2.45. The reported surplus of £4.0bn was increased by £2.0bn to give total comprehensive income for the period of £6.0bn. This is mainly a result of actuarial gains of £1.5bn recognised in respect of pension schemes. The gain is attributable to changes in underlying financial and economic assumptions underpinning valuations, and reverses a loss of £1.4bn recognised in the previous year.
Financial performance
Operating activity and EBITDA MRI interest cover
2.46. More than 70% of total sector turnover is generated through SHL activity (Figure 6). A further 17% is generated through development for sale; either first tranche sales from shared ownership properties or outright market sales.
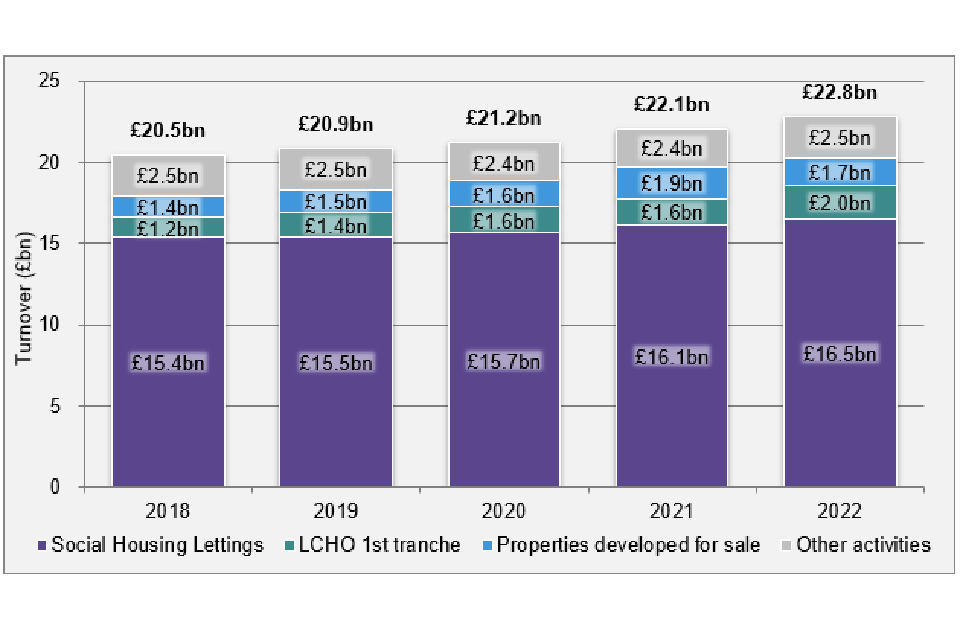
Figure 6: Breakdown of turnover (consolidated)
2.47. The operating surplus (excluding fixed asset sales) decreased by £0.5bn to £4.4bn, primarily attributable to a £0.4bn fall in the surplus from SHL activity. This decrease is examined in the section below. However, the drop in margin on the sector’s core activity has resulted in the overall operating margin deteriorating to below 20% based on consolidated returns. This is the lowest level reported since 2011.
Table 2: Margins
| Consolidated | Entity | |||
|---|---|---|---|---|
| % | 2022 | 2021 | 2022 | 2021 |
| Operating margin | 19.5% | 22.4% | 21.3% | 24.5% |
| Operating margin on social housing lettings | 25.3% | 28.4% | 24.8% | 28.1% |
| Operating margin on 1st tranche sales | 16.4% | 16.2% | 16.6% | 17.1% |
| Operating margin on outright sale | 9.7% | 11.4% | 17.8% | 8.1% |
| Operating margin on other activities (excluding Gift Aid) | (9.1%) | (5.7%) | (11.8%) | (8.31%) |
2.48. The sector’s key measure of its ability to cover ongoing finance costs from operating activity is interest cover. The interest cover measure used by the regulator includes all major repairs spend. This ensures a consistent comparison of performance across providers, regardless of capitalisation policies.
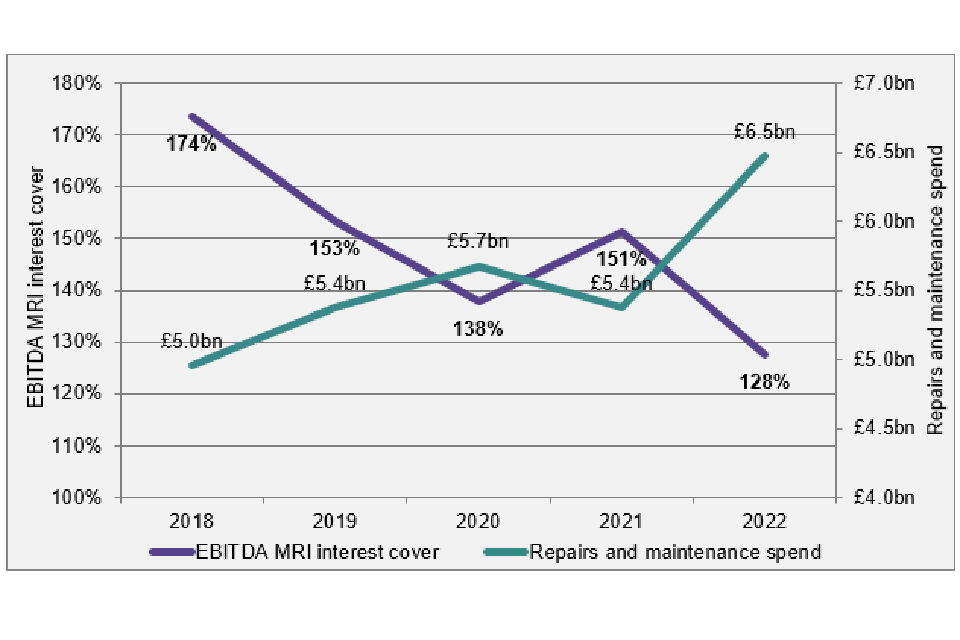
Figure 7: EBITDA MRI interest cover (consolidated)
2.49. Aggregate EBITDA MRI interest cover fell to 128%, the lowest level reported since 2012. The driver for lower interest cover in 2022 is a £1.0bn decrease in total EBITDA MRI reported by the sector, which is in turn attributable to a £1.1bn increase in repairs and maintenance spend.
2.50. As set out in table 3 below, the aggregate level of indebtedness (debt to turnover) and the cost of finance (effective interest rate) have, by contrast, remained relatively stable.
Table 3: Interest cover metrics
| Consolidated | Entity | |||
|---|---|---|---|---|
| % (unless otherwise stated) | 2022 | 2021 | 2022 | 2021 |
| EBITDA MRI interest cover | 128% | 151% | 132% | 155% |
| EBITDA MRI interest cover SHL | 120% | 142% | 122% | 145% |
| EBITDA MRI margin | 21.0% | 26.5% | 23.8% | 30.1% |
| Debt to turnover (as a multiple) | 4.0% | 4.0% | 4.3% | 4.4% |
| Effective interest rate (EIR) | 4.1% | 4.4% | 4.2% | 4.4% |
| EIR (excluding breakage costs) | 3.8% | 4.0% | 3.9% | 4.0% |
2.51. The median value for EBITDA MRI interest cover was 144% (2021: 183%), with 76% of providers reporting a figure greater than 100%. This is a decrease from 2021 when 87% of providers reported a figure greater than 100%.
2.52. There are several reasons why individual providers may have relatively low levels of interest cover. However, as the sector emerges from the effects of the pandemic, asset management spend is a clear priority. We expect investment in existing stock to continue and providers’ latest business plans highlight an increased focus on stock quality and decarbonisation.
2.53. Most providers have interest cover loan covenants with limits typically between 110% and 125%. The basis used for covenant calculations may exclude elements of major repair spend, particularly where they relate to exceptional costs. Where this is not the case many providers have sought waivers from lenders to exclude specific components of expenditure from covenant calculations.
2.54. The regulator monitors the financial viability, including covenant compliance, of all providers on an ongoing basis. The recent regulatory judgements published by the regulator reflect the impact of increased asset management spend and the broader financial pressures currently faced by providers. We will continue to engage with providers to gain assurance where there are indicators of weakening headroom.
Social housing lettings activity
2.55. The surplus on SHL has decreased by £0.4bn to £4.2bn. Turnover from SHL has increased by £0.4bn to £16.5bn, whereas costs have increased by £0.8bn to £12.4bn. The operating margin has decreased from a peak of 34% in 2017 to 25% in 2022.
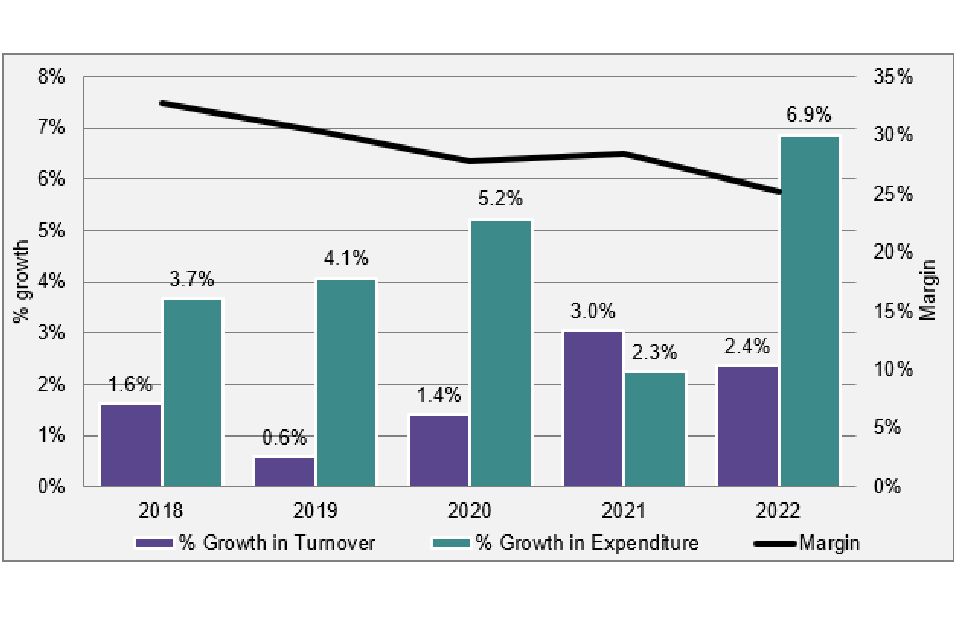
Figure 8: Social housing lettings income and expenditure growth (consolidated)
2.56. For the year ending March 2022 permitted rent increases were capped at 1.5% (September 2020 CPI inflation of 0.5% plus 1%). This contributed to an increase in total rents receivable of 2.1% to £14.2bn.
2.57. Permitted rent increases were outstripped by growth in operating expenditure of 6.9% (£0.8bn), attributable in large part to a 13% (£0.5bn) increase in operating spend on repairs and maintenance. Management and service charge costs also increased by 4% (£0.2bn).
2.58. The operational factors placing upward pressure on repairs and maintenance costs have already been covered in this publication. The economic environment was also a factor in broader operating cost growth. Annual CPI inflation increased from 1.5% in April 2021 to 7.0% in March 2022. The vast majority of providers (85%) reported a decrease in their operating margin on SHL activity.
Social housing lettings: Operating performance
Table 4: Indicators of operating performance
| Consolidated | Entity | |||
|---|---|---|---|---|
| % of gross rent | 2022 | 2021 | 2022 | 2021 |
| Rent loss from void properties | 1.9% | 1.9% | 1.9% | 1.9% |
| Bad debts for the year | 0.6% | 0.7% | 0.6% | 0.7% |
| Current tenant arrears | 5.2% | 5.0% | 5.1% | 4.9% |
2.59. Void losses and current tenant arrears are key performance indicators in assessing the efficiency of letting and rent collection.
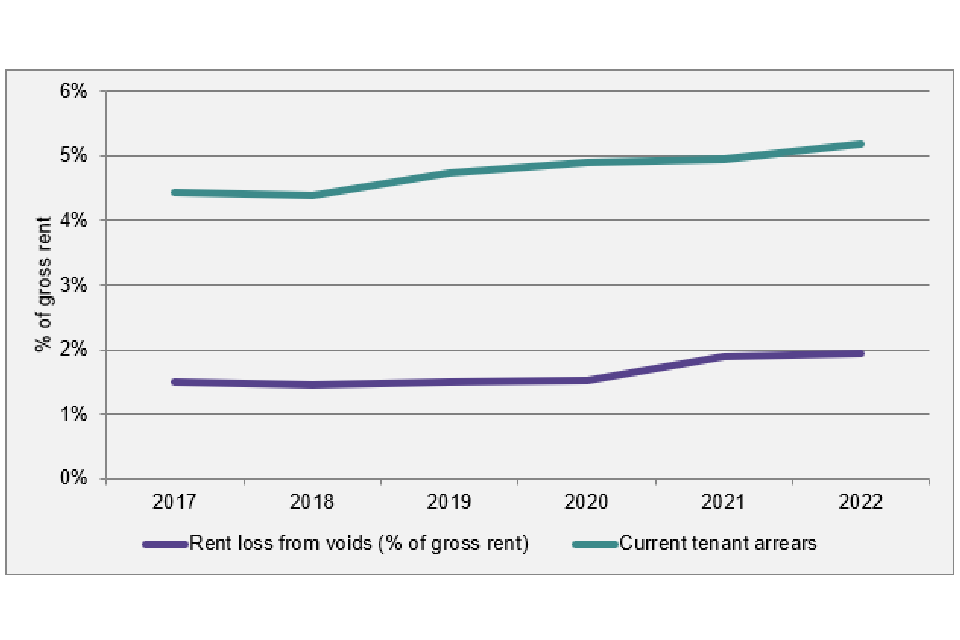
Figure 9: Voids and current tenant arrears as % of gross rent
2.60. Rent loss from void properties increased during the pandemic. As a percentage of gross rent, void losses reached 1.9% in 2021, the highest point since 2010. The results up to March 2022 have remained at similar levels and there are no indications yet of a return to pre-pandemic levels.
2.61. Providers experienced increased void repair times due to material and labour shortages, in addition to covid-related backlogs. The highest levels of voids continue to be experienced by providers with a large proportion of supported housing units, care home units or housing for older people.
2.62. Current tenant arrears have gradually increased over the last four years and now stand at 5.2% of gross rents compared to 5.0% in 2021. During 2021/22, the sustained level of voids and uptick in arrears has not had a material impact on the operating performance of the sector.
2.63. However, following the period covered by the Global Accounts, Quarterly Survey submissions[footnote 23] saw no change in void levels and an increase in levels of arrears and bad debts resulting from the impact of the cost-of-living crisis. It is expected that these indicators will continue to deteriorate in 2022/23 and providers will need to closely monitor their position.
Sales
2.64. Boosted by the robust housing market, total sales receipts increased to £6.6bn (2021: £5.7bn). The corresponding surplus on sales increased to £1.7bn (2021: £1.3bn).
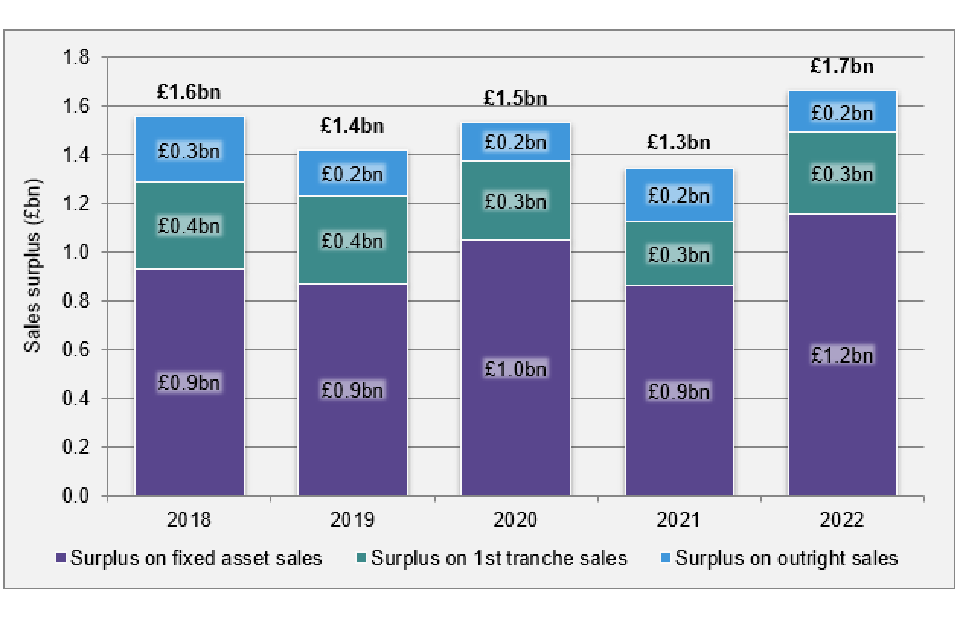
Figure 10: Profit on sales (consolidated)
2.65. Many providers develop properties for sale. These may be units for outright sale at market values or low-cost home ownership units where a proportion of the property is sold as a first tranche. Both types of sale are classified as current asset sales and are included in operating activities.
2.66. Development for sale is concentrated in a small number of large providers with significant exposure to the housing market. As in 2021, the total surplus recognised on both these types of sale combined was £0.5bn.
- LCHO first tranche sales receipts were £2.0bn (2021 £1.6bn) and the contribution was £334m (2021: £265m). The margin on first tranche sales was stable, remaining at 16%.
- Outright sale receipts were £1.7bn (2021: £1.9bn) and the contribution was £0.2bn. The margin on outright sales decreased slightly to 10% (2021: 11%).
2.67. In respect of outright sales, 85% of the sector’s total receipts are reported by just 19 providers. As market conditions change in response to recent economic volatility, sales exposure remains a key risk for several providers to manage.
2.68. The sector also recognises profit realised on the sale of properties held for rent. Such sales are classified as fixed asset sales and the profit reported on disposal increased by £0.3bn to £1.2bn.
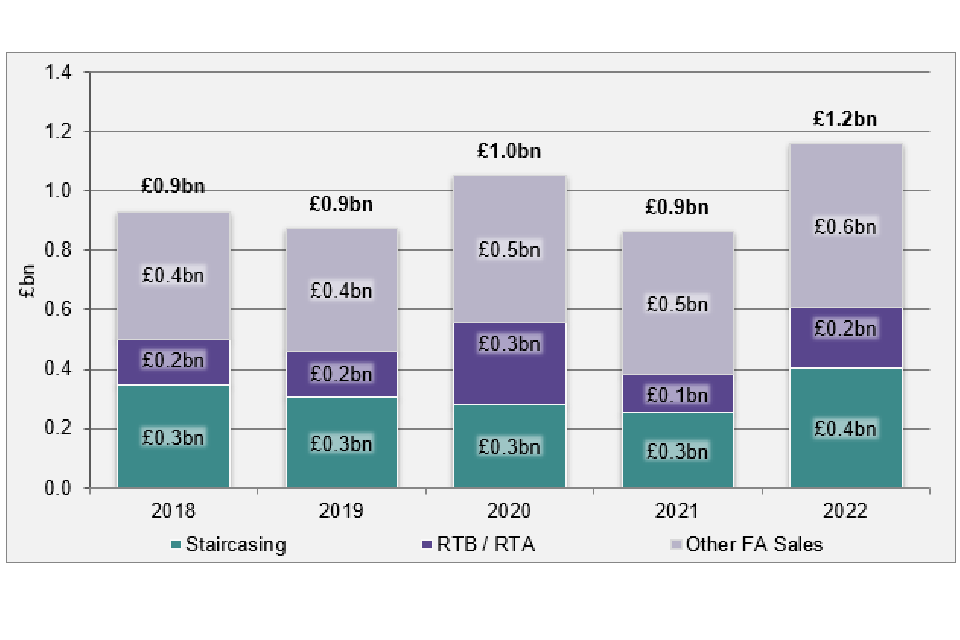
Figure 11: Profit on fixed asset sales (consolidated)
2.69. Around 75% of the increase in 2022 was attributable to the surplus recognised on staircasing sales to shared ownership tenants and RTB / RTA sales. Other fixed asset sales generated a profit of £0.6bn in 2022. This mainly relates to stock transactions between registered providers and the strategic sale of void properties.
Financial statements
Table 5: Statement of Comprehensive Income
| Consolidated | Entity | ||||
|---|---|---|---|---|---|
| £ billion | Note | 2022 | 2021 | 2022 | 2021 |
| Turnover | 2 | 22.8 | 22.1 | 20.7 | 19.8 |
| Operating expenditure | 2 | (15.0) | (14.1) | (14.3) | (13.3) |
| Cost of sales | 2 | (3.4) | (3.0) | (2.0) | (1.7) |
| Operating surplus/(deficit) | 2 | 4.4 | 4.9 | 4.4 | 4.9 |
| Gain/(loss) on disposal of fixed assets | 4 | 1.2 | 0.9 | 1.2 | 0.9 |
| Operating surplus/(deficit) including fixed asset disposals | 5.6 | 5.8 | 5.6 | 5.7 | |
| Other items | 5 | 1.3 | 0.2 | 0.2 | 0.2 |
| Interest receivable | 0.1 | 0.1 | 0.3 | 0.3 | |
| Interest payable and financing costs | 6 | (3.3) | (3.4) | (3.3) | (3.5) |
| Movements in fair value | 7 | 0.4 | 0.2 | 0.3 | 0.2 |
| Surplus/(deficit) before tax | 4.0 | 2.9 | 3.1 | 2.9 | |
| Taxation | (0.1) | (0.0) | (0.0) | (0.0) | |
| Surplus/(deficit) for the period | 4.0 | 2.9 | 3.1 | 2.9 | |
| Unrealised surplus/(deficit) on revaluation of housing properties | 0.1 | 0.1 | 0.1 | 0.1 | |
| Actuarial (loss)/gain in respect of pensions | 20 | 1.5 | (1.4) | 1.4 | (1.3) |
| Change in fair value of hedged instruments | 7 | 0.4 | 0.4 | 0.3 | 0.3 |
| Total comprehensive income for the period | 6.0 | 2.0 | 4.9 | 2.0 |
Table 6: Statement of changes in reserves
| £ billion | Income and expenditure reserves | Revaluation reserves | Other reserves | Total |
|---|---|---|---|---|
| Consolidated | ||||
| Closing balance 2021 | 46.2 | 11.9 | (0.7) | 57.4 |
| Restatements | (0.6) | (0.3) | 0.1 | (0.8) |
| Balance at start of period | 45.6 | 11.7 | (0.6) | 56.7 |
| Surplus/(deficit) for the period | 4.0 | NA | NA | 4.0 |
| Other comprehensive income | 1.4 | 0.1 | 0.5 | 2.0 |
| Transfer from revaluation reserve | 0.1 | (0.1) | (0.0) | (0.0) |
| Other transfers | (0.1) | 0.1 | 0.1 | 0.1 |
| Closing balance 2022 | 51.1 | 11.7 | (0.0) | 62.8 |
| Entity | ||||
| Closing balance 2021 | 44.7 | 12.2 | (0.5) | 56.4 |
| Restatements | (0.5) | (0.3) | 0.1 | (0.7) |
| Balance at start of period | 44.2 | 11.9 | (0.4) | 55.7 |
| Surplus/(deficit) for the period | 3.1 | NA | NA | 3.1 |
| Other comprehensive income | 1.4 | 0.1 | 0.4 | 1.8 |
| Transfer from revaluation reserve | 0.1 | (0.1) | (0.0) | (0.0) |
| Other transfers | 0.2 | (0.0) | 0.1 | 0.3 |
| Closing balance 2022 | 49.0 | 11.8 | 0.1 | 61.0 |
Table 7: Statement of Financial Position
| Consolidated | Entity | ||||
|---|---|---|---|---|---|
| £ billion | Note | 2022 | 2021 | 2022 | 2021 |
| Fixed assets | |||||
| Tangible fixed assets: housing properties at cost and valuation | 8 | 173.3 | 166.1 | 168.4 | 161.0 |
| Other fixed assets | 9 | 3.0 | 3.0 | 2.6 | 2.7 |
| Investment properties | 9 | 7.4 | 6.9 | 4.2 | 3.9 |
| Other investments | 9 | 1.9 | 1.8 | 3.8 | 4.1 |
| Total fixed assets | 185.5 | 177.8 | 179.0 | 171.7 | |
| Current assets | |||||
| Properties held for sale | 10 | 6.4 | 7.1 | 2.8 | 3.2 |
| Trade and other debtors | 10 | 2.2 | 2.1 | 1.7 | 1.5 |
| Cash and short-term investments | 10 | 7.9 | 8.6 | 6.4 | 7.4 |
| Other current assets | 10 | 2.1 | 2.0 | 9.7 | 8.8 |
| Total current assets | 18.5 | 19.7 | 20.6 | 20.9 | |
| Creditors: amounts falling due within one year | |||||
| Short-term loans | 12 | 1.9 | 3.6 | 1.8 | 3.2 |
| Deferred capital grant: due within one year | 13 | 0.5 | 0.5 | 0.5 | 0.5 |
| Other current liabilities | 11 | 6.9 | 6.5 | 7.2 | 6.9 |
| Total creditors: amounts falling due within one year | 9.3 | 10.6 | 9.5 | 10.6 | |
| Net current assets/liabilities | 9.2 | 9.1 | 11.2 | 10.3 | |
| Total assets less current liabilities | 194.7 | 186.9 | 190.2 | 182.1 | |
| Creditors: amounts falling due after more than one year | |||||
| Long-term loans | 12 | 86.2 | 81.7 | 65.5 | 62.4 |
| Amounts owed to group undertakings | 12 | 0.5 | 0.3 | 19.8 | 18.1 |
| Finance lease obligations | 12 | 0.6 | 0.6 | 0.5 | 0.5 |
| Deferred capital grant: due after more than one year | 13 | 38.5 | 38.5 | 38.2 | 37.5 |
| Other long-term creditors | 14 | 3.3 | 4.1 | 2.7 | 3.3 |
| Total creditors: amounts falling due after more than one year | 129.1 | 125.2 | 126.7 | 121.8 | |
| Provisions for liabilities | |||||
| Pension provision | 20 | 1.9 | 3.4 | 1.8 | 3.1 |
| Other provisions | 15 | 0.9 | 0.9 | 0.7 | 0.8 |
| Total net assets | 62.8 | 57.4 | 61.0 | 56.4 | |
| Reserves | |||||
| Income and expenditure reserve | 16 | 51.1 | 46.2 | 49.0 | 44.7 |
| Revaluation reserves | 16 | 11.7 | 11.9 | 11.8 | 12.2 |
| Other reserves | 16 | (0.0) | (0.7) | 0.1 | (0.5) |
| Total reserves | 62.8 | 57.4 | 61.0 | 56.4 |
Notes to the accounts
1. Global Accounts methodology
4.1.1. This analysis is based on a database of information derived from housing providers’ audited financial statements. The database contains data from the annual account regulatory returns (known as Financial Viability Assessments) which must be submitted by providers that own or manage 1,000 or more homes.
4.1.2. The database excludes regulatory returns submitted by two providers with non-standard financial year ends. These providers have year ends of 30 September 2021 and 31 October 2021. The period covered in their financial statements would not be commensurate with the rest of the dataset (based mainly on the period 1 April 2021 to 31 March 2022). Neither of the excluded providers materially impact the figures in this publication.
4.1.3. Where a provider is a parent of a group structure that produces consolidated financial statements, it submits both an entity and a consolidated FVA.
4.1.4. These regulatory returns are aggregated to produce the Statement of Financial Position, Statement of Changes in Reserves and SOCI. The statements and notes within this document are based on the entity and consolidated datasets for 2021/22. Comparative figures for 2020/21 are also provided.
4.1.5. Figures have been rounded to the nearest £billion to one decimal place. This can result in rounding differences in totals as the individual returns are denominated in £000s.
Aggregate SOCI
4.1.6. The aggregate SOCI reflects the sum of private registered provider activity for all accounting periods ending between 1 April 2021 and 31 March 2022.
Aggregate SOFP
4.1.7. The aggregate SOFP is the sum of individual statements where the financial year-end falls within the period from 1 April 2021 to 31 March 2022.
Additional information
4.1.8. Additional information is provided on other activities, selected notes to the financial statements and the number of homes in management.
Changes to the FVA return
4.1.9. A small number of changes were made to the FVA template for 2022. These included removing lines no longer required, including those relating to the Disposal Proceeds Fund, initial measurement of defined benefit pension, and for recording the pension liability within the creditors’ notes. Additional guidance was provided on the recognition of pension provisions, and a new line and note were added for the breakdown of non-social housing property sales to allow identification of market versus bulk sales.
2. Particulars of turnover, operating expenditure and operating surplus
a. Social housing lettings
4.2.1. Turnover from SHL increased by 2% in the consolidated return and by 3% in the entity return, reaching £16.5bn and £16.4bn respectively. Factors contributing to the small difference between the consolidated and entity figures include turnover from registered providers with fewer than 1,000 units where these form part of group structures, and social housing letting activity undertaken outside England.
Table 8: Income and expenditure from SHL
| Consolidated | Entity | |||
|---|---|---|---|---|
| £ billion | 2022 | 2021 | 2022 | 2021 |
| Income | ||||
| Rents | 14.2 | 14.0 | 14.1 | 13.7 |
| Service charge income | 1.5 | 1.5 | 1.5 | 1.5 |
| Net rental income | 15.8 | 15.4 | 15.6 | 15.2 |
| Capital grant released to income | 0.5 | 0.5 | 0.5 | 0.5 |
| Other and revenue grant | 0.3 | 0.2 | 0.3 | 0.2 |
| Turnover from SHL | 16.5 | 16.1 | 16.4 | 15.9 |
| Expenditure | ||||
| Management | 3.1 | 3.0 | 3.1 | 3.0 |
| Service charge costs | 2.0 | 1.9 | 2.0 | 1.8 |
| Routine maintenance | 2.6 | 2.3 | 2.6 | 2.3 |
| Planned maintenance | 1.1 | 1.0 | 1.1 | 1.0 |
| Major repairs expenditure | 0.6 | 0.5 | 0.6 | 0.5 |
| Bad debts | 0.1 | 0.1 | 0.1 | 0.1 |
| Depreciation of housing properties | 2.5 | 2.4 | 2.5 | 2.4 |
| Impairment of housing properties | 0.0 | 0.0 | 0.0 | 0.0 |
| Other costs (including lease costs) | 0.3 | 0.3 | 0.4 | 0.3 |
| Expenditure on SHL | 12.4 | 11.6 | 12.3 | 11.4 |
| Operating surplus / (deficit) on SHL | 4.2 | 4.6 | 4.1 | 4.5 |
| Void rent loss | 0.3 | 0.3 | 0.3 | 0.3 |
4.2.2. Rental income increased by £295m (2%) in the consolidated returns, reflecting the return to permitted rent increases. These were capped at CPI at September 2020 of 0.5% + 1%. For the rental element of shared ownership units, increases were capped at RPI + 0.5%, which for providers using September 2020 as their review date would equate to an increase of 1.6%. A net increase in the overall number of housing units during the year has further increased the level of rental income recorded, while changes to the population of providers in the dataset has had a negligible impact.
4.2.3. At consolidated group level, void rent losses increased by 4% to reach £0.3bn. This remains at elevated levels in comparison to the three-year average of £0.2bn before the pandemic. Providers have experienced increased void repair times due to material and labour shortages, alongside covid-related backlogs. The highest levels of void rent losses are typically reported by providers with a large proportion of supported housing units, care home units or housing for older people. Void losses relating to supported housing and housing for older people accounted for 37% of total void losses, although these units represent just 13% of total social housing units.
4.2.4. Total expenditure on SHL increased by 7% to £12.4bn. Bad debt charges and impairment of housing properties saw a decline in value, while all other areas of expenditure have experienced increases in costs.
4.2.5. Total maintenance and major repairs costs (recognised as operating expenditure) increased by 13% in 2022, with 87% of providers reporting an increase in spend compared to 2021. Within this, routine maintenance and planned maintenance expenditure increased by £396m (12%) over the year as providers caught up on the backlog of outstanding works delayed during the pandemic. A rise in demand post lockdown has resulted in the increased use of contractors, increasing the cost of responsive repairs. Expensed major repairs spend also increased by £94m (17%), reflecting the additional spend on fire safety and decarbonisation programmes.
4.2.6. Service charge costs increased by £80m (4%), with the corresponding income increasing by £28m (2%). The ratio of service charge income to associated costs dropped slightly to 77% (2021: 79%).
4.2.7. Depreciation charges increased by £69m (3%) over the year, reflecting the continued investment in new and existing properties over recent years. Impairment charges were £11m (28%) lower than in 2021, mainly due to a reduction in the write-down of property values where building safety issues had been identified. This reflects the increased spend on building and fire safety within the year. Bad debt charges, including the movement in provisions and amounts written off, were £9m (10%) lower than in the previous year.
4.2.8. Management costs increased by £125m (4%) over the year. Over 70% of providers reported an increase in management costs relative to 2021. Other costs, including lease payments, increased by £51m (18%).
4.2.9. On a consolidated basis, operating surplus has decreased by £412m (9%), with the operating margin reducing from 28.4% to 25.3%. The margin on an entity basis is not materially different.
b. Other social housing activities
Table 9: Other social housing activities
| Consolidated | Entity | |||
|---|---|---|---|---|
| £ billion | 2022 | 2021 | 2022 | 2021 |
| First tranche LCHO sales | ||||
| Turnover | 2.0 | 1.6 | 2.0 | 1.6 |
| Expenditure / Cost of sales | 1.7 | 1.4 | 1.6 | 1.3 |
| Surplus | 0.3 | 0.3 | 0.3 | 0.3 |
| Other social housing activities | ||||
| Turnover | 0.7 | 0.8 | 1.1 | 1.1 |
| Expenditure / Cost of sales | 1.1 | 1.0 | 1.2 | 1.1 |
| Surplus | (0.4) | (0.2) | (0.1) | (0.1) |
| Total | ||||
| Turnover | 2.8 | 2.4 | 3.1 | 2.6 |
| Expenditure / Cost of sales | 2.8 | 2.4 | 2.9 | 2.4 |
| Surplus | (0.0) | 0.0 | 0.2 | 0.2 |
4.2.10. Turnover from first tranche LCHO sales in the consolidated statements increased by 25% (£403m) to £2,037m (2021: £1,634m). The margin remained at 16%, consistent with 2021, resulting in an overall surplus on sales of £334m (2021: £265m). LCHO sales activity is widespread across the sector, with over three-quarters of providers reporting income from this source. However, it is heavily concentrated amongst a small number of these providers, with 28 PRPs reporting turnover of over £20m each, accounting for two-thirds of the sector total. Almost 20% of the increase in LCHO turnover in 2022 was attributable to one provider.
4.2.11. Data from the Quarterly Financial and Risk Survey shows that there was a 17% increase in the number of first tranche units sold in the year to March 2022 when compared to the previous year. This follows a 15% increase in unit completions reported in FVA returns over the same period.
4.2.12. Income from other non-letting social housing activities reduced by 10% (£77m) in the consolidated accounts to reach £727m. Costs increased by 4% to £1,088m, resulting in a deficit of £361m (2021 deficit: £244m).
4.2.13. Over half of the other non-letting social housing income reported by the sector relates to support services. At £389m, income from support services remained consistent with that reported in 2021, however there was a £13m increase in the overall deficit on this activity, which grew to £25m. Support service income is concentrated in a small number of providers, with 13 PRPs each reporting income in excess of £10m from this source, and in aggregate accounting for almost 70% of the sector total.
4.2.14. Development activity accounted for over half of the total deficit on other social housing activity. Income of £25m was reported, mainly from development services provided to external organisations. In addition to the overheads relating to these services, total development costs of £222m included scheme costs that cannot be capitalised, abortive costs and impairment charges. Almost half of the sector’s total development costs were reported by just one provider.
4.2.15. The remainder of other social housing activity in consolidated accounts includes community and neighbourhood services and management services, in addition to a range of other activities. The sector reported income of £313m from these activities (2021: £381m), and an overall deficit of £139m (2021 deficit: £68m).
4.2.16. Turnover from other social housing activities is higher in the entity accounts than at group level, due to the effect of intra-group transactions that are eliminated on consolidation. Development service income is £201m higher at entity level than group level, and other income is £112m higher. These categories include recharges to other entities within group structures for services provided and for central overheads. Entity turnover also includes Gift Aid receipts of £140m (see note 3).
c. Non-social housing activities
Table 10: Non-social housing activities
| Consolidated | Entity | |||
|---|---|---|---|---|
| £ billion | 2022 | 2021 | 2022 | 2021 |
| Properties developed for sale | ||||
| Turnover | 1.7 | 1.9 | 0.2 | 0.3 |
| Expenditure / Cost of sales | 1.6 | 1.7 | 0.2 | 0.2 |
| Surplus | 0.2 | 0.2 | 0.0 | 0.0 |
| Other non-social housing activities | ||||
| Turnover | 1.8 | 1.6 | 1.1 | 1.0 |
| Expenditure / Cost of sales | 1.7 | 1.5 | 0.9 | 0.9 |
| Surplus | 0.1 | 0.1 | 0.1 | 0.2 |
| Total | ||||
| Turnover | 3.5 | 3.5 | 1.3 | 1.3 |
| Expenditure / Cost of sales | 3.2 | 3.2 | 1.1 | 1.1 |
| Surplus | 0.3 | 0.3 | 0.2 | 0.2 |
4.2.17. Turnover from properties developed for outright sale reduced by £206m (11%) to £1,732m in the consolidated statements. Sales margins also reduced, from 11% in 2021 to 10% in 2022, resulting in an overall surplus of £168m (2021: £221m). Two providers reported a reduction in outright sales income of over £65m each, together reporting a decrease in surplus of almost £75m.
4.2.18. New disclosures added to the FVA for 2022 indicated that turnover from outright sales included £83m worth of income from bulk sales to other organisations. This was reported by six providers and generated a surplus of £5m.
4.2.19. Outright sale activity is concentrated in a comparatively small number of providers, with one-third of PRPs reporting turnover from this activity. 10 providers reported turnover in excess of £50m each, together accounting for almost two-thirds of the overall sector total.
4.2.20. Outright sale activity is primarily undertaken by non-registered entities within group structures and is therefore materially greater in the consolidated returns. A total of 28 individual registered entities reported outright sales income amounting to £186m; equivalent to 11% of the sector’s total income as reported in consolidated returns.
4.2.21. A number of providers deliver units for outright sale through joint ventures, the income and expenditure from which is not separately reported. The net surplus from joint ventures is included in the income statement under “Other items” (see note 5).
4.2.22. Income from all other non-social housing activities increased by 15% (£236m) in the consolidated accounts to reach £1,802m. Costs also increased by 15% to £1,670m, resulting in a surplus of £132m (2021 surplus: £108m).
4.2.23. Other non-social housing turnover of £1,802m is analysed by providers between market rent (£297m; 17%), nursing home provision (£235m; 13%), student accommodation (£89m; 5%), and non-social support service charges (£48m; 3%). However, the bulk of the turnover does not sit within these categories and is disclosed as ‘other’. This category accounted for 63% (£1,133m) of the total other non-social housing turnover, and saw an increase of 26% over the year. A deficit of £39m was reported (2021 deficit: £37m).
4.2.24. Other non-social activities are concentrated in a small number of specialist or diverse groups; 11 providers each reported income in excess of £20m, and together accounted for over 60% of the overall sector total of £1,133m. The nature of the non-social housing activity varies between providers, and includes the provision of leisure facilities, property management, land sales and commercial property rental. In addition to the costs associated with these activities, other non-social costs contributing to the deficit of £39m included impairment charges, development costs and unallocated central overheads.
3. Gift Aid
4.3.1. Within PRP groups, Gift Aid payments are typically made by a trading subsidiary to a charitable group member, thereby allowing tax relief to be claimed on the amount donated. Gift Aid receipts and payments are eliminated on consolidation in group accounts.
4.3.2. Within entity returns, Gift Aid receipts are included within turnover, and disclosed as part of either ‘other social housing’ or ‘non-social housing’ activities. Receipts totalled £231m in 2022, a 10% reduction from the £256m reported in 2021. Gift Aid payments from PRPs to other group members amounted to £82m (2021: £69m).
4.3.3. The Gift Aid receipts recognised in the year include donations from group members participating in development for outright sale, shared ownership management and market rent. Providers classified £140m of the total receipts as relating to social housing activity, with £91m being allocated to non-social housing activities.
4. Disposal of fixed assets
4.4.1. Based on consolidated returns, total fixed asset sales during the year generated proceeds of £2.9bn, with a surplus of £1.2bn. This is an increase in sales proceeds of 36% (£0.8bn) from 2021, and an increase in surplus of 35% (£0.3bn). The surplus on disposal of fixed assets is calculated by deducting the carrying value of the asset from the sales proceeds. For the majority of providers, the carrying value is equal to the historic cost of the asset, less accumulated depreciation, and therefore this typically results in higher surpluses than with current asset sales.
4.4.2. Over 40% of the increase in total fixed asset sale proceeds was attributable to staircasing sales to shared owners. Staircasing receipts increased by 50% (£317m), and surpluses by 57% (£147m). Staircasing transactions accounted for a third of the total fixed asset sale receipts generated during the year.
4.4.3. Proceeds from RTB and RTA sales to tenants increased by 57% (£143m) to a total of £394m, and the corresponding surplus increased by 61% to £204m. Sales proceeds were split almost equally between RTB and RTA sales, however RTA sales accounted for almost two-thirds of the surplus. RTA sales proceeds were at the highest level recorded since the data was first collected in 2017.
4.4.4. Other housing property sales, including stock rationalisation and the strategic sale of void properties, generated proceeds of £806m (2021: 571m); an increase of over 40% compared to 2021. The surplus increased by 30%, up to £373m (2021: £287m), with almost two-thirds of this amount being reported by just ten providers.
4.4.5. Proceeds from sales to other registered providers increased by 20% compared to the previous year, reaching a total of £534m (2021: £447m). Sales to other RPs were reported by 17 provider groups, with one provider accounting for almost 40% of the total receipts. Although total receipts increased, there was a reduction in the overall surplus on sales to other RPs, which fell by 12% to reach £156m (2021: £176m).
4.4.6. Sales of other assets, including the sale of commercial properties, amounted to £181m in the year (2021: £208m), with a surplus of £22m being achieved (2021: £13m). Two-thirds of these sales were reported by just eight providers.
Table 11: Disposal of fixed assets
| Consolidated | Entity | |||
|---|---|---|---|---|
| £ billion | 2022 | 2021 | 2022 | 2021 |
| Staircasing | ||||
| Proceeds | 1.0 | 0.6 | 1.0 | 0.6 |
| Costs of sales | 0.6 | 0.4 | 0.6 | 0.4 |
| Surplus | 0.4 | 0.3 | 0.4 | 0.3 |
| RTB/RTA | ||||
| Proceeds | 0.4 | 0.3 | 0.4 | 0.2 |
| Costs of sales | 0.2 | 0.1 | 0.2 | 0.1 |
| Surplus | 0.2 | 0.1 | 0.2 | 0.1 |
| Other housing property sales | ||||
| Proceeds | 0.8 | 0.6 | 0.7 | 0.6 |
| Costs of sales | 0.4 | 0.3 | 0.4 | 0.3 |
| Surplus | 0.4 | 0.3 | 0.3 | 0.3 |
| Sales to other RPs and other | ||||
| Proceeds | 0.7 | 0.7 | 0.8 | 0.6 |
| Costs of sales | 0.5 | 0.5 | 0.5 | 0.4 |
| Surplus | 0.2 | 0.2 | 0.2 | 0.2 |
| Total | ||||
| Proceeds | 2.9 | 2.1 | 2.8 | 2.1 |
| Costs of sales | 1.7 | 1.3 | 1.6 | 1.2 |
| Surplus | 1.2 | 0.9 | 1.2 | 0.9 |
5. Other items
Table 12: Other items
| Consolidated | Entity | |||
|---|---|---|---|---|
| £ billion | 2022 | 2021 | 2022 | 2021 |
| Other items | 1.2 | 0.1 | 0.2 | 0.2 |
| Share of operating surplus in joint ventures or associates | 0.1 | 0.1 | 0.0 | 0.0 |
| Total | 1.3 | 0.2 | 0.2 | 0.2 |
4.5.1. Other items consist mainly of gains resulting from business combinations where the acquisition method of accounting has been used[footnote 24]. Based on consolidated returns, seven providers reported net gains on business combinations amounting to £1,168m (2021: 5 providers, £115m). This includes both combinations where a new subsidiary is acquired, and where another organisation is acquired via a transfer of engagements. The comparable figure for entity returns includes only acquisitions via transfer of engagements and amounts to £227m (2021: £178m).
4.5.2. In consolidated returns, providers account for activity undertaken in jointly controlled entities using the equity method. In the SOCI, income and expenditure are not reported separately; instead, the net surplus or deficit from joint ventures is included as an individual line item.
4.5.3. The net surplus from joint ventures increased by £16m (21%) to £94m in 2022. A total of 36 PRP groups reported a surplus or deficit from joint venture activity, with one provider accounting for almost 40% of the overall sector surplus. The majority of the surplus from joint ventures is generated through the provision of homes for outright sale, which are often developed as part of wider mixed-tenure community regeneration projects.
4.5.4. Providers are not required to report the turnover associated with the net surplus from joint ventures in their audited financial statements, however, it is included as a separate note in FVA returns. For 2022, PRPs reported a share of turnover from joint ventures of £793m (2021: £733m).
6. Interest payable and finance costs
4.6.1. Total interest and finance costs decreased by £124m (4%) in the consolidated statements to a total of £3.3bn. This decrease comprised an £82m (2%) decrease in interest payable on liabilities and a £54m (12%) decrease in ‘other amounts payable’.
4.6.2. The primary item within ‘other amounts payable’ is loan breakage costs. These are typically incurred by providers when undertaking refinancing activity and can vary substantially from year to year. In 2022 loan breakage costs were reported by 36 providers (2021: 29 providers) and came to £250m in total (2021: £337m). The decrease in loan breakage costs is primarily due to a large one-off cost reported in 2021 by one provider, contributing almost half of the total. Seven providers reported breakage costs in excess of £10m, together accounting for 69% of the total.
Table 13: Interest payable and finance costs
| Consolidated | Entity | |||
|---|---|---|---|---|
| £ billion | 2022 | 2021 | 2022 | 2021 |
| Interest payable on liabilities | 3.2 | 3.3 | 3.2 | 3.2 |
| Defined benefit pension charges | 0.1 | 0.0 | 0.1 | 0.0 |
| Other amounts payable | 0.4 | 0.5 | 0.4 | 0.5 |
| Less: interest capitalised in housing properties | (0.4) | (0.4) | (0.3) | (0.3) |
| Total interest payable and financing costs | 3.3 | 3.4 | 3.3 | 3.5 |
7. Movements in fair value and remeasurements
Movements in the fair value of investment properties
4.7.1. Properties held for market rent or for capital appreciation are categorised as investment properties. They are re-measured annually at their fair value, with any change in fair value being reported in the surplus for the year.
4.7.2. Based on consolidated returns, the fair value of investment properties held by the sector increased by £168m, with 93 providers reporting favourable movements, compared to 22 experiencing adverse movements. Increasing property prices and high demand for private rental properties has led to market rent portfolios generally increasing in value, as well as student accommodation which has seen a recovery in demand following the end of COVID-19 restrictions. The increase in fair value based on entity returns was £71m, reflecting the extent to which market rent properties are held by non-registered entities within group structures.
Movements in the fair value of financial instruments
4.7.3. Interest rate swaps and a minority of loans are classified as ‘non-basic’ or ‘other’ financial instruments under FRS102 and must be re-measured annually at fair value. Movements in the fair value of financial instruments are included within either the surplus, or, where they meet the conditions for hedge accounting, within other comprehensive income. Whether hedge accounting can be applied or not is determined by the economic relationship between the hedged item and the hedging instrument.
4.7.4. Financial instruments held at fair value through the SOCI increased in value by £181m during the year. Over 70% of this amount was reported by five providers, that each reported fair value gains of over £10m.
4.7.5. In respect of hedged financial instruments, providers reported a favourable movement of £451m for the year, with one provider accounting for nearly a quarter of this amount. The majority of hedging instruments within the sector are variable rate to fixed-rate interest rate swaps, and the liability associated with these reduces as swap rates increase. Over the year the 15-year swap rate increased from 1.21% in March 2021 (based on LIBOR) to 1.88% in March 2022 (based on SONIA).
8. Fixed assets – housing properties
Table 14: Fixed asset housing properties
| £ billion | Consolidated | Entity |
|---|---|---|
| Housing properties at cost or valuation | ||
| Properties held at cost | 185.0 | 181.1 |
| Properties held at valuation | 2.4 | 2.4 |
| Total properties held at start of period | 187.4 | 183.5 |
| Additions | ||
| Additions (new properties) | 9.2 | 9.1 |
| Additions (existing properties) | 2.1 | 2.1 |
| Disposals | (1.7) | (1.6) |
| Transfers and reclassifications[footnote 25] | 2.5 | 1.4 |
| Revaluation and other | 0.1 | 0.0 |
| Total properties held at end of period | 199.7 | 194.6 |
| Depreciation and impairment | ||
| Total depreciation and impairment at start of period | 24.4 | 24.1 |
| Depreciation and impairment charged in period | 2.5 | 2.5 |
| Released on disposal | (0.5) | (0.5) |
| Revaluation and other | (0.1) | 0.1 |
| Total depreciation and impairment at end of period | 26.4 | 26.2 |
| Net book value at end of period: | ||
| Properties held at cost | 171.4 | 166.5 |
| Properties held at valuation | 1.9 | 1.9 |
| Total net book value | 173.3 | 168.4 |
| Net book value at start of period[footnote 26] | 163.0 | 159.4 |
4.8.1. The consolidated results for the sector reported an increase of £12.3bn over the year in the gross book value of housing properties, to reach a total of £199.7bn at the end of March 2022. Movements during the year included:
- £9.2bn of investment in new supply
- £2.1bn worth of works to existing social housing properties
- Stock disposals with a book value of £1.7bn
- Transfers (including transfers of engagements) from other RPs of £2.7bn less reclassifications of £0.2bn
4.8.2. Investment in new supply for social housing properties increased by £1.2bn (15%), from £7.9bn to £9.2bn. Although an increase relative to the prior year, total investment in new supply was below the pre-pandemic peak reported in 2020. In the year ending March 2022 construction works were affected by supply chain issues, impacting the availability of both materials and labour. Many providers referenced scheme delays and development programme slippage over this period in Quarterly Survey submissions. Investment in new properties is fairly concentrated in a small number of providers, with 15 providers reporting investment in excess of £150m each and together accounting for 43% of the £9.2bn total.
4.8.3. As providers started to catch up with backlog works, works to existing properties, which includes capitalised major repairs spend, increased by £0.6bn (39%) compared to 2021, exceeding all pre-pandemic levels. The majority of providers reported an increase in their capitalised major repairs compared to 2021, with nearly a quarter of the spend in the year accounted for by six providers. Nine providers reported an increase in spend of over £15m each, accounting for 37% of the overall increase.
4.8.4. Transfers from other registered providers and reclassifications significantly increased in the year by £2.2bn compared to 2021 (£0.5bn), due mainly to merger activity which had stalled in the previous year due to the pandemic.
4.8.5. A total of £2bn was added to the sector’s cumulative depreciation and impairment balance, resulting in a net book value of £173.3bn at March 2022. This represents an increase of £10.2bn[footnote 27] (6%) during the year.
9. Other fixed assets and investments
Table 15: Other fixed assets
| Consolidated | Entity | |||
|---|---|---|---|---|
| £ billion | 2022 | 2021 | 2022 | 2021 |
| Tangible fixed assets: other | 2.0 | 2.0 | 1.8 | 1.8 |
| HomeBuy loans receivable | 0.6 | 0.6 | 0.6 | 0.6 |
| Intangible fixed assets and goodwill | 0.4 | 0.4 | 0.3 | 0.2 |
| Total | 3.0 | 3.0 | 2.6 | 2.7 |
4.9.1. Based on consolidated returns, other fixed assets were valued at £3.0bn, remaining in line with the previous year. This consists mainly of tangible fixed assets other than housing properties, which account for 67% of the total. This includes items such as office buildings and IT equipment.
4.9.2. At the entity level, other fixed assets total £2.6bn. Intangible fixed assets and goodwill increased by 8% and account for 10% of the total. This includes goodwill arising on acquisition and IT software.
Table 16: Investments
| Consolidated | Entity | |||
|---|---|---|---|---|
| £ billion | 2022 | 2021 | 2022 | 2021 |
| Investment properties | 7.4 | 6.9 | 4.2 | 3.9 |
| Investment in joint ventures | 1.2 | 1.1 | 0.2 | 0.1 |
| Investment in associates | 0.1 | 0.1 | 0.0 | 0.0 |
| Investment in subsidiaries | 0.0 | 0.0 | 3.0 | 3.4 |
| Other investments | 0.6 | 0.5 | 0.6 | 0.6 |
| Total | 9.3 | 8.6 | 8.0 | 8.0 |
4.9.3. Investment in joint ventures increased by £0.1bn (6%) to £1.2bn. A total of 43 out of 204 groups in the dataset reported investments in joint ventures, with two large providers dominating the sector and accounting for 46% of the overall total. The value of investments in joint ventures is substantially lower in the entity level accounts as much of the activity is managed through non-registered entities.
4.9.4. The total value of investments in subsidiaries reported in the entity level accounts decreased by £0.3bn (10%) to £3.0bn. This is mainly due to a large drop in investment by one provider, who accounted for 35% of the sector total in 2021. Of the £0.3bn decrease, this consisted of 16 providers who reported a reduction in investment in subsidiaries.
Table 17: Investment properties
| Consolidated | Entity | |
|---|---|---|
| £ billion | 2022 | 2022 |
| Opening valuation | 6.8 | 4.0 |
| of which under construction | 0.3 | 0.1 |
| Additions | 0.4 | 0.3 |
| Transfers and reclassifications | 0.3 | (0.0) |
| Movement in fair value | 0.2 | 0.1 |
| Disposals | (0.2) | (0.2) |
| Closing valuation | 7.4 | 4.2 |
| of which under construction | 0.4 | 0.1 |
4.9.5. The value of investment properties reported in consolidated accounts increased by £0.6bn (9%) to £7.4bn. The main increases are in additions (£0.4bn) and transfers and reclassifications (£0.3bn).
4.9.6. One for-profit provider has recognised its social housing properties as investment properties. Although this deviates from the Housing Statement of Recommended Practice, it is permissible under the Financial Reporting Council rules, due to it holding the properties for capital appreciation. This provider accounts for 4% of the £7.4bn total and represents over half of total additions.
4.9.7. The total value of investment properties relates to both housing properties developed for market rent and commercial properties and includes £0.4bn relating to properties under construction. These activities are heavily concentrated within a small number of providers, with 12 providers reporting balances of more than £100m, accounting for 74% of the sector total. At £4.2bn, the value disclosed in the entity accounts is significantly lower, reflecting the use of unregistered entities for this activity.
4.9.8. Transfers and reclassifications of £0.3bn are mainly attributable to one provider that accounts for over 70% of the total, due to an acquisition during the year. Movements in fair value resulted in a net increase of £0.2bn, with four providers reporting a gain on revaluation of over £10m, accounting for 56% of the total. This was mainly on market rent properties and reflects the growth in demand post-pandemic.
10. Current assets
4.10.1. Total current assets held by consolidated groups decreased by £1.2bn over the year (6%), to £18.5bn. At entity level, a decrease of £0.3bn (1%) was reported. The largest decrease recorded at group level was in properties held for sale, which reduced by £0.7bn. At entity level, cash and short-term investments had the largest decrease, reducing by £1.0bn.
Table 18: Total current assets
| Consolidated | Entity | |||
|---|---|---|---|---|
| £ billion | 2022 | 2021 | 2022 | 2021 |
| Properties held for sale | 6.4 | 7.1 | 2.8 | 3.2 |
| Trade and other debtors | 2.2 | 2.1 | 1.7 | 1.5 |
| Cash and short-term investments | 7.9 | 8.6 | 6.4 | 7.4 |
| Other current assets | 2.1 | 2.0 | 9.7 | 8.8 |
| Total current assets | 18.5 | 19.7 | 20.6 | 20.9 |
4.10.2. The total value of properties held for sale is considerably higher at consolidated level (£6.4bn compared to £2.8bn in entity returns). This reflects market sale developments undertaken by unregistered entities (53% of the consolidated figure relates to market sale development, compared to just 12% in entity accounts).
4.10.3. Over 80% of the £6.4bn total relates to land and properties under construction rather than unsold completed properties. Almost a quarter of the £0.7bn decrease is attributable to one provider, that has been excluded from the 2022 dataset. Properties held for sale are concentrated in a small number of providers; a total of 18 provider groups reported values in excess of £100m, and between them accounted for 71% of the sector total.
Table 19: Cash and short-term investments
| Consolidated | Entity | |||
|---|---|---|---|---|
| £ billion | 2022 | 2021 | 2022 | 2021 |
| Cash | 7.0 | 7.8 | 5.7 | 6.2 |
| Short-term investments | 0.9 | 0.8 | 0.7 | 1.2 |
| Total | 7.9 | 8.6 | 6.4 | 7.4 |
4.10.4. Based on consolidated returns, cash and short-term investments decreased by £0.7bn (8%) to £7.9bn. Cash held by the sector decreased by 10% to £7.0bn, and short-term investments increased by 9% to £0.9bn. At entity level, cash decreased by 8% to £5.7bn, while short-term investments reduced by 40% to £0.7bn.
4.10.5. At both consolidated and entity level, the decrease in cash reflects the additional spend on new stock, together with the increased spend on existing stock, due to ‘catch-up’ works delayed during the pandemic. Total repairs and maintenance expenditure reached a record £6.5bn, an increase of 20% within the year, which includes the delivery of fire and building safety works, as well as decarbonisation schemes.
Table 20: Other current assets
| Consolidated | Entity | |||
|---|---|---|---|---|
| £ billion | 2022 | 2021 | 2022 | 2021 |
| Amounts owed by group undertakings | 0.0 | 0.1 | 8.2 | 7.4 |
| Refurbishment obligations | 0.5 | 0.4 | 0.5 | 0.4 |
| Fair value of derivative financial instruments | 0.1 | 0.0 | 0.1 | 0.0 |
| Other debtors due after one year | 0.7 | 0.8 | 0.3 | 0.5 |
| Any other current assets | 0.7 | 0.8 | 0.6 | 0.6 |
| Total | 2.1 | 2.0 | 9.7 | 8.8 |
4.10.6. Amounts owed by group undertakings make up 85% of other current assets in entity level accounts. Of the £8.2bn total reported, 83% is attributable to 19 associations reporting balances in excess of £100m. Amounts owed by group undertakings are eliminated on consolidation in group accounts. The small balance reported at consolidated level relates to groups where there is an unregistered parent.
4.10.7. Refurbishment obligations increased by 36% at consolidated level to £0.5bn. This is mainly held by two providers with balances in excess of £100m, accounting for almost half of the total. This balance relates to cases where a provider has entered into an agreement with a local authority to undertake refurbishment on transferred stock.
4.10.8. The fair value of derivative financial instruments increased to £0.1bn in both the consolidated group and entity accounts. This is reported by providers making use of freestanding interest rate swaps or currency hedges, where the value of the cash flows due to the provider is greater than those due to the counterparty. In 2022 returns, there were seven provider groups reporting a derivative financial instrument current asset.
11. Other current liabilities
4.11.1. Total other current liabilities, as reported in consolidated accounts, increased by £0.5bn (7%) over the year. At entity level the increase amounted to £0.3bn (5%), largely due to a £0.2bn increase in accruals and deferred income.
Table 21: Other current liabilities
| Consolidated | Entity | |||
|---|---|---|---|---|
| £ billion | 2022 | 2021 | 2022 | 2021 |
| Trade creditors | 0.8 | 0.7 | 0.6 | 0.5 |
| Rent and service charges received in advance | 0.6 | 0.6 | 0.6 | 0.6 |
| Amounts owed to group undertakings | 0.0 | 0.0 | 1.7 | 1.8 |
| Recycled Capital Grant funds | 0.4 | 0.4 | 0.4 | 0.4 |
| Accruals and deferred income | 3.2 | 3.0 | 2.3 | 2.1 |
| Other | 1.8 | 1.7 | 1.5 | 1.4 |
| Total | 6.9 | 6.5 | 7.2 | 6.9 |
4.11.2. The largest item is accruals and deferred income, which represents 46% of the consolidated group total. Since 2021, balances have increased by 8% (£239m) in group accounts.
4.11.3. Recycled Capital Grant Fund balances have not changed materially over the year. This balance now relates wholly to RCGF, as Disposal Proceeds Fund balances were required to be utilised by 6 April 2020.
4.11.4. ‘Other’ current liabilities have increased to £1.8bn in consolidated group accounts. This category includes various miscellaneous creditor balances, including stock transfer agreements, grant received in advance and leaseholder sinking funds.
12. Debt
4.12.1. At consolidated group level, total debt held by the sector increased by £2.9bn (3%) to reach £89.2bn. In entity returns debt increased by £3.3bn (4%) to £87.6bn.
4.12.2. Quarterly Financial and Risk Survey data collected in the year to March 2022 shows that the sector raised £12.5bn of new finance during the year. Just under 60% of this was raised on the capital markets, with the majority of the remainder being in the form of bank loans.
Table 22: Debt
| Consolidated | Entity | |||
|---|---|---|---|---|
| £ billion | 2022 | 2021 | 2022 | 2021 |
| Short-term loans | 1.9 | 3.6 | 1.8 | 3.2 |
| Long-term loans | 86.2 | 81.7 | 65.5 | 62.4 |
| Amounts owed to group undertakings | 0.5 | 0.3 | 19.8 | 18.1 |
| Finance lease obligations | 0.6 | 0.6 | 0.5 | 0.5 |
| Total | 89.2 | 86.3 | 87.6 | 84.3 |
4.12.3. At both consolidated group level and entity level there was a substantial reduction in the amount of debt classified as short-term loans, and therefore repayable within one year. At group level short-term loans reduced by £1.7bn (48%), and at entity level the reduction was £1.4bn (45%). The difference between 2021 and 2022 balances is largely attributable to the repayment of amounts issued under the Covid Corporate Financing Facility, which was set up during the COVID-19 pandemic to provide short-term cashflow support. March 2021 balances included £1.6bn worth of CCFF, which was repaid by March 2022.
4.12.4 At group level, long-term loans have increased by £4.5bn (6%) to reach £86.2bn. A total of 16 providers reported an increase in long-term debt of £0.1bn or more, and new providers added to the 2022 dataset have added £0.2bn to the total. This is offset by the removal of one provider from the dataset since 2021, reducing long-term debt by around £0.6bn. At entity level, long-term debt has increased by £3.1bn (5%) to £65.5bn.
4.12.5. The large difference (£20.7bn) in long-term loan balances at consolidated group level compared to entity level reflects the practice of raising finance within designated treasury vehicles. These are separate, subsidiary companies within the group structure that are set up specifically to raise finance, which is then on-lent to the PRPs within the group. This can be seen in the entity level balance for amounts owed to group undertakings, which at £19.8bn accounts for the majority of the difference in long-term loan balances between group and entity accounts. Intra-group balances accounted for 23% of total debt in the entity accounts, and increased by 9% during the year.
4.12.6. Amounts owed to group undertakings are eliminated on consolidation in group accounts, except where the PRP has an unregistered parent. Three providers reported unconsolidated balances at group level, with one provider accounting for over 90% of the £0.5bn total.
13. Capital grant
4.13.1. At consolidated group level, the total capital grant reported within creditors (due within one year and after one year) increased slightly to £39.1bn. The transactions in the year included the following:
- New grant totalling £1.5bn was received during the year.
- Grant of £476m was amortised and recognised in income. The majority of housing properties are held at cost with deferred capital grant being held as a creditor in the SOFP and released to income over the useful life of the asset (the accrual model).
- A net total of £118m grant was released on disposal of housing properties, which includes balances transferred to RCGF. Other movements gave a net release of £58m grant.
14. Other long-term creditors
4.14.1. At consolidated group level, other long-term creditors have decreased by £0.8bn (19%) to £3.3bn, driven by a reduction in the fair value of derivative instruments. At entity level, a decrease of £0.6bn (18%) has been reported.
Table 23: Other long-term creditors
| Consolidated | Entity | |||
|---|---|---|---|---|
| £ billion | 2022 | 2021 | 2022 | 2021 |
| Fair value derivative financial instruments | 1.2 | 2.1 | 0.9 | 1.5 |
| HomeBuy grant | 0.3 | 0.3 | 0.3 | 0.3 |
| RCGF | 0.7 | 0.7 | 0.7 | 0.7 |
| Other | 1.1 | 1.0 | 0.8 | 0.8 |
| Total | 3.3 | 4.1 | 2.7 | 3.3 |
4.14.2. A total of 38 groups disclosed derivative financial instruments at fair value as a long-term creditor. These are mainly providers that have utilised standalone interest rate swaps to fix the interest payable on variable rate debt, or in a minority of cases, where currency swaps have been utilised to fix the exchange rate on interest payable in a currency other than Sterling. A liability arises when the value of cash flows due to the counterparty is greater than those due to the provider. 56% of the sector total is reported by eight providers that have recognised a liability in excess of £50m.
4.14.3. The total liability reported in consolidated group accounts in respect of derivative financial instruments has decreased by £0.9bn (41%) since 2021. For most providers utilising vanilla interest rate swaps, the liability decreases as interest rates rise, and the decrease from 2021 reflects the rise in swap rates experienced over the year, due to a rise in interest rates.
15. Provisions
4.15.1. The provision reported in respect of pension liabilities is covered in Note 20 Pensions.
4.15.2. Based on consolidated returns, other provisions disclosed by the sector remained at £0.9bn. Of this, £0.4bn (2021: £0.5bn) relates to obligations to undertake refurbishment work where a stock transfer provider has entered into an agreement with a local authority. Providers must report both a payment in advance (creditor) and a prepayment (debtor), the latter is reported within current assets (see note 10).
16. Reserves
4.16.1. The total reserves within the consolidated group accounts (Table 6) increased by 9% during the year to £62.8bn (entity: 8%, £61.0bn). The majority of this increase relates to the annual surplus recognised in the year.
4.16.2. The majority of reserves are not ‘cash backed’ as the surpluses transferred to the SOFP are reinvested in providers’ businesses, including major repairs of existing stock and the development of new homes.
4.16.3. Based on consolidated returns, the income and expenditure reserves increased by 10% to £51.1bn and the revaluation reserve reduced by 2% to £11.7bn. Other reserves, as reported in the SOFP (Table 7) are further broken down in Table 24 below.
Table 24: Other reserves
| Consolidated | Entity | |||
|---|---|---|---|---|
| £ billion | 2022 | 2021 | 2022 | 2021 |
| Restricted reserves | 0.4 | 0.2 | 0.4 | 0.1 |
| Cashflow hedge reserves | (0.8) | (1.2) | (0.6) | (1.0) |
| Other reserves | 0.4 | 0.3 | 0.4 | 0.3 |
| Total | (0.0) | (0.7) | 0.1 | (0.5) |
4.16.4. In most cases where providers have applied hedge accounting in respect of interest rate swaps, a negative hedge reserve is recognised. The aggregate hedge cashflow reserve reported by the sector increased by £0.5bn, reflecting the favourable movement in valuation linked to interest rates.
4.16.5. Aggregate restricted reserves and other reserves reported by the sector increased by a combined £0.2bn, a contributing factor to this was movement in the share capital and premium reported by for-profit providers.
17. Operating leases
4.17.1. The total amount of future obligations under operating leases disclosed in the financial statements has reduced by £0.1bn (6%) to £1.9bn. There are three providers with operating lease commitments in excess of £200m, together accounting for 54% of the total.
Table 25: Operating leases
| Consolidated | Entity | |||
|---|---|---|---|---|
| £ billion | 2022 | 2021 | 2022 | 2021 |
| Amounts payable not later than one year | 0.2 | 0.2 | 0.2 | 0.2 |
| Amounts payable between one and five years | 0.5 | 0.5 | 0.5 | 0.5 |
| Amounts payable later than five years | 1.2 | 1.3 | 1.2 | 1.2 |
| Total | 1.9 | 2.0 | 1.9 | 1.9 |
4.17.2. One provider operating a lease-based business model accounts for 31% (£0.6bn) of the total operating lease obligations.
18. Capital commitments
4.18.1. As a note to published accounts, providers must disclose the value of contracts for capital expenditure that are not provided for in the primary financial statements. In addition, they must also disclose the value of capital expenditure that has been approved by the board but not contracted for.
Table 26: Capital commitments
| Consolidated | Entity | |||
|---|---|---|---|---|
| £ billion | 2022 | 2021 | 2022 | 2021 |
| Expenditure contracted but not accounted for | 21.2 | 20.8 | 17.8 | 16.8 |
| Expenditure approved but not contracted for | 20.2 | 17.9 | 15.4 | 13.7 |
| Total | 41.4 | 38.7 | 33.1 | 30.5 |
4.18.2. Based on consolidated returns, future capital expenditure contracted for has increased by 2% to £21.2bn. The value of capital expenditure approved but not yet contracted for has increased by 12% to £20.2bn.
4.18.3. Future capital expenditure commitments are concentrated in a small number of large provider groups. 14 providers disclosed capital commitments in excess of £750m each; together these accounted for 50% of the £41.4bn total.
19. Units
Table 27: Social housing units owned
| Unit numbers (‘000s) | Consolidated | Entity |
|---|---|---|
| 2021 closing units owned | 2,736 | 2,701 |
| Restatements | (29) | (22) |
| Opening units owned | 2,707 | 2,679 |
| Units developed | 49 | 48 |
| Units sold / demolished | (16) | (15) |
| Transfers | 26 | 23 |
| Other movements | 3 | 3 |
| Closing units owned | 2,770 | 2,738 |
| Units managed but not owned | 54 | 72 |
| Units managed and / or owned | 2,824 | 2,810 |
4.19.1. The number of social units developed increased by 22% from 40,000 in 2021 to 49,000 in 2022. Based on consolidated returns, the total number of units owned increased by 33,000 (1%) to 2,770,000. The number owned based on entity returns is slightly lower. For a small number of providers, the consolidated returns include entities operating outside of England.
4.19.2. In total, providers also reported a further 54,000 social units which they manage on behalf of another organisation but do not own. These units are concentrated in a small number of providers, with the top ten accounting for 58% of the total.
4.19.3. Restatements between the 2021 and 2022 returns include some reclassifications between social and non-social stock. However, restatements are mainly the result of merger activity where units included in the 2021 closing total are not shown in the 2022 opening total. Where this is the case, the units will instead be included in the ‘transfers’ line of the acquiring provider following the completion of the merger. Restatements also include the removal of one provider from the dataset since 2021, reducing opening units by 9,000. Half of all consolidated unit transfers in the year relate to one provider.
Table 28: Non-social housing units owned and managed
| Unit numbers (‘000s) | Consolidated | Entity |
|---|---|---|
| 2021 closing units | 94 | 46 |
| Restatements | (2) | (1) |
| Opening units | 92 | 45 |
| Units developed | 1 | 1 |
| Units sold / demolished and other | (2) | (1) |
| Transfers and other movements | (1) | (1) |
| Closing units | 90 | 44 |
4.19.4. The number of non-social homes owned or managed in consolidated returns is greater than that included in entity returns. This reflects the extent to which non-social housing activity is delivered within non-registered entities within group structures.
4.19.5. Based on consolidated returns, 1,000 new non-social rent units were developed or acquired in the year. Excluding restatements, the total number of non-social homes owned by the sector decreased to 90,000. Around 38% of total non-social units are managed on behalf of another organisation.
4.19.6. In addition to the note on non-social housing units, the FVA return includes disclosures relating to the number of outright sale units developed and sold. Based on consolidated returns, 3,600 new outright sale units were completed in the year. In total 58 providers reported outright sale development activity with 15 completing more than 100 units and accounting for 75% of the total.
20. Pensions
4.20.1. Actuarial gains and losses on pension schemes fluctuate year-on-year. In 2022, based on consolidated returns, an overall actuarial gain of £1.5bn was reported, a reversal of the loss reported in 2021 of £1.4bn. The actuarial gain is also reflected in the movement in total pension provision for liabilities, which has decreased by £1.4bn (42%) to £1.9bn (2021: £3.4bn). Nearly all providers reported an actuarial gain and a reduction in the pension provision.
4.20.2. The change in provision and associated gain or loss in terms of defined benefit schemes is reported in other comprehensive income and arises as a result of movements in underlying actuarial assumptions and changes in the value of plan assets. These include projected changes in inflation, the rate of increase in the level of pensions paid, future salary increases, a discount rate linked to gilts, and mortality assumptions in relation to how long a pension is expected to be paid.
4.20.3. In 2022 the actuarial gain on pension schemes is a result of changes to underlying financial assumptions. The main driver for this movement was a higher discount rate at the end of March 2022, due to a significant increase in bond yields, offset by increases in inflation expectations in addition to higher-than-expected asset returns over the year.
Annex – Financial forecasts
5.1. This section of the report provides an overview of data submitted to the regulator in relation to providers’ current business plans.
Background
5.2. Financial forecast returns are collected from all private registered providers owning and/or managing more than 1,000 units. The returns set out the financial elements of providers’ business plans in a standardised form and include 30-year[footnote 28] projections of the key financial statements plus further details of development plans and the key financial assumptions used.
Context
5.3. The data in this report is based on the 202 FFRs submitted in June 2022 and focusses on the first five years of those plans, that is the period from April 2022 to March 2027. It also draws on the submissions from previous years to identify some key long-term trends. Business plans are considered commercially sensitive and therefore the dis-aggregated data source will not be made publicly available.
5.4. Providers’ business plans represent their view of a range of key factors at a given point in time. As such there can be substantial changes made to forecasts between years.
5.5. The latest forecasts show providers’ continued response to the economic conditions following the coronavirus pandemic. Key factors reflected in these returns include:
- Continuing disruption to supply-chains and build cost inflation
- Rising interest rate forecasts
- Ongoing reviews of expenditure on repairs and maintenance particularly in relation to required energy efficiency improvements and decarbonisation.
5.6. The business plans on which these returns are based will have largely been developed during the first quarter of 2022. Since that time there has been a lot of volatility in the wider economic environment, in particular forecasts for both inflation and interest rates have been frequently revised upwards. As a result, the assumptions underlying these forecasts do not fully reflect the economic conditions which will have been experienced during the first forecast year.
5.7. On 31 August the Government launched a consultation[footnote 29] on a proposed cap to be placed on the allowable rent increase for 2023/24. In the Autumn Statement on 17 1. November[footnote 30], it was announced that the allowable rent increase for general needs properties would be capped at 7% for the 2023/24 financial year. The uncapped rent increase would have been 11.1% (the annual rate of CPI in September 2022 plus 1%). The impact of a below inflation cap on rents is not reflected in these forecasts.
Financial statements
5.8. At an aggregate level, the sector continues to forecast surpluses as set out in Table 29 below.
Table 29: Headline Statement of Comprehensive Income (FFR 2022)
| £billion | 2023 (FY1) | 2024 (FY2) | 2025 (FY3) | 2026 (FY4) | 2027 (FY5) |
|---|---|---|---|---|---|
| Turnover | 24.2 | 26.7 | 28.0 | 29.4 | 30.2 |
| Operating costs | (19.1) | (20.4) | (21.0) | (21.8) | (22.3) |
| Operating surplus | 5.1 | 6.3 | 6.9 | 7.5 | 7.9 |
| Surplus on fixed asset sales | 1.1 | 1.0 | 1.1 | 1.0 | 1.0 |
| Net interest costs | (3.2) | (3.4) | (3.6) | (3.8) | (4.1) |
| Other items | 0.2 | 0.2 | 0.3 | 0.2 | 0.2 |
| Surplus for the year | 3.2 | 4.1 | 4.6 | 5.0 | 5.0 |
5.9. The sector’s balance sheet is forecast to grow as set out in Table 30 below. Investment in the fixed asset base continues with housing properties forecast to reach a balance sheet value of £235bn by 2027, an increase of 37% over the first five forecast years. This reflects the impact of both the sector’s development programme and increased levels of capitalised spending on existing stock.
Table 30: Headline Statement of Financial Position (FFR 2022)
| £billion | 2023 (FY1) | 2024 (FY2) | 2025 (FY3) | 2026 (FY4) | 2027 (FY5) |
|---|---|---|---|---|---|
| Housing properties | 184.1 | 198.1 | 210.9 | 223.3 | 234.9 |
| Investments | 9.7 | 10.1 | 10.1 | 10.2 | 10.3 |
| Cash | 5.5 | 5.0 | 4.2 | 3.7 | 3.8 |
| Other assets | 15.4 | 15.7 | 15.9 | 15.8 | 15.4 |
| Total assets | 214.7 | 228.8 | 241.0 | 253.1 | 264.4 |
| Debt | 94.8 | 103.2 | 109.3 | 115.1 | 120.7 |
| Grant | 41.4 | 43.1 | 44.8 | 46.1 | 47.0 |
| Other creditors | 13.2 | 13.0 | 12.8 | 12.6 | 12.4 |
| Reserves | 65.3 | 69.5 | 74.2 | 79.2 | 84.3 |
| Total creditors and reserves | 214.7 | 228.8 | 241.0 | 253.1 | 264.4 |
5.10. By 2027 total debt is forecast to increase by £32bn (37%) to reach £121bn. At a sector aggregate level this is broadly in line with what was anticipated in the 2021 forecasts. Over the same period grant will increase by £7bn (17%) to reach £47bn, a 2% increase on the 2021 forecast for that year.
Operating performance
5.11. There has been a decline in some key measures of operating performance in the latest set of forecasts in comparison to the previous year.
5.12. EBITDA MRI[footnote 31] interest cover is a key measure of providers’ ability to cover finance costs from operating income. Figure 12 below compares the five-year forecast in the latest set of plans to that from 2021.
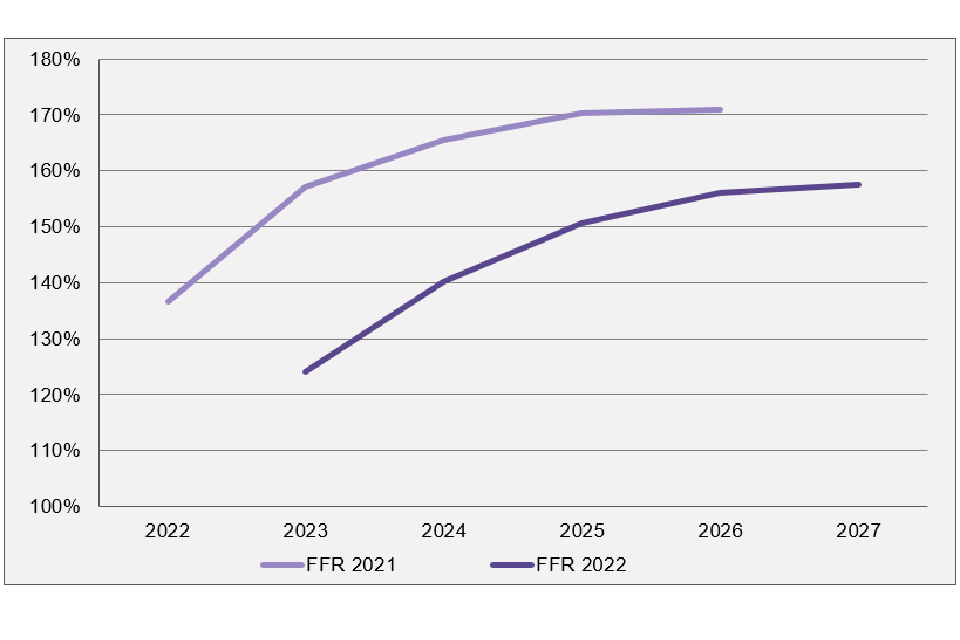
Figure 12: EBITDA MRI interest cover - 5-year forecasts
5.13. The main driver of this change is an increase in forecast expenditure on repairs and maintenance. The sector is projecting spend of £40.7bn on repairs and maintenance over the first five years of latest forecasts. This is a £5.5bn (16%) increase in relation to the comparable figure from last year’s plans. In comparison, forecast income from SHL is only up by 8%.
5.14. With forecast investment in existing and new social housing supply projected to continue, the sector is now forecasting a prolonged period of lower margins and reduced headroom over finance costs.
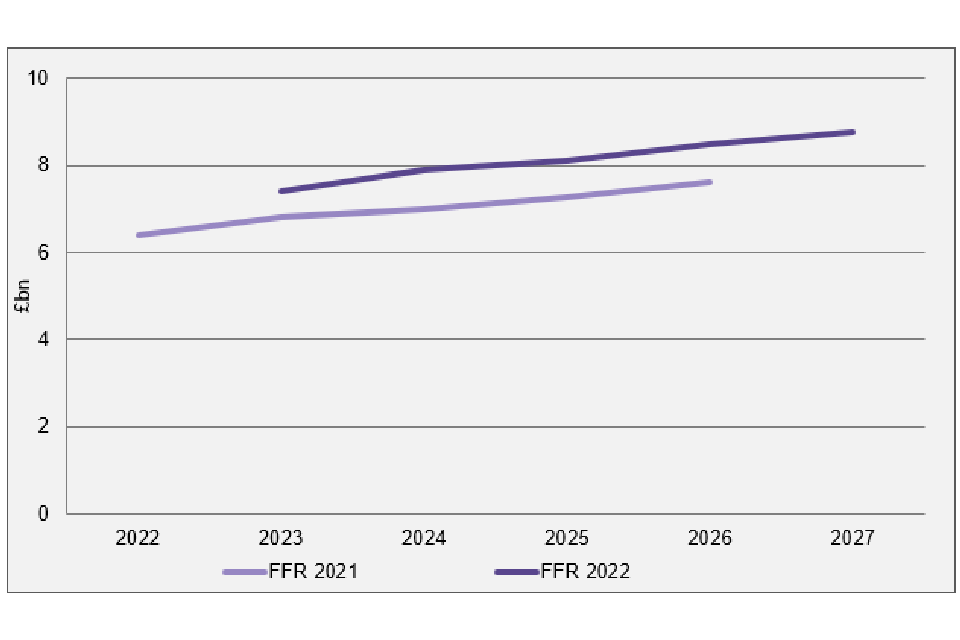
Figure 13: Total maintenance and major repairs expenditure (£bn)
5.15. The increase in spend is widespread across the sector with 84% of providers increasing their per unit spend over the first five years by at least 5%. There are several drivers for this increase in expenditure:
- Catch up: some of the increase will reflect re-profiling of spend that was delayed during the pandemic.
- Economic factors: increasing general inflation combined with real terms increases in the cost of repairs and maintenance.
- Stock quality: increased spending in response to building safety and decarbonisation requirements.
- Approximately 10% of all forecast spend on repairs and maintenance relates specifically to building safety works.
- The vast majority of providers have included provisions in plans to bring stock towards EPC C in the medium term. Although costs are far less certain, most providers have stated they are working towards net-zero carbon by 2050.
Long-term forecast trends
5.16. Comparing the aggregate sector forecasts submitted over the last five years reveals some of the key trends within the sector. The latest forecasts are consistent with a longer trend showing year-on-year increases in forecast expenditure on existing stock and consequently declining levels of interest cover.
5.17. Figure 14 below shows sector aggregate results for the first five forecast years over the last five submissions.
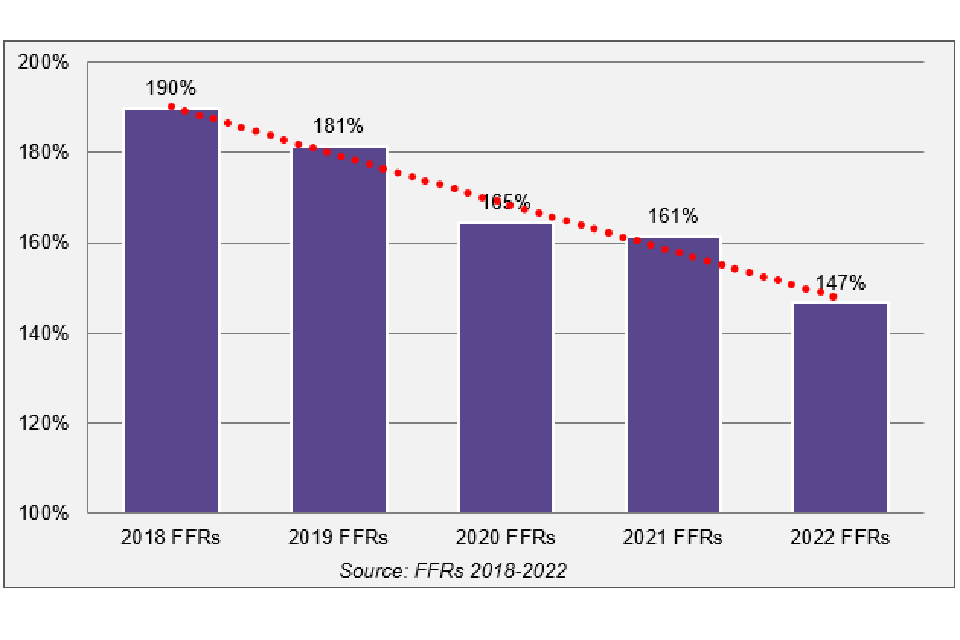
Figure 14: Yr1-5 aggregate EBITDA MRI interest cover
5.18. The latest plans show a continuing deterioration of forecast levels of interest cover with the five-year forecast aggregate at 147%. The key driver for this is increasing forecast expenditure on existing stock. This is illustrated below in Figure 15 which shows that nominal aggregate forecast repairs and maintenance spend per unit has increased by 45% in comparison to the 2018 forecasts.
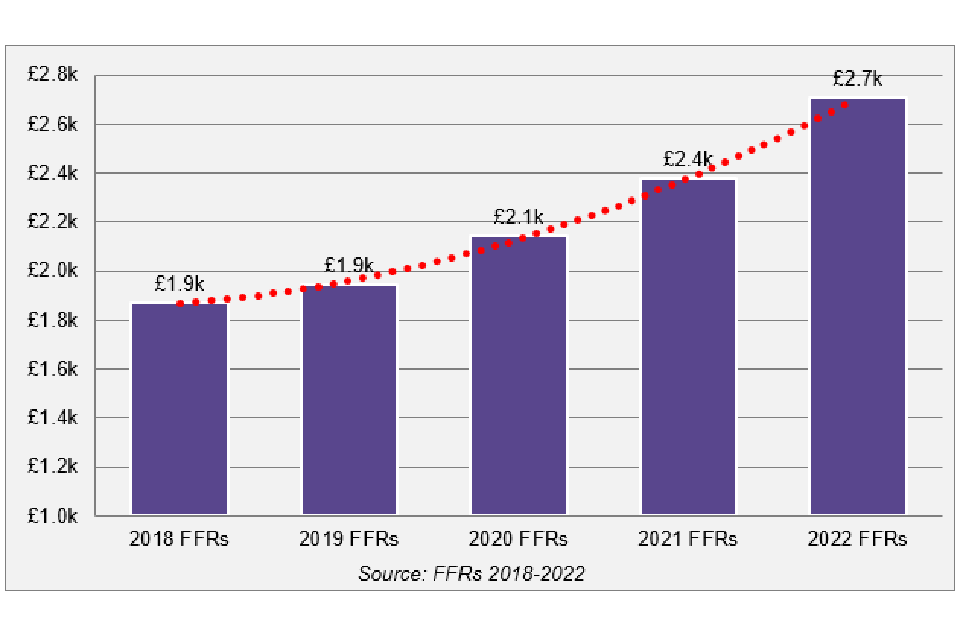
Figure 15: Yr1-5 aggregate repairs and maintenance spend per unit (£000s)
5.19. While peak net debt continues to increase, rising from £106bn in the 2020 forecasts to £124bn in the latest submissions, projected indebtedness (as a multiple of turnover) remains stable as shown below in Figure 16.
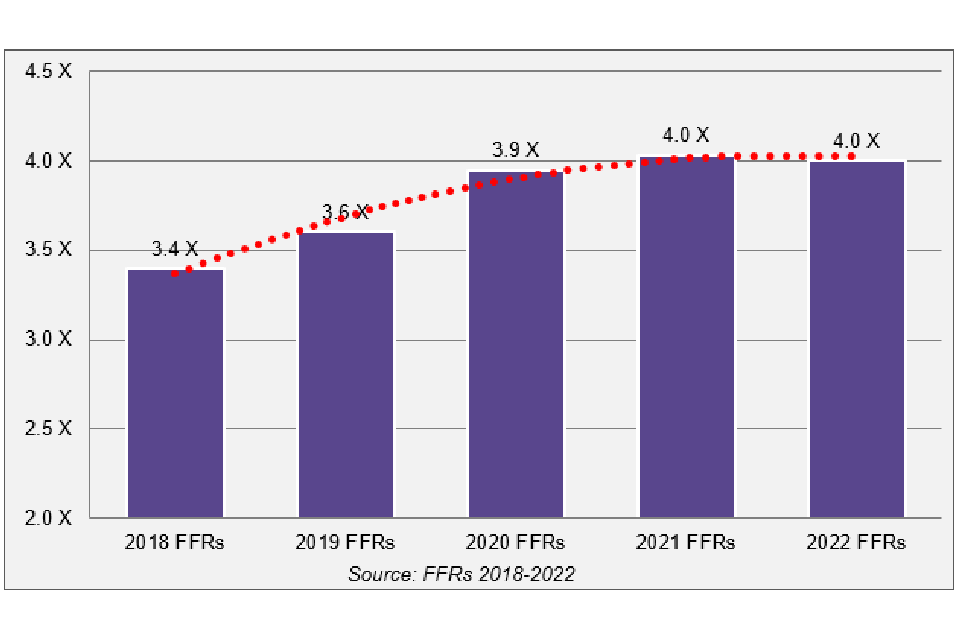
Figure 16: Yr1-5 aggregate debt to turnover multiple
5.20. In previous years, low interest rates available on new debt had been a mitigating factor against lower margins. In this year’s plans the EIR was already forecast to be slightly higher. However, rising interest rates and market volatility since business plan submission means that finance costs are now clearly an exacerbating factor putting further downward pressure on levels of interest cover.
Conclusions
5.21. The latest financial forecasts consolidate the recent picture which sees providers maintaining consistent levels of development in addition to committing to additional expenditure on their existing stock. The impact of this is seen in tighter operating margins and decreased levels of interest cover.
5.22. The sector is currently facing constrained resources and significantly increased uncertainty from the deteriorating macro-economic environment. Providers will need to continue to meet their core objectives and deliver in line with their strategic direction while mitigating the economic, social and financial impacts of the current environment.
-
Earnings Before Interest Tax Depreciation and Amortisation inclusive of all major repair costs ↩
-
COVID-19 Response - Spring 2021 (Summary) - GOV.UK (www.gov.uk) ↩
-
Construction materials shortage easing but prices up by 24% - Homebuilding ↩
-
Construction Output Price Indices - Search - Office for National Statistics ↩
-
Construction output in Great Britain: March 2022- Office for National Statistics ↩
-
Construction repair and maintenance in Great Britain - Office for National Statistics ↩
-
Stamp Duty Land Tax: temporary reduced rates - GOV.UK (www.gov.uk) ↩
-
UK House Price Index - Office for National Statistics (ons.gov.uk) ↩
-
Consumer price inflation, UK - Office for National Statistics ↩
-
National statistics overview: UK labour market: May 2022 - GOV.UK (www.gov.uk) ↩
-
Changes to the Coronavirus Job Retention Scheme from July 2021 - GOV.UK (www.gov.uk) ↩
-
Official statistics overview: Universal Credit statistics, 29 April 2013 to April 2022 ↩
-
Moody’s changes the outlook on the UK to negative, affirms Aa3 ratings - Rating Action - Moody’s (moodys.com) ↩
-
Social Housing - News - Eight HAs handed ‘negative’ outlook by S&P after action on UK position ↩
-
The U.K. Social Housing Sector Now Displays A More Pronounced Negative Bias In Its Creditworthiness - S&P Global Ratings (spglobal.com) ↩
-
Quarterly survey of private registered providers - GOV.UK (www.gov.uk) ↩
-
One provider recognises social housing properties as Investment Properties in their financial statements. Although this is a deviation from the Housing SORP, this is permitted under IAS 40 as the for-profit provider holds properties for capital appreciation. ↩
-
Quarterly survey for Q4 (January to March) 2021 to 2022 - GOV.UK (www.gov.uk) ↩
-
Quarterly survey for Q2 (July to September) 2022 to 2023 - GOV.UK (www.gov.uk) ↩
-
As public benefit entities, combinations between providers which cannot be classified as a merger are treated either as ‘combinations that are in substance a gift’ or as ‘acquisitions’. The acquiring provider is required to recognise the fair value of the transferring provider in the Statement of Comprehensive Income ↩
-
Includes mergers where the acquisition method is used and the units are transferred/acquired during the year. ↩
-
The net book value at the start of the period has been restated based on FVA returns submitted in 2022. The net book value on restatement excludes the value of housing properties transferred in the year where business combinations are accounted for using the acquisition method and includes the value of housing properties reported by providers completing the FVA for the first time in 2022. The NBV of housing properties reported in the 2021 Global Accounts was £166.1bn based on consolidated returns (£161.0bn based on entity returns). ↩
-
Based on the restated net book value at the start of the period from FVA returns submitted in 2022. ↩
-
Three providers without substantial development plans submitted 5-year forecasts in 2022. ↩
-
Earnings Before Interest Taxation Depreciation and Amortisation, Major Repairs Included. ↩