2021 Area Cost Adjustment methodology note
Published 29 March 2022
Applies to England

© Crown copyright 2022
This publication is licensed under the terms of the Open Government Licence v3.0 except where otherwise stated. To view this licence, visit nationalarchives.gov.uk/doc/open-government-licence/version/3 or write to the Information Policy Team, The National Archives, Kew, London TW9 4DU, or email: psi@nationalarchives.gov.uk.
Where we have identified any third party copyright information you will need to obtain permission from the copyright holders concerned.
This publication is available at https://www.gov.uk/government/publications/2021-area-cost-adjustment/2021-area-cost-adjustment-methodology-note
1. Policy background
This note provides the methodology to calculate the Area Cost Adjustments (ACA). This ACA is referred to as the 2021 ACA and is an update to the Covid ACA. The 2021 ACA was used in the calculation of the 2022/23 Local Council Tax Support (LCTS) admin subsidy Grant.
The ACA is a tool used to measure the variation in the cost of providing services for local authorities in England. The cost of providing services varies between local authorities due to several internal and market factors. The ACA only measures the market factors such as the cost of labour, rent, and accessibility within local authorities. The ACA is used to compensate local authorities that experience higher costs when providing services. The ACA consists of the three adjustment factors:
- Labour cost adjustment (LCA) - which measures the difference in the cost of labour between local authorities.
- Rates cost adjustment (RCA) - which measures the difference in the cost of property rates/rents between local authorities.
- Accessibility - which measures the impact of the difference in travel time to provide services on the cost of labour. This factor consists of a Dispersal adjustment factor and a Traversal adjustment factor. They are measured using journey time data and combined with the LCA since they are measures of additional labour cost.
The government is committed to funding councils based on an accurate and up-to-date assessment of their needs, including variation in the cost of delivering services due to local factors.
2. Data and methodology
2.1 Overview
The LCA, RCA and Journey Times measures are each calculated as indices with a mean of 1, with higher cost authorities scoring above one and vice versa. The following tables summarise the methodologies and rationale for calculating each index. Annex B provides the technical regression specifications for the LCA and RCA.
Table 1: Summary of the LCA and RCA
| What are we measuring? | Data | What factors are controlled for? | |
|---|---|---|---|
| LCA | Spatial variation in the going rate for similar workers, accounting for the effects of other factors known to affect wages. | ONS Annual Survey of Hours and Earnings (ASHE) 2017, 2018 & 2019 final data. | Age, Sex, Full-time vs Part-time, Public vs Private sector, Occupation (e.g. “Chief Executive” or “Dental Therapist”), Industry (e.g. “Advertising” and “Youth Work”). |
| RCA | Spatial variation in the going rate for similar properties, accounting for the effects of building characteristics known to affect valuation. | A detailed database of property valuations from the Valuation Office Agency (VOA). | Property Type, Types of Features (e.g. air conditioning), Valuation adjustments (e.g. age, variations in floor level), Plant and Machinery value, Area of property, Proportion of area taken up by additional features such as car parks. |
Table 2: Summary of the Accessibility Components in the LCA
| Measure | Description | Rationale |
|---|---|---|
| Traversal | - Journey times from Lower Super Output Areas (400 to 1,200 households) to the closest Lower Super Output Areas (LSOA) in an area totalling 10,000 people. - The centre of LSOAs is determined by the ONS using population weights. |
Reflects the additional cost – in terms of employee time and therefore paybill – of longer journeys between households when delivering services such as waste collection. |
| Dispersal | - DfT Journey Times from Output Areas (average 129 households) to the closest “hub town” (settlement of over 10,000 people). - The centre of each “hub town” is the centre of an Area of Town Centre Activity (ATCA) or a selected school or shop in a settlement without an ACTA. |
Reflects the additional cost – in terms of employee time and therefore paybill – of longer journeys to reach households to provide services such as child protection visits. |
3. Weights
3.1 Components of the ACA are weighted together into a single index for the relevant service area.
3.2 Weights for the LCA and RCA are determined using two data sources: Revenue Outturn (RO) and Subjective Analysis Return (SAR). RO statistics show the actual revenue spending of all local authorities in England using the final audited financial accounts where possible. A sample of authorities in England complete the SAR to give a detailed breakdowns of spending within services. Since data aggregated at the service level is used to calculate the weights, the final ACAs for individual authorities are not dependent directly on their RO or SAR return.
- Local authorities record the split of their spending on each service line in the RO between: “employee costs” and “running costs”.
- Next, we identify the components of ‘Running Costs’. The SAR collates authorities’ break down of running costs into categories and we assign these categories to the most appropriate components of the ACA (see Annex C for a full list).
- The cost of spending for some categories is assumed to vary with one of the LCA, RCA or accessibility (for example, agency staff costs are assigned to the LCA).
- Some categories are assumed to be unaffected by any components of the ACA and remain unadjusted (for example, energy costs are assumed not to vary geographically).
- Some categories are assumed to be affected by all three factors and are split (for example, contracted services).
3.3 In line with the previous Area Cost Adjustments, we assume 70% of contracted costs are labour costs, so assume 70% of the split category refers to employee costs and 30% refers to running costs. We apply the weights from the previous step to split the “running costs” of those categories assigned to ‘split’.
3.4 Adding the employee costs from the RO to the labour costs from within running costs and splitting insurance costs according to these weights, we get a final weight for the LCA and RCA.
3.5 Accessibility is a measure of additional employee time needed to deliver services owing to journey times and is therefore applied to the LCA. Weights for Accessibility are determined using the National Transport Survey or service specific cost modelling where data is available.
3.6 The default weight is calculated using the average number of hours per year spent travelling for work by relevant workers in the National Transport Survey (NTS), as a proportion of all paid time.
3.7 Once the weights are determined, the indices are combined to form ACAs. The weights are found in Annex A and the equations in Annex B.
3.8 All indices are calculated at lower and upper tier levels, with separate regressions for each tier.
3.9 51% and 57% of the weight is allocated to the labour cost adjustment for the lower tier and upper tier foundation formula ACAs respectively, as labour costs are the biggest expenditure for local authorities. A lower weighting is given to the rates cost adjustment, as a minority of local authority running costs are impacted by rent costs. Accessibility (dispersal and traversal) weights are combined with the LCA weight before being applied to the LCA adjustment factor as both weights are related to the cost of labour.
3.10 The LCA weight, RCA weight and Unadjusted weights all sum to 1 for each spending area. Accessibility weights are separate as they form the Adjusted LCA.
4 Comparison to previous ACAs
4.1 2013/14 ACA: there are several differences to the 2021 ACA. These can be summarised as:
- Updated data and Local Authority Geographies.
- The addition of dispersal and traversal adjustment factors.
- A move away from discrete tier ACA index values to each local authority having a unique ACA index value calculated from input data drawn directly from that local authority.
- Changes to how the ACA is calculated for different tiers. Adjustment factors are calculated from the input data separately for different tiers , to remove the influence population has on the ACA outputs.
- Capping of the City of London Accessibility adjustment factor values (see Other Assumptions).
4.2 Covid ACA: the 2021 ACA uses the same methodology as the Covid ACA. The main differences between these two updates can be summarised by:
- Updated input data which included using 2017-2019 ASHE final data, updated RO data and SAR data to calculate the weights, updated data on hours spent travelling for work in the NTS.
- New Local Authority Geographies which included values for North Northamptonshire and West Northamptonshire.
- RCA and LCA indices calculated through regression analysis for both upper and lower tier rather than using a population-based conversion approach taken in Covid ACA.
5 Other assumptions
5.1 Capping the City of London (CoL) Accessibility values
- The CoL’s dispersal value is 134% larger than the mean value for other Inner London Boroughs (ILBs). This is because the City’s population is less than 10,000 people, which is required to be a ‘hub town’, therefore journeys are measured to other ILBs.
- The CoL’s traversal value is 63% higher than the mean value for other ILBs. Due to the small population, the CoL only has 5 LSOAs, compared with 20-30+ other London boroughs. Therefore there are fewer possible connections between neighbouring LSOAs, increasing journey times.
- Therefore, due to the un-naturally high values from the CoL’s unique characteristics, the City’s traversal and dispersal values are capped at the median values for all other ILBs.
Annex A: Weightings
Table 3: Weights used in the Upper and Lower Tier Foundation Formula Area Cost Adjustments
| RNF | LCA | RCA | Unadjusted Weight | Accessibility |
|---|---|---|---|---|
| Lower Tier* | 56% | 7% | 36% | 6% |
| Upper Tier | 51% | 8% | 41% | 3% |
*Figures may not sum to 100% due to rounding.
Annex B: Equations
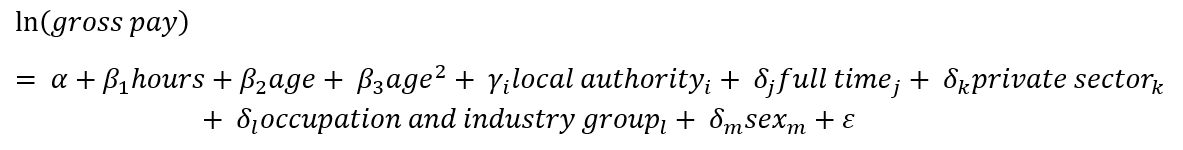
Equation 1: Regression specification for the LCA
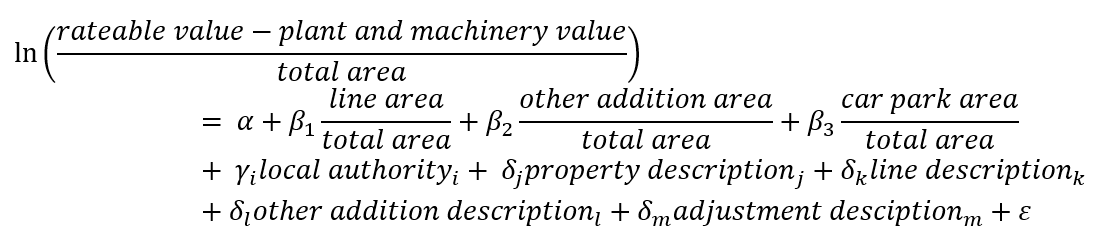
Equation 2: Regression specification for the RCA
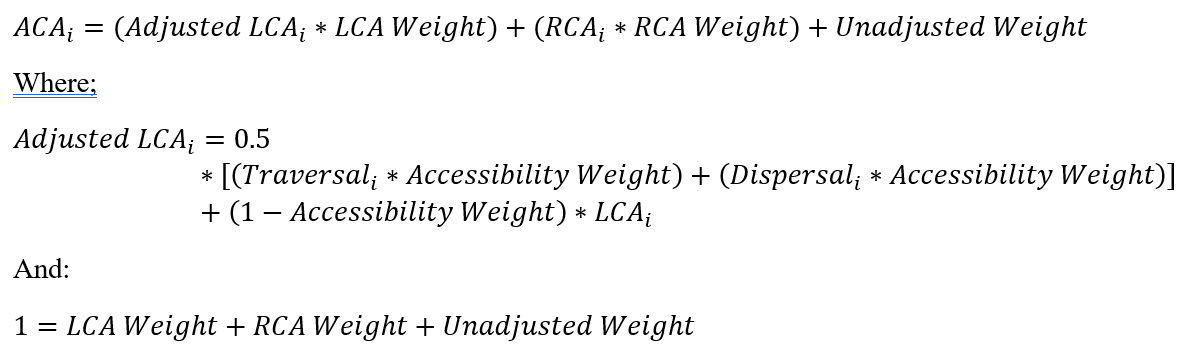
Equation 3: Calculation of the final ACA for Local Authority ‘i’
Annex C: SAR
- The SAR (Subjective Analysis Return) is a survey of local government revenue and expenditure, completed by a sample of authorities in England every 3 years.
- It is used to assign weights for the different components of the ACA. As not all authorities fill in the SAR, weights are calculated using aggregated data. Sub-categories of expenditure in the SAR are subjectively assigned to either the LCA, RCA, Accessibility (which is incorporated into the LCA weights), Split and Unassigned:
Table 4: Summary of the ACA categories given to the SAR components
| PART B - RUNNING EXPENSES | Weighting |
| 18 Repairs, Alterations and Maintenance of Buildings | RCA |
| 19 Energy Costs - Electricity, Gas and Other | Unadjusted |
| 21 Rents | RCA |
| 22 Rates | RCA |
| 23 Water Services | Unadjusted |
| 24 Fixtures & Fittings | RCA |
| 25 Cleaning and Domestic Supplies | RCA |
| 26 Grounds Maintenance Costs | RCA |
| 27 Premises Insurance | RCA |
| 28 Other Premises Related Expenditure | RCA |
| 29 TOTAL PREMISES EXPENSES (Total of lines 18 to 28) | Sub-total |
| 30 Direct Transport Costs - Vehicle Running Costs, Repair & Maintenance | Split |
| 32 Contract Hire and Operating Leases | Unadjusted |
| 33 Car Allowances for Travelling Expenses | Unadjusted |
| 34 Public Transport Allowances for Travelling Expenses | Unadjusted |
| 35 Transport Insurance | Unadjusted |
| 36 Other Transport Related Expenditure | Unadjusted |
| 37 TOTAL TRANSPORT EXPENSES (Total of lines 30 to 36) | Sub-total |
| 38 Equipment, Furniture & Materials | Unadjusted |
| 39 Catering | Split |
| 40 Clothing, Uniforms & Laundry | Unadjusted |
| 41 Printing, Stationery and General Office Expenses | Unadjusted |
| 42 Communications and Computing - Postage, Telephone, Computer Costs and Other | Unadjusted |
| 46 Subsistence and Conference Expenses | Unadjusted |
| 47 Subscriptions | Unadjusted |
| 48 Insurance | Other |
| 49 Schools’ Non ICT Learning Resources | Unadjusted |
| 50 Schools’ ICT Learning Resources | Unadjusted |
| 51 Exam Fees | Unadjusted |
| 52 Other Supplies and Services Expenditure | Unadjusted |
| 53 TOTAL SUPPLIES & SERVICES EXPENDITURE (Total of lines 38 to 52) | Sub-total |
| 54 Joint Authorities and Other Local Authorities | Unadjusted |
| 55 Grants to Voluntary Bodies | Unadjusted |
| 56 Private Contractors and Other Agencies - Professional Services | Split |
| 57 Private Contractors and Other Agencies - Agency Staff | LCA |
| 58 Private Contractors and Other Agencies - Other | Split |
| 59 Internal Trading Organisations | Unadjusted |
| 60 TOTAL THIRD PARTY PAYMENTS (Total of lines 54 to 59) | Sub-total |
| 61 Total Transfer Payments (Discretionary) | Unadjusted |
| 62 Expenditure on Management and Support Services | LCA |
| 68 Balancing Item | LCA |
| 63 TOTAL Part B (Total of lines 29, 37, 53, 60, 61 & 62) | Sub-total |