Further education and skills inspections and outcomes as at 31 August 2016
Published 24 November 2016

© Crown copyright 2016
This publication is licensed under the terms of the Open Government Licence v3.0 except where otherwise stated. To view this licence, visit nationalarchives.gov.uk/doc/open-government-licence/version/3 or write to the Information Policy Team, The National Archives, Kew, London TW9 4DU, or email: psi@nationalarchives.gov.uk.
Where we have identified any third party copyright information you will need to obtain permission from the copyright holders concerned.
This publication is available at https://www.gov.uk/government/statistics/further-education-and-skills-inspection-outcomes-as-at-31-august-2016/further-education-and-skills-inspections-and-outcomes-as-at-31-august-2016
This release contains:
- final data for the most recent inspection outcomes as at 31 August 2016
- final data for inspections conducted between 1 September 2015 and 31 August 2016
There has been a 51% increase in the number of further education and skills inspections conducted this year.
The introduction of short inspections has enabled Ofsted to inspect 410 further education and skills providers between 1 September 2015 and 31 August 2016; a 51% increase compared with 2014/15.
The proportion of general further education colleges judged good or outstanding has declined by 6 percentage points.
The most recent inspection outcomes for general further education colleges have declined from 77% judged good or outstanding as at 31 August 2015, to 71% as at 31 August 2016.
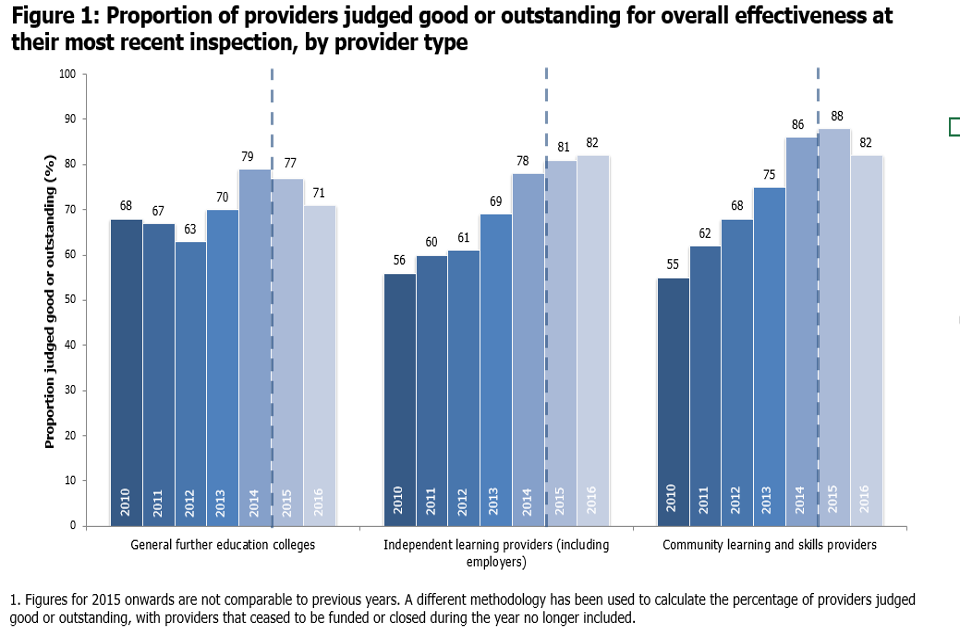
Figure 1
The proportion of community learning and skills providers judged good or outstanding has declined for the first time since 2010.
The most recent inspection outcomes for community learning and skills providers have declined from 88% judged good or outstanding as at 31 August 2015, to 82% as at 31 August 2016.
1. Key findings
1.1 In-year inspection outcomes
Between 1 September 2015 and 31 August 2016, 410 further education and skills providers were inspected. This was a 51% increase compared with the number of inspections conducted in 2014/15. This year’s inspections included 108 colleges, 161 independent learning providers (including employer providers) and 93 community learning and skills providers. Ofsted also contributed to the inspections of 42 prisons and young offender institutions, where the reports were published between 1 September 2015 and 31 August 2016.
Ofsted’s inspectors were able to visit more providers this year through the introduction of short inspections for previously good providers, under the new Common Inspection Framework. During 2015/16, 286 providers were risk assessed to receive a full inspection and 124 providers received a short inspection. The short inspections resulted in 113 providers remaining good, with 11 short inspections converting to a full inspection. From these converted inspections one provider improved to outstanding, 4 remained good and 6 declined to requires improvement.
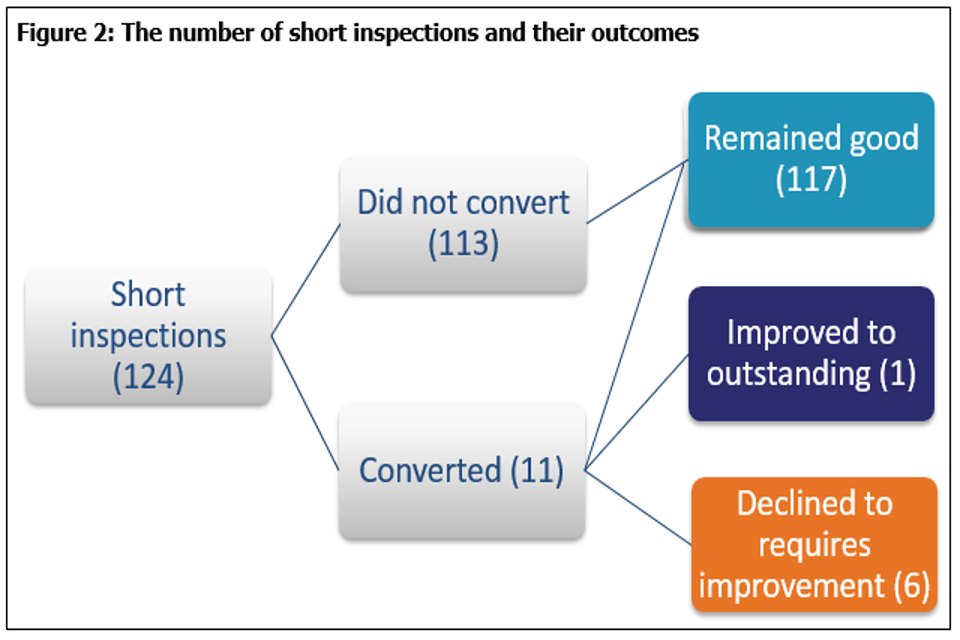
Figure 2
The outcomes from full and short inspections conducted between 1 September 2015 and 31 August 2016, found 6% of further education and skills providers to be judged outstanding, 62% good, 24% requiring improvement and 8% inadequate. The proportion judged good or outstanding was 19 percentage points higher than the previous year. More previously good providers were inspected this year and more remained good at inspection (see Figure 3).
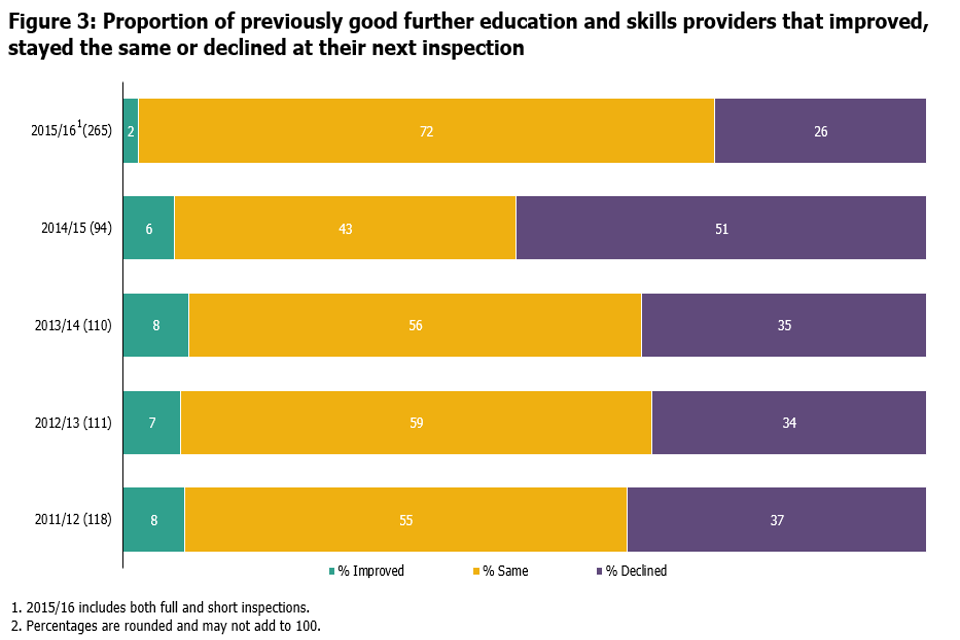
Figure 3
1.2 Most recent inspection outcomes
Despite the higher in-year outcomes, there has still been a decline in some parts of the sector, particularly for general further education (FE) colleges and community learning and skills providers. This happens when more providers decline to requires improvement or inadequate, than improve to good or outstanding. Previously good providers that remain good, whilst having an impact on the in-year inspection outcomes, will not impact on the most recent inspection outcomes.
As at 31 August 2016, the percentage of further education and skills providers judged good or outstanding at their most recent inspection was 81%.
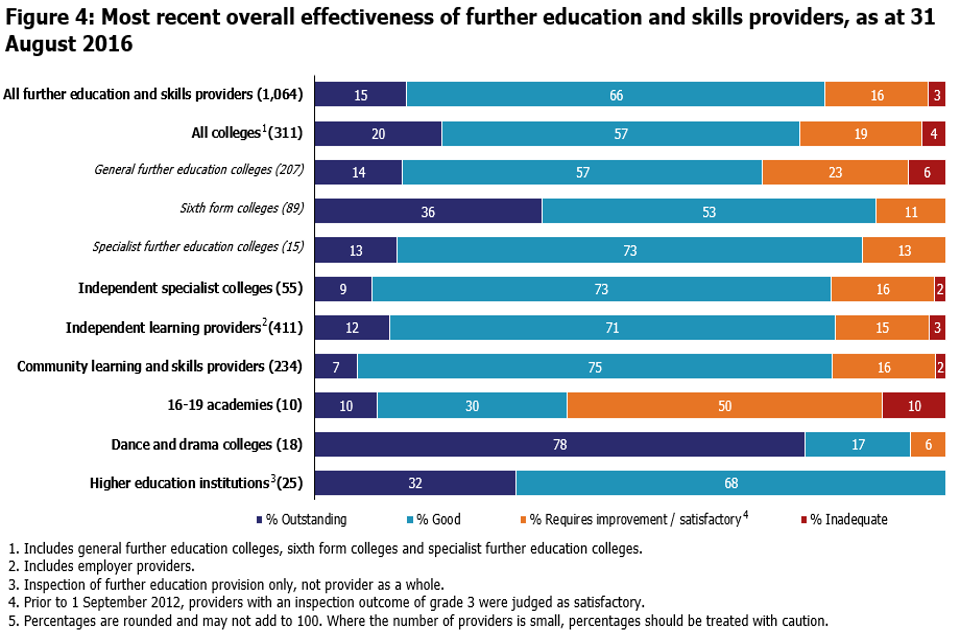
Figure 4
General further education colleges
The proportion of general FE colleges judged good or outstanding at their most recent inspection has declined by 6 percentage points, from 77% as at 31 August 2015 to 71% as at 31 August 2016.
Over the same period, the number of open and funded general FE colleges has decreased from 215 to 208. This decrease of 7 was caused by the addition of 2 new providers and the loss of 9 providers that merged, 8 of which were previously judged good. This reduces the total number of colleges reported on and the number of colleges judged to be good or outstanding.
Although the mergers have had an effect on the proportion of good or outstanding colleges declining (of around 2 percentage points), the bulk of the decline has been caused by the number of previously good or outstanding colleges declining to requires improvement or inadequate. During 2015/16, 21 colleges that were previously good or outstanding declined to requires improvement or inadequate, with just 9 colleges improving to good. The greater number of colleges declining, rather than improving, caused the proportion judged good or outstanding to drop by around 4 percentage points.
Independent learning providers (including employer providers)
The proportion of independent learning providers (including employer providers) judged good or outstanding increased by 2 percentage points, from 81% as at 31 August 2015 to 82% as at 31 August 2016.[footnote 1]
When excluding employer providers, there were 403 independent learning providers open and funded as at 31 August 2016. The proportion judged good or outstanding increased from 80% as at 31 August 2015 to 83% as at 31 August 2016. This improvement predominantly came from more providers improving to good or outstanding than declining.
However, for the smaller group of employer providers, the proportion judged good or outstanding declined by 5 percentage points over this same period, from 84% to 80%.[footnote 2] As the employer providers are smaller in number, 75 as at 31 August 2016, their decline had a smaller impact on the proportion judged good or outstanding for the overall group. Part of this decline was caused by all 3 new employer providers being judged to require improvement at their first inspection.
Community learning and skills providers
The proportion of community learning and skills providers judged good or outstanding at their most recent inspection has declined by 6 percentage points, from 88% as at 31 August 2015 to 82% as at 31 August 2016.
This decline has been almost entirely caused by previously good local authorities and not for profit organisations declining to requires improvement or inadequate when inspected this year.
2. Revisions
The June 2016 statistics reported on inspections carried out between 1 September 2015 and 29 February 2016. There were 6 inspections that took place during this period that were not published at the time of reporting. These inspections have now been published and are included in the underlying data published alongside this report.
Of those 6 inspections there were: 3 general FE college inspections, with one judged to be outstanding, one good and one requiring improvement; one community learning and skills provider inspection, judged to be good; a short inspection of an independent learning provider that remained good; and a short inspection of a sixth form college that remained good.
These revisions would have had the following impact to the in-year statistics:
- the proportion of good or outstanding sixth form colleges increased by 2 percentage points, to 71%.
- both the general FE colleges and the overall ‘colleges’ proportion judged outstanding increased from 0% to 2%.
3. Notes
-
As at 31 August 2015 and 31 August 2016, the most recent inspection outcomes included providers wholly or partly funded by the Skills Funding Agency or the Education Funding Agency at that point in time. For 31 August 2014 and before, the most recent inspection outcomes included: 1) providers wholly or partly funded by the Skills Funding Agency or the Education Funding Agency at that point in time, and 2) providers who had lost funding or closed during the corresponding reporting year.
-
Short inspections of previously good providers can either confirm that the provider is still good overall, or the lead inspector can choose to convert the inspection to a full inspection where: there is insufficient evidence to confirm that the provider remains good; there are concerns that there is evidence that the provider may no longer be good (which may include concerns about safeguarding); or if there is sufficient evidence of improved performance to suggest that the provider may be judged outstanding. As a result of the converted inspection the provider could improve, decline or remain the same.
-
The quality report for these official statistics contains an explanation of the methodology used and the relevant inspection frameworks, along with other useful information, such as where to find previously published further education and skills Official Statistics. It is available from: https://www.gov.uk/government/statistics/further-education-and-skills-inspection-outcomes-as-at-31-august-2016
-
In 2016, the National Statistician published new guidance covering management information and official statistics. This guidance can be accessed here: https://gss.civilservice.gov.uk/blog/2016/06/management-information-guidance/
If you have any comments or feedback on this publication, please contact Sarah Pearce on 03000 130 632 or Sarah.Pearce@ofsted.gov.uk