Further education and skills inspections and outcomes as at 31 August 2017: main findings
Published 28 November 2017

© Crown copyright 2017
This publication is licensed under the terms of the Open Government Licence v3.0 except where otherwise stated. To view this licence, visit nationalarchives.gov.uk/doc/open-government-licence/version/3 or write to the Information Policy Team, The National Archives, Kew, London TW9 4DU, or email: psi@nationalarchives.gov.uk.
Where we have identified any third party copyright information you will need to obtain permission from the copyright holders concerned.
This publication is available at https://www.gov.uk/government/statistics/further-education-and-skills-inspections-and-outcomes-as-at-31-august-2017/further-education-and-skills-inspections-and-outcomes-as-at-31-august-2017-main-findings
This release contains:
- provisional data for the most recent inspections and outcomes as at 31 August 2017
- provisional data for inspections conducted between 1 September 2016 and 31 August 2017
- revised data for inspections conducted between 1 September 2016 and 28 February 2017
The number of sixth form colleges judged good or outstanding has reduced by a fifth.
This can be attributed to a drop in performance at inspection this year and to the reduction in the number of good and outstanding sixth form colleges as a result of mergers and conversions to academies. This affected the proportion of sixth form colleges judged good or outstanding, which declined by 8 percentage points.
Figure 1: Proportion of sixth form colleges judged good or outstanding for overall effectiveness at their most recent inspection, over time
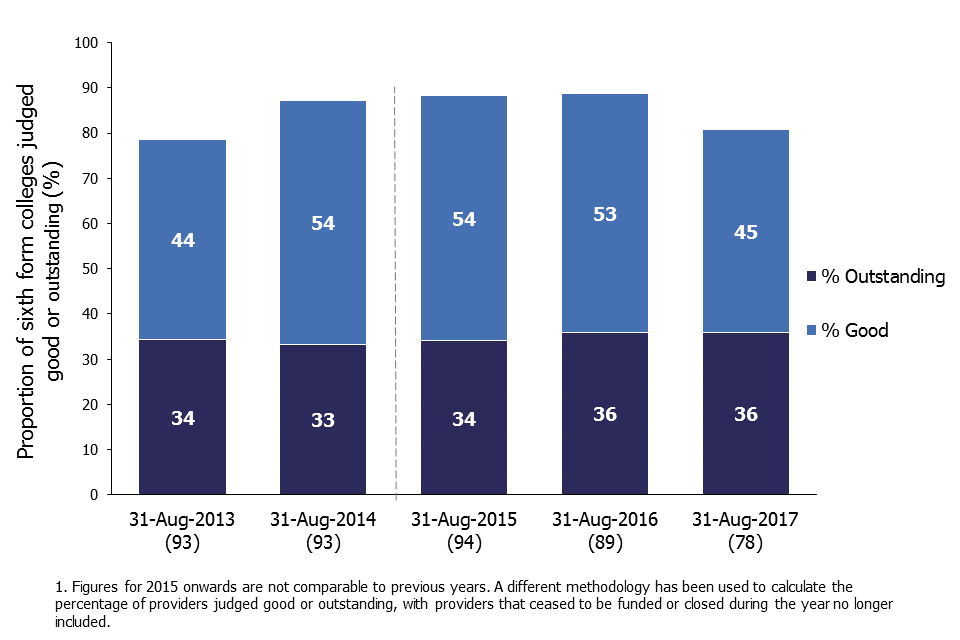
The proportion of sixth form colleges judged good or outstanding at their most recent inspection was 8 percentage points lower as at 31 August 2017 than as at 31 August 2016
The proportion of community learning and skills providers judged good or outstanding this reporting year was higher than last year, at 78%.
A higher proportion of providers previously judged good remained good at inspection and a higher proportion of providers that previously required improvement improved to be good at inspection this year.
A fifth of general further education colleges were involved in a merger during this reporting year.
Forty-two general further education colleges went through the mergers process this year, affecting around 285,000 learners.
1. Introduction
1.1 In-year inspection outcomes
Between 1 September 2016 and 31 August 2017, 392 further education and skills providers were inspected. These included 102 colleges, 159 independent learning providers (including employer providers) and 78 community learning and skills providers. Ofsted also contributed to the inspections of 41 prisons and young offender institutions, where the reports were published between 1 September 2016 and 31 August 2017.
The 392 inspections consisted of 274 full inspections and 118 short inspections (including those that converted to full inspections). These inspections can be broken down in to the following categories:
- 127 risk-assessed full inspections of previously good or outstanding providers
- 118 short inspections of previously good providers (including those that converted to a full inspection)
- 100 routine full inspections of providers previously judged requires improvement or inadequate
- 45 full inspections of providers that were inspected for the first time
- 2 full inspections of outstanding providers that were not exempt from inspection[footnote 1]
Of the 118 short inspections, 94 providers remained good and 24 short inspections converted to a full inspection. From these converted inspections 8 providers improved to outstanding, 3 remained good, 10 declined to requires improvement and 3 declined to inadequate.
Figure 2: The number of short inspections and their outcomes
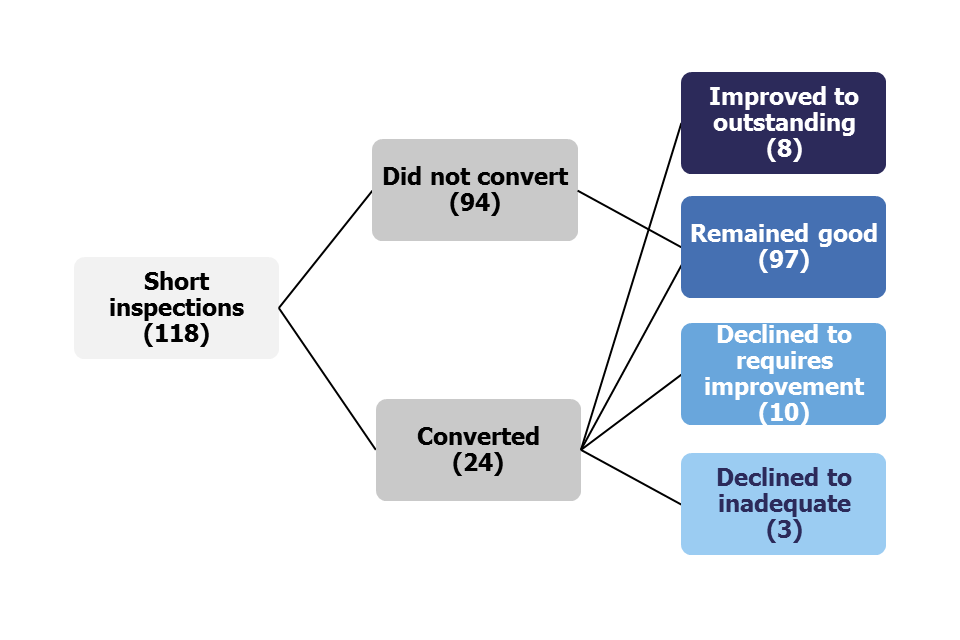
Flow diagram showing the outcomes of the 118 short inspections carried out between 1 September 2016 and 31 August 2017
Overall, from the full and short inspections conducted during this reporting year, 5% of the providers were judged outstanding, 57% good, 29% requires improvement and 8% inadequate.
1.2 Most recent inspection outcomes
As at 31 August 2017, there were 1,168 open and funded further education and skills providers, of which 1,052 (90%) had been inspected. Eight out of 10 were judged good or outstanding at their most recent inspection. This is the same proportion as at the end of last year.
Figure 3: Overall effectiveness of further education (FE) and skills providers at their most recent inspection, as at 31 August 2017
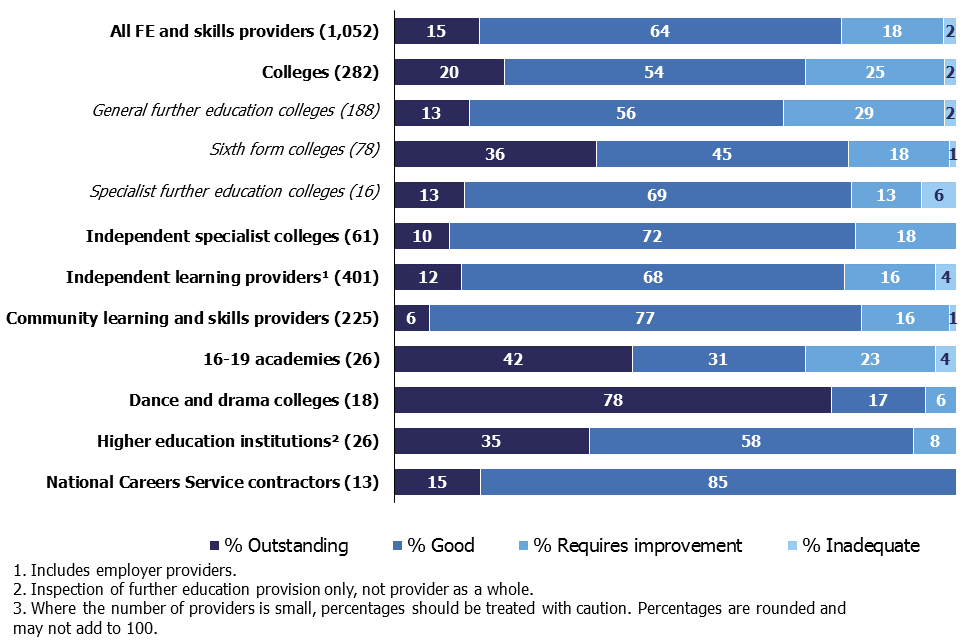
Chart showing inspection outcomes broken down by provider type
As at 31 August 2017, 15% of all open and funded further education and skills providers were judged outstanding at their most recent inspection (159 providers). Since the Education Act 2011 came into force, most types of provider judged outstanding have been exempt from routine inspection and are only inspected if there is a cause for concern. A cause for concern may include, for example, a decline in performance or another compelling reason, such as potential safeguarding issues.
Of the 127 outstanding providers that are exempt from routine inspection, more than half have had their most recent inspection within the last 6 years.
2. Main findings
2.1 General further education colleges
During this reporting year, a fifth of general further education (FE) colleges (42) were involved in a merger: 38 with other general FE colleges and 4 with sixth form colleges. The large majority of mergers took place in August 2017 and followed on from area reviews carried out by the FE Commissioner between 2015 and 2017.
From these mergers 22 general FE colleges remained out of the 42 that were involved. Twenty of these had been created from the merger of 2 colleges and 2 had been created from the merger of 3 colleges.
In total around 285,000 learners were affected by the mergers. In 8 out of the 22 colleges that remained, the number of learners approximately doubled and in 8 colleges the number of learners increased by approximately 50%.[footnote 2]
The most recent inspection outcomes for the colleges involved in the 22 mergers outlined above were:
- 9 mergers between colleges both judged good or outstanding (115,000 learners)
- 9 mergers between colleges judged good or outstanding and another college that required improvement or was inadequate (130,000 learners)
- 4 mergers between colleges both judged requires improvement or inadequate (30,000 learners)
Mergers have reduced the number of open and funded colleges from 207 as at 31 August 2016 to 189 as at 31 August 2017. Colleges that have officially closed as a result of a merger will no longer be reported on separately in the Official Statistics. All but one of the 189 colleges had been inspected by 31 August 2017.[footnote 3]
Between 1 September 2016 and 31 August 2017 we inspected 71 general FE colleges. There were 59 full inspections and 12 short inspections (including those that converted to full inspections). The inspection outcomes for this reporting year were very similar to those last year, despite a different group of providers being inspected:
- most of the previously good general FE colleges that received a short inspection remained good or improved to outstanding (11 out of 12, with one college declining to requires improvement)
- the majority of previously good or outstanding general FE colleges that were risk assessed to receive a full inspection declined to less than good (17 out of 29)
- the large majority of colleges previously judged requires improvement or inadequate did not improve to good or outstanding (20 out of 29)
- it is worth noting however that 8 out of the 9 previously inadequate general FE colleges did improve: 6 to requires improvement and 2 to good
The proportion of general FE colleges judged good or outstanding during this reporting year was 46%, 5 percentage points lower than last year. A higher proportion of colleges previously judged as good declined to requires improvement and more colleges previously judged as requiring improvement remained the same grade at inspection this year. These 2 factors combined meant that the proportion judged to require improvement was 12 percentage points higher this year compared with last year.
Figure 4: General further education college full and short inspection outcomes, by reporting year
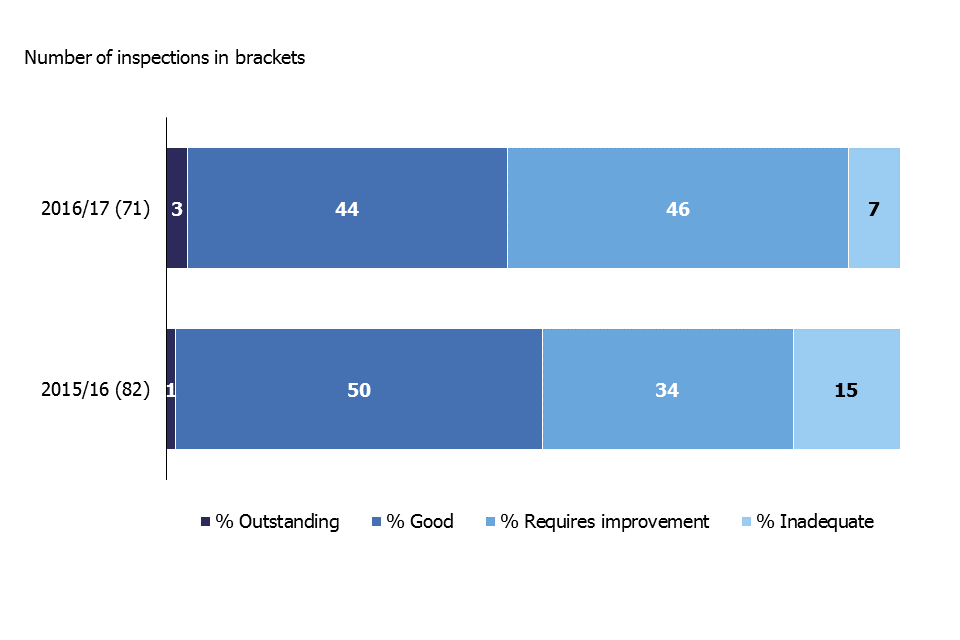
Bar chart comparing the overall effectiveness outcomes for general further education colleges inspected during this reporting year and last reporting year
In the 18 general FE colleges that declined from good or outstanding to requires improvement or inadequate this year, inspectors found a general decline in the quality of provision. Where improvement actions had been put in place, they had not sufficiently improved the quality of provision. In at least half of the colleges, inspectors found the leadership and management of teaching, learning and assessment was weak.
In 7 of the 10 colleges that remained requires improvement at inspection this year, inspectors found a new principal and/or senior leadership teams in place that were starting to have a positive impact. There were signs of improvement and a change in culture, but changes were at an early stage and the colleges were not yet good overall.
Nine colleges improved to good this year from requires improvement or inadequate. Eight of those colleges had either a new principal and/or senior leadership team in place at the time of their previous inspection, which was within the past 2 years. At their inspection this year, inspectors found that a new culture within the colleges had led to rapid improvements: the quality of teaching had improved, learners were now achieving well and had positive destinations, such as further education or employment.
In the 2 general FE colleges that improved to outstanding this year, inspectors found that college leaders had successfully established a culture of high expectations for all staff and learners. Links with employers and the local communities were highly effective. They created excellent opportunities for learners to progress into further learning and jobs that met local, regional or national needs. Learners made significant progress compared with their starting points and achieved their qualifications.
During this reporting year, there were twice as many general FE colleges that declined to requires improvement or inadequate (18) than improved to good or outstanding (9).
Figure 5: General further education college inspection outcomes between 1 September 2016 and 31 August 2017, by previous overall effectiveness and type of inspection
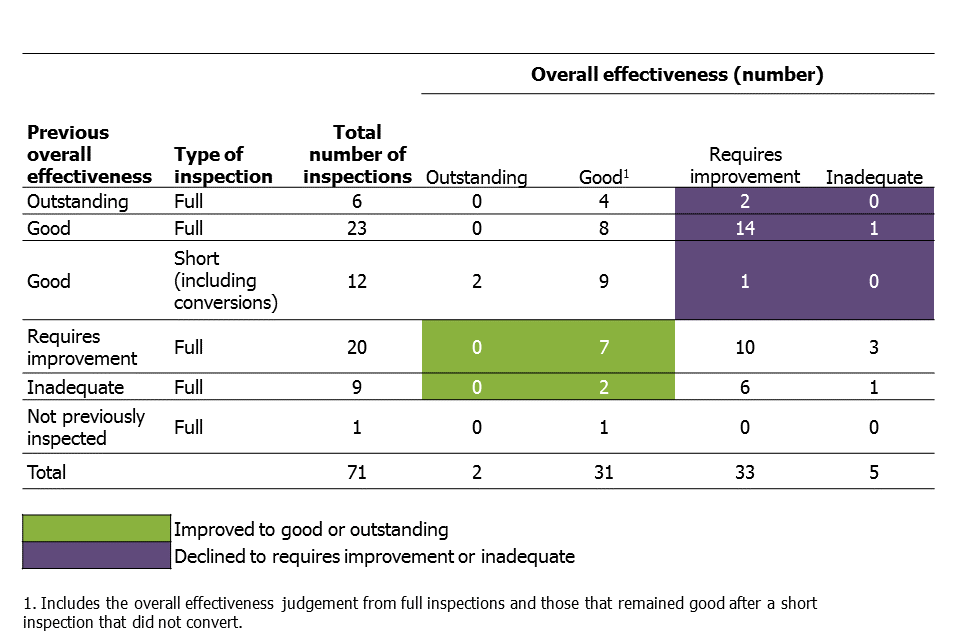
A table showing inspection outcomes for general further education colleges this reporting year broken down by previous inspection outcome and type of inspection
The in-year inspection outcomes had a negative effect on the overall proportion of general FE colleges judged good or outstanding at their most recent inspection. This continued the downward trend reported over the last 2 years. The proportion of colleges judged good or outstanding declined by 2 percentage points, from 71% as at 31 August 2016 to 69% as at 31 August 2017. This decline would have been greater if the colleges that officially closed as a result of a merger had continued to be included.
2.2 Sixth form colleges and 16 to 19 academies
Following area reviews, the number of sixth form colleges decreased during this reporting year. Four sixth form colleges merged with 4 separate general FE colleges and 7 sixth form colleges converted to become 16 to 19 academies.
Although the sites where learning takes place have remained open, the 4 sixth form colleges that have officially closed as a result of a merger will no longer be reported on separately in the Official Statistics. Two of these sixth form colleges were previously judged requires improvement and 2 were judged good.
Similarly, for the 7 sixth form colleges that converted to become 16 to 19 academies, these colleges will now be reported in Official Statistics under the 16 to 19 academies provider category. However, their inspection history as a sixth form college has been carried forward in line with our published policy. All of the sixth form colleges that converted to academies were judged good or outstanding for overall effectiveness at their previous inspection.
These changes reduced the number of sixth form colleges from 90 as at 31 August 2016 to 79 as at 31 August 2017. All but one of the 79 sixth form colleges had been inspected as at 31 August 2017.
Between 1 September 2016 and 31 August 2017 we inspected 24 sixth form colleges (including those that later became academies). There were 13 full inspections and 11 short inspections (including those that converted to full inspections):
- all but one of the sixth form colleges that received a short inspection remained good (8 out of 11) or improved to outstanding (2 out of 11)
- 7 out of 10 sixth form colleges that were risk assessed to receive a full inspection declined
- 2 out of the 3 sixth form colleges previously judged requires improvement improved to good
The proportion of sixth form colleges judged good or outstanding was 63%, 7 percentage points lower than last year.
In the 8 sixth form colleges that declined to requires improvement or inadequate this year, inspectors found the quality of teaching, learning and assessment was not consistently good. Weaknesses included poor performance management of teachers and a failure to explore the relationship between the quality of teaching and students’ progress.
In the 2 sixth form colleges that improved to outstanding, inspectors found the principal, leadership team and governors had worked relentlessly to develop high aspirations and expectations for students and staff. Continuous improvement in the quality of teaching and learning was a main focus. Teachers assessed students’ starting points skilfully and they planned lessons well to meet the needs of the vast majority of students.
During this reporting year, more sixth form colleges declined to requires improvement or inadequate (8), than improved to good or outstanding (2).
Figure 6: Sixth form college inspection outcomes between 1 September 2016 and 31 August 2017, by previous overall effectiveness and type of inspection
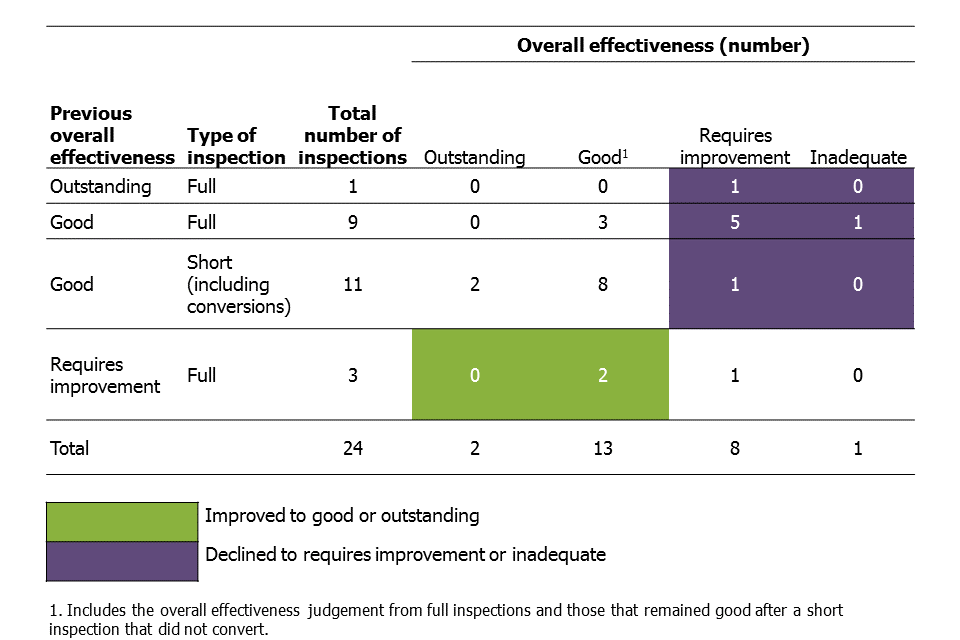
A table showing inspection outcomes for sixth form colleges this reporting year broken down by previous inspection outcome and type of inspection
During this reporting year the number of sixth form colleges judged good or outstanding reduced by a fifth, from 79 as at 31 August 2016 to 63 as at 31 August 2017. This can be attributed to the drop in performance at inspection this year and to the reduction in the number of good and outstanding sixth form colleges as a result of mergers and conversions to academies.
This reduction had a negative effect on the proportion of sixth form colleges judged good or outstanding at their most recent inspection, which declined for the first time in 3 years. The proportion of sixth form colleges judged good or outstanding declined by 8 percentage points, from 89% as at 31 August 2016 to 81% as at 31 August 2017.
However, it should be noted that sixth form colleges had a smaller number of colleges decline from good or outstanding compared with other larger provider groups. As sixth form colleges are a smaller group of providers, the number declining has a bigger effect on the most recent inspection outcomes.
The number of 16 to 19 academies has increased from 21 as at 31 August 2016 to 31 as at 31 August 2017. This is largely as a result of sixth form colleges converting to become 16 to 19 academies over the summer of 2017.
As at 31 August 2017 the 16 to 19 academies group was made up of:
- 21 16 to 19 academies that were also present as at 31 August 2016. Of the 19 that had been inspected, 6 were judged outstanding, 6 good, 6 required improvement and one was inadequate
- 7 sixth form colleges that had converted to become an academy, 4 judged outstanding and 3 judged good at the time of conversion; one was inspected during the year and improved to outstanding
- 3 new 16 to 19 academies that had yet to be inspected
A total of 26 academies (including the former sixth form colleges) had been inspected as at 31 August 2017, with 73% judged good or outstanding at their most recent inspection.
2.3 Independent learning providers (including employer providers)
The number of open and funded independent learning providers (including employer providers) increased by 3%, from 477 as at 31 August 2016 to 491 as at 31 August 2017. This increase was mainly as a result of providers that were only allocated ‘advanced learner loans’ funding being included in scope for Ofsted inspections from September 2016. As is usual within this part of the sector, there were a lot of providers moving in and out of scope for inspection over the year. The net effect was an increase of 18 independent learning providers and a decrease of 4 employer providers.
Between 1 September 2016 and 31 August 2017, 159 independent learning providers (including employer providers) were inspected. This included 114 full inspections and 45 short inspections (including those that converted to full inspections):
- 34 of the 45 short inspections resulted in the provider remaining good
- from the 11 short inspections that converted, 9 of the providers declined to less than good and 3 improved to outstanding
- there were 58 risk-assessed inspections of previously good or outstanding providers, of which 34 resulted in the provider declining to requires improvement or inadequate
- 42 providers judged requires improvement or inadequate at their previous inspection received routine re-inspections during this reporting year; of these, 26 improved to good
Overall the proportion of providers judged good or outstanding was 57%, 15 percentage points lower than last year. Compared with last year, a higher proportion of previously good providers that were selected for inspection as a result of risk assessment declined at inspection this year.
Figure 7: Proportion of previously good independent learning providers (including employer providers) risk assessed for a full inspection that improved, declined or stayed the same at their next full inspection
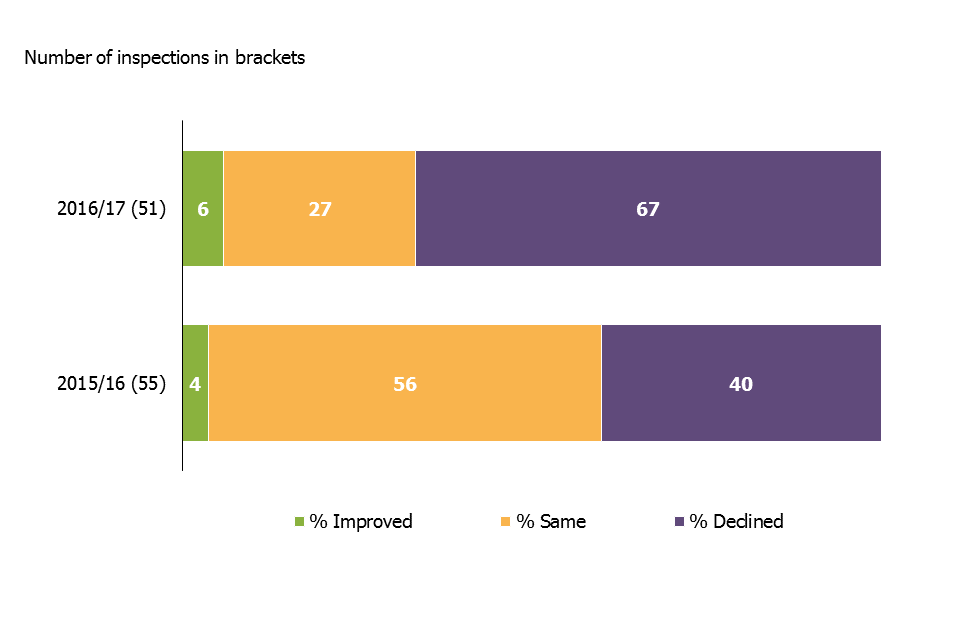
Bar chart showing 67% of previously good independent learning providers (including employer providers) that were risk assessed for a full inspection this year declined to be less than good
In at least half of the providers that declined to requires improvement or inadequate this year, inspectors found leaders’ evaluation of the quality of provision was insufficiently rigorous and monitoring processes did not identify areas of underperformance accurately. Within the providers, the progress and/or achievement of learners and apprentices was either too low, too slow or in decline. Leaders, managers and teachers did not always make sure that learners and apprentices developed good skills in English and mathematics.
In the 7 providers that either remained or improved to outstanding in this reporting year, inspectors found that leaders, managers and staff had high expectations for their learners and apprentices. Training officers were highly skilled, had good industry knowledge and gave significant support and guidance. Learners and apprentices were making outstanding progress and had excellent achievement rates.
Between 1 September 2016 and 31 August 2017, more providers declined to requires improvement or inadequate (43) than improved to good or outstanding (26).
Figure 8: Independent learning providers (including employer providers) inspection outcomes between 1 September 2016 and 31 August 2017, by previous overall effectiveness and type of inspection
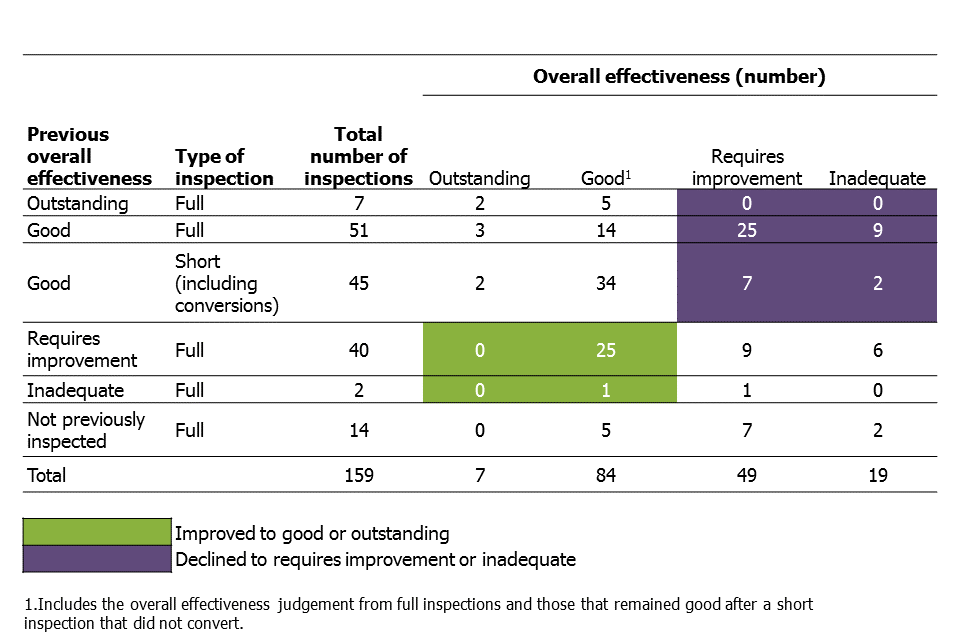
A table showing inspection outcomes for independent learning providers (including employer providers) this reporting year broken down by previous inspection outcome and inspection type
Overall there was a 3 percentage point decline in the proportion of providers judged good or outstanding at their most recent inspection, declining from 83% as at 31 August 2016 to 80% as at 31 August 2017.
2.4 Community learning and skills providers
As at 31 August 2017, there were 225 open and funded community learning and skills providers. There were 138 local authority providers, 77 not for profit organisations and 10 specialist designated institutions. Overall, this was a 4% decrease compared with 31 August 2016, when there were 235 providers.
Eleven community learning and skills providers left the sector during this reporting year. Reasons included mergers, contracts being transferred to other providers and funding ceasing. Eight of the providers that left were judged good at their most recent inspection.
Between 1 September 2016 and 31 August 2017, 78 community learning and skills providers were inspected. There were 41 full inspections and 37 short inspections (including those that converted to full inspections). The proportion of providers judged good or outstanding was 78%, 8 percentage points higher than last year:
- we conducted 37 short inspections, the same number as last year; 35 of the 37 short inspections this year resulted in the provider remaining good
- in both years, from the short inspections that converted, 2 providers declined to be less than good
- half the number of risk-assessed inspections of previously good or outstanding providers were conducted this year; a higher proportion remained good or outstanding (59%) compared with last year (53%)
- we conducted twice as many re-inspections of providers that previously required improvement; a higher proportion improved to good (11 out of 15), compared with last year (4 out of 7)
- none of the community learning and skills providers were judged outstanding this year
In the providers judged good this year, inspectors found a wide range of programmes that engaged the most vulnerable and disadvantaged learners. There were effective partnerships with other agencies and good levels of support that enabled learners to progress well, often from low starting points.
In the providers judged requires improvement or inadequate this year, inspectors found a lack of challenging targets for learners and insufficient monitoring of progress, particularly on non-accredited courses. Governors and managers did not have access to, or did not use, timely and accurate data to analyse and improve performance.
The in-year inspection outcomes had a small positive effect on the proportion of community learning and skills providers judged good or outstanding at their most recent inspection. The proportion of providers judged good or outstanding at their most recent inspection increased by one percentage point, from 82% as at 31 August 2016 to 83% as at 31 August 2017.
2.5 Prisons and young offender institutions
As at 31 August 2017, there were 114 prisons and young offender institutions (YOIs). All of the prisons and YOIs had been inspected.
Ofsted contributed to 41 prison and YOI inspections, where the reports were published between 1 September 2016 and 31 August 2017. Of these, 56% were judged good or outstanding for the overall effectiveness of learning and skills and work activities (overall effectiveness). This is 16 percentage points higher than last year.
For 22 prisons, this was the first time they had received a judgement on the overall effectiveness since the judgement was introduced in March 2014[footnote 4]. Fifteen out of the 22 were judged good and one was judged outstanding.
The in-year inspection outcomes had a positive effect on the most recent inspection outcomes for all prisons and YOIs. Overall, the proportion of prisons and YOIs judged good or outstanding for overall effectiveness at their most recent inspection increased by 8 percentage points; from 35% as at 31 August 2016 to 44% as at 31 August 2017.
Figure 9: Overall effectiveness of learning and skills and work activities (overall effectiveness) of prisons and young offender institutions at their most recent inspection, over time
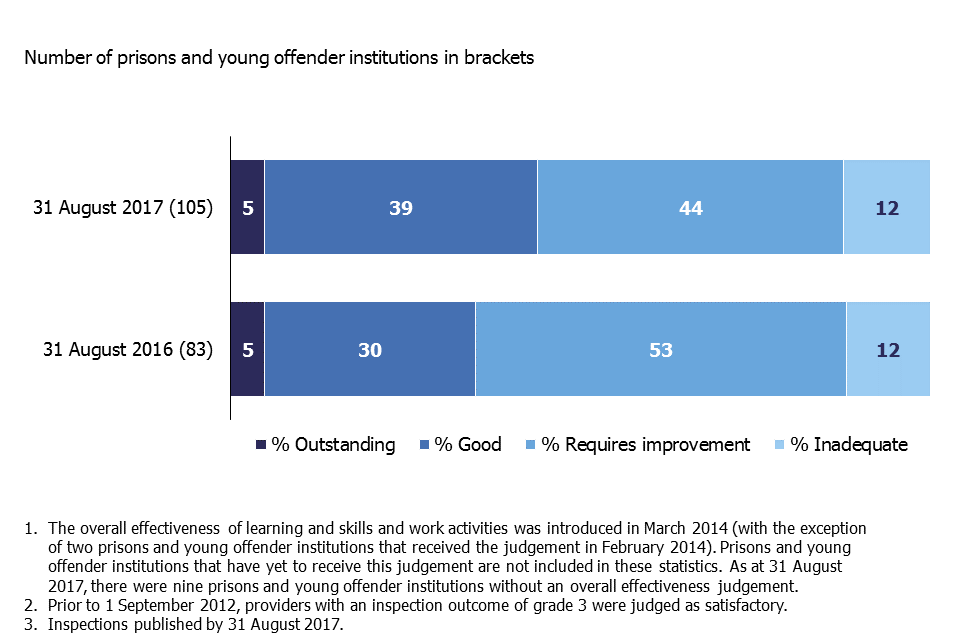
Bar chart showing the proportion of prisons and young offenders institutions judged to be good or outstanding at their most recent inspection was 44%, as at 31 August 2017
2.6 Other further education and skills providers
Seven specialist further education colleges were inspected during this reporting year. The colleges inspected this year specialise in providing agricultural courses and other land-based provision. The 4 previously good colleges that received a short inspection all remained good. Out of the 3 previously good colleges risk assessed for a full inspection, 2 remained good and one declined to inadequate. In total there are 16 specialist further education colleges, of which 13 are judged to be good or outstanding at their most recent inspection.
Independent specialist colleges (ISCs) offer provision for learners with learning difficulties and/or disabilities. During this reporting year, 16 of the 22 ISCs we inspected were judged good or outstanding. All of the ISCs that had a full inspection received the same grade for their high needs provision as they did for overall effectiveness. Overall, the proportion of all ISCs judged to be good or outstanding was 82% as at the 31 August 2017. This is the same proportion as last year.
We inspected the further education provision being delivered in 5 higher education institutions (HEIs) over this reporting year. All 3 HEIs that received a short inspection remained good (2) or improved to outstanding (1). The 2 HEIs that received a full inspection were both judged requires improvement. In total there are 27 HEIs offering further education provision, of which 26 have been inspected. The in-year outcomes brought the proportion of HEIs judged good or outstanding at their most recent inspection down from 100% as at 31 August 2016 to 92% as at 31 August 2017.
All 13 National Careers Service contractors were inspected during this reporting year, with all of the contractors judged good (11) or outstanding (2).
3. Revisions
3.1 In-year statistics
The statistics published in June 2017 reported on inspections carried out between 1 September 2016 and 28 February 2017. All inspections that took place during this period were published at the time of reporting. However, the inspection published date has changed for 7 providers and the inspection type has changed for 2 providers. All other data remains unchanged. These small changes do not affect the main findings or tables and charts published. The corrections have been included within the underlying data published alongside this report.
3.2 Statistics about the most recent inspection outcome of all open providers
Within the data, tables and charts file, the historic data in chart 6 has been updated following a review and data cleanse.
The impact of the data cleanse is a minimal change to the number of providers reported in each year between 2012 and 2016.
There is a larger change in the total number of open and funded providers at 31 August 2015, which has decreased by 15. This is as a result of the chart not being updated in the previous publication to reflect the new methodology, which excluded providers that ceased to be funded or closed during the year. This has now been corrected.
While this doesn’t affect the overall message of the chart, some percentages have been affected by one percentage point.
New data sets containing the revised statistics between 31 August 2012 and 31 August 2016 will be published alongside these Official Statistics.
3.3 Prisons and young offender institutions
One prison was missing from the most recent inspection outcomes as at 31 August 2016, published in the June 2017 statistics. This revision increases the number of prisons and young offender institutions judged requires improvement by one and increases the proportion by one percentage point.
4. Notes
From the 31 August 2015, the most recent inspection outcomes include providers wholly or partly funded by the Education and Skills Funding Agency, or their predecessor funding agencies, at that point in time. For 31 August 2014 and before, the most recent inspection outcomes include:
- providers wholly or partly funded by the Skills Funding Agency or the Education Funding Agency at that point in time
- providers who had lost funding or closed during the corresponding reporting year
4.1 Full inspections
Providers judged outstanding at their most recent inspection are not normally subject to routine inspection.[footnote 5] However, an outstanding provider may be risk assessed to receive a full inspection where its performance declines or there is another compelling reason, such as potential safeguarding issues.
Providers judged good for overall effectiveness at their most recent inspection will usually be inspected within the 3 years from September 2015. This will normally be a short inspection (see below) but may be a risk assessed full inspection where information suggests that this is the most appropriate course of action, for example if the provider’s performance has declined.
A provider judged to require improvement at their most recent inspection will normally have a full re-inspection within 12 to 24 months of its previous inspection.
Ofsted will monitor providers judged as inadequate and re-inspect them within 15 months of publication of their last full inspection report[footnote 6].
4.2 Short inspection
Providers awarded a grade of good for overall effectiveness at their previous inspection will usually receive a short inspection.
A short inspection will determine whether the provider continues to provide a good standard of education/training for learners and whether safeguarding is effective.
A short inspection will not make individual graded judgements and will not change the provider’s overall effectiveness grade.
The lead inspector can choose to convert the short inspection to a full inspection where:
- there is insufficient evidence to confirm that the provider remains good
- there are concerns that there is evidence that the provider may no longer be good, which may include concerns about safeguarding
- if there is sufficient evidence of improved performance to suggest that the provider may be judged outstanding
If the inspection is converted to a full inspection, inspectors will make the full set of graded judgements. As a result of the converted inspection the provider could improve, decline or remain the same
The quality report for these official statistics contains an explanation of the methodology used and the relevant inspection frameworks, along with other useful information, such as where to find previously published further education and skills official statistics.
In 2016, the National Statistician published new guidance covering management information and official statistics.
5. Further information
5.1 Contact for comments or feedback
If you have any comments or feedback on this publication, please contact Sarah Pearce on 03000 130 632 or Sarah.Pearce@ofsted.gov.uk
5.2 Acknowledgements
Thanks to the following for their contribution to this statistical release: Stuart Lloyd and John Hadler.
-
The following provider types are not exempt from routine inspection: higher education institutions offering further education, local authority providers, independent specialist colleges and dance and drama colleges. ↩
-
Compared with the college that had the largest number of learners before the merger. ↩
-
The merged colleges have yet to be inspected as a new entity. ↩
-
Two of the prisons were awarded an overall effectiveness judgement in late February 2014. ↩
-
The following types of provision are still subject to routine inspection when they have been judged outstanding: higher education institutions offering further education; local authority providers; independent specialist colleges; dance and drama programmes; and learning and skills provision in prisons. ↩
-
Full re-inspections or re-inspection monitoring visits may not happen in certain circumstances, for example where a provider’s funding contract has been terminated. ↩