Cyber security longitudinal survey - wave three
Published 20 March 2024

© Crown copyright 2024
This publication is licensed under the terms of the Open Government Licence v3.0 except where otherwise stated. To view this licence, visit nationalarchives.gov.uk/doc/open-government-licence/version/3 or write to the Information Policy Team, The National Archives, Kew, London TW9 4DU, or email: psi@nationalarchives.gov.uk.
Where we have identified any third party copyright information you will need to obtain permission from the copyright holders concerned.
This publication is available at https://www.gov.uk/government/publications/cyber-security-longitudinal-survey-wave-three-results/cyber-security-longitudinal-survey-wave-three
Executive summary
Key findings
The purpose of the Cyber Security Longitudinal Survey (CSLS) is to investigate the change over time in organisations’ cyber security policies and processes, as well as looking at the relationship between these changes and the impact of cyber security incidents. This report covers the findings from the third wave of a multi-year survey, including comparisons to previous waves of the research (Wave One from 2021, Wave Two from 2022). It also summarises the differences between businesses and charities within Wave Three of the study, along with descriptive summaries of different sub-groups. The main stage survey for Wave Three took place between March and June 2023. Qualitative interviews took place between June and July 2023.
This report presents two types of analysis: cross-sectional and longitudinal. The cross-sectional analysis focuses on the differences between all responding organisations from each wave and therefore acts as a snapshot of organisations’ status at a given time. The longitudinal analysis, in contrast, analyses the organisations that have completed multiple waves of the survey and enables greater understanding of the changes these organisations experience over time. The longitudinal analysis is covered at the end of this chapter and in detail in Chapter 9.
This report also provides additional insight from 30 follow-up qualitative interviews with survey respondents that covered topics such as cyber security resilience, awareness and usage of the Cyber Essentials standard, record keeping, internal and external reporting, responsibility for cyber security, and monitoring of supply chains. These are presented alongside reporting on quantitative findings.
Broadly, businesses have a more formalised set of processes and policies in place than charities. This is particularly true among large (250 – 499 employees) and especially very large firms (500 or more employees), who are much more likely to have sophisticated approaches to cyber security. This is likely to reflect their higher budgets and ability to maintain specific cyber security staff. However, it is important to note that, for many organisations, the board is under-engaged and many of the processes that are in place are less proactive.
Overall, organisations have shown improvements in their cyber resilience since the first wave of the study. However, between Waves Two and Three, their resilience profile has largely remained stable. As budgets are often stretched and priorities are shifted, organisations may be less likely to invest heavily in cyber security and this may help to explain the broadly stagnant position between Waves Two and Three.
Below is a more detailed summary of key findings from each chapter of this report. The survey results are subject to margins of error, which vary with the size of the sample and the percentage figure concerned. For all percentage results, subgroup differences by size, sector and survey answers have been highlighted only where statistically significant[footnote 1][footnote 2](at the 95% level of confidence).
Cyber profile of organisations
As technology continues to develop, it has changed the way that people work. Changes range from remote working and cloud computing through to the growing importance of Artificial Intelligence (AI). These new challenges have necessitated shifts in the way that organisations respond to cyber security.
Almost all businesses (96%) and charities (98%) have a cloud or physical server to store data. Although, compared to previous waves of this study, this proportion has remained stable, the underlying trends have shifted. Increasingly, physical servers are less likely to be used by businesses (76% in Wave Three compared to 81% in Wave Two and 82% in Wave One) and charities (60% in Wave Three compared to 72% in Wave One).
Charities are more likely than businesses (56% vs. 35%) to allow their staff to access their systems using a personal device. This has remained stable between the different waves of the survey. This is a good example of how charities tend to take a less formalised approach to cyber security than businesses. Further to this, given the lack of change between waves, it suggests that cyber security is not always a high priority for charities. In the qualitative phase, many respondents across businesses and charities noted that personal errors were likely to be the most common source of cyber breaches, suggesting that this topic is a vital area of improvement for organisations.
Mirroring the proportion of organisations that allow for access to systems with personal devices, businesses are also more likely than charities (81% vs. 69%) to require staff to use VPN for remote access, which has not dramatically changed compared to previous waves of the survey. Again, this suggests that businesses take a more formalised approach to cyber security.
However, it is also important to note that both businesses (23%) and charities (16%) are currently not likely to use AI or machine learning as a means to improve their cyber resilience, which has not changed between Wave One and Wave Three. This suggests that organisations have not moved towards taking on cutting-edge technology to help improve their cyber resilience. Further, given the potential for these technologies to help organisations to act proactively, it is indicative of organisations’ reactive mindset.
Cyber security policies
Given the speed of developments in the cyber security area, it is vital that organisations keep their policies and governance up to date to ensure they remain secure and build their resilience.
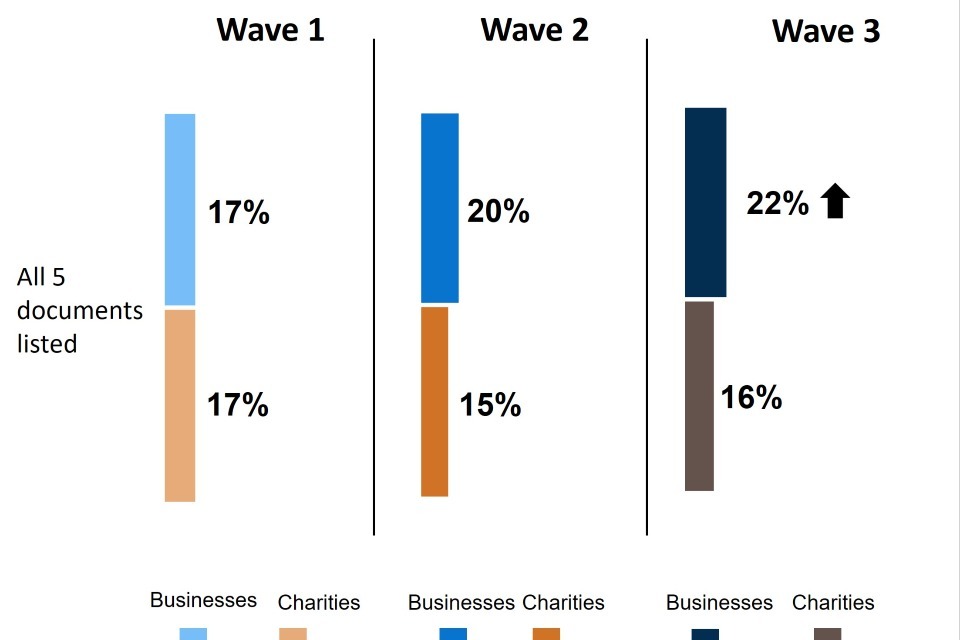
Respondents were asked about whether they have any of five best practice documents for cyber security governance: a cyber security business continuity plan, documentation to identify critical assets, a written list of IT vulnerabilities, a risk register, and a document outlining how much cyber risk they are willing to accept. Around nine in ten organisations have at least one of these five documents in place (89% of businesses and 92% of charities) This represents an improvement among businesses since Wave One. However, businesses are more likely than charities to have all five documents in place (22% vs. 16%). Although this is again indicative of businesses’ more holistic approach to cyber security, it also suggests most organisations still have room for improvement.
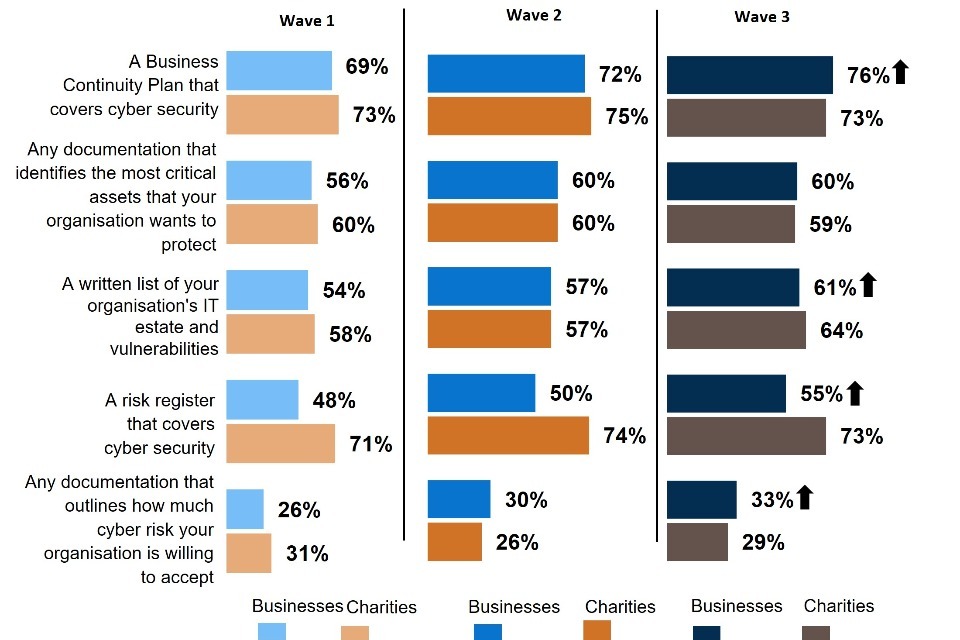
Since the first wave of the survey, an increased proportion of businesses have a business continuity plan that covers cyber security (76% in Wave Three vs. 69% in Wave One), a written list of their company’s vulnerabilities (61% in Wave Three vs. 54% in Wave One), and a risk register (55% in Wave Three vs. 48% in Wave One). However, there is little movement between Waves Two and Three. Charities by comparison are most likely to have a business continuity plan and risk register in place, which is consistent across waves.
The document that is least prevalent among organisations is a document outlining how much cyber risk organisations are willing to accept (33% among businesses, an increase compared to 26% at Wave One, and 29% among charities which is comparable to previous waves). Again, this indicates that organisations are not necessarily forward thinking in their planning for cyber security.
Businesses (69% in Wave Three vs. 61% in Wave Two and 53% in Wave One) and charities (79% in Wave Three vs. 66% in Wave One) are increasingly likely to have a cyber insurance policy. For businesses, this is most likely to be part of a broader insurance policy (43%), an increase on Wave Two (36%). Charities are also most likely to have a broad cyber insurance policy (46%), in line with previous waves (42% at both Wave One and Wave Two).
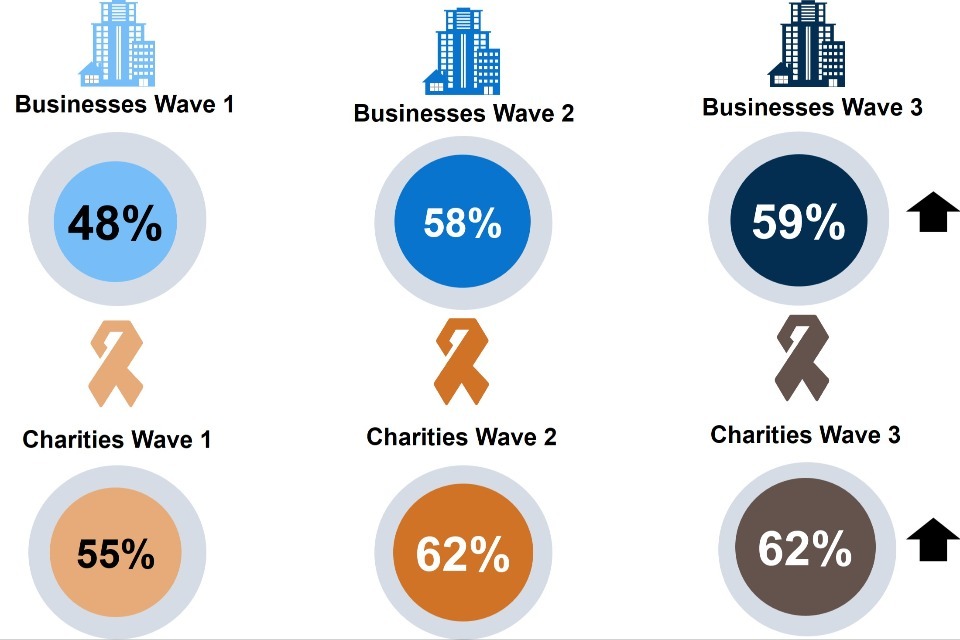
A majority of organisations have undertaken cyber security training or an awareness raising session, an increase on Wave One (59% of businesses in Wave Three vs. 48% in Wave One, and 62% of charities vs. 55% in Wave One). However, this has not changed substantively between Wave Two and Wave Three. This may indicate attempts among some organisations which have not put procedures in place to prevent their staff from accessing systems with their personal device, and to instead promote cyber security training and reduce human error.
Cyber security processes
In addition to updating their written policies and governance, organisations must also adapt their processes to ensure that they keep up with the changing cyber security environment. Respondents were asked about their adherence to three of the key cyber security certifications: Cyber Essentials Standard, Cyber Essentials Plus and ISO 27001.
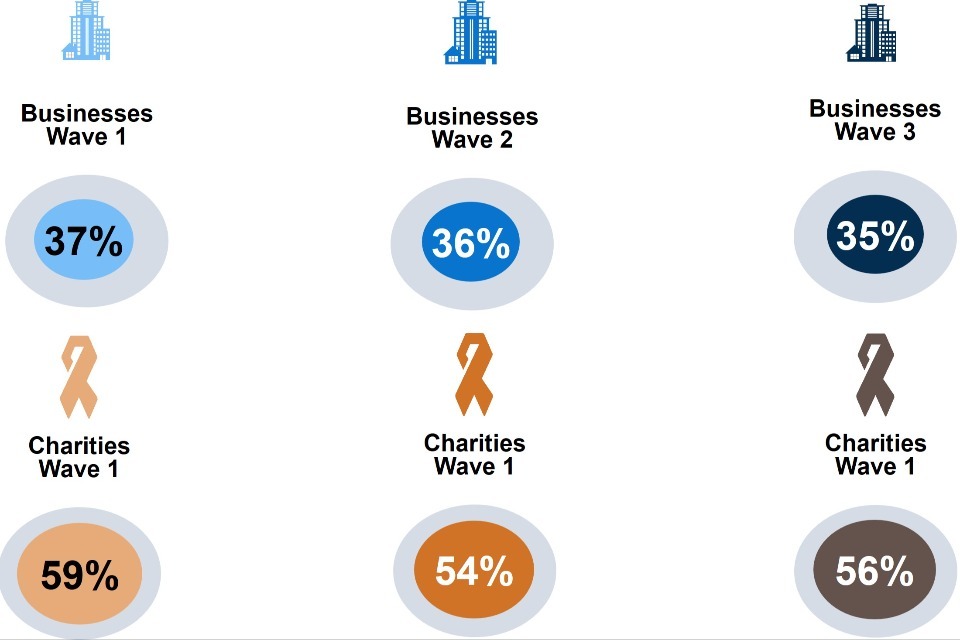
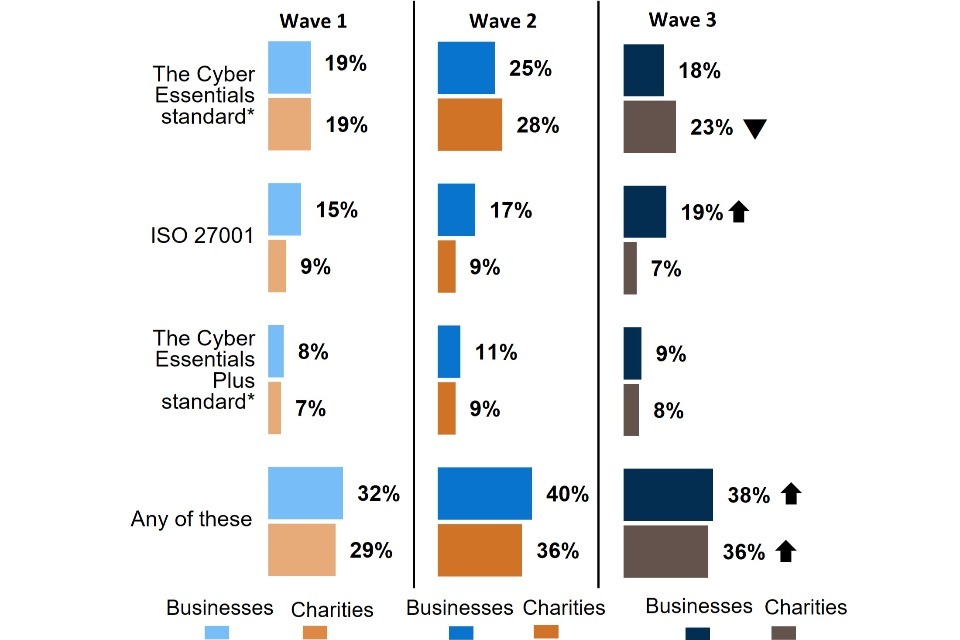
For both businesses and charities, more than one-third of organisations (38% of businesses and 36% of charities) adhere to at least one of these certifications. This represents a consolidation of the increases observed since Wave One but is comparable to the results from Wave Two.
Compared to Wave One, adherence to Cyber Essentials has increased among charities (23% in Wave Three vs. 19% in Wave One) but remains consistent for businesses across all three waves. Whilst it has not shown a significant improvement between Wave One (15%) and Wave Three (19%), findings from the qualitative interviews suggest the ISO 27001 certification is considered by businesses to be the most robust and substantive accreditation available.
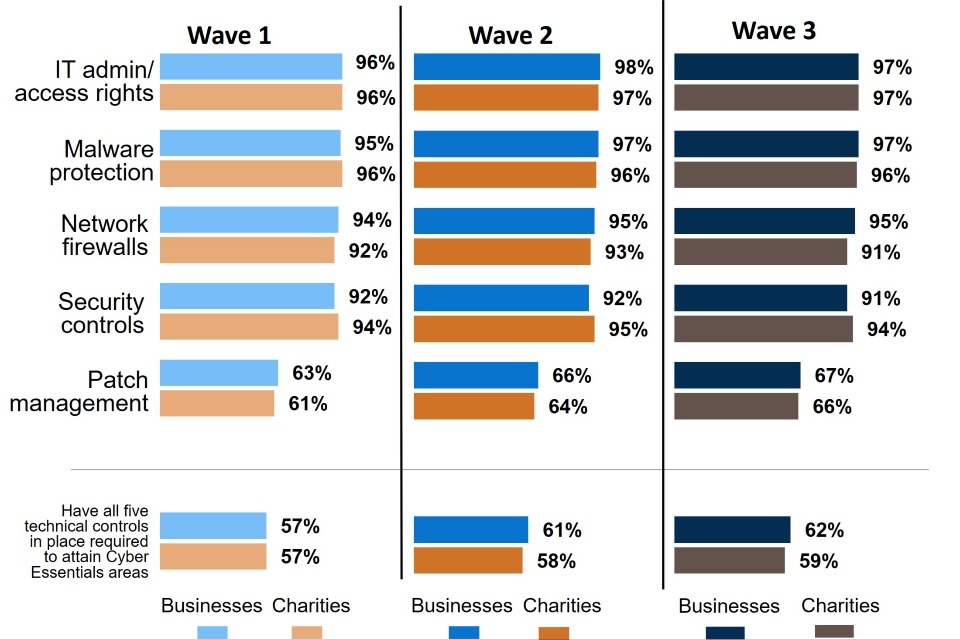
Consistent with previous waves of this survey, most organisations have put in place at least four of the five technical controls required to attain Cyber Essentials and around six in ten organisations (62% of businesses, 59% of charities) have all five. However, patch management (67% among businesses, 66% among charities) and user monitoring (58% of businesses, 55% of charities) remain the technical controls that organisations are least likely to have in place. There are two key implications of this: firstly, that organisations often do not invest in proactive measures and, secondly, that many organisations have put in place the controls required to attain Cyber Essentials but have not gained a full accreditation.
The proportion of businesses that have taken steps in the last twelve months to help identify risks to their cyber resilience has increased (90% in Wave Three, compared to 86% in Wave Two and 82% in Wave One). The proportion of businesses making changes in the last year to improve their cyber security has also increased since Wave One (85% vs. 79%), although it has remained consistent between Waves Two and Three (both 85%). This includes moves to integrate more proactive measures (for example, 54% of businesses have improved their patching systems), which suggests over time businesses are becoming more active in cyber security. This finding could potentially be worth further exploration in additional research.
Broadly speaking, approximately one-quarter of organisations (28% of businesses and 26% of charities, comparable to previous waves of the survey) have measures in place to evaluate the quality of their suppliers’ cyber security measures. This is a clear area for organisations to improve as it poses a significant gap in organisations’ cyber resilience profile.
Overall, of these measures, there is a clear trend between business size and the sophistication of their approach to cyber security. For example, very large businesses (500+ employees) are nearly twice as likely as businesses overall to adhere to the Cyber Essentials Plus standard (16% vs. 9%) and are much more likely to have put in place all five technical controls required to attain Cyber Essentials (79%, compared to 62%). This is likely a reflection of the greater resources that these businesses are able to dedicate to managing their cyber resilience.
Organisations that have a cyber security certification often have further checks in place on cyber security. For example, organisations that adhere to a cyber security certification are more likely to report having completed a supplier cyber security risk assessment in the last twelve months. This suggests that firms that seek a cyber security accreditation also take a wider more holistic approach to their security either through necessity or choice.
Board involvement
To ensure that organisations can maintain high levels of cyber resilience, it is vital that senior staff buy into the importance of cyber security. Indeed, there is some evidence that the presence of designated cyber responsibilities among senior staff is related to more robust cyber security processes. For example, around three-quarters (73%) of businesses and two-thirds (67%) of charities with one or more board members with oversight of cyber security have all five technical controls required to attain Cyber Essentials in place.
In Wave Three, approximately half of organisations (55% of businesses, 45% of charities) have a member on their board responsible for oversight of cyber security. More organisations (66% of businesses, 61% of charities) have a staff member that is responsible for cyber security that reports to the board. Among businesses this is an increase on Wave One (55%) but is comparable to Wave Two (61%).
Further to this, board-level cyber security training has increased for both businesses (50% in Wave Three compared to 35% in Wave One) and charities (38% in Wave Three compared to 28% in Wave One) but has remained consistent between Wave Two and Three. This training is most likely to be completed once a year, although for around one-third (31%) of businesses this board-level training happens several times a year.
While this suggests that the majority of organisations understand the value of cyber security, it is important to note that the proportion of organisations reporting regular board-level cyber security discussions is quite low. Only 43% of businesses and 37% of charities’ boards discuss cyber security at least quarterly. Among businesses this has decreased in Wave Three (from 37% in Wave One) but has remained quite stable for charities. This suggests that improving regular board engagement remains a key area of focus to help improve cyber resilience.
Again, large businesses are more likely to have greater levels of board engagement. For example, 66% of very large businesses with 500+ employees report that their board has received cyber security training. This continues to suggest that larger businesses are able to take a more sophisticated approach to cyber security.
Sources of information
To ensure that organisations can remain informed of security best practice, it is important that they are able to access up to date and relevant information.
The National Cyber Security Centre (NCSC) provides a range of information resources for both businesses and charities[footnote 3]. Use of NCSC resources is more common among charities (43%) than businesses (29%). This represents an increase between Wave One and Wave Three for both businesses (29% in Wave Three vs. 23% in Wave One) and charities (43% in Wave Three vs. 32% in Wave One) but is comparable to Wave Two. The lower usage among businesses potentially reflects their greater resources and access to external consultants.
Indeed, businesses are also more likely to report being influenced by external consultants since Wave One (53% vs. 47%). However, there is little change between Wave Two and Wave Three.
Since Wave One, more businesses (34% in Wave Three vs. 26% in Wave One) and charities (45% vs. 30%) report their actions on cyber security being influenced by their insurers.
Among those organisations that use NCSC information or guidance, for both businesses and charities, the most common guidance accessed is General Data Protection Regulation (GDPR) guidance (by 67% of businesses and 68% of charities), followed by the ‘“10 Steps to Cyber Security’ (by 62% of businesses and 64% of charities). This is consistent with previous waves of the survey.
In addition to this, among businesses, there has been an increase in usage of the Cyber Assessment Framework (57% in Wave Three vs. 41% in Wave One), NCSC weekly threat reports (45% vs. 32%), and Cyber Security Board Toolkit (34% vs. 23%).
Cyber incident management
Part of building organisations’ cyber resilience also relates to the management processes they have put in place for when a cyber incident happens.
A majority of organisations have a written procedure in place for responding to cyber security incidents (59% of businesses, 56% of charities). Among businesses, this represents an increase compared to Wave One (59% in Wave Three compared to 51% in Wave One), though it has remained consistent since Wave Two. For charities, there has been little change between waves of the survey. This suggests that there is still space for these management processes to become more formalised among charities in future.
Among those organisations that have written incident management procedures, the most common security area covered is guidance for reporting incidents externally (78% among businesses, 87% among charities). For businesses, this represents a decrease when compared to Wave Two (78% in Wave Three vs. 85% in Wave Two) but is in line with Wave One. There is also an increase in the proportion of businesses that have a communications and public engagement plan in place (from 55% in Wave One to 66% in Wave Three). For charities, the results in Wave Three are roughly comparable to previous waves of the survey.
Approximately half of businesses (46%) have tested their incident response policies within the last twelve months. This represents an increase from Wave One (46% vs. 37%). Around one-third of charities (34%) have tested their policies, which is in line with previous waves.
Prevalence and impact of cyber security incidents
Beyond simply getting a sense of organisations’ cyber incident response processes, it is also important to understand the prevalence of these incidents and the impact that they can have on organisations.
Three-quarters of businesses (75%) and around eight in ten charities (79%) have experienced a cyber security incident within the last twelve months. These findings are comparable across the three waves of the survey.
Despite this, the underlying data does show some change between waves. A higher proportion of charities experienced an attempted hacking of their website or social media accounts compared to Wave Two (18%, up from 11%). The equivalent proportion from businesses remained consistent across waves.
With regards to ransomware, the proportion of businesses that do not have a ransomware policy in place or are not sure whether they had one in place remained consistent with Wave Two. However, the proportion of charities who are unsure if a ransomware policy exists decreased in comparison to Wave Two (22% vs. 33%).
Broadly, organisations reported that most cyber security incidents only rarely cause a material loss (e.g., money or data). Only around one-quarter of businesses (23%) and charities (24%) experiencing incidents in the last year report material consequences. Further to this, most of these losses are short-term. Despite this, it is important to note that cyber incidents still have the potential to cause significant costs for organisations.
Longitudinal analysis
The longitudinal analysis is comprised of three components. First, a segmentation technique was used to group together organisations that used similar patterns of protective behaviours, policies and processes. It identified five distinct groups of organisations according to a combination of the number and types of protective practices used. The segmentation is based on robust cyber resilience requiring the adoption of technical and governance policies, procedures and tools to protect against incidents and mitigate impacts and outcomes. The five groups identified are:
- High level of preparation: protection well above the average level on all activities.
- Mostly prepared: mostly above average protection on all items but to a lesser extent than those in the ‘high’ level group.
- Governance led: protection was around or above average for policy and procedures but low on technical responses.
- Technical led: tended to have had recent improvements in network security, malware defence, authentication and secure backup but lower than average governance.
- Low level of preparation: protection was low across all activities, except secure cloud backup.
Patterns of cyber security resilience were found to vary across organisations with some organisations using many practices, others few; some organisations rely more on governance procedures and others on technical practices.
The pathways of cyber resilience are not one way. Some organisations take a step back and lower their levels of resilience, others take a step forward and many remain at stable levels.
There is some evidence supporting the hypothesis that experiencing a cyber security incident acts as a trigger for improving resilience. However, this is not true for all organisations, as some experience an incident and show no change in their resilience or become less resilient. More needs to be known about the context and other factors influencing protective behaviours alongside experience of cyber incidents.
The second aspect of the longitudinal analysis looked at adherence to cyber security certifications or standards. The analysis found that:
- Adherence to cyber security certifications or standards is quite low.
- Adoption of adherence to certifications or standards is most prevalent amongst those with stronger patterns of resilience than those with less resilient protection. Similarly, losing adherence to accreditations or standards was less likely among more resilient organisations.
- Businesses are more likely than charities to retain their adherence to accreditations or standards but no more likely to take up certifications.
- Experience of a cyber security incident appears to trigger either a take-up of adherence to certifications or standards or retention of these, albeit among a minority of organisations.
The third and final part of the longitudinal analysis covered board representation. The main findings include:
- Various board activities supporting cyber resilience exist, but substantial numbers of organisations do not appear to have much, if any, board engagement across these activities.
- Board engagement involves both negative and positive steps but generally the trend is towards more engagement over time (i.e., in the follow-up wave interview). Improvement is more apparent for organisations with lower patterns of cyber resilience.
- The experience of cyber security incidents again appears to trigger adoption of board activities and/or a lower rate of negative change in board engagement, although only for a minority of organisations that experience such incidents.
Glossary
| Term | Definition |
|---|---|
| Baseline survey | Also see Wave One survey. The first research year of the survey that took place. |
| Cloud computing | Cloud computing uses a network of external servers accessed over the internet, rather than a local server or a personal computer, to store or transfer data. This could be used, for example, to host a website or corporate email accounts, or for storing or transferring data files. |
| Cyber attack | A cyber attack is a malicious and deliberate attempt by an individual or organisation to breach the information system of another individual or organisation. |
| Cyber profile | A cyber profile is a baseline set of minimal cyber security requirements for mitigating described threats and vulnerabilities, as well as supporting compliance requirements for a defined scope and type of a particular use case (e.g., industry, information system(s)), using a combination of existing cyber security guidance, standards and/or specifications baseline documents or catalogues. |
| Cyber security | Cyber security includes any processes, practices or technologies that organisations have in place to secure their networks, computers, programs or the data they hold from damage, attack or unauthorised access. |
| Impact | A negative impact on organisations did not have to involve a material loss. This could be issues relating to staff disruption or implementing new measures in the organisation. |
| Large business | Businesses with 250 employees or over. |
| Longitudinal survey | A longitudinal survey is a research design that involves repeated observations of the same variables (e.g., people or businesses) over short or long periods of time. |
| Malware | Malware (short for “malicious software”) is a type of computer program designed to infiltrate and damage computers without the user’s consent (e.g., viruses, worms, Trojan horses etc). |
| Managed Service Provider (MSP) | A supplier that delivers a portfolio of IT services to business customers via ongoing support and active administration, all of which are typically underpinned by a Service Level Agreement. A Managed Service Provider may provide their own Managed Services or offer their own services in conjunction with other IT providers’ services. |
| Medium business | Businesses with 50 to 249 employees. |
| Outcome | A negative outcome of an attack involved a material loss from an organisation, such as a loss of money or data. |
| Patch management | Having a policy to apply software security updates within 14 days of them being released. |
| Penetration testing | Penetration testing is where staff or contractors try to breach the cyber security of an organisation on purpose, in order to show where there might be weaknesses in cyber security. |
| Personally-owned devices | Personally-owned devices are things such as smartphones, tablets, home laptops, desktop computers or USB sticks that do not belong to the company but might be used to carry out business-related activities. |
| Phishing | Fraudulent attempts to extract important information, such as passwords, from staff with infiltration through a link or attachment sent via email. |
| Ransomware | A type of malicious software designed to block access to a computer system until a sum of money is paid. |
| Removable devices | Removable devices are portable things that can store data, such as USB sticks, CDs, DVDs etc. |
| Restricting IT admin and access rights | Restricting IT admin and access rights is where only certain users are able to make changes to the organisation’s network or computers, for example to download or install software. |
| Security breach | A security breach is any incident that results in unauthorised access of data, applications, services, networks and/or devices by bypassing their underlying security mechanisms. |
| Smart devices | Network connected devices, like personal assistants, locks, alarms, or thermostats. |
| Social engineering | Fraudulent attempts to extract important information, such as passwords, from staff with infiltration through an impersonation attempt of the organisation. |
| Threat intelligence | Threat intelligence is where an organisation may employ a staff member or contractor or purchase a product to collate in*formation and advice around all the cyber security risks the organisation faces. |
| Two-factor authentication | Two-Factor, or Multi-Factor, Authentication is an electronic authentication method in which a user is granted access to a network or application only after successfully presenting two or more pieces of evidence to an authentication mechanism (e.g., a password and a one-time passcode). |
| Wave one survey | Also see Baseline survey. The first research year of the survey that took place (2021). |
| Wave two survey | The second research year of the survey that took place (2022). |
| Wave three survey | The third research year of the survey. This is the current survey year (2023). |
Chapter 1 – Introduction
1.1 Background to the research
Publication date: 20 March 20 2023
Geographic coverage: United Kingdom
The Department for Science, Innovation and Technology (DSIT) commissioned the Cyber Security Longitudinal Survey of medium and large UK businesses (50+ employees) and high-income charities (annual income of more than £1m) as part of the National Cyber Security Programme. The findings will evaluate long-term links between the cyber security policies and processes adopted by these organisations, and the likelihood and impact of a cyber incident. It also supports the government to shape future policy in this area, in line with the National Cyber Strategy 2022 and will inform future government cyber interventions and support future strategies with quality evidence.
This report is based on Wave Three (2023) of a multi-year study. This study has collected longitudinal data from 2021 (Wave One) and 2022 (Wave Two). Due to the longitudinal nature of the study, the aim is to track trends over time and speak largely with the same organisations in each wave. The design of this research was influenced by a study the Department for Digital, Culture, Media and Sport (DCMS) previously commissioned to investigate the feasibility of creating a new longitudinal study of large organisations.
The core objectives of this study are to:
- Explore how and why UK organisations are changing their cyber security profile and how they implement, measure, and improve their cyber defences.
- Provide a more in-depth picture of larger organisations, exploring topics that are covered in less detail in the Cyber Security Breaches Survey (CSBS), such as corporate governance, supply chain risk management, internal and external reporting, cyber strategy and cyber insurance.
- Explore the effects of actions adopted by organisations to improve their cyber security on the likelihood and impact of a cyber incident.
1.2 Difference from the Cyber Security Breaches Survey
This study differs from the CSBS in multiple important respects. Firstly, it uses a longitudinal approach, where the aim is to track changes in cyber resilience over time, whereas the CSBS uses a cross-sectional sample that provides a snapshot of cyber resilience. This three-year longitudinal study collects data from the same unit (businesses or charities) on more than one occasion (up to three points in time), to analyse the link between large and medium organisations’ cyber security behaviours and the extent to which they influence the likelihood and impact of experiencing an incident over time. In comparison, results from CSBS track changes over time, and provides a static view of cyber resilience at a given time.
Secondly, this survey focuses only on medium, large and very large businesses, and high-income charities whereas the CSBS includes all businesses (micro, small, medium, and large), all charities, and educational institutions. Additionally, different questions are used, so while there are some similarities in the questions and topics covered by the two surveys, results are not comparable.
The CSBS is an official government statistic, and representative of all UK businesses, charities, and educational institutions. Therefore, for overall statistics on cyber security, results from CSBS should be used. Further detail on overlapping questions can be found in the Cyber Security Longitudinal Survey Wave Three Technical Report.
Please visit the gov.uk website to see publications of the Cyber Security Breaches Survey.
1.3 Methodology
There are two strands to the Cyber Security Longitudinal Survey. First, Ipsos undertook a random probability multimode[footnote 4] (telephone and online) survey covering 542 businesses and 310 UK registered charities between March and June 2023[footnote 5]. Of these, 786 interviews (92%) were completed via telephone and 66 interviews (8%) were completed through the online survey option. The data for businesses and charities have been weighted to be statistically representative of these two populations. Subsequently, 30 in-depth interviews were conducted in June and July 2023, to gain qualitative insights from some of the organisations that participated in the quantitative survey.
This longitudinal study tracks changes over time by following the same organisations in all three annual waves. In Wave Two, 899 organisations (599 businesses and 300 charities) agreed to be recontacted in Wave Three. All of these organisations were contacted again for Wave Three (2023). This constitutes the majority of completed interviews; 53% (451 interviews) of completed interviews in Wave Three were part of the longitudinal sample, comprising 280 interviews with businesses and 171 with charities. In contrast, 47% (401 interviews) of the achieved sample in Wave Three came from fresh sample, comprising 262 interviews with businesses and 139 with charities.
The Wave Three sample included seventeen interviews with businesses that were eligible (had 50 or more employees) when first interviewed in a previous wave but had dropped below this figure since then.
In addition to the organisations that had participated in the study in previous years, the survey was issued to businesses and charities that had not taken part previously. This allowed the survey to maintain a strong overall achieved sample size and as such ensure that robust analysis could be completed from this research. To avoid possible selection bias, the ‘fresh’ business sample was selected using random probability sampling. The business sample was proportionally stratified by region, and disproportionately stratified by size and sector.
More technical details, including methodological notes for the longitudinal analysis, and a copy of the questionnaire, are available in the separately published Technical Annex.
Profile of survey respondents
Figure 1.1: Businesses and charities overall and by business size (showing weighted %)
Percentage of the sample that were businesses, split by size, and charities.
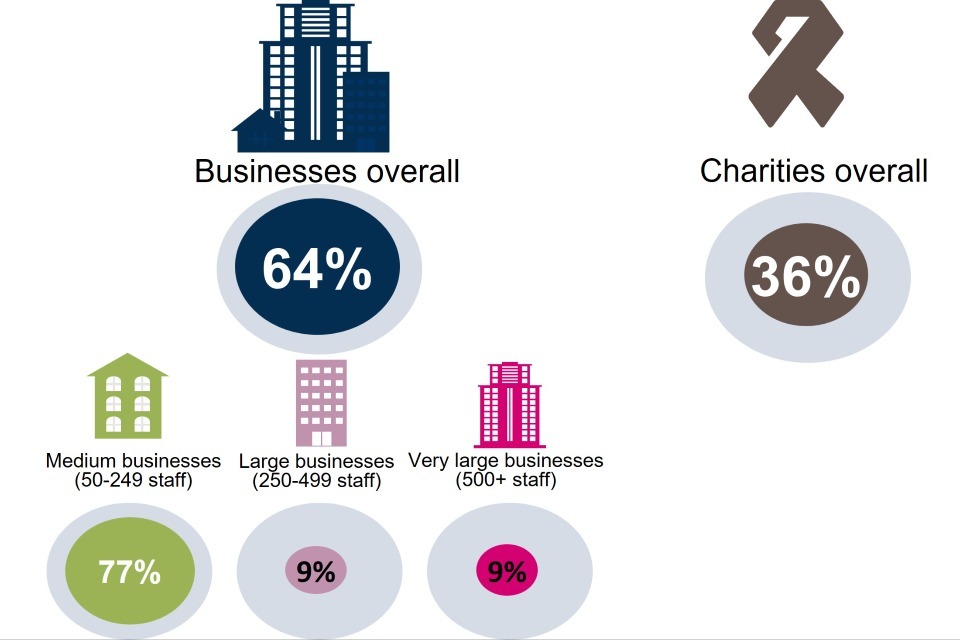
Base: All businesses (n=542); Medium businesses (n=302); Large businesses (n=100); Very large businesses (n=123), includes 17 businesses in the longitudinal sample confirmed as eligible in previous waves but now with fewer than 50 employees and one business in the longitudinal sample that could not confirm their current number of employees; All charities (n=310).
Figure 1.2: Businesses and charities by nation and region (showing weighted %)
The distribution of responding businesses and charities by UK nation and region
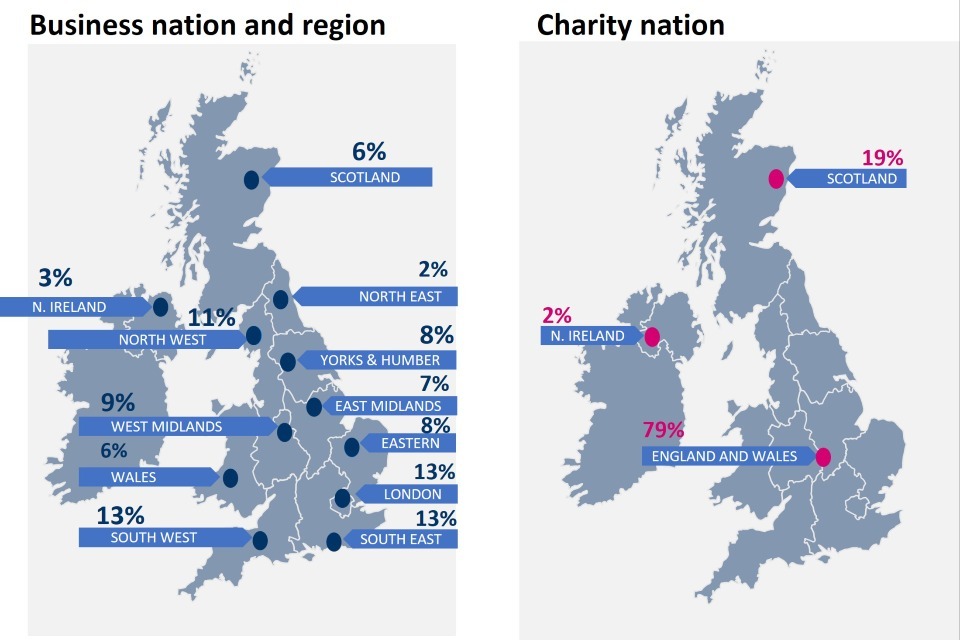
Base: All businesses (n=542); All charities (n=310). Businesses in East Midlands (n=37); Eastern England (n=48); London (n=65); North East (n=12); North West (n=58); Northern Ireland (n=21); Scotland (n=36); South East (n=67); South West (n=62); Wales (n=33); West Midlands (n=52); Yorkshire and Humber (n=51); Charities in England and Wales (n=244); Northern Ireland (n=7); Scotland (n=59).
Figure 1.3: Businesses by sector (showing weighted %)
Distribution of responding businesses by sector
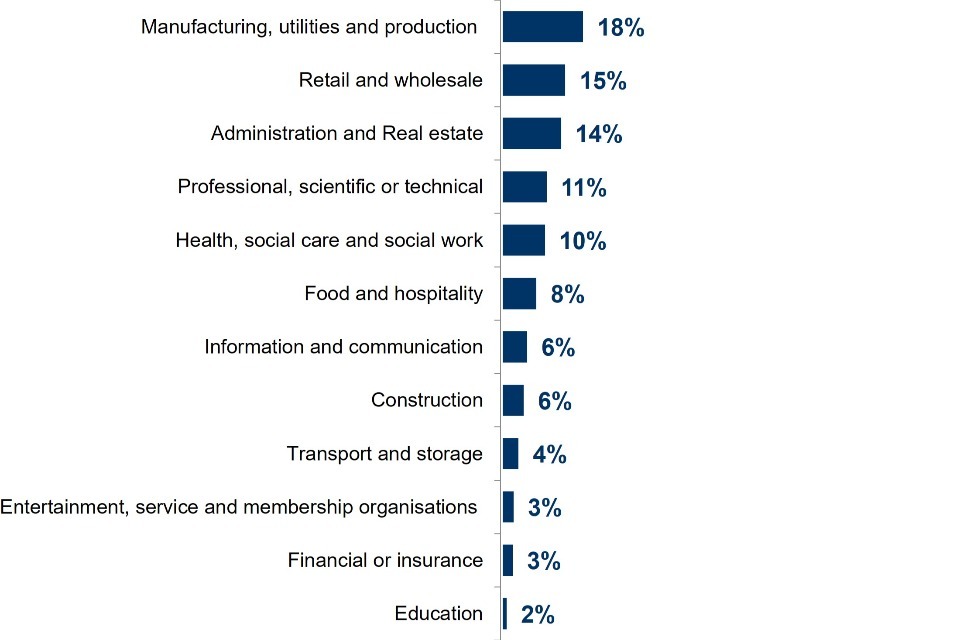
Base: All businesses (n=542); Administration and real estate (n=89); Construction (n=42); Education (n=16); Entertainment, service and membership organisations (n=12); Finance and insurance (n=15); Food and hospitality (n=56); Health, social care and social work (n=40); Information and communication (n=31); Manufacturing, utilities and production (n=116); Professional, scientific and technical (n=29); Retail and wholesale (n=73); Transport and storage (n=23).
Profile of qualitative respondents
Thirty follow-up interviews were carried out with representatives of organisations covered by the survey. They were selected in order to provide the following profile:
Table 1.1 Profile of qualitative respondents
| Category | Definition | Achieved |
| Type | Businesses | 20 |
| Charities | 10 | |
| Size (employees):(Businesses only) | Medium (50-249) | 7 |
| Large (250-499) | 5 | |
| Very large (500+) | 8 | |
| Sector (Businesses only) | Broad mix of sectors | 20 |
| Region (Businesses only) | Broad mix of regions | 20 |
Cyber security roles and responsibilities
Where possible both the survey and follow-up qualitative interviews were addressed to the person at each organisation with greatest responsibility for cyber security. However, in many organisations there is nobody with specific responsibility for cyber security so, in these cases, interviews were completed with representatives that took responsibility for various aspects of IT and data security. This was particularly the case within organisations that do not have an in-house IT department.
There are variations by sector but in general large businesses (especially ‘very large’ enterprises) are the most likely to have employees with dedicated IT and cyber security roles, as well as teams associated with these areas. This can be the case for many medium-sized businesses and charities, but often these smaller organisations fully outsource the management of IT and cyber security.
Respondents with a general, or less technically specific role, tended to have lower awareness of cyber security issues. Meanwhile people at organisations where the cyber security role is combined with other responsibilities are often stretched. As a result, they may not be able to give cyber security matters as much attention as they would like.
1.4 Interpretation of findings
The survey results are subject to margins of error, which vary with the size of the sample and the percentage figure concerned. For all percentage results, subgroup differences by size, sector and other survey answers have only been highlighted where they are statistically significant[footnote 6] (at the 95% level of confidence).
There is a guide to statistical reliability at the end of this report.
Subgroup definitions and conventions
For the purposes of analysis, businesses are divided into medium (50-249 employees) and large enterprises (250+ employees)[footnote 7]. In turn large businesses consist of both large (250-499 employees) and very large businesses (500+ employees). All charities included in the survey have a reported annual income of at least £1 million according to national charity regulator sample data [footnote 8].
Where figures are marked with an asterisk (*) these refer to base sizes smaller than 50 and should be treated with caution.
1.5 Acknowledgements
Ipsos and DSIT would like to thank all the organisations and individuals that participated in the survey. We would also like to thank the organisations that endorsed the fieldwork and encouraged businesses and charities to participate, including:
- The National Cyber Security Centre (NCSC)
- The Home Office
- The Scottish Government
- The Charity Commission
Chapter 2 – Cyber profile of organisations
The development of technology in recent years has significantly shifted how people work. This has included the rise of remote working and the use of remote or cloud storage, all of which have forced organisations to adapt their cyber security requirements to this new environment.
This chapter summarises the extent to which organisations make use of different types of data storage and the methods that employees use to access data from work. It also outlines the extent to which businesses and charities deploy cyber security tools that use AI or machine learning, along with the use of external IT suppliers or consultants.
The ways in which organisations currently store and allow access to data show minimal changes from those reported in Wave One and Wave Two: As in previous waves of the survey, almost every business and charity (96% and 98% respectively in Wave Three) has a cloud or physical server to store data or uses a virtual private network (VPN) that allows staff to connect remotely. However, physical servers are increasingly less likely to be used, both by businesses (76% in Wave Three vs. 82% in Wave One) and charities (60% vs. 72%).
While more prevalent among charities (56% vs. 35% of businesses), the proportion of organisations that allow staff to access their network or files through personally owned devices is in line with previous waves.
The proportion of businesses (81%) and charities (69%) that require staff to use their VPN for remote access remains similar across waves and continues to be high.
For both businesses (23%) and charities (16%), the proportion employing AI or machine learning within their cyber security tools remains low in line with previous waves.
2.1 Data storage and access
In response to their workforces’ changing needs, businesses and charities have had to reconsider the ways in which their data is stored and accessed. In particular, Virtual Private Networks (VPN) have become a critical part of organisations’ cyber security given the rise of remote working and concerns around access of sensitive data.
As in previous waves of the survey, almost all businesses (96%) and charities (98%) have one or more of a cloud or physical server to store data or use a virtual private network (VPN) that allows staff to connect remotely.
Businesses remain more likely than charities to use physical servers (76% vs. 60%) and a VPN that allows staff to connect remotely (75% vs. 58%). In contrast, charities are more likely than businesses to store data or files in the cloud (86% vs. 72%).
While the overarching patterns in each wave have remained similar over time, there have been some changes since the Wave One survey. The use of physical servers is now lower than at Wave One among both businesses (76% compared with 82%) and charities (60% compared with 72%). Charities are also less likely to have a VPN than they were at Wave One (58% compared with 66%) but are now more likely to use a cloud server (86% compared with 77%). These trends have shifted consistently over the three years covered by this survey.
Figure 2.1: How organisations store or access their data and files
Does your organisation use or provide any of the following?
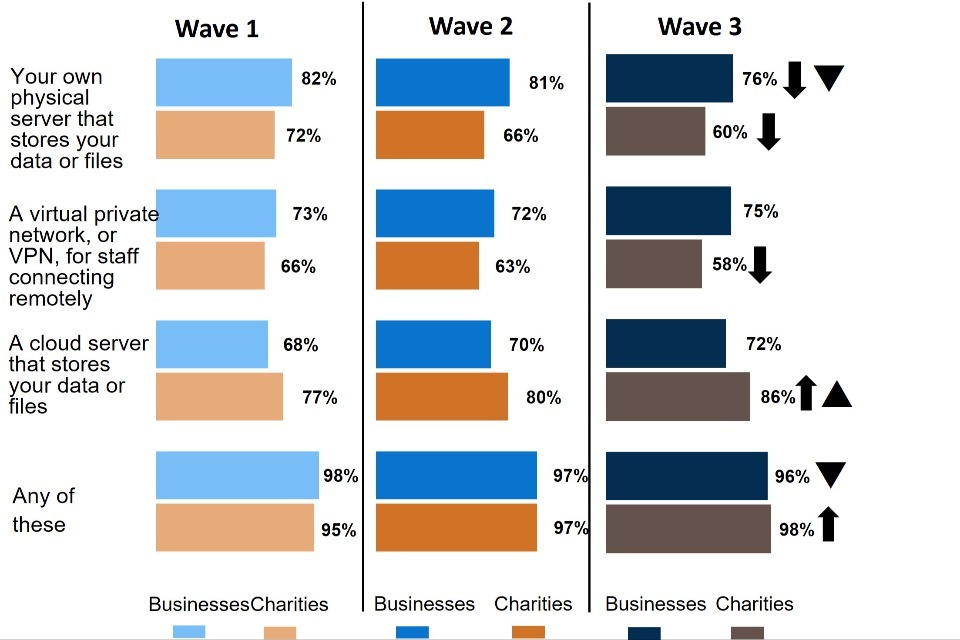
Base: All businesses at Wave 1 (n=1,205) and at Wave 2 (n=688) and at Wave 3 (n=542); All charities at Wave 1 (n=536) and at Wave 2 (n=373), and at Wave 3 (n=310). Significance testing between Wave One and Wave Three is represented with a black arrow, and between Wave Two and Wave Three is represented with a black triangle.
2.2 Use of personal devices to access organisation’s network or files
The COVID-19 pandemic led many organisations to review their remote working capabilities and ensuring that employees can access sensitive data securely has become an important organisational need.
As in previous waves of the survey, charities remain more likely than businesses to allow staff to access their organisation’s network or files through personally owned devices. A majority of charities (56%) allow this, compared to around one in three businesses (35%). Findings are in line with Wave One and Wave Two.
Although correlation does not imply causation, those organisations that allow staff to access their network via personal devices are more likely to have experienced a data security incident in the past twelve months. This pattern was reported at Wave Two, and still applies at Wave Three with regards to charities. Of those charities that have experienced an incident (other than ‘phishing’) in the past twelve months, 63% allow network access via personal devices. Where no incidents are reported, a lower share of charities (46%) allow access via personal devices.
Further to this, in Wave Three, both businesses and charities that have been impacted negatively by a cyber security incident were more likely to permit staff to access their network through personal devices (42% of businesses negatively affected by an incident allow access through personal devices compared to 31% that have not been affected; 63% of charities negatively affected by an incident allow access through personal devices compared 51% that have not been affected). This suggests that allowing access to personal devices, does have potentially harmful consequences for organisations.
Figure 2.2: Use of personal devices to access organisation’s network or files
Are staff permitted to access your organisation’s network or files through personally owned devices? (% Yes)
Base: All businesses at Wave 1 (n=1,205) and at Wave 2 (n=688) and at Wave 3 (n=542); All charities at Wave 1 (n=536) and at Wave 2 (n=373), and at Wave 3 (n=310). There are no significant changes between Wave One and Wave Three or between Wave Two and Wave Three. Among businesses with a VPN, about four in five (81%) require their staff to use it when accessing the organisation’s network or files from outside the workplace. Although the figure is lower, almost seven in ten charities with a VPN (69%) also require staff to use this when working remotely. Both figures are in line with previous waves of the survey.
Figure 2.3: Use of VPNs outside the workplace
Are staff permitted to access your organisation’s network or files through personally owned devices (e.g., a personal smartphone or home computer)?
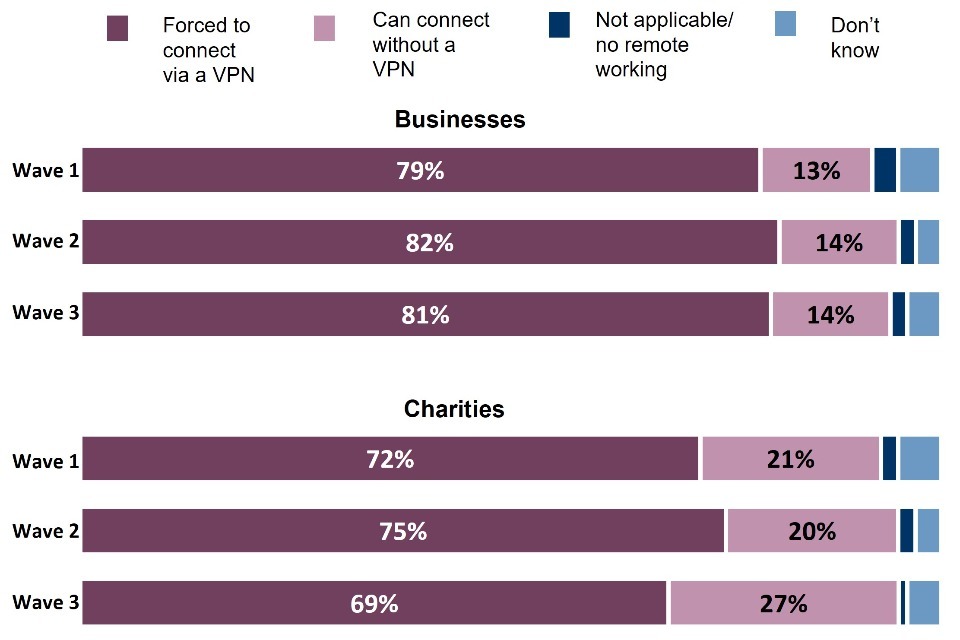
Base: All businesses at Wave 1 (n=909) and at Wave 2 (n=525) and at Wave 3 (n=420); All charities at Wave 1 (n=354) and at Wave 2 (n=235), and at Wave 3 (n=179). There are no significant changes between Wave One and Wave Three or between Wave Two and Wave Three.
2.3 Use of AI and machine learning
AI is an important element of cyber security. Pattern recognition algorithms can be applied to network data flows to automate threat detection, benefitting organisations. Machine learning (a subset of AI) can also be used to support security measures by ensuring systems ‘remember’ and take account of any new patterns identified from recent incidents.
With around one in four businesses (23%) using AI or machine learning, they are more likely than charities (16%) to be using cyber security tools that include this technology. Neither of these shares has changed significantly since Wave One or Wave Two, suggesting that overall take up in AI is not rising despite the increasing capabilities of the technology.
The use of AI and machine learning is more prevalent in larger businesses, with those employing 250+ employees (32%) more likely than medium-sized enterprises (20%) to say it is a feature of their cyber security tools. Use of AI and machine learning is also more common among businesses that have a specific cyber security insurance policy (33% compared with 23% of businesses overall). This is likely also a result of size, as businesses with specific cyber security insurance are usually larger.
Organisations are more likely to report having cyber security tools that include AI and machine learning technology if they have all documentation for all five of the technical controls required to attain Cyber Essentials in place. This applies both to businesses (27% compared with 14% of businesses that do not have all five rules or controls in place) and charities (23% compared with 6%).
Figure 2.4: Use of AI or machine learning
Does your organisation deploy any cyber security tools that use AI or machine learning? (% yes)
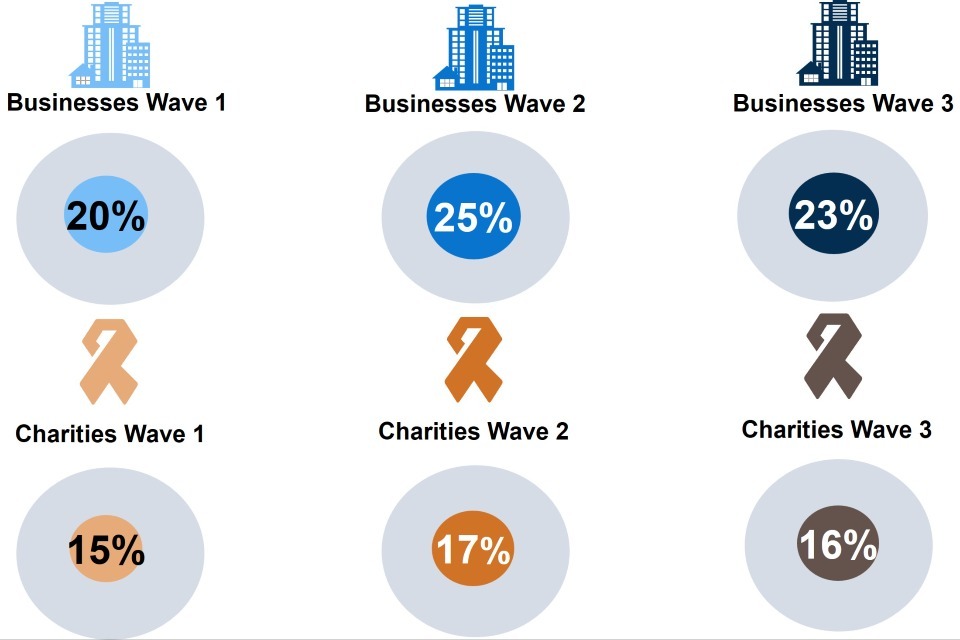
Base: All businesses at Wave 1 (n=1,205) and at Wave 2 (n=688) and at Wave 3 (n=542); All charities at Wave 1 (n=536) and at Wave 2 (n=373), and at Wave 3 (n=310). There are no significant changes between Wave One and Wave Three or between Wave Two and Wave Three.
2.4 Use of external IT providers
Many businesses and charities do not have the resources available to them to adequately adjust their cyber security infrastructure. To help them with this adjustment, they can outsource their technology requirements to external IT providers. Further information on this can be seen in section 6.2.
Within the qualitative interviews, businesses and charities were asked whether they used external IT suppliers or cyber security consultants. The majority did, often contracting an organisation or individual for a broad package of IT support and consultancy, including cyber security. In some cases, organisations contracted external suppliers for specific tasks such as penetration tests, or for support with Cyber Essentials accreditation.
“We have a company that run our emails and our website…we use them because they have expertise in hosting, they have the infrastructure and time.”
Business, Medium, Utilities or production
“There was someone in-house to do all that and they left, so they needed someone to pick it up. This company were growing fast, they had a good reputation.”
Business, Very large, Food and hospitality
“We chose our IT provider in 2014, when IT was becoming more of a talking point, but before compliancy became such a big deal. We spoke to the one logistically that was better, and was local as we need to be reactive, for instance with physical hardware, dropping phones and laptops off quickly.”
Charity, England and Wales
Where external advice was used most extensively, this tended to reflect a lack of in-house resources or knowledge. In some instances, especially for smaller and less technically minded organisations, this was considered more cost-effective than developing or maintaining in-house expertise.
“I don’t know everything - I know what I know, and I know where the gaps in my knowledge are. I’ve written [applications] for the ISO 27001 three times, but I don’t know about programming or IDS/IPS.”
Business, Very large, Education
“It made financial sense to get external support, as and when required, rather than employing someone full time … it’s also out of ease.”
Business, Medium, Construction
The selection process for external consultants was quite mixed. Some organisations conducted a formal selection process when choosing a consultant, whereas others chose a consultant based on a recommendation or personal knowledge.
“We spent about seven months speaking to a number of companies. They were already doing some work for us, but not on the current scale. We went through a selection process … experiences, number of staff, response times, their security within their own company. We whittled it down to two companies - who we thought we could work best with. Cyber security was part of the discussion.”
Business, Large, Health, social care or social work
“A lot of this is nepotism. You know someone that knows someone that works in that industry … they may have worked here at some point.”
Business, Large, Information and communication
“We have an IT contractor who sorts out our limited usage of IT systems. They were recommended by a former colleague, as we needed somebody and we just went with it. There’s a lot of value in that personal recommendation.”
Business, Medium, Utilities or production
Typically, relationships with external consultants were characterised by a high level of trust. This was based on positive experiences of the service over previous years, a perception of a high level of expertise, and good personal relationships.
“They have been with us since day one … no plan to change them … we trust them.”
Business, Large, Food or hospitality
“I suppose, I should not trust them … but because I ask them a lot of questions and they provide me with the correct answer, I trust them …. you also get a vibe when you meet people… if you feel uneasy about people, you just don’t work with them.”
Business, Very large, Utilities or production
“Great relationship, never let us down… full trust.”
Business, Medium, Construction
Chapter 3 – Cyber security policies
In a fast-developing space, it is increasingly essential that businesses have clear cyber security policies to ensure they remain secure from potential cyber threats. Improvements in governance and documentation, as well as insurance, will help organisations to build their cyber resilience. This chapter outlines the policies that organisations have put in place, including governance documentation, insurance policies and staff skills.
Between Waves One and Three, organisations are more likely to have a cyber security policy in place, with businesses in particular more likely to have adopted a cyber security policy than at Wave One. Compared to previous waves, the findings of greatest note are that:
-
Approximately nine in ten organisations (89% of businesses and 92% of charities) have in place at least one of the five documents considered part of an effective cyber security strategy. While this is almost identical to previous waves for charities, this represents an increase since Wave One among businesses (82% in Wave One).
-
The share of businesses that have all five types of documentation in place is higher than at Wave One (22% compared with 17%), while the share of charities has remained consistent (16% in Wave Three).
-
Businesses are more likely than in Wave One to have several types of cyber security documentation including: a Business Continuity Plan covering cyber security; documentation of the organisation’s IT estate and vulnerabilities; a risk register that covers cyber security; and ‘risk appetite’ documentation. This represents the continuation of a trend that started in Wave Two.
-
The maintenance of a risk register that covers cyber security remains more common among charities (73%) than businesses (55%).
-
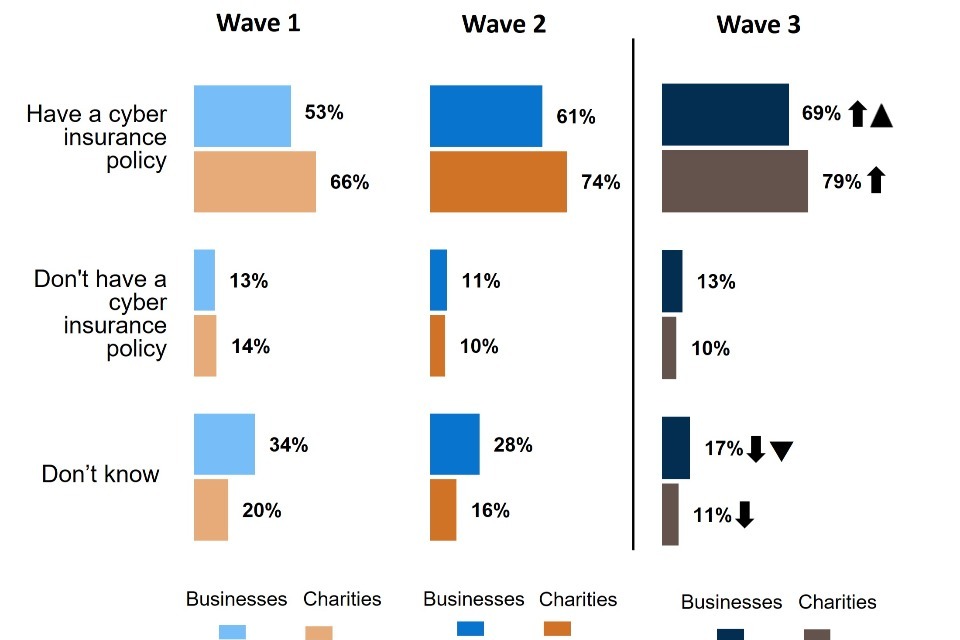
Both businesses (up from 53% to 69%) and charities (up from 66% to 79%) are more likely than in Wave One to possess some form of cyber security insurance, even if this is covered within a more general policy. Organisations are also more likely to be aware of what insurance cover they have, compared with Wave One (Don’t know has declined from 34% among businesses and 20% among charities in Wave One to 17% and 11% respectively in Wave Three).
-
Around six in ten businesses (59%) and charities (62%) have delivered cyber security training or awareness raising sessions specifically for individuals not directly involved in cyber security. These shares are consistent with Wave Two and represent an increase on Wave One (48% among businesses and 55% among charities).
3.1 Governance and planning
As in previous waves, the survey asked about five types of documentation that organisations may have in place as part of an effective cyber security strategy. As detailed in Figure 3.1, these are: a Business Continuity Plan covering cyber security; documentation identifying critical assets; documentation of the organisation’s IT estate and vulnerabilities; a risk register that covers cyber security; and documentation of what is considered an acceptable level of cyber risk (‘risk appetite’).
Most organisations (89% of businesses and 92% of charities) have at least one of these documents in place. While the share of charities is similar to previous waves, the share of businesses represents an increase from Wave One (82%) and a continuation of the trend from Wave Two (86%). More than one in five businesses (22%) and a lower share of charities (16%) have all five types of documentation in place. Again, the share of businesses is higher than at Wave One (17%), while the share of charities is very similar to previous waves of the survey.
As illustrated in Figure 3.1, in Wave Three, a majority of businesses currently have each type of documentation in place, with the exception of ‘risk appetite’ documentation (33%). Most prevalent among businesses is a Business Continuity Plan that includes cyber security (76%). The proportion of businesses with these documents at Wave Three are higher than at Wave One for: a Business Continuity Plan covering cyber security (76% compared with 69% at Wave One); documentation of the organisation’s IT estate and vulnerabilities (61% compared with 54%); a risk register that covers cyber security (55% compared with 48%); and ‘risk appetite’ documentation (33% compared with 26%). For each of these types of documents, this trend has built upon changes first seen in Wave Two, although the changes between waves are only statistically significant between Waves One and Three.
Large and very large businesses (250+ staff) are more likely to have all five types of documentation in place (31%), compared with medium-sized businesses (19%). However, the difference is much smaller when comparing medium businesses that have at least one type of documentation in place (88% among medium businesses and 91% among large/very large businesses).
A ‘complete’ set of documentation is also more likely to be held where a business has some form of accreditation or board oversight of cyber security risk. For example, businesses where the board discusses cyber security monthly (30%) or at least once a year (27%) are more likely to have all five documents when compared to those businesses where the board never discusses cyber risk (4%). Similarly, businesses are more likely to have at least one of the documents in place if the board discusses cyber security monthly (93%) or at least once a year (91%) rather than not at all (79%).
The level of cyber security documentation within charities is similar to that of businesses. The only exception relates to the maintenance of a risk register that covers cyber security, which remains more common in charities (73%) than in businesses (55%). Around three-quarters of charities (73%) have a business continuity plan in place, but relatively few have documentation that outlines the level of cyber security risk they are willing to take (29%). The shares for individual documents are in line with previous waves.
Figure 3.1: Documentation in place to help organisations manage their cyber security risks
Does your organisation have any of the following documentation in place to help manage cyber security risks?
Base: All businesses at Wave 1 (n=1,205) and at Wave 2 (n=688) and at Wave 3 (n=542); All charities at Wave 1 (n=536) and at Wave 2 (n=373), and at Wave 3 (n=310). Significance testing between Wave One and Wave Three is represented with a black arrow, and between Wave Two and Wave Three is represented with a black triangle.
Figure 3.2: Documentation in place to help organisations manage their cyber security risks
Does your organisation have any of the following documentation in place to help manage cyber security risks?
Base: All businesses at Wave 1 (n=1,205) and at Wave 2 (n=688) and at Wave 3 (n=542); All charities at Wave 1 (n=536) and at Wave 2 (n=373), and at Wave 3 (n=310). Significance testing between Wave One and Wave Three is represented with a black arrow, and between Wave Two and Wave Three is represented with a black triangle.
3.2 Cyber insurance policies
Businesses and charities are both more likely than in previous waves to have some form of cyber insurance cover in place (Figure 3.3). About seven in ten businesses have some form of cover (69%), rising from 53% at Wave One and 61% at Wave Two. The share among charities has increased from 66% at Wave One to 79% at Wave Three.
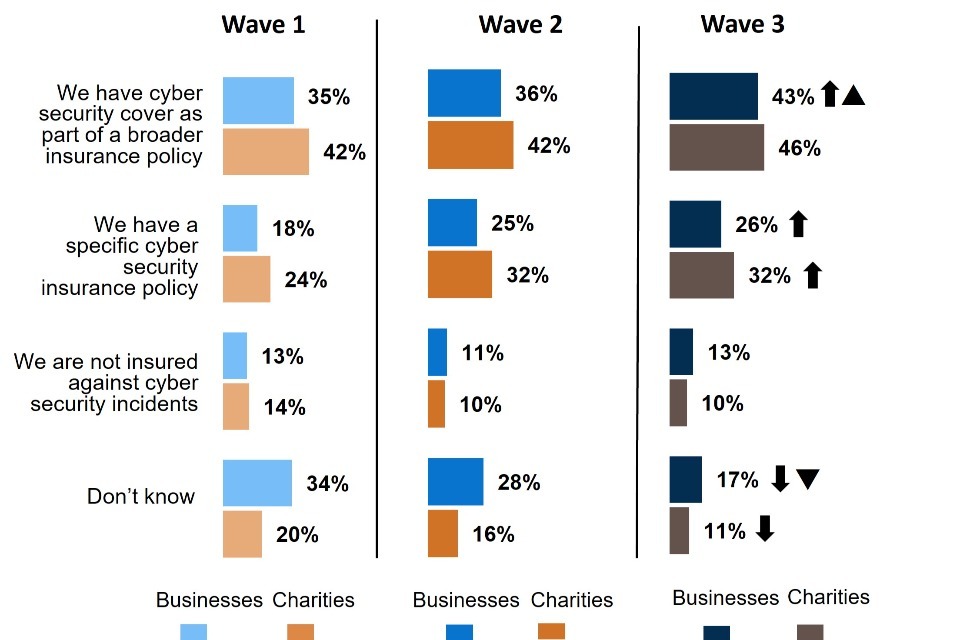
Underlying the overall increase in insurance cover among businesses is the increase in the use of broader, non-cyber security specific insurance policies (Figure 3.3). Approximately one-quarter of businesses (26%) have a specific cyber security policy. This is similar to the share at Wave Two (25%), after an increase from Wave One (18%). By comparison, the usage of broader insurance policies to cover cyber security at Wave Three (43%) is higher than in both Wave Two (36%) and Wave One (35%).
In contrast, the increased share of charities reporting being insured against cyber security incidents is driven by increased prevalence of a specific cyber security insurance policy. In Waves Two and Three, about one-third (32%) have a specific cyber security policy, compared to 24% from Wave One. The share of charities with a broader insurance policy is in line with previous waves (46% in Wave Three, compared to 42% in both Wave One and Wave Two).
Importantly, around one in ten organisations (13% of businesses, 10% of charities) say they have no form of cyber security insurance in place. Others remain unaware of what insurance cover they have against cyber security incidents, although this proportion has fallen since Wave One, among both businesses (17% compared with 34% at Wave One) and charities (11% compared with 20% at Wave One).
Insurance cover is more frequently in place where businesses have also made wider investment in cyber security protection. For example, businesses with all five types of documentation mentioned above are more likely to have some form of cyber insurance cover (83%) than those without all five (65%) or none (40%). In addition, 83% of businesses that are certified to the Cyber Essentials standard have cover, as do 82% of businesses with Cyber Essentials Plus certification and 83% with ISO 27001. It is important to note that both Cyber Essentials certifications also allow organisations to claim free insurance, perhaps helping to explain this finding.
The share among those businesses holding none of these three certifications is 61%, and around one-quarter (23%) of these businesses have no insurance at all against cyber security incidents.
Figure 3.3: Organisations with cyber insurance
Which of the following best describes your situation?
Base: All businesses at Wave 1 (n=1,205) and at Wave 2 (n=688); All charities at Wave 1 (n=536) and at Wave 2 (n=373). Significance testing between Wave One and Wave Three is represented with a black arrow, and between Wave Two and Wave Three is represented with a black triangle.
The increase in the share of businesses with cyber security insurance is reflected in the longitudinal sample (organisations first interviewed in Wave One or Wave Two). Among businesses in the longitudinal sample, 73% have some form of cyber insurance cover in place, higher than at Wave One (58%) and Wave Two (63%). The share of charities with some form of cyber insurance cover has also increased from Wave One (70%) to Wave Three (81%).
Figure 3.4: Type of cyber insurance policy organisations have
Which of the following best describes your situation?
Base: All businesses at Wave 1 (n=1,205) and at Wave 2 (n=688) and at Wave 3 (n=542); All charities at Wave 1 (n=536) and at Wave 2 (n=373), and at Wave 3 (n=310). Significance testing between Wave One and Wave Three is represented with a black arrow, and between Wave Two and Wave Three is represented with a black triangle.
The qualitative interviews suggested that cyber security insurance can come at a considerable cost to the organisation, although it was noted that insurance premiums could be lower where organisations had Cyber Essentials accreditation or had other evidence of controls being in place. One business pointed out that the cost of insurance was cheaper than the cost of an attack.
“I guess it’s the cost of the premiums against what an attack would cost us.”
Business, Medium, Utilities or production
In addition to the financial benefit and mitigation of potential losses, cyber security insurance can provide wider organisational benefits. Part of the process of obtaining this insurance is to review and document procedures, which can prove helpful.
“They (insurance company) have a list of things they want us to have that they then audit…they won’t give us the insurance without it”
Business, Medium, Information and communication
Another business that was in the process of taking out insurance cover outlined how this would raise the profile of cyber security in the organisation, for example by making it more prominent at board level and including it in their annual report. This was seen as necessary in order to demonstrate the importance of cyber security to the insurers.
However, one business was critical of a perceived tendency for organisations to rely on insurance cover as a way of protecting themselves, rather than focusing on controls and procedures to prevent problems.
“Do you pay for insurance and don’t bother protecting yourself? It’s a flawed market.”
Business, Medium, Information and communication
3.3 Staff training
In the past twelve months, approximately six in ten businesses (59%) and charities (62%) have delivered cyber security training or awareness raising sessions specifically for staff and/or volunteers who are not directly involved in cyber security (Figure 3.5). These shares are consistent with Wave Two, after both shares had increased between Wave One and Wave Two (from 48% to 58% for businesses and from 55% to 62% for charities).
Very large businesses with 500+ employees (78%) are more likely to have delivered such training than large or medium-sized businesses (64% and 57% respectively). Other types of business that are particularly likely to have delivered this training include those with all five types of documentation required to attain Cyber Essentials (79%), those who say they adhere to the Cyber Essentials standard (75%) or the Cyber Essentials Plus standard (81%), and those with a specific cyber insurance policy (77%). As such, training appears to be part of a generally more holistic approach to cyber security threats. By contrast, around half (52%) of businesses not adhering to any of the three standards (Cyber Essentials, Cyber Essentials Plus or ISO 27001) and around four in ten businesses with no cyber security insurance (39%) had delivered such training.
Figure 3.5: Cyber security training or awareness raising delivered by organisations in the last 12 months
In the last 12 months, have you carried out any cyber security training or awareness raising sessions specifically for any staff or volunteers who are not directly involved in cyber security?
Base: All businesses at Wave 1 (n=1,205) and at Wave 2 (n=688) and at Wave 3 (n=542); All charities at Wave 1 (n=536) and at Wave 2 (n=373), and at Wave 3 (n=310). Significance testing between Wave One and Wave Three is represented with a black arrow, and between Wave Two and Wave Three is represented with a black triangle.
In the qualitative interviews, some organisations stressed the value of staff training on cyber security, in raising staff awareness and emphasising the potential impact that a cyber incident could have on organisations.
“Everyone … that we have, we put them through the training modules on cyber security and I think the benefit to that training was increasing awareness among staff … I think that is why we do not have as many incidents. Most of our staff know to let me or [our external IT providers] know of anything suspicious.”
Business, Large, Food or hospitality
“There is a massive education piece around the user base - around what is and what is not good cyber security from a sharing data perspective … people definitely need cyber security training.”
Business, Very large, Utilities or production
Some organisations provided regular staff training, sometimes linked to cyber skills assessments of their workforce, although most organisations in the qualitative interviews said they did not carry out workforce assessments. However, some organisations recognised the value of assessments even if they did not do them at present.
“I think it’s a good idea, I am considering it for the future… you can’t improve without having a baseline, which I think assessment of your workforce can give”.
Business, Medium, Information and communication
Staff assessments or training often focused on phishing, for example using a phishing test or a simulation that checked whether staff responded appropriately.
As well as structured training, some organisations viewed cyber security training as a continuous process, involving frequent communication or staff bulletins, as well as measures such as poster campaigns or messages on screen savers.
Chapter 4 – Cyber security processes
Alongside cyber security documentation and training, it is essential that businesses put in place processes to help build their resilience to cyber incidents. This chapter investigates the prevalence of these processes among organisations, along with the standards and certifications that they currently have in place. It also outlines the ways in which organisations monitor and evaluate their policies, along with any improvements that they have made within the last year. By understanding the status of organisations on these policies, it will help to illustrate how businesses are improving their cyber security.
Overall, organisations’ cyber security processes appear to be strengthening, especially among businesses compared to Wave One. However, it is important to note that improvements have remained consistent since Wave Two rather than increasing further. Compared to previous waves of the study, the findings of greatest note are:
- For both businesses and charities, adherence to at least one of the three key cyber security certifications remains consistent since Wave Two but has increased between Wave One (32% of businesses, 29% of charities) and Wave Three (38% of businesses and 36% of charities). Adherence to the ISO 27001 standard among businesses has increased compared to Wave One (19% vs. 15%).
- As with the previous two waves of this study, most organisations have put in place four of the five technical controls required to attain Cyber Essentials certification. However, more proactive measures, such as patch management (67% among businesses, 66% among charities) and user monitoring (58% of businesses, 55% of charities), remain less common.
- Businesses especially have improved their cyber security measures to improve their resilience. Among businesses, the prevalence of cyber security incident identification measures has increased compared to Wave One (90% vs. 82%).
- Further, the proportion of businesses making changes to improve their cyber security processes within the last twelve months has also increased (85% in Wave Three compared to 79% in Wave One). However, this has remained consistent between Waves Two and Three.
- Only a small minority of organisations refer to cyber security in their annual report (18% of businesses and 23% of charities).
- Relatively few businesses and charities (28% and 26% respectively) take into account the risk that suppliers pose to their cyber security.
- Large businesses are much more likely than average to have a more sophisticated cyber security infrastructure in place, compared to medium sized businesses. For example, 47% of large businesses and 35% medium-sized businesses adhere to at least one of the three key cyber security certifications.
- Organisations that are accredited with a cyber security certification often have more substantial security processes and procedures in place. For example, 33% of businesses adhering to ISO 27001 mention cyber security in their most recent annual report compared to 18% of all businesses. This suggests they take a more holistic approach to their cyber security.
4.1 Standards and certifications
A number of cyber security certifications have been developed to encourage good practice in cyber security within organisations. These standards are often based on government guidance and their implementation helps organisations make themselves more resilient. This study focuses on three certifications: Cyber Essentials[footnote 9], Cyber Essentials Plus[footnote 10] and ISO 27001[footnote 11]. The survey asks organisations which of these standards or accreditations they adhere to, however they are not asked to confirm which certification(s) they currently hold. Please also note that between Waves Two and Three the questionnaire was changed to ensure that Cyber Essentials and Cyber Essentials Plus could not be selected at the same time. This ensured that for Wave Three, Cyber Essentials was not overrepresented in the data. For the data included in this report, we have edited the data from Waves One and Two to reflect this routing.
As seen in Figure 4.1, while the proportions of charities and businesses adhering to at least one of these standards increased between Wave One (32% of businesses, 29% of charities) and Wave Three (38% of businesses and 36% of charities), there has been little change between Wave Two and Wave Three.
ISO 27001 (19%) has narrowly become the most common certification adhered to among businesses, with more businesses adhering to it since Wave One (15%). Adherence to Cyber Essentials remained stable, with around one in five businesses adhering to Cyber Essentials in both Wave Two (19%) and Wave Three (18%). Adherence among businesses to Cyber Essentials Plus has also remained consistent (11% in Wave Two, 9% in Wave Three).
Among charities, however, Cyber Essentials remains clearly the most popular certification (23%). While this is in line with Wave Two (also 23%), it represents an increase compared to Wave One (16%). Cyber Essentials Plus (8%) and ISO 27001 (7%) are adhered to by far fewer charities.
Larger businesses are more likely to report that their organisation adheres to at least one of these certifications. Almost half of large or very large businesses (47%) do so, much higher than among medium businesses (35%). In particular, very large companies with 500+ staff are over twice as likely as medium businesses to adhere to the Cyber Essentials Plus standard (16% vs. 7%).
Figure 4.1: Standards and accreditations held by organisations
Which of the following standards or accreditations, if any, does your organisation adhere to?
Base: All businesses at Wave 1 (n=1,205) and at Wave 2 (n=688) and at Wave 3 (n=542); All charities at Wave 1 (n=536) and at Wave 2 (n=373), and at Wave 3 (n=310). Significance testing between Wave One and Wave Three is represented with a black arrow, and between Wave Two and Wave Three is represented with a black triangle. * Please note that the Wave One and Two data has been edited to reflect a change in questionnaire validation (participants mentioning both Cyber Essentials and Cyber Essentials Plus in those waves were re-coded to Cyber Essentials Plus only to match the validation in Wave Three).
Businesses that have experienced a non-phishing cyber incident in the past year are more likely to report that they adhere to at least one standard than the total for all businesses (45% vs. 38%). Although not statistically significant, two in five charities that experienced a non-phishing cyber incident in the last twelve months say they adhere to a standard (40%) compared to around three in ten charities that had not experienced an incident (31%). Crucially, more than two in five businesses (41%) and charities (45%) say their organisation does not adhere to any of the three certifications. The qualitative research again revealed mixed views of the usefulness of the different certifications. Several organisations that adhered to Cyber Essentials said they did so because it allowed them to meet a contractual requirement when working for the government or public sector in general, or because having the certification was felt to send a message to external stakeholders, board members, customers or insurers that the organisation takes cyber security seriously.
Some regarded Cyber Essentials as more of a ‘tick-box’ exercise or were sceptical of the value of an accreditation based on self-certification rather than external scrutiny. Larger organisations or those with a more explicit focus on IT tended to place more value on the ISO 27001 certification, which they saw as more rigorous. Conversely, some medium-sized organisations saw ISO 27001 as ‘overkill’ and too onerous for them to adopt.
“It was always going to be Cyber Essentials. The ISO standard - for the size of the business, we discounted that as not feasible. We don’t have the resource - it’s not a contractual or necessary requirement.”
Charity, Scotland
“It’s the appeal of having certification as a badge to show current and potential insurers that we take [cyber security] seriously.”
Business, Medium, South West
“There is no doubting the benefits [of Cyber Essentials] in terms of reviewing our system, identifying areas of vulnerability and addressing those. The challenge always for an organisation our size is to maintain that level of operation cyber-wise whilst also doing the business. It’s a real challenge - it’s onerous in terms of staff time and attention.”
Charity, Scotland
4.2 Cyber Essentials processes
To attain Cyber Essentials accreditation, organisations are required to have technical controls in place in five key areas. As seen in Figure 4.2, in Wave Three almost six in ten businesses (62%) and charities (59%) have all five technical controls in place. This is broadly comparable between waves. For all organisations, a very large proportion of both businesses and charities – over 90% - say they have each of the following controls in place:
- restricting IT admin and access rights to specific users
- up-to-date malware protection across all devices
- security controls on the organisation’s own devices
- firewalls that cover the entire IT network, as well as specific devices
Figure 4.2: Technical controls in place in the areas required to attain Cyber Essentials
Which of the following rules or controls, if any, do you have in place?
Base: All businesses at wave 1 (n=1,205) and at wave 2 (n=688) and at wave 3 (n=542); All charities at wave 1 (n=536) and at wave 2 (n=373), and at wave 3 (n=310). There are no significant changes between Wave One and Wave Three or between Wave Two and Wave Three.
Very large businesses (those with 500+ employees) are much more likely to have put in place all five technical controls – 79%, compared to 62% of businesses as a whole. This difference is accounted for largely by the much higher proportion of very large businesses that have patch management processes in place (81%).
The presence of designated cyber responsibilities among senior staff is clearly significant in driving practice here. Adherence to all five of the Cyber Essentials technical controls is higher among organisations with board members with oversight of cyber security, and with a designated board member with responsibility for it. This is the case for both businesses and charities. Around three-quarters (73%) of businesses with one or more board members with oversight of cyber security have all five technical controls required to attain Cyber Essentials in place (compared to 62% of businesses as a whole). Similarly, two-thirds (67%) of charities with one or more board members with oversight of cyber security have all five technical controls required to attain Cyber Essentials in place (compared to 59% of charities as a whole).
Additionally, those organisations reporting having experienced a cyber security incident in the last twelve months – whether phishing or non-phishing – are more likely to report that they adhere to the five technical controls. However, it is important to note that organisations that are more likely to be the target of an attack are also more likely to have sophisticated cyber security processes in place. Given this, drawing conclusions from this data should be done with caution.
Outside of the Cyber Essentials technical controls, other processes that could boost cyber resilience often have lower take up:
- monitoring of user activity (58% of businesses in Wave Three, 55% of charities)
- rules for storing or moving files containing personal data (86% of businesses, 88% of charities)
- backing up data using a cloud service (82% of businesses, 84% of charities)
- backing up data using another method (68% of businesses, 55% of charities)
- The prevalence of user activity monitoring has declined since Wave Two among charities (55% in Wave Three compared to 64% in Wave Two). There is a similar trend among businesses (58%, down from 66%).
The relative lack of user activity monitoring represents a potentially significant gap in many organisations’ cyber security protections, given the widely held view expressed in the qualitative research that user behaviour – whether inattention or lack of threat awareness – was a major source of cyber threat exposure for their organisation. However, extensive monitoring of user activity may also be a more onerous, costly and potentially controversial measure to put in place, and therefore one that is only viable for very large organisations with significant cyber security budgets.
4.3 Reporting and identifying risks
Annual reports
As seen in Figure 4.3, only a small proportion of businesses (18%) and charities (23%) say they include content about cyber security in their organisation’s most recent annual report. There has been little movement on this measure between the waves of this survey: 18% of businesses include cyber security in their annual report in Wave Three compared to 19% in Wave Two, and 23% of charities in Wave Three compared to 18% in Wave Two.
As in Wave Two, very large businesses with 500+ employees are more likely than businesses overall (26% compared to 18%) to include cyber security in their annual report. This may reflect large organisations’ capacity to put greater focus on cyber resilience. A similar trend can be seen among those that adhere to one of the three cyber security certifications asked about in the survey being more likely to include cyber security in their most recent annual report (33% of businesses adhering to ISO 27001, 30% for Cyber Essentials Plus, and 22% for the Cyber Essentials Standard). This partly reflects the underlying trend of larger businesses being more likely to adhere to certifications, but also suggests that businesses with a more holistic approach to cyber security are also more likely to report on cyber security as well.
In addition to the above, a substantial proportion of both businesses (27%) and charities (22%) do not know whether their annual report includes any content on cyber security.
Figure 4.3: Reporting on Cyber Security
Did you include anything about cyber security in your organisation’s most recent annual report?
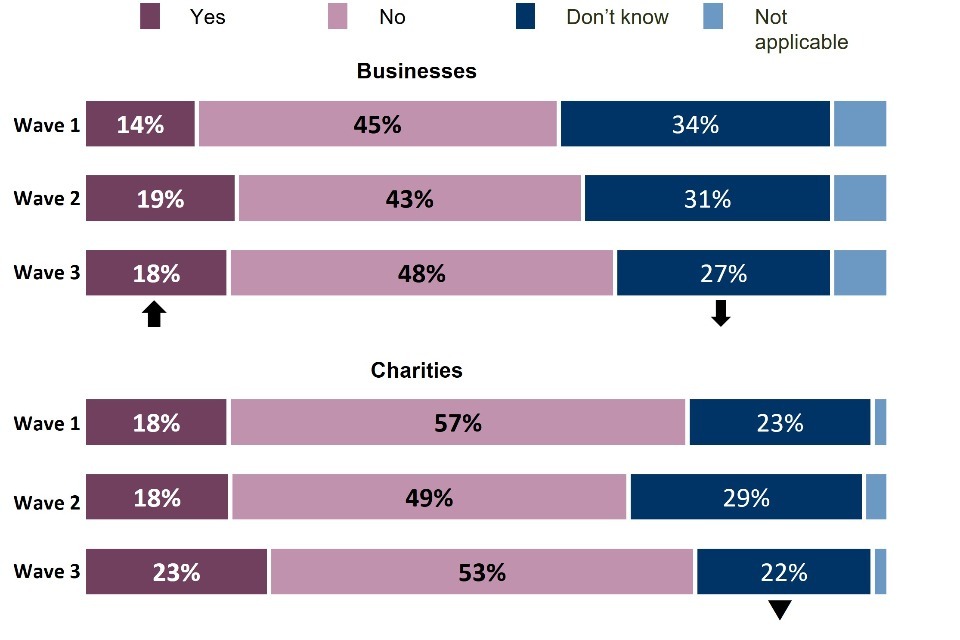
Base: All businesses at wave 1 (n=1,205) and at wave 2 (n=688) and at wave 3 (n=542); All charities at wave 1 (n=536) and at wave 2 (n=373), and at wave 3 (n=310). Significance testing between Wave One and Wave Three is represented with a black arrow, and between Wave Two and Three is represented with a black triangle.
Within the qualitative phase, organisations often noted that the cyber security leads often have little involvement in the preparation of the annual report, with it falling under the remit of other staff members. This in turn reflects a lack of coverage of cyber security in these reports.
“[Cyber security] may feature up to a point alongside GDPR and general activities we have been doing. But I don’t think it takes up more than a few lines. It would be drafted by the chief exec, the comms team and the board.”
Charity, England and Wales
Identification of cyber security risks
In order to ensure that organisations are able to plan and build processes that will protect them adequately, it is vital that that businesses and charities are able to identify their cyber security risks. This research asked organisations which, if any, of four measures they had taken to identify potential risks. These were:
- a risk assessment covering cyber security risks *using specific tools designed for security monitoring
- a cyber security vulnerability audit
- invested in threat intelligence
As shown in Figure 4.4, a relatively small proportion of organisations (23% of businesses and 17% of charities) report that they have taken all four steps.
Nonetheless, most indicate they have taken at least some of these steps. The most common measure taken by organisations is a risk assessment, which around three-quarters report they have done: 75% of charities and 73% of businesses (up from 67% in Wave Two and 65% in Wave One). Clear majorities have also put in place specific tools for security monitoring (71% of businesses up from 61% in Wave One, 64% of charities).
As in Wave Two, a little over half of businesses (54%, an increase on the 47% reported in Wave One) and charities (52%) say they have conducted a vulnerability audit. There has been an increase since Wave One in the proportion of businesses that have invested in threat intelligence (39%, up from 34%), while the proportion of charities making the same investment has remained similar (33% in Wave Three, 31% in Wave One).
Figure 4.4: Steps taken to identify cyber security risks
Which of the following, if any, have you done in the last twelve months to identify cyber security risks to your organisation?

Base: All businesses at Wave 1 (n=1,205) and at Wave 2 (n=688) and at Wave 3 (n=542); All charities at Wave 1 (n=536) and at Wave 2 (n=373), and at Wave 3 (n=310). Significance testing between Wave One and Wave Three is represented with a black arrow, and between Wave Two and Wave Three is represented with a black triangle.
Once again, very large businesses are the most likely to have instituted all four measures to identify potential cyber risk. This finding was borne out by the qualitative research, which also found that medium-sized organisations often relied more on expert technical advice and support from trusted IT consultants to identify and troubleshoot potential cyber security risks that they faced. Sometimes these medium-sized organisations also relied just on the alertness and focus of their own management team, along with general updates from bodies like the NCSC.
“I do think that [our controls] are improving day by day…We undertook a major investment in a new system. It gives us an overview on where all our data is sitting and allows us to track activities of people and strange things happening… And to identify more appropriate controls to it.”
Business, Very Large, Construction, Scotland
“We don’t do any internal checks, which is a problem. But I do use the NCSC website and their toolkits for charities and small businesses to guide us and to create a risk register for cyber risks.”
Charity, England and Wales
4.4 Improvements made over the last 12 months
Organisations’ approach to their cyber security evolves over time in response to their assessment of risk and by understanding this, it will help to fill out the picture of their cyber resilience. This research asked which of a number of improvements have been made in the last twelve months. These included:
- processes for updating and patching systems and software
- the way users are monitored
- processes for managing cyber security incidents
- malware defences
- processes for user authentication and access control
- the way systems or network traffic is monitored
- network security
Large majorities of both businesses and charities continue to improve their cyber security protection. As was the case in Wave Two, almost nine in ten charities (87%, comparable to previous waves) and nearly as many businesses (85%, an increase compared to 79% in Wave One) indicate they have made at least one of these improvements over the last year (Figure 4.5).
The proportion reporting taking some of the most common improvements continues to increase. Seven in ten charities (70%) report they have improved their processes for user authentication and access control, up from 63% in Wave One. Nearly as many businesses report doing so (65%), which also reflects an increase on Wave One (59%).
Almost as many organisations report having strengthened their malware controls: 62% of charities (up from 55% in Wave One) and 64% of businesses (up from 55% in Wave One) report boosting their protection in this area.
Businesses also report increases in improving their network security (69% in Wave Three compared to 62% in Wave One), software patching processes (54% compared to 48% in both Wave One and Wave Two), and processes for managing cyber security incidents (50% compared to 41% in Wave One).
A higher proportion of charities have improved the way they monitor their users in the last year when compared to Wave Two (57% vs. 43%).
Figure 4.5: Steps to expand or improve cyber security in last twelve months
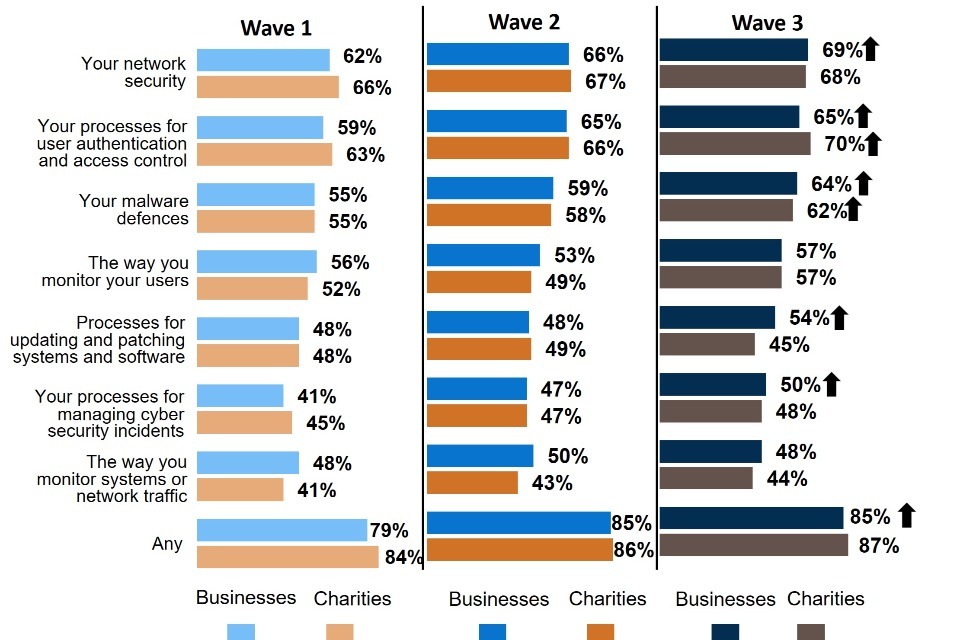
In the last twelve months, has your organisation taken any steps to expand or improve any of the following aspects of your cyber security?
Base: All businesses at Wave 1 (n=1,205) and at Wave 2 (n=688) and at Wave 3 (n=542); All charities at Wave 1 (n=536) and at Wave 2 (n=373), and at Wave 3 (n=310). Significance testing between Wave One and Wave Three is represented with a black arrow, and between Wave Two and Wave Three is represented with a black triangle.
Once again, it is very large businesses that are most likely to have looked at improving user monitoring – 57% of businesses with 500+ employees report they have done so, compared to three in ten medium-sized companies (30%). Indeed, very large businesses are the most likely to have made improvements in the last twelve months across all of these areas.
Organisations undertaking these improvements are also more likely to be those that discuss cyber security regularly at board level, and those that adhere to Cyber Essentials, Cyber Essentials Plus or ISO 27001 certification. This strongly suggests that these activities actively encourage good practice.
The qualitative research confirms the sense that it is medium-sized businesses and charities that sometimes reported being under pressure to continuously improve their cyber security protection. Some charities in particular reported finding it difficult to secure buy-in to find the resources to keep improving their cyber security defences in the face of other pressures. These themes, suggesting individual organisations do not necessarily experience linear improvements in cyber security preparedness and a degree of volatility at aggregate level, are explored further in the longitudinal analysis in Chapter 9.
“We have challenges in maintaining - staff capacity is number one as we’re very stretched. Funding is also always an issue, the upfront costs for some investments in cyber security are huge for charities. And we get some pushback from some staff, there’s sometimes little buy-in and we have to focus on staff education a lot.”
Charity, England and Wales
“We are doing a lot more testing internally to improve our overall posture … so we have a project in place that tests more regularly, going through our key strategic systems … our pen testing is done in silos…So one thing we are pushing is more overall testing. Things like attack part mapping and also testing our detection systems as well … we look at it more holistically rather than in silos.”
Business, Large, Information and Communication, South East
4.5 Supplier risks
In considering the cyber security threats they face, organisations also need to consider risks that they may be exposed to through the third parties they interact with, and particularly from suppliers. Suppliers pose several risks of:
- third-party access to an organisation’s systems
- storage of personal data or intellectual property of client organisation
- potential cyber security threats to the supplier or originating with the supplier, including phishing attacks, viruses or malware
Nevertheless, only a small minority of organisations say that they have done work to formally assess or manage the cyber threat presented by their suppliers or partners within the last year (Figure 4.6). Around one-quarter of businesses (28%) and charities (26%) report having assessed their supplier risks. This is similar to previous waves.
The largest businesses are the most likely to undertake initiatives to assess or manage the risks presented by their suppliers. Almost half of very large businesses with 500+ employees (48%) report doing so, compared to 24% of medium-sized businesses and 29% of businesses with 250-499 employees. As with other findings, this suggests that businesses that have the largest budgets to manage their cyber security risks are in the best position to manage and address these supplier risks.
Across both businesses and charities, organisations that adhere to a cyber security certification are more likely to report having completed a supplier cyber risk assessment in the last twelve months. Businesses adhering to ISO 27001 (53%) are the most likely to assess their suppliers, although those adhering to Cyber Essentials Plus (46%) and Cyber Essentials (33%) are also more likely to have done so than businesses as a whole. Similarly, charities adhering to the Cyber Essentials Standard (35%) are more likely to have undertaken a supplier risk assessment in the last year than charities not adhering to any of the three certifications (19%). Given this, it seems that organisations taking a more sophisticated or holistic approach to cyber security are also more likely to consider the risk that their suppliers pose.
The qualitative research suggests that many organisations that have not formally considered these risks do not consider themselves to have supplier relationships, particularly in the charity sector. Others may have supplier relationships that do not involve any access to their own IT systems, or any significant online interactions, which are often not considered to pose significant risks.
In other cases, organisations may have very large suppliers of IT services such as Microsoft or Cisco. In these cases, respondents often took the view that they had no option but to trust that these large organisations had state-of-the-art cyber security protections. At the other end of the spectrum, some large businesses with a wide range of complex supplier relationships took supplier vetting very seriously indeed:
“If we have a supplier that just delivers hay, and they don’t even have a website really, why are we checking their cyber security accreditation? It’s irrelevant to us.”
Charity, Scotland
“[We have] an eight-page questionnaire that all suppliers have to complete before we take them on and cyber questions are included, including ‘do they have ISO 27001?’, GPDR and all that sort of stuff. It’s to make sure that they are aligned with us … to make sure they are not compromising our systems … we have a good relationship with our suppliers, we treat them more like partners. They work with us.”
Business, Large, Food and Hospitality, Scotland
Figure 4.6: Initiatives to assess or manage cyber security risks presented by suppliers / partners
In the last twelve months, has your organisation carried out any work to formally assess or manage the potential cyber security risks presented by any of these suppliers/suppliers or partners?
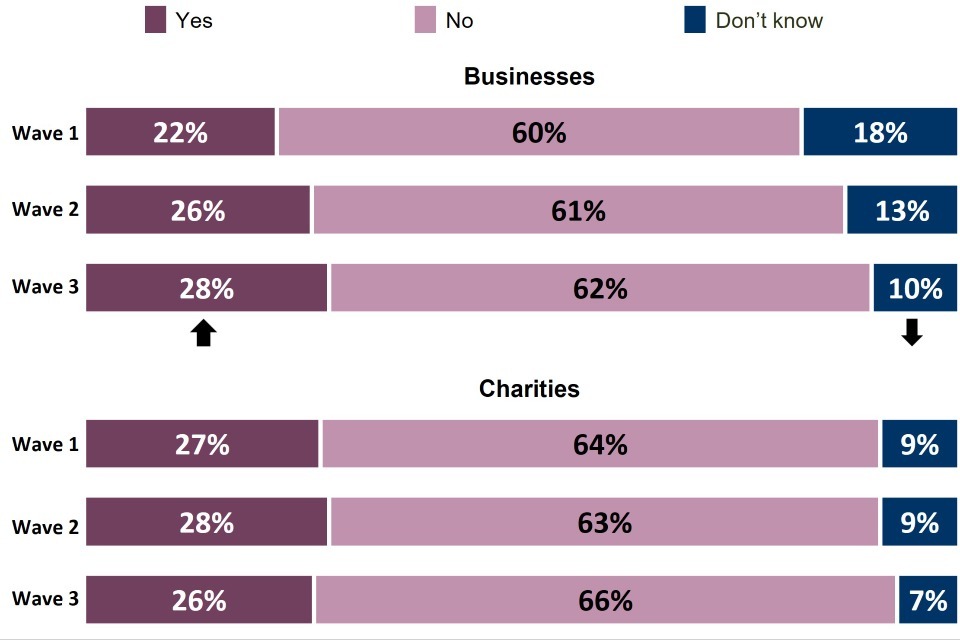
Base: All businesses at Wave 1 (n=1,205) and at Wave 2 (n=688) and at Wave 3 (n=542); All charities at Wave 1 (n=536) and at Wave 2 (n=373), and at Wave 3 (n=310). Significance testing between Wave One and Wave Three is represented with a black arrow, and between Wave Two and Wave Three is represented with a black triangle.
Organisations that reported that they had taken steps to formally assess their suppliers’ cyber security risks were asked which, if any, of five specific steps they had taken to do so:
- carried out a formal assessment of their cyber security (such as an audit)
- set minimum cyber security standards in supplier contracts
- requested cyber security information on their own supply chains
- given them information or guidance on cyber security
- stopped working with a supplier following a cyber incident
As in previous waves, most of these organisations (86% of businesses, 87% of charities) had undertaken at least one of these steps. Large businesses emerge as those most likely to have done so.
The most common measure undertaken is to set minimum cyber security standards in supplier contracts. This was done by 58% of businesses and 63% of charities that had assessed their suppliers’ potential cyber security risks.
In addition, just over half (51% of businesses, 54% of charities) have requested suppliers to give them cyber security information on their own supply chains.
Nearly half of businesses (47%) but rather fewer charities (29%) report that they have carried out a formal assessment of their suppliers’ cyber security.
Relatively few (9% of businesses, 10% of charities) report that they have stopped working with a supplier following a cyber incident. However, the proportion of charities that have stopped using a supplier following a cyber incident increased compared to Wave Two (10% in Wave Three compared to 1% in Wave Two).
Figure 4.7: Work done in last twelve months with suppliers to manage cyber security risk
Which of the following, if any, have you done with any of your suppliers/suppliers or partners in the last twelve months?
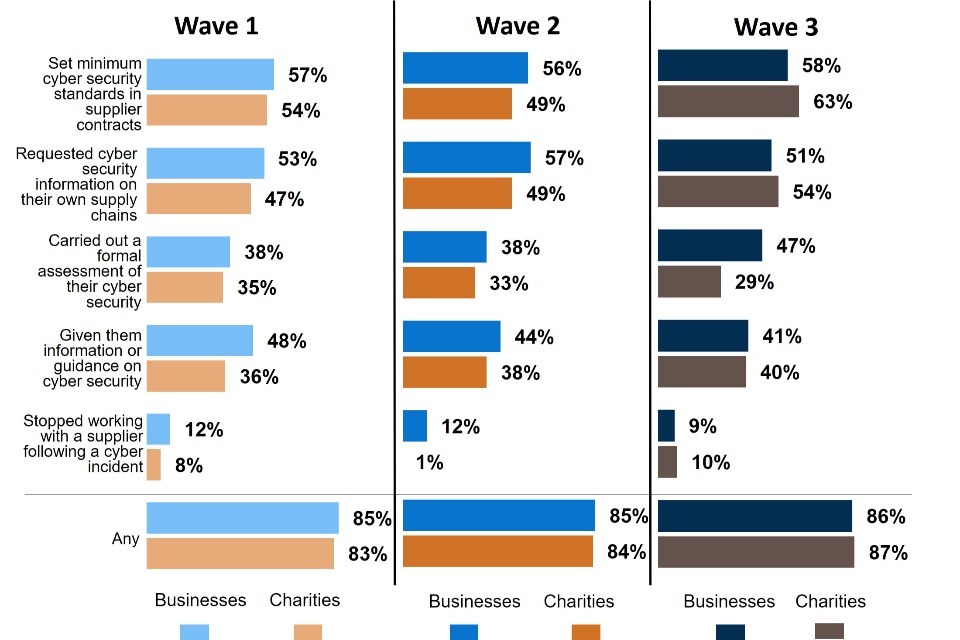
Base: All organisations reviewing immediate supplier risks. Businesses Wave 1 (n=306) and Wave 2 (n=205), and Wave 3 (n=166); Charities Wave 1 (n=144) and at Wave 2 (n=104), and Wave 3 (n=82). Don’t know not shown. Significance testing between Wave One and Wave Three is represented with a black arrow, and between Wave Two and Wave Three is represented with a black triangle.
Chapter 5 – Board involvement
A significant factor in organisations’ cyber resilience is the importance that senior staff put on cyber security. This will help to understand how highly organisations prioritise securing themselves against the potential threats.
This chapter covers the extent to which boards (directors, trustees, and senior leadership teams) of larger businesses and charities engage with cyber security matters. It outlines the roles and responsibilities of board members in relation to cyber security, their general level of engagement with these matters and whether they have received training in this area.
Board engagement with cyber security has increased since Wave One of this research but has broadly remained consistent between Wave Two and Wave Three. The findings of greatest note in this chapter are:
- In Wave Three, just over half (55%) of businesses and just under half of charities (45%) have a member on their board whose roles include oversight of cyber security risks.
- More than six in ten organisations (66% of businesses and 61% of charities) have a designated staff member responsible for cyber security who reports directly to the board. Among businesses, this represents an increase since Wave One (55%) but is comparable with Wave Two (61%).
- However, the proportion of businesses reporting that their board discusses cyber security at least quarterly has decreased (43% in Wave Three compared to 37% in Wave One).
- Despite this, the prevalence of board-level cyber security training has increased for both businesses (50% in Wave Three compared to 35% in Wave One) and charities (38% in Wave Three compared to 28% in Wave One). The training is most likely to be completed once a year, though three in ten businesses (31%) report board-level training several times a year.
- Large businesses are consistently more likely to have greater board engagement with cyber security (65% in Wave Three). This may reflect the greater levels of cyber awareness and higher budgets that these businesses tend to possess.
5.1 Roles and responsibilities
To help measure the level of senior staff buy-in, this research asked organisations whether they had:
one or more board members whose roles include oversight of cyber security risks
# a designated staff member responsible for cyber security who reports directly to the board
As shown in Figure 5.1, more than half of businesses (55%) say that they have one or more board members whose role includes oversight of cyber security risks. This remains less common among charities (45%). For both businesses and charities, this is broadly stable across the three waves of the survey.
More than six in ten organisations have a designated staff member responsible for cyber security who reports directly to the board (66% of businesses, 61% of charities). Compared to previous waves of this research, the proportion of charities with a designated cyber security staff member responsible for cyber security reporting directly to the board is consistent. In contrast, the proportion of businesses with a designated staff member responsible for cyber security who reports directly to the board has increased (66% in Wave Three compared to 55% in Wave One of the survey).
There remains a correlation with business size. Almost two-thirds of very large businesses with 500+ employees say that they have a board member with oversight of cyber security risks (65%). In contrast, among medium-sized businesses, only around half say the same (52%).
Figure 5.1: Cyber security roles and responsibilities within organisations
Does your organisation have any of the following?
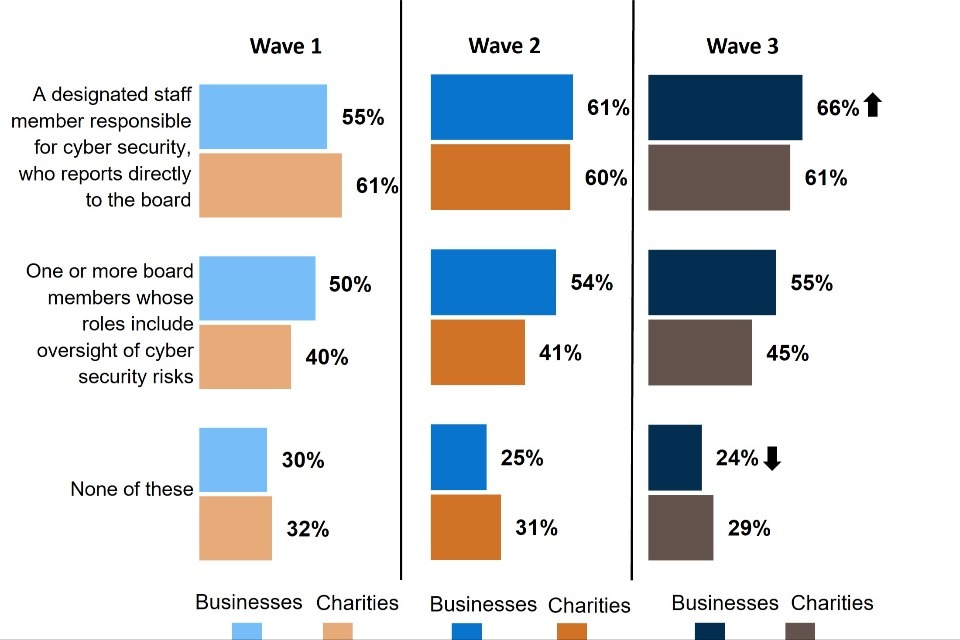
Base: All businesses at Wave 1 (n=1,205) and at Wave 2 (n=688) and at Wave 3 (n=542); All charities at Wave 1 (n=536) and at Wave 2 (n=373), and at Wave 3 (n=310). Significance testing between Wave One and Wave Three is represented with a black arrow, and between Wave Two and Wave Three is represented with a black triangle.
The qualitative research revealed a wide range of approaches taken to board-level oversight of cyber security within organisations. In many cases, boards looked at cyber security within the context of wider risk management – these broader risks might include financial security or more general information security and GDPR, particularly in the case of charities. Responsibility for cyber security often sat with a board member with a more technical or IT-focused background. Frequently, outside the larger or more IT-specialised organisations, respondents commented that their board had no particular technical expertise that would allow them to critically evaluate the status of their organisation’s cyber security protections.
“The Finance Director has oversight of cyber. I try to educate myself then try to educate them. It’s all very productive - and proactive. There are times they can’t give me everything I need, but they are 100% bought into it.”
Business, Medium, Utilities/Production, North West
“We kind of have a board of trustees that the CEO reports to, but nobody at the board raises this, as far as I’m aware. At least, they’ve never fed that down. We need responsibility defined and I hope that gets sorted soon.”
Charity, England and Wales
5.2 Awareness and training
One measure of the importance that organisations attach to cyber security is the frequency with which it is discussed at board level.
Broadly speaking, as shown in Figure 5.2, the boards of charities discuss cyber security less regularly than businesses do.
Figure 5.2: Frequency of board discussions or updates on cyber security
Over the last twelve months, roughly how often, if at all, has your board discussed or received updates on your organisation’s cyber security?
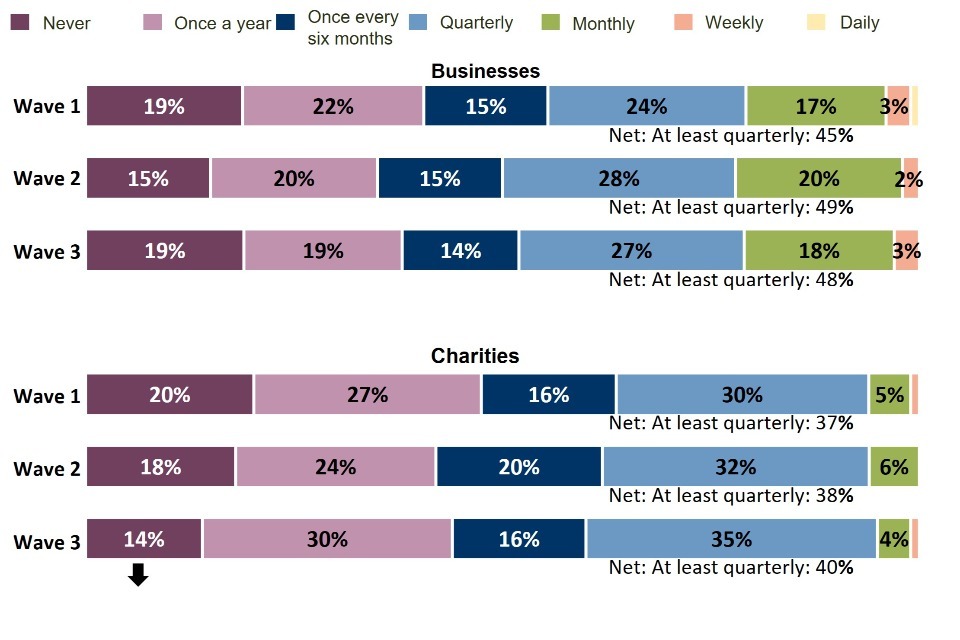
Base: All businesses excluding Don’t Know at Wave 1 (n=974) and at Wave 2 (n=599) and at Wave 3 (n=486); All charities excluding Don’t Know at Wave 1 (n=473) and at Wave 2 (n=336), and at Wave 3 (n=287). Significance testing between Wave One and Wave Three is represented with a black arrow, and between Wave Two and Wave Three is represented with a black triangle.
Among businesses, the frequency with which cyber security is discussed by boards has remained stable between Waves One, Two and Three. Similarly, the proportion of charity boards discussing cyber security at least quarterly has remained broadly stable (37% in Wave One, 38% in Wave Two, 40% in Wave Three)[footnote 12].
Although the frequency of board-level cyber security discussions has remained stable, there is evidence that it is now being factored into decision-making more strongly among businesses. The proportion of businesses agreeing that “the board integrates cyber risk considerations into wider business areas” has increased from 55% in Wave One to 63% in Wave Three.
Boards’ ability to engage meaningfully on cyber security issues may also be shaped by whether they have received training on cyber security (Figure 5.3). Here, there is strong evidence that training is on the increase among both audiences. Half of businesses report that any of their board members has received cyber security training (50%, up from 35% of businesses in Wave One). Among charities, 38% say that any of their board members has received cyber security training (up from 28% of charities in Wave One).
Figure 5.3: Board-level cyber security training
Have any of the board received any cyber security training?
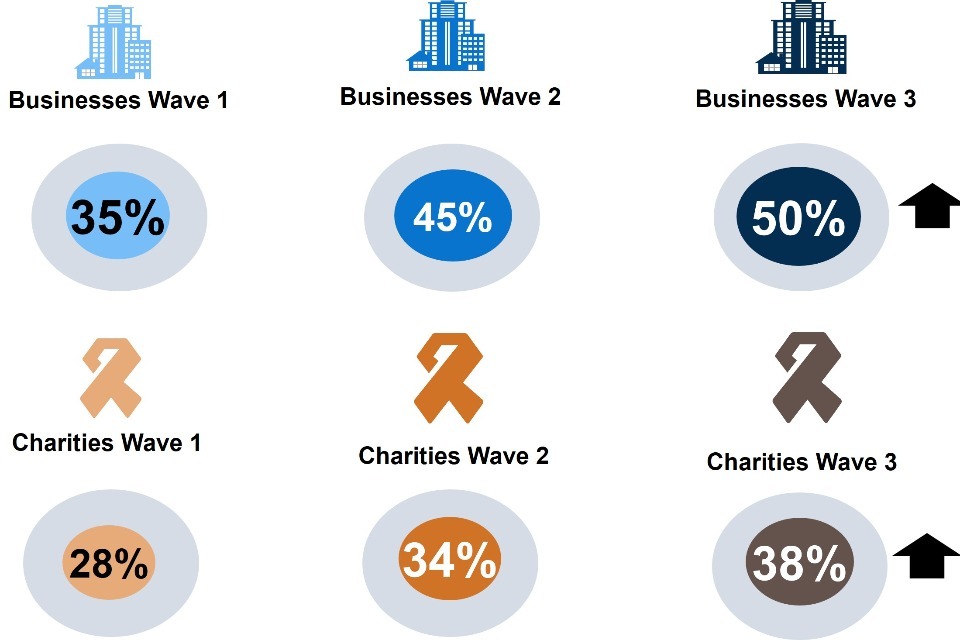
Base: All businesses at Wave 1 (n=1,205) and at Wave 2 (n=688) and at Wave 3 (n=542); All charities at Wave 1 (n=536) and at Wave 2 (n=373), and at Wave 3 (n=310). Significance testing between Wave One and Wave Three is represented with a black arrow, and between Wave Two and Wave Three is represented with a black triangle.
Very large businesses are once again the most likely to report their board members have received cyber security training – 66% report they have done so, compared to less than half (47%) of medium-sized businesses.
Around three in ten businesses (31%) report their board receiving cyber security training several times a year (Figure 5.4), and a further half (49%) note that such training happens around once a year.
Among charities, board training on cyber security is much less frequent: one in ten charities (10%) report their board receiving training several times a year, while almost half (47%) note that the board cyber security training happens around once a year.
Figure 5.4: Frequency of board training
On average, how often does the board receive cyber security training?
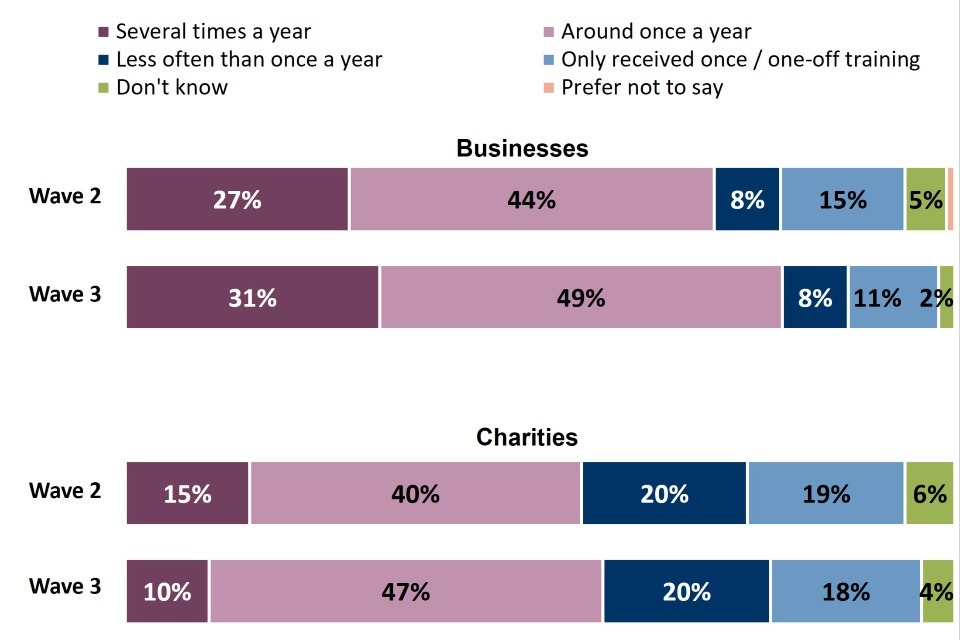
Base: All organisations where board has received cyber security training: Businesses Wave 2 (n=324) and at Wave 3 (n=287); Charities Wave 2 (n=126), and at Wave 3 (n=119). Question not asked in Wave One. There are no significant changes between Wave Two and Wave Three.
Despite this, findings from the qualitative stage suggest that some organisations’ engagement with security training is high, with even owners or CEOs sometimes involved:
“[The board] have annual training and access to me and other experts. We do a lot of horizon scanning and the CEO brings that all to the board.”
Charity, England and Wales
“When I arrived [our approach to cyber security] was very reactive, now we are moving towards a more proactive approach. But since I have been here, we have done more training. We are just more aware of the threats. The board attended a full set of training with me last year on cyber security. Even the owner turned up and I fell off my chair, I was so surprised. I am about to do a presentation to them about the tools we have in place. How we are using them, what we are doing with them.”
Business, Very Large, Construction, Scotland
Chapter 6 – Sources of Information
One of the most important sources of information for organisations on cyber security is guidance from the National Cyber Security Centre (NCSC) . This chapter explores usage of this guidance, along with other sources of information used. It further covers the extent to which various stakeholders influence organisations’ policies and processes related to cyber security.
It is vital that organisations receive the most up to date information possible to ensure they can be as cyber resilient as possible. Understanding the sources of information that organisations use will help to inform policy.
It is important to keep in mind when reading the following chapter that responses to some questions may be influenced by organisations’ ongoing involvement in this research. It is possible that participation in previous waves of the survey may have enhanced participants’ awareness of the information available to them. For example, the use of NCSC information or guidance is higher among organisations in the longitudinal sample (46% among charities and 33% among businesses) compared to the fresh sample (39% among charities and 25% among businesses).
Since Wave One of this research there has been a general increase in use of different types of information. However, this broadly remained stable between Waves Two and Three. Compared to previous waves of the study, the findings of greatest note are:
- Use of NCSC information or guidance has increased since Wave One for both businesses and charities but remained stable between Wave Two and Wave Three. Charities remain more likely than businesses to use NCSC information or guidance (43% vs. 29%).
- As in Wave Two, among organisations using NCSC guidance, the most common guidance accessed is the GDPR information (by 67% of businesses and 68% of charities), followed by the ‘10 Steps to Cyber Security’ (by 62% of businesses and 64% of charities).
- Since Wave One, among businesses, there has been an increase in usage of the Cyber Assessment Framework (57% in Wave Three vs. 41% in Wave One), NCSC weekly threat reports (45% vs. 32%), and Cyber Security Board Toolkit (34% vs. 23%). *Since Wave One, more charities (45% in Wave Three vs. 30% in Wave One) and businesses (34% vs. 26%) report their actions on cyber security being influenced by their insurers. Businesses are also more likely to report being influenced by external consultants since Wave One (53% vs. 47%). However, there is little change between Wave Two and Wave Three.
6.1 Use of NCSC guidance
The National Centre for Cyber Security publishes a wide range of guidance on various elements of cyber security, including best practice, threat intelligence, incident response, secure coding, risk management and security awareness, with some of it tailored for businesses and organisations in specific sectors. The survey investigates the extent to which organisations use this advice.
Around three in ten businesses use NCSC guidance (Figure 6.1). However, since Wave One, there has been an increase in the usage of those resources (29% in Wave One compared to 23% in Wave Two). Usage of the guidance is higher among charities and, as with businesses, there has been an increase in the usage since Wave One (43% vs. 32% in Wave One).
Figure 6.1: Use of NCSC Guidance
In the last twelve months, has your organisation used any information or guidance from the National Cyber Security Centre (NCSC)[footnote 13] to inform your approach to cyber security?
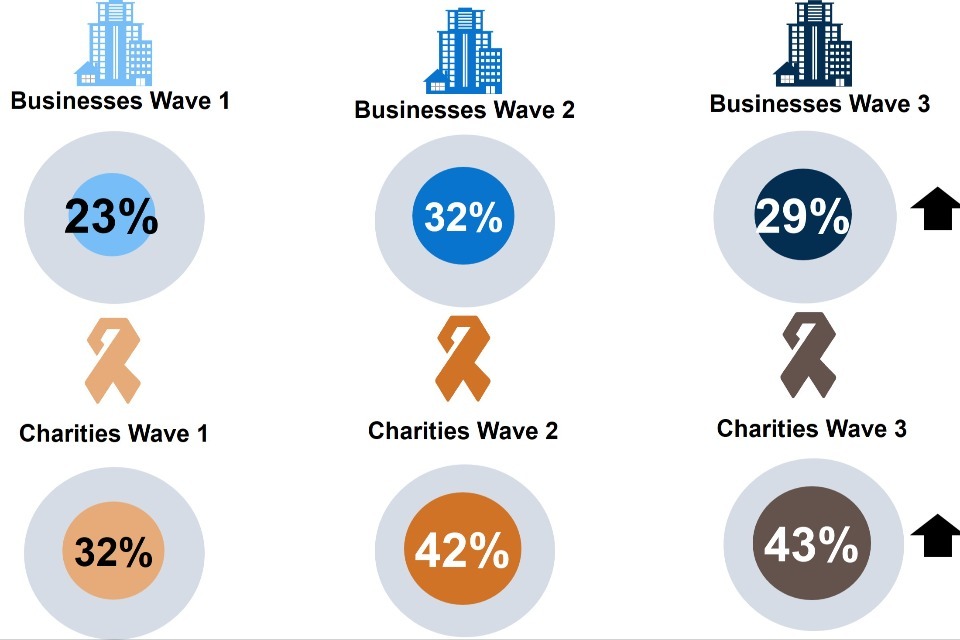
Base: All businesses at Wave 1 (n=1,205) and at Wave 2 (n=688) and at Wave 3 (n=542); All charities at Wave 1 (n=536) and at Wave 2 (n=373), and at Wave 3 (n=310). Significance testing between Wave One and Wave Three is represented with a black arrow, and between Wave Two and Three is represented with a black triangle.
In general, use of NCSC guidance also aligns with organisations that have taken a more holistic approach to cyber security. For example, businesses whose board receives updates on cyber security monthly or more often are much more likely to be using NCSC guidance (44%). Use of the guidance is also much higher among businesses that have a cyber security accreditation – ISO 27001 (45%) and Cyber Essentials (44%), but particularly Cyber Essentials Plus (54%).
The trend applies to charities as well: a majority of charities that are accredited to Cyber Essentials report using NCSC guidance in the last year (61%), as do a majority of the relatively few charities adhering to the ISO 27001 standard (52%).
Findings from the qualitative research confirm this impression: respondents were often highly complimentary about the quality of NCSC guidance and the NCSC website, which was seen as comprehensive, trustworthy and easy to follow for the layperson. However, organisations using the NCSC website appeared to be those that were already convinced of the importance of taking cyber security seriously and committing significant resource and focus to doing so. It was less clear that the NCSC was being used as a gateway into the world of cyber security for the uninitiated.
“[The NCSC] is a brilliant website, well written, very informative. We download off that, read their articles.”
Charity, Scotland
“We paid a cyber security company to do an internal and external audit and measure us against the NCSC’s ‘10 Steps’ measures. And they came back with a report based on the ‘10 Steps’ model.”
Business, Very Large, Utilities or Production, Yorkshire and the Humber
“For a business like us, NCSC is the most useful, it’s all in one place, easy to use and understandable to the layman. I am not formally trained in cyber security; I have fallen into this role over the years. So, NCSC is accessible to someone like me - I am self-taught. I can easily follow it. In contrast, what I get sent from vendors uses highly technical language. I don’t often speak highly of Government bodies, but NCSC is golden to us. It protects business.”
Business, Medium, Information and Communication, West Midlands
In Wave Three, the most common type of NCSC information or guidance used (Figure 6.2) is GDPR guidance (by 67% of businesses and 68% of charities using NCSC guidance in the last twelve months). Such organisations also commonly make use of NCSC’s 10 Steps to Cyber Security (62% of businesses, 64% of charities) and Cyber Assessment Framework (57% of businesses, 47% of charities).
For businesses, there has been little change between Wave Two and Wave Three. However, compared to Wave One, businesses’ use of NCSC’s Cyber Assessment Framework (57% in Wave Three compared to 41% in Wave One) and weekly threat reports (45% vs. 32%) has increased. This suggests that businesses may be increasingly interested in monitoring and evaluating their cyber resilience. For charities, the NCSC information being used is consistent across the three waves.
Businesses’ use of different NCSC produced resources appears to vary depending on their size. For example, NCSC weekly threat reports are used by 58% of businesses with 500+ employees, compared to 45% of businesses as a whole, while businesses with 500+ employees are less likely to make use of the Cyber Security Board Toolkit (18%, vs. 34% of businesses as a whole).
Figure 6.2: Use of NCSC guidance (among organisations using NCSC guidance)
Which of the following NCSC information or guidance, if any, have you used?
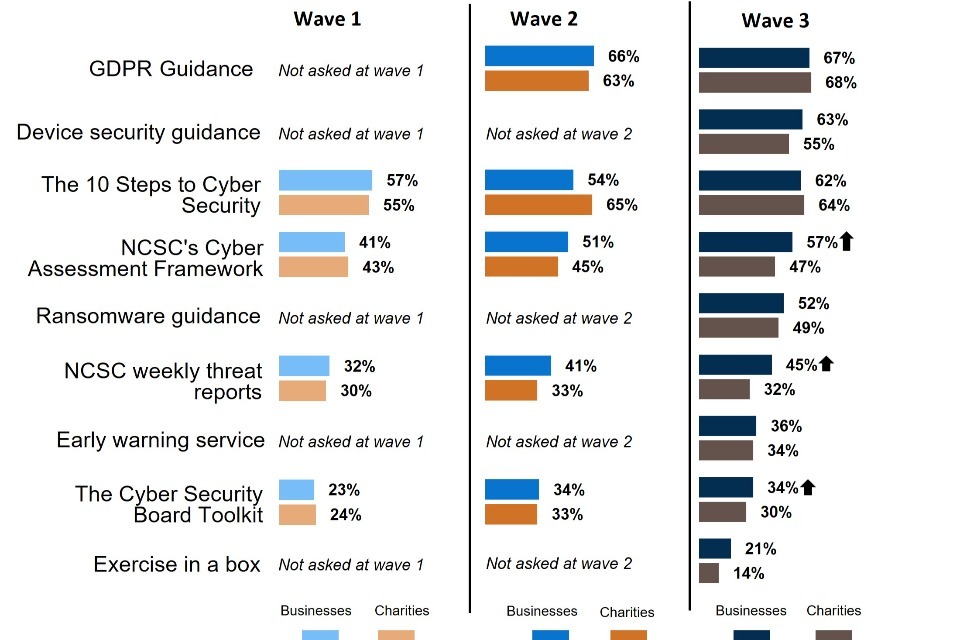
Base: All businesses that have used NCSC guidance at Wave 1 (n=311) and at Wave 2 (n=245), and at Wave 3 (n=172); All charities that have used NCSC guidance at Wave 1 (n=169) and at Wave 2 (n=155), and at Wave 3 (n=132). Significance testing between Wave One and Wave Three is represented with a black arrow, and between Wave Two and Wave Three is represented with a black triangle.
6.2 Other information sources/influencers
Organisations’ approaches to cyber security are shaped by many different influencers, both internal and external. This survey asks organisations how much their actions on cyber security over the past year have been influenced by feedback from each of a range of potential external sources of influence.
External IT/cyber security consultants remain the most likely source of influence on cyber security actions for both types of organisation. Just over half of businesses (53%) say these consultants have had a great deal or a fair amount of influence on their actions on cyber security over the past year, while 60% of charities say the same. For businesses this represents an increase compared to Wave One (53% vs. 47% in Wave One), but no change compared to Wave Two.
Beyond this, insurers influence around one in three businesses (34%) and approaching half of charities (45%). The proportion of charities reporting that their insurers have had a great deal or a fair amount of influence on their cyber security actions has been increasing sharply (from 30% in Wave One). Insurers also remain the second most important influence source for businesses (34% vs. 26% in Wave One).
Insurers’ influence is particularly important where organisations have a specific cyber insurance policy in place: 67% of charities and 58% of businesses that have one of these in place say their insurer influenced their cyber security actions over the last year.
Among very large businesses, around one in three (34%) report their auditors having a great deal or fair amount of influence on cyber security in the last twelve months. Regulators are an important source of influence for around one-quarter (27%) of charities.
Figure 6.3: Influence of external sources on actions
Over the last twelve months, how much have your actions on cyber security been influenced by feedback from any of the following groups?
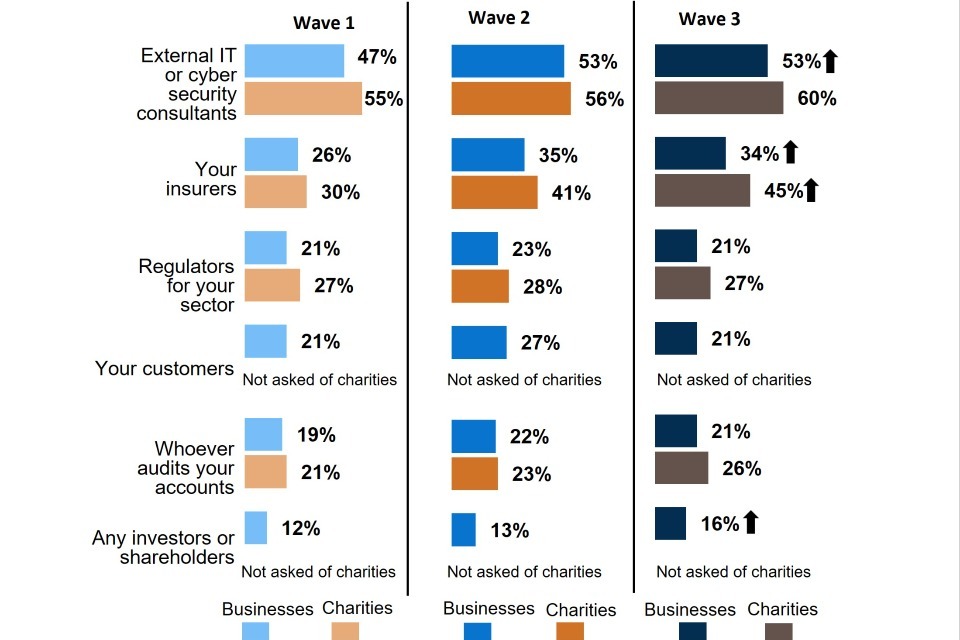
Base: All businesses at Wave 1 (n=1,205) and at Wave 2 (n=688) and at Wave 3 (n=542); All charities at Wave 1 (n=536) and at Wave 2 (n=373), and at Wave 3 (n=310). Significance testing between Wave One and Wave Three is represented with a black arrow, and between Wave Two and Wave Three is represented with a black triangle.
The qualitative research illustrated the degree to which many organisations rely on external IT consultants to shape their approach to cyber security, particularly when they have no dedicated IT expertise to draw on in house. In many cases, relationships with these consultants had been in place for years and were seen as critically important to the way the organisation functioned.
“We would look to our IT contractors [in response to an incident], they’re the first people we’d reach out to. We’d also reach out to marketing and the chief exec in case there was a reputational risk they need to confront and be aware of.”
Charity, England and Wales
“[Our external IT company] are the experts, we follow their advice … they are the ones who recently recommended another firewall and the tests of employees.”
Business, Large, Food and Hospitality, Scotland
The qualitative interviews also illustrated the central importance of insurers as an influencer or driver of action for many of those who hold – or are seeking to obtain - cyber security insurance. Some had been recommended to attain Cyber Essentials accreditation by their insurers; others reported that their insurance company had a range of detailed – and sometimes, they felt, unrealistic - requirements they needed to fulfil before they could obtain specific cyber security insurance. Some also said their insurers were pushing them to include cyber security in their annual reporting.
“[The insurance company] have a list of things they want us to have that they then audit…they won’t give us the insurance without it.”
Business, Medium, Information and Communication, Yorkshire and the Humber
Chapter 7 – Cyber incident management
Where a cyber incident does occur, it is vital that organisations have the correct protocols in place to deal with these changes. This chapter covers the prevalence of written incident management processes within organisations. It goes on to detail what is included in these documents. Compared to previous waves of the survey, the findings of greatest note are:
- The proportion of businesses that have written processes for managing cyber security incidents has increased from Wave One (up from 51% to 59%). The share among charities (56%) has not changed significantly.
- Among businesses with written incident management processes, there has been an increase since Wave One in those including communications and public engagement plans (up from 55% to 66%). Otherwise, there have been no changes in what is included in written processes, among businesses or charities.
- Almost half of businesses (46%) have tested their incident response policies and processes in the last twelve months, an increase from Wave One (37%). The share for charities (34%) is in line with previous waves.
- Around half (49%) of businesses have a ransomware policy in place, which is consistent with Wave Two (47%).
7.1 Processes
A majority of organisations (59% of businesses and 56% of charities) have written processes in place for managing cyber security incidents. These include, for example, an incident response plan. This share of businesses is significantly higher than in Wave One, following a gradual increase between Wave One (51%) and Wave Two (56%). There has been no significant change among charities.
Just over one-third of organisations (35% of businesses and 37% of charities) do not have written processes in place, while the remaining 6% of businesses and 7% of charities do not know one way or the other.
Large businesses (with 250+ employees) are more likely than medium-sized businesses to have written processes for managing cyber security incidents (72% vs. 55%).
There is a much higher than average prevalence of written processes where businesses adhere to one or more certifications (for example, 83% of businesses adhering to ISO 27001), where supplier risk is managed (83%), and where there is a degree of board oversight. Similar findings are evident among charities, providing further evidence that those organisations attaching importance to cyber security are working to cover all aspects in as complete a manner as possible.
Among those businesses with written incident management processes in place (Figure 7.1), almost eight in ten (78%) include guidance for reporting incidents externally, for instance to regulators or insurers. This represents a drop compared to Wave Two (78% in Wave Three compared to 85% in Wave Two), but it does bring prevalence of this practice back in line with Wave One.
Two-thirds of businesses (66%) include legal or regulatory requirements and the same proportion (66%) include communications and public engagement plans. The latter represents an increase from Wave One (55%), while otherwise these proportions are in line with previous waves.
Almost nine in ten charities (87%) with written incident management processes in place include guidance for reporting incidents externally, higher than the corresponding share of businesses (78%). Around seven in ten charities include legal or regulatory requirements (74%) and communications and public engagement plans (70%). These proportions are in line with previous waves.
Figure 7.1: Organisations’ incident management processes
Which of these, if any, is covered in your written incident management processes?
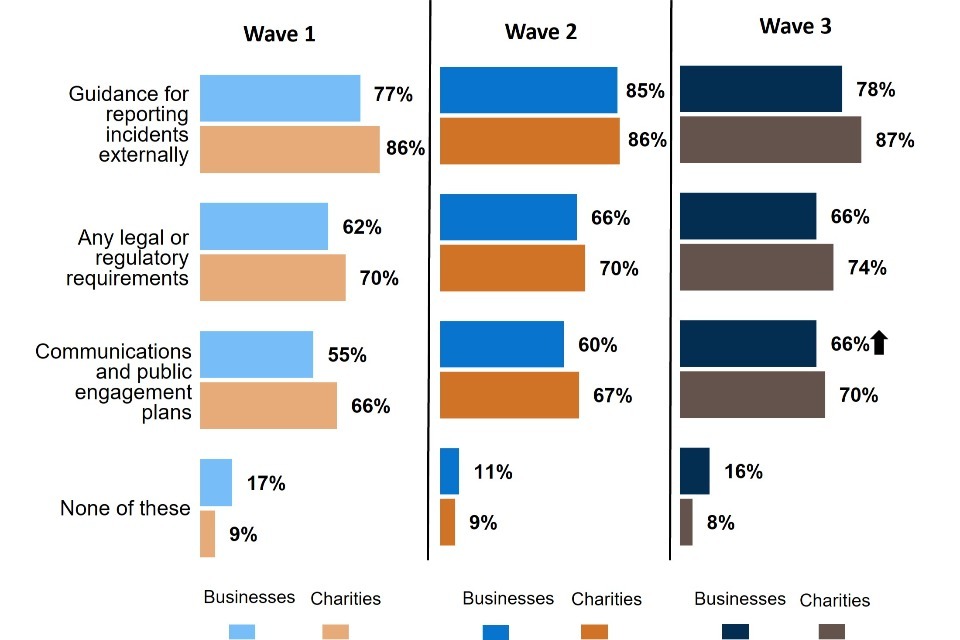
Base: All organisations with incident management processes: Businesses (Wave 1 n=643, Wave 2 n=404, Wave 3 n=341); Charities (Wave 1 n=272, Wave 2 n=206, Wave 3 n=175). Significance testing between Wave One and Wave Three is represented with a black arrow, and between Wave Two and Wave Three is represented with a black triangle.
Large businesses with 250+ employees (74%) are more likely than medium-sized businesses (63%) to include legal or regulatory requirements in their written incident management processes, but otherwise there is little variation by size.
While most organisations have written processes in place for managing cyber security incidents, only a minority of these have tested their incident response policies or processes in the last twelve months. Testing is more likely to have happened among businesses (46%) than charities (34%), and the share of businesses conducting a test of their incident management processes in the last year is significantly higher than in Wave One (37%). The share of charities is in line with previous waves.
A majority of large businesses (with 250+ employees) have tested their incident response policies and procedures within the last twelve months (55%), higher than the proportion of medium-sized businesses (45%).
Some of the organisations in the qualitative research said they had an incident response plan, although this was described in different ways. Some outlined an extensive plan that included testing. For example, one business described a full incident management process including detection, monitoring, triage, incident management, risk assessment, response for removal and forensic analysis.
In some cases, organisations described their incident response plan primarily in terms of data recovery or operational continuity. Others described it as specifying roles and responsibilities for staff in the event of an incident.
“We have an emergency response procedure if anything happens. A responses team, and then roles and responsibilities are dished out depending on the incident”.
Business, Large, Food or hospitality
Several organisations in the qualitative research were in the process of setting up a formal incident response plan, often recognising the importance of doing so in the light of recent incidents. Others had a response plan in place but recognised that it may need updating or revising in order to be effective. For example, where there had been a recent change in organisational structure or ownership, this meant that incident management procedures needed to be updated. In other cases, organisations said that, although they had a response plan, they were concerned about how effective it would be in practice.
“We wrote a proactive policy – ‘if x happens then this is the process’. It’s all very well proactively writing that but, having had a near miss, did that policy get followed? And was the policy right? I don’t think we have it right; we have to revisit it.”
Charity, England and Wales
“My constant fear is that it’s theoretical and [it’s] hard to see if it would work in practice if it went wrong”.
Charity, England and Wales
The qualitative research included organisations that did not have a formal incident response plan. They tended to rely on an informal approach when responding to cyber incidents, which in some cases was seen as appropriate, but in others was acknowledged as being insufficient.
“We have a plan but it’s not that fancy. We’d know who to call. We deal with very few people who have access to our IT systems, so it’s not too big an issue, there’s not a very big attack surface”
Business, Medium, Utilities or production
“No, we don’t know what our first steps in a cyber incident would be. I’d just call my CEO, and I doubt he’d know what to do either. I don’t know if the IT suppliers would do anything.”
Charity, England and Wales
In the absence of a formal incident plan, some organisations relied on their IT consultants or insurers instead.
“I would have to contact the insurance company and follow their procedures. What those procedures are, I would have to be informed by the insurance company … I did read it once when we took insurance out three or four years ago”
Business, Medium, Utilities or production
7.2 Ransomware attack response policy
Around half of businesses (49%) and a slightly lower proportion of charities (45%) have a rule or policy not to make ransomware payments. The proportion of businesses and charities with such a policy is broadly in line with Wave Two (47% of businesses and 39% of charities).
Approximately three in ten organisations (27% of businesses and 34% of charities) do not have a rule or policy on ransomware attacks, while the remainder (24% of businesses and 22% of charities) are unsure if a ransomware policy exists. The proportion of charities unsure if a ransomware policy exists decreased in comparison to Wave Two (22% vs. 33%).
A majority of organisations with all five technical controls in place required to attain Cyber Essentials have a rule or policy in place not to make ransomware payments (53% of businesses, 52% of charities).
Chapter 8 – Prevalence and impact of cyber incidents
This section explores the type and frequency of cyber incidents that organisations have experienced over the last twelve months. It also discusses the impact that these incidents have on organisations.
While cyber incidents have become more common, especially for larger businesses, the impact of these attacks has largely remained consistent across the three waves of the survey. Compared to Wave Two, the findings of greatest note are:
- Around three-quarters of businesses (75%) and eight in ten charities (79%) report experiencing a cyber security incident in the last twelve months. This is consistent with Wave Two (74% of businesses, 81% of charities).
- An increased proportion of charities experienced attempted hacking of their website, social media or user accounts since Wave Two (18%, up from 11%). The 15% of businesses that experienced attempted hacking of their website, social media or user accounts remained consistent with Wave Two.
- Around one-quarter of businesses (23%) and charities (24%) that experienced a cyber security incident in the last year reported it having a negative impact, which is in line with Wave Two (22% and 26% respectively). The vast majority of organisations report incidents having little or no impact on organisations (69% of businesses and 71% of charities saying it took no time at all to return business operations to normal), as in the previous two waves of the survey.
8.1 Experience of cyber incidents
Around three-quarters of businesses (75%) and eight in ten charities (79%) have experienced some form of cyber security incident over the last twelve months. As summarised in Figure 8.1, this includes any type of incident from phishing attacks to devices being infected with ransomware or malware, hacking of bank accounts, websites etc. The shares for businesses and charities are similar to Wave Two (74% and 81% respectively).
Even when phishing attacks are excluded, a majority of organisations still report at least one incident over the last year (55% of businesses and 53% of charities). Both of these shares are similar to previous waves.
Two types of activity dominate organisations’ experience of cyber security incidents: phishing and where people are impersonating the organisation in emails or online. For both businesses and charities, each type of incident has occurred to the same extent as in Wave Two. Seven in ten businesses report experiencing phishing attacks (70%, in line with 69% in Wave Two), as well as three-quarters of charities (74%, in line with 77% in Wave Two). Two in five businesses report experiencing people impersonating their organisation in emails or online (43%, in line with 42% in Wave Two), and a similar proportion of charities (38%, in line with 37% in Wave Two).
In comparison to Wave Two, an increased proportion of charities experienced attempted hacking of their website, social media or user accounts (18%, up from 11%). The proportion of businesses that experienced attempted hacking of their website, social media or user accounts was in line with Wave Two (15% in Wave Three compared to 11% in Wave Two).
Figure 8.1: Types of cyber incident experienced in the last twelve months
Have any of the following happened to your organisation in the last twelve months? (% yes)
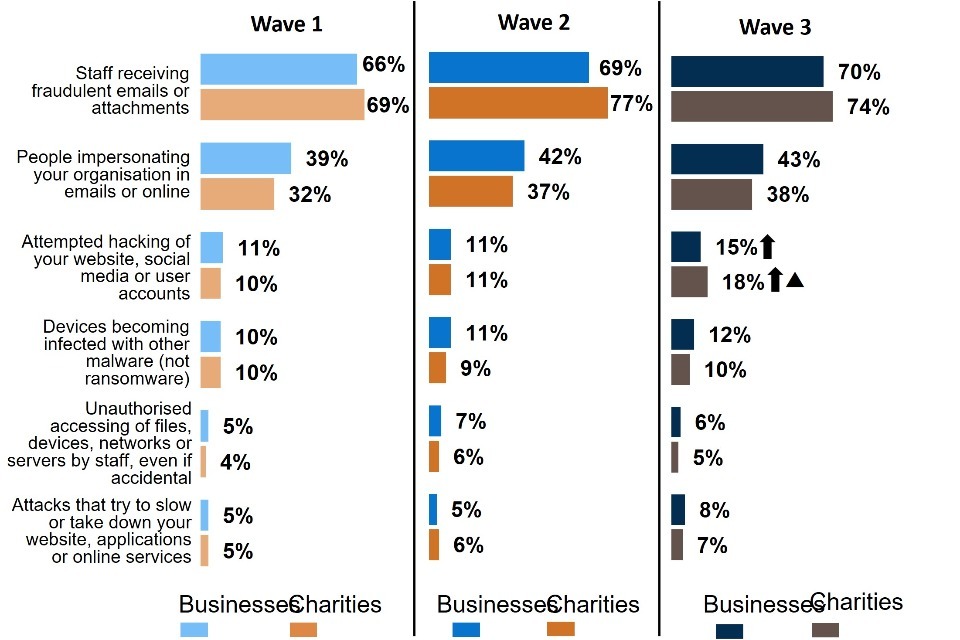
Base: All businesses at Wave 1 (n=1,205), Wave 2 (n=688) and at Wave 3 (n=542); All charities at Wave 1 (n=536), Wave 2 (n=373), and at Wave 3 (n=310). Significance testing between Wave One and Wave Three is represented with a black arrow, and between Wave Two and Wave Three is represented with a black triangle. Only incidents that more than 5% of businesses in Wave Three experienced are shown on this chart.
Possibly reflecting their greater complexity and range of activities, six in ten large businesses (62%) report some form of incident other than phishing, compared to just over half of businesses overall (55%). Half of large businesses (50%) report someone impersonating their organisation in emails or online in the last year, compared to 43% of businesses overall.
Organisations adhering to the Cyber Essentials standard may be more aware of incidents. For example, seven in ten businesses (70%) adhering to the Cyber Essentials standard said that they had experienced an incident other than phishing in the last year compared to 55% of businesses overall. Similarly, around one-quarter (23%) of businesses adhering to the Cyber Essentials standard say they experienced attempted hacking of their website, social media or user accounts, compared to 15% of businesses overall. However, businesses adhering to ISO 27001 or the Cyber Essentials Plus standard are generally in line with the overall proportion of businesses that experienced cyber security incidents in the last twelve months.
Related to this, organisations with boards more actively involved in dealing with cyber security risks and issues are also more likely to be aware of incidents in the last twelve months. For instance, 82% of businesses whose board receives updates on cyber security at least every month report a cyber security incident in the last twelve months compared to 64% of businesses whose board never receive updates on cyber security. This may indicate that organisations whose boards are more engaged in cyber security are more likely to monitor their systems and detect breaches, and to escalate incident reports.
Cyber security incidents tend not to be one-off events. More than eight in ten organisations (84% of businesses and 85% of charities) that experienced a cyber security incident in the last year say such incidents occurred more than once. A majority (54%) of businesses experiencing any form of incident say it happens at least once a month, while for around one-quarter (27%) it is a weekly occurrence. Large businesses, however, are not significantly more likely than medium-sized businesses to experience frequent cyber security incidents.
Charities that report having experienced a cyber security incident in the last year appear to experience incidents as frequently as businesses. Similar to businesses, a majority (55%) of charities that experienced a cyber security incident in the last year say it happens at least once a month, and almost three in ten (28%) say it is a weekly occurrence. This is in contrast to the findings from Wave Two, when charities that reported a cyber security incident in the last year appeared to experience them less frequently than businesses.
The frequency of cyber security incidents reported in Wave Three is consistent with Wave Two, i.e., incidents are occurring with the same degree of frequency as they were in Wave Two and in the baseline survey.
Figure 8.2: Frequency of cyber security incidents
Approximately, how often in the last twelve months did you experience any of the cyber security incidents you mentioned?
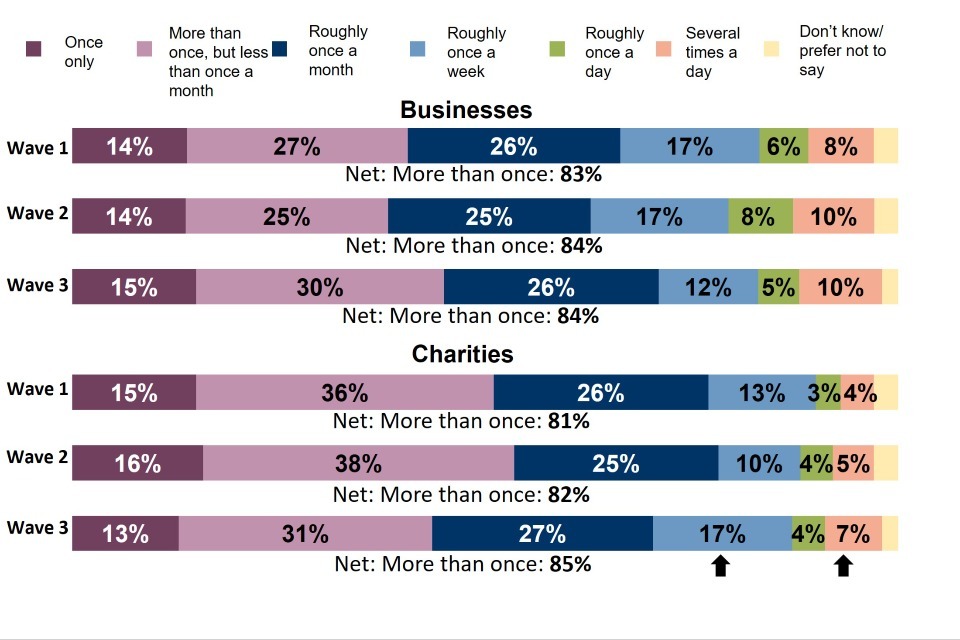
Base: All organisations that have experienced any cyber security incidents in the last twelve months; Businesses (Wave 1 n=883; Wave 2 n=533, wave 3 n=422); Charities (Wave 1 n=394; Wave 2 n=303, Wave 3 n=245). Significance testing between Wave One and Wave Three is represented with a black arrow, and between Wave Two and Wave Three is represented with a black triangle.
8.2 How are businesses affected?
While most organisations do not suffer any serious consequences as a result of cyber security incidents, around one-quarter have been negatively impacted (23% of businesses and 24% of charities that experienced an incident in the last year). These shares are in line with Wave Two and, as illustrated in Figure 8.3, the most common outcomes, i.e., mentioned by more than 5% of organisations, are:
- temporary loss of access to files or network (8% of businesses and 7% of charities)
- organisation’s website, applications or online services were taken down or made slower (7% of businesses and 9% of charities)
- compromised accounts or systems used for illicit purposes (6% of businesses and 7% of charities)
The occurrence of all individual outcomes shown in Figure 8.3 are in line with Wave Two overall.
Figure 8.3: Outcome of cyber incident on organisation
Thinking of all the cyber security incidents experienced in the last twelve months, which, if any, of the following happened as a result? (Top mentions only shown)
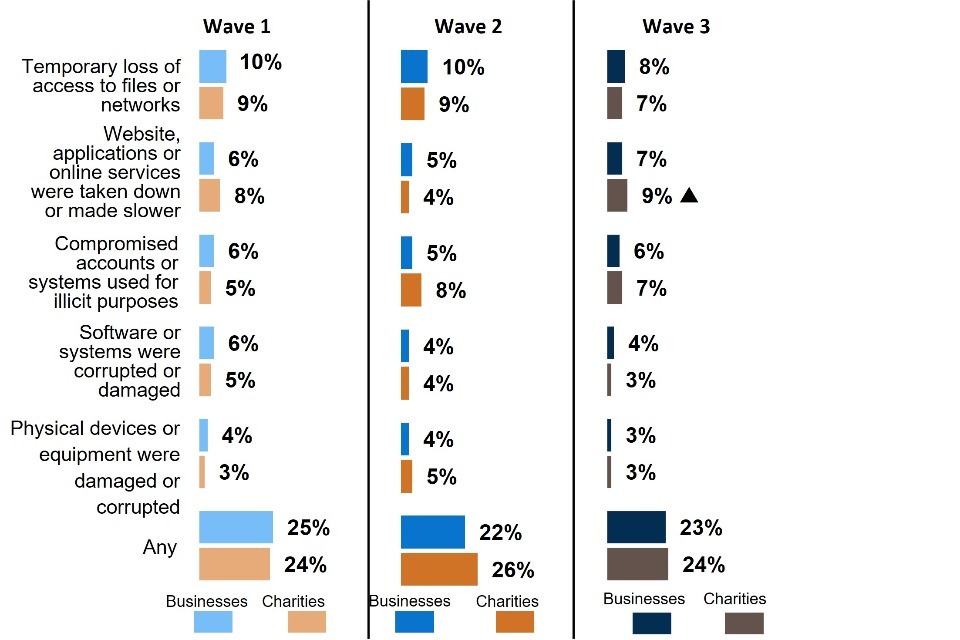
Base: All organisations that have experienced any cyber security incidents over the last twelve months; Businesses (Wave 1 n=883, Wave 2 n = 533, Wave 3 n=422); Charities (Wave 1 n=394, Wave 2 n=303, Wave 3 n=245). Significance testing between Wave One and Wave Three is represented with a black arrow, and between Wave Two and Wave Three is represented with a black triangle.
Although rare, 3% of businesses and 2% of charities that experienced a cyber security incident in the last twelve months say money was stolen. This is in line with Wave Two (3% and 4% respectively) and with Wave One (2% and 4% respectively).
Very large businesses with 500+ employees are more likely to suffer certain outcomes of a cyber security incident than medium-sized businesses. For example, they are more likely to experience software or systems getting corrupted or damaged (11% vs. 3%), to have their website, applications or online services taken down or made slower (13% vs. 7%), to have lost access to third-party services they rely on (11% vs. 3%), and to have physical devices or equipment damaged or corrupted (10% vs. 2%).
Even incidents that do not result in negative financial consequences or data loss can have an impact on organisations. Therefore, organisations that experienced a cyber security incident in the last twelve months were also asked about the wider impact of incidents on their organisation.
Figure 8.4 shows the most common organisational impacts of cyber incidents. It illustrates that more than half (54% of businesses and 55% of charities experiencing such incidents) were impacted in at least one of the ways listed. Four in ten businesses (40%), and a similar proportion of charities (37%), say that new measures were needed to prevent or protect against future incidents. Similar proportions (34% and 39% respectively) report that additional staff time was required to deal with such incidents. These findings are in line with Wave Two.
The wider organisational impacts of cyber security incidents, for both businesses and charities, are almost identical to the baseline survey findings.
Very large businesses with 500+ employees are more likely than medium-sized businesses to report that cyber security incidents have led to them receiving more complaints from customers, beneficiaries or stakeholders (15% vs. 6%).
Figure 8.4: Impact of incident on organisation
Have any of these incidents impacted your organisation in any of the following ways? (Only mentions with 5% or higher in Wave Three are shown)
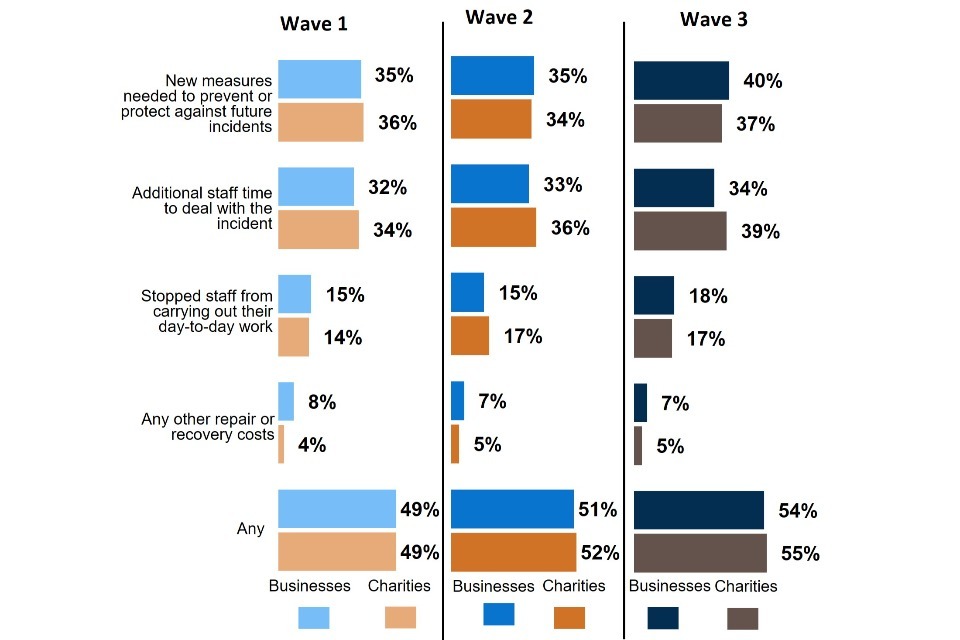
Base: All organisations that have experienced any cyber security incidents over the last twelve months; Businesses (Wave 1 n=883, Wave 2 n = 533, Wave 3 n=422); Charities (Wave 1 n=394, Wave 2 n=303, Wave 3 n=245). There are no significant changes between Wave One and Wave Three or between Wave Two and Wave Three.
8.3 Time taken to restore business operations after cyber incident
The vast majority of incidents have a short-term impact on operations. Nine in ten organisations (91% of businesses and 90% of charities) that have experienced an incident in the last year took less than a day to restore business operations back to normal. Around seven in ten went further, reporting that it took “no time at all” (69% of businesses and 71% of charities). These findings are in line with Wave Two.
This may be in part driven by the high prevalence of phishing attacks among the incidents reported by organisations. Charities that reported non-phishing cyber security incidents are less likely to report that it took “no time at all” (63%, compared to 71% of charities when phishing incidents are included). For businesses, the equivalent shares are 61% (excluding phishing) and 69% (including phishing).
Around one in ten organisations (9% of businesses and 10% of charities) say it took a day or longer to get operations back to normal following a cyber security incident in the last twelve months. Some 3% of businesses and 2% of charities say they were affected for a week or longer.
These findings resonate with the qualitative research, in which participants were keen to emphasise the measures that prevent incidents from happening in the first place and the importance of having procedures in place to ensure that any potential incidents can be resolved quickly and therefore cause minimal disruption to the business.
“We’ve never had a major incident. When we do have some sort of minor incident, like impersonation or spam emails coming through, we review what caused it and work out how to mitigate it happening again and minimise the amount of time it takes to identify and resolve all issues.”
Business, Insurance, Medium
“We have incident policies and nominated data protection teams and we have entire chains of command in place, all to ensure that any potential incident gets negated at the source. We have the policies in place, we have the people in place, and we have the resilient back-ups in place.”
Charity, England and Wales
“We’ve got back-up in the cloud and some physical back-ups on site, some off grid servers - we have all these measures in place so that if we did have a potential attack like ransomware, we could return to business as usual as quickly as possible with as little disruption as possible.”
Charity, England and Wales
8.4 Financial cost of incidents
Following the approach taken by the Cyber Security Breaches Survey (CSBS), this survey has attempted to capture both the overall cost of cyber security incidents faced in the last twelve months, and asked four separate, more granular questions breaking down different aspects of the cost of the single most disruptive incident that organisations recall facing in this period. Costs covered include short-term and long-term direct costs, staff time costs and other indirect costs.
Direct comparisons between the two data sources should be avoided for the following key reasons:
- Respondents are not forced to give consistent answers in the survey script due to the complexities around doing that.
- Respondents may not consider all four granular cost elements when answering the overall cost question in the survey (or consider there to be some overlaps).
- The costs of the one most disruptive incident was collected in four constituent questions, and the overall financial cost of all incidents was collected in one subsequent separate question.
Overall cost of incidents
Table 8.1 below shows the estimated costs organisations incurred from all the identified incidents over the last twelve months. When asked about cost, organisations are asked to bear in mind all the potential costs of incidents in total.
Table 8.1: Average cost of all incidents identified in last year[footnote 14]
| All businesses | Medium businesses | Large businesses | All charities | |
| Across organisations identifying any incidents | ||||
| Mean cost | £2,718 | £2,192 | £4,993 | £2,583 |
| Median cost | £100 | £100 | £206 | £150 |
| Base | 389 | 212 | 166 | 232 |
| Only across organisations identifying incidents with an outcome | ||||
| Mean cost | £7,187 | £5 | £12,273 | £6,932 |
| Median cost | £1,500 | £1,500 | £1,000 | £1,000 |
| Base | 95 | 48 | 46 | 54 |
Costs associated with the most disruptive incidents
Tables 8.2 to 8.5 show cost estimates for the single most disruptive incident that organisations have identified in the last twelve months. Again, these are presented for all incidents, as well as those with an actual outcome, such as a loss of assets or data.
In the survey, we define short-term direct costs as being any external payments that were made when dealing with the incident. This includes examples offered to respondents of:
- any payments to external IT consultants or contractors to investigate or fix the problem
- any payments to the attackers, or money they stole
Table 8.2: Average short-term direct cost of most disruptive incident in last year
| All businesses | Medium businesses | Large businesses | All charities | |
| Across organisations identifying any incidents | ||||
| Mean cost | £722 | £262 | £2,661 | £94 |
| Median cost | £0 | £0 | £0 | £0 |
| Base | 397 | 212 | 173 | 232 |
| Only across organisations identifying incidents with an outcome | ||||
| Mean cost | £2,928 | £1,043 | £8,544 | £292 |
| Median cost | £0 | £0 | £0 | £0 |
| Base | 97 | 47 | 49 | 55 |
We defined long-term direct costs as external payments in the aftermath of the incident. The examples included in the survey were:
- any payments to external IT consultants or contractors to run cyber security audits, risk assessments or training
- the cost of new or upgraded software or systems
- recruitment costs if you had to hire someone new any legal fees, insurance excess, fines, compensation, or PR costs related to the incident
Table 8.3: Average long-term direct cost of most disruptive incident in last year
| All businesses | Medium businesses | Large businesses | All charities | |
| Across organisations identifying any incidents | ||||
| Mean cost | £465 | £437 | £480 | £403 |
| Median cost | £0 | £0 | £0 | £0 |
| Base | 390 | 213 | 166 | 232 |
| Only across organisations identifying incidents with an outcome | ||||
| Mean cost | £1,650 | £1,519 | £1,362 | £1,534 |
| Median cost | £0 | £0 | £0 | £0 |
| Base | 97 | 49 | 47 | 56 |
We also asked about the costs of any staff time (i.e., indirect costs of the incident). This includes, for instance, how much staff would have got paid for the time they spent investigating or fixing problems caused by the incident. We explicitly asked respondents to include the cost of this time regardless of whether this duty was part of the staff member’s job function or not.
Table 8.4: Average staff time cost of the most disruptive incident in last year
| All businesses | Medium businesses | Large businesses | All charities | |
| Across organisations identifying any incidents | ||||
| Mean cost | £850 | £753 | £1,380 | £339 |
| Median cost | £40 | £31 | £50 | £31 |
| Base | 384 | 209 | 163 | 228 |
| Only across organisations identifying incidents with an outcome | ||||
| Mean cost | £2,412 | £2,451 | £2,328 | £935 |
| Median cost | £250 | £280 | £200 | £200 |
| Base | 96 | 50 | 45 | 53 |
Finally, we asked about other indirect costs related to incidents, including the following areas (offered as examples to respondents):
- the cost of any time when staff could not do their jobs
- the value of lost files or intellectual property
- the cost of any devices or equipment that needed replacing
Table 8.5: Average indirect cost of the most disruptive incident in last year
| All businesses | Medium businesses | Large businesses | All charities | |
| Across organisations identifying any incidents | ||||
| Mean cost | £1,840 | £1,158 | £4,911 | £843 |
| Median cost | £50 | £50 | £85 | £59 |
| Base | 398 | 214 | 173 | 234 |
| Only across organisations identifying incidents with an outcome | ||||
| Mean cost | £5,991 | £3,650 | £13,532 | £2,598 |
| Median cost | £500 | £500 | £500 | £525 |
| Base | 99 | 49 | 50 | 56 |
Overall, the median cost is typically either very low or £0 (nil) across businesses and charities – a similar trend seen in previous waves of this study along with earlier waves of the Cyber Security Breaches Survey. Generally speaking, most incidents do not have any material impact on organisations, for example loss of assets or data. As a result, it is rarely the case that organisations need to respond to these breaches.
By contrast, consistently across all costs, where there is a negative outcome, costs are substantially higher. This is especially notable for larger organisations. Given this, organisations that underestimate the potential harm of a breach are running a substantial risk.
Some of the other key findings are as follows:
- The median cost of all incidents within the last twelve months is broadly comparable to previous waves of the survey. For charities this has increased slightly between Wave Two and Wave Three.
- As with previous waves of the survey, charity costs tend to be lower than for businesses. In particular, large businesses report having the highest costs from cyber security incidents, with medium-sized businesses tending to be closer to charities in this regard. This is a similar trend to Wave One and Wave Two. It should be noted that this does not mean charities are at lower risk than businesses – charities may have a less detailed understanding of costs and this could impact on what they are reporting in this survey.
- For businesses, short-term direct costs tend to be higher than long-term direct costs. In contrast, short-term costs for charities are lower than long- term costs.
- Long-term direct costs show less variation between types of organisations than short-term costs. This may reflect the nature of the long-term changes that organisations need to make in response to an incident. It is likely that this response will be consistent for different types of organisations, whereas short-term direct costs are more likely to vary depending on the nature of the organisation.
Chapter 9 – Longitudinal analysis
This chapter focuses solely on the longitudinal component of the sample, including a segmentation of organisations based on change in their cyber security protection practices (building on the cross-sectional findings in Chapters 3 and 4). In addition, longitudinal analysis of these organisations’ adherence to cyber security certifications and standards and board representation over time (building on the cross-sectional findings covered in Chapters 4 and 5 respectively) is included.
The findings of greatest note are:
- Patterns of cyber security resilience vary across organisations with some organisations using many practices, but others few. Furthermore, some organisations rely more on governance procedures and others on technical practices.
- Pathways of cyber resilience are not one way. Some organisations take a step back and lower their levels of resilience, others take a step forward by improving their cyber security levels, and many remain at stable levels.
- There is some evidence supporting the hypothesis that a cyber incident experience acts as a trigger for improving resilience. However, this is not true for all organisations, as some experience an incident and show no change in their resilience or become less resilient.
- Adherence to cyber security certifications or standards is quite low. Adoption of adherence to certifications or standards is most prevalent amongst those with stronger patterns of resilience than those with less resilient protection. Similarly, losing adherence to certifications or standards was less likely among more resilient organisations.
- Businesses are more likely than charities to retain their adherence to certifications or standards, but no more likely to take up certifications.
- Experience of a cyber security incident appears to trigger either a take-up of adherence to certifications or standards or retention of these, albeit among a minority of organisations.
- Board activities supporting cyber resilience exist, but substantial numbers of organisations do not appear to have much, if any, board engagement across these activities.
- Board engagement involves both negative and positive steps but generally the trend is towards more engagement over time (at their follow-up interview in the next survey wave). Improvement is more apparent for organisations with lower patterns of cyber resilience.
- The experience of cyber security incidents appears to have a complex relationship with future resilience. Among a minority, it potentially triggers adoption of board activities and/or a lower rate of negative change in board engagement. However, for other organisations it does not. More needs to be known about the context of, and other factors influencing, protective behaviours alongside experience of cyber incidents.
9.1 Background
Three waves of survey interviews have now been conducted, in 2021, 2022 and 2023, with each wave accompanied by a report of cross-sectional findings. The second wave of the CSLS comprised interviews both with those who agreed to a further interview from the Wave One survey and an additional top-up of organisations providing their first interview in Wave Two. The third wave continues this pattern of following up Wave Two organisations and adding a new cohort of fresh organisations.
Table 9.1: Profile of respondents by wave
| Sample type | Wave 1 | Wave 2 | Wave 3 |
| Cross-sectional | 1741 | 1061 | 852 |
| Wave on Wave | N/A | 674 | 451 |
| All three waves | N/A | N/A | 316 |
This chapter focuses on the longitudinal component of the sample. One potential value of longitudinal data is the opportunity to explore possible causality, i.e., to assess the extent to which an event at an earlier time point may cause a change in status at a later time point. For the current survey, that event is a cyber security incident and the outcomes we are interested in are improved cyber security practices. However, it is important to remember that whilst we can determine the sequence of events from the longitudinal data, the interpretation of causality between them is still inferred, i.e., ‘correlation does not necessarily imply causality’. Nevertheless, if no association is found between an earlier experience of a cyber incident and a change in future behaviour, then it is unlikely that the cyber incident has caused any change in behaviour.
Another value of longitudinal data is the chance to explore the degree of volatility and stability in behaviour, i.e., assessing how many have changed their status over time based on those organisations that have provided responses to consecutive waves of the survey. One aim is to explore how individual organisations experience change and to examine how this individual level change contributes to the wave-on-wave change discussed in the cross-sectional chapters.
Whilst longitudinal data offer the opportunity to establish intricate patterns of individual level change over time, the actual depth of detail it is possible to explore is typically limited by sample size constraints. Attrition, i.e. organisations dropping out of the survey, has a cumulative effect in decreasing the available sample size for detailed investigation. For example, the 316 cases remaining in the sample of the original 1,741 organisations means that detailed breakdowns (e.g., between businesses and charities) cannot be made with any great precision because the sample sizes are too small to produce robust, if any, results. Consequently, we focus here on all organisations and wave-on-wave change. We combine the 674 cases responding to both Waves One and Two with the 451 cases responding to both Waves Two and Three and pool these into a single dataset. This gives 1,125 wave-on-wave transitions to observe. A drawback of this approach is that those cases appearing in all three waves are double counted. Unlike the cross-sectional analysis, the results of the longitudinal analysis are not weighted to be representative of the population. However, the benefit of this approach is that it provides a more detailed insight into the stability of transitions than is possible when treating each pair of waves (and business and charity data) separately. For the remainder of this chapter, the earlier wave of the pooled dataset is known as the ‘pre-wave’ and the later wave is known as the ‘post-wave’.
Effectiveness of cyber protection
Effective cyber protection requires many different layers of policies and behavioural and technical procedures and processes. The extent to which each of these features is required will depend partly upon the level of vulnerability an organisation has to specific attack vectors. For example, organisations with public facing websites will need more protection than those organisations whose access to the public is primarily through email servers. Nevertheless, all organisations would benefit from building their cyber resilience, which is defined by the National Cyber Security Centre (NCSC) as:
“…the ability of an organisation to protect itself from, respond to, and recover from a cyber-attack, data breach or service outage.”
Measuring cyber resilience is challenging because of the array of different features of resilience that an organisation may adopt. CSLS provides a wealth of information on cyber security activities, along with experiences of incidents, impacts on the organisations and the wider outcomes of those incidents. Chapter 9.2 reports on the results of a segmentation statistical technique to group together those organisations with similar patterns of adopting a range of protective behaviours to understand their broader pattern of resilience across these activities. We next consider the path of organisations’ cyber security development over time to attempt to identify the extent to which organisations remain at the same level, improve or degrade their status. We also consider the effect of pre-wave cyber incidents on post-wave cyber security status. Chapter 9.3 focuses on adherence to certifications and standards and Chapter 9.4 addresses questions considering different aspects of engagement with organisations’ boards. The focus is again on the extent of change in general as well as potentially differential patterns of change contingent upon the patterns of cyber resilience described in Chapter 9.2. The relationship between change in Board engagement and experience of cyber incidents is also explored.
9.2 Segmentation – Patterns of cyber resilience
Resilient cyber protection requires a range of activities both to help prevent potential attacks and to ensure responses are in place to deal with any breaches that do occur. Broadly, these activities are grouped here into 1) policy and procedural and 2) technical activities. A strong level of preparedness for cyber security will require implementing a range of interlocking policies, procedures and technical responses including buy-in at the board level.
Awareness of the risks of cyber threats and breaches may vary across organisations and undertaking the full range of activities can be resource intensive, making it unlikely all organisations will undertake all protection activities. Consequently, understanding what combinations of activities are used by organisations is important in illuminating the different levels of preparedness that exist.
A segmentation technique was used to group together organisations that used similar patterns of protective behaviours, policies and procedures. It identified five distinct groups of organisations based on a combination of the number of protective practices and the type of practices:
- High level of preparation: protection was well above the average level on all activities.
- Mostly prepared: mostly above average protection on all items but to a lesser extent than those in the ‘High level’ group.
- Governance led: protection was around or above average for policies or procedures but low on technical responses.
- Technical led: tended to have had recent improvements in network security, malware defence, authentication and secure backup but lower than average governance.
- Low level of preparation: protection was low across all activities, except secure cloud backup.
These groups were formed from responses to the following questions[footnote 15]:
- Activities undertaken in the last 12 months to identify cyber security risks
- Board involvement in cyber security
- Risk governance and cyber security
- Rules for storing, moving and accessing data
- Improvements made in technical security over the last 12 months
- Assessment or management of supplier risk in the last 12 months
Cross-sectional change in cyber protection practices
The segmentation model produced using the Wave One data was used to predict segmentation groups for both Waves Two and Three and, as is shown below (Table 9.2). The table shows the percentage of organisations in each segment group undertaking each activity, i.e., it is based on cross-sectional responses. In general, it shows a complex picture of relative stability but with some degree of volatility.
There were 22 individual cyber protection practices included in the segmentation model and the average number of items organisations responded positively to remained stable across the three waves. Those with low levels of cyber preparation tended to average 4 responses out of the 22 items. For the Technical group, the average was 9 items, rising to 11 for the Governance group. For those organisations falling into the Mostly prepared group, they average around 14.5 practices compared to 19 among those in the High preparation group.
Low-prepared organisations
For those with low levels of preparation, backing up data remained the most prevalent activity across the three years, with organisations more likely to use a cloud service (between 60% and 70%) than other means (54% at each wave), though it seems some organisations used both approaches. There was an indication of growth in board oversight, with a designated responsible Board member taking responsibility for cyber security risks rising from 20% at Wave One to 26% at Wave Three. Similarly, the proportion of organisations with a designated Board member with responsibility of reporting on cyber security rose from 22% at Wave One to 27% at Wave Three. The use of software to monitor intrusion detection rose from 22% at Wave One to 33% at Wave Three and a risk assessment of cyber security risks rose from 16% to 22% between Waves One and Three. Conversely, there was a decrease in monitoring of user activity, dropping from 31% to 16% between Waves One and Three. Other activities tended to fluctuate or remain stable.
Governance-led organisations
Among the Governance group, as expected, governance activities remained at high levels across the three waves, with only documentation outlining the level of acceptable cyber risk at relatively low levels (around 33%). However, only those organisations with High levels of preparation exceeded the Governance group on this activity. There seems to have been a shift towards cloud backups of data, from 77% to 85% between Waves One and Three and a corresponding reduction in backups by other means, dropping from 66% at Wave One to 52% at Wave Three. Other activities that seem to have increased are a cyber security vulnerability audit, cyber security risk assessment, processes for managing cyber security incidents, malware defences and processes for user authentication and access control. Only network security showed evidence of sustained decline, dropping from 22% in Wave One to 17% in Wave Three. Again, involvement in other activities fluctuated or remained stable.
Technical-led organisations
As with their Governance counterparts, Technical-led organisations moved towards cloud-based backups at the expense of backups via other means, an increase of seven percentage points and a drop of six percentage points, respectively. The proportion making investments in threat intelligence doubled, from 14% in Wave One to 28% in Wave Three. The use of security monitoring tools such as intrusion detection systems increased from 50% to 60% between Waves One and Three. Improvements in network security increased from 79% at Wave One to 88% at Wave Three. There was also some evidence for increasing board governance with 32% reporting a designated staff member reporting on cyber security at Wave One to 37% at Wave Three. The prevalence of a risk register covering cyber security increased from 16% at Wave One to 25% at Wave Three. However, there was a decline in monitoring of user activity, reducing from 48% at Wave One to 38% at Wave Three.
Mostly prepared organisations
Organisations that were mostly prepared tended to have relatively high levels of protection, averaging 14.5 from the 22 practices considered for the model and patterns of response across the waves tended towards a pattern of general consistency. Activities that were undertaken by few of the Mostly prepared organisations were investing in threat intelligence, showing a slight decrease from 39% at Wave One to 35% at Wave Three. Documentation of acceptable levels of cyber risk was also low with 26% reporting undertaking the activity at Wave One down slightly to 23% at Wave Three. Formal assessment of suppliers’ cyber security risks in the last twelve months also fell slightly from 19% at Wave One to 17% at both Waves Two and Three. There was a decline in monitoring of user activity with 75% at Wave One and 61% at Wave Three. In contrast, it appears that having a written list of the organisation’s cyber estate improved from 65% at Wave One to 70% at Wave Three. There was also a slight increase in backing up to the cloud, from 78% at Wave One to 83% at Wave Three.
Highly prepared organisations
These organisations averaged 19 of the 22 protective activities. Consequently, they tended to have high and stable levels of protection across all activities. There is evidence that backing up via the cloud increased from 84% at Wave One to 90% at Wave Three, with a decrease in backing up by other means from 81% at Wave One to 71% at Wave Three. There was also a slight drop in reporting a cyber security vulnerability audit from 95% at Wave One to 91% at Wave Three. Similarly, actions involving processes for software updates and security patches declined slightly from 84% at Wave One to 79% at Wave Three. In contrast, there was a slight rise in improving malware defences, rising from 84% at Wave One to 88% at Wave Three.
Table 9.2: Cross-sectional segmentation
Which of the following, if any, have you done over the last 12 months to identify cyber security risks to your organisation?
| Low W1 | Low W2 | Low W3 | Gov W1 | Gov W2 | Gov W3 | Tech W1 | Tech W2 | Tech W3 | Mostly W1 | Mostly W2 | Mostly W3 | High W1 | High W2 | High W3 | |
| A cyber security vulnerability audit | 4% | 8% 3% | 51% | 58% | 57% | 25% | 30% | 26% | 56% | 64% | 60% | 95% | 91% | 91% | |
| A risk assessment covering cyber security risks | 16% | 17% | 22% | 81% | 84% | 90% | 41% | 39% | 37% | 81% | 84% | 88% | 99% | 98% | 96% |
| Invested in threat intelligence | 7% | 5% | 9% | 29% | 26% | 29% | 14% | 16% | 28% | 39% | 38% | 35% | 72% | 72% | 73% |
| Used specific tools designed for security monitoring, such as Intrusion Detection Systems | 22% | 25% | 33% | 64% | 63% | 65% | 50% | 58% | 60% | 72% | 75% | 71% | 90% | 94% | 92% |
Which of the following rules or controls, if any, do you have in place?
| Low W1 | Low W2 | Low W3 | Gov W1 | Gov W2 | Gov W3 | Tech W1 | Tech W2 | Tech W3 | Mostly W1 | Mostly W2 | Mostly W3 | High W1 | High W2 | High W3 | |
| A policy to apply software security updates within 14 days | 29% | 36% | 32% | 70% | 68% | 72% | 52% | 49% | 52% | 67% | 72% | 67% | 89% | 88% | 92% |
| Any monitoring of user activity | 31% | 28% | 16% | 68% | 69% | 62% | 48% | 47% | 38% | 75% | 73% | 61% | 93% | 93% | 88% |
| Backing up data securely via a cloud service | 60% | 70% | 63% | 77% | 81% | 85% | 71% | 71% | 78% | 78% | 83% | 83% | 84% | 90% | 90% |
| Backing up data securely via other means | 54% | 54% | 54% | 66% | 65% | 52% | 73% | 67% | 67% | 68% | 67% | 67% | 81% | 77% | 71% |
Does your organisation have any of the following documentation in place to help manage cyber security risks?
| Low W1 | Low W2 | Low W3 | Gov W1 | Gov W2 | Gov W3 | Tech W1 | Tech W2 | Tech W3 | Mostly W1 | Mostly W2 | Mostly W3 | High W1 | High W2 | High W3 | |
| A Business Continuity Plan that covers cyber security | 28% | 36% | 30% | 80% | 86% | 85% | 39% | 42% | 44% | 85% | 85% | 86% | 98% | 95% | 95% |
| A risk register that covers cyber security | 13% | 14% | 9% | 72% | 78% | 78% | 16% | 20% | 25% | 64% | 64% | 64% | 97% | 95% | 98% |
| Any documentation that outlines how much cyber risk your organisation is willing to accept | 2% | 1% | 5% | 33% | 34% | 33% | 2% | 6% | 5% | 26% | 20% | 23% | 71% | 71 | 71% |
| Any documentation that identifies the most critical assets that your organisation wants to protect | 9% | 12% | 14% | 68% | 65% | 63% | 25% | 31% | 27% | 70% | 71% | 71% | 93% | 93% | 89% |
| A written list of your organisation’s IT estate and vulnerabilities | 11% | 13% | 11% | 70% | 68% | 70% | 19% | 22% | 26% | 65% | 65% | 70% | 95% | 92% | 94% |
In this time, has your organisation taken any steps to expand or improve any of the following aspects of your cyber security?
| Low W1 | Low W2 | Low W3 | Gov W1 | Gov W2 | Gov W3 | Tech W1 | Tech W2 | Tech W3 | Mostly W1 | Mostly W2 | Mostly W3 | High W1 | High W2 | High W3 | |
| Your processes for updating and patching systems and software | 4% | 10% | 2% | 9% | 18% | 13% | 52% | 45% | 45% | 73% | 66% | 72% | 84% | 83% | 79% |
| Your processes for managing cyber security incidents | 1% | 3% | 3% | 11% | 17% | 18% | 27% | 25% | 29% | 65% | 67% | 64% | 90% | 90% | 91% |
| Your malware defences | 8% | 15% | 10% | 14% | 23% | 22% | 69% | 63% | 76% | 82% | 82% | 84% | 84% | 86% | 88% |
| Your processes for user authentication and access control | 14% | 16% | 19% | 24% | 39% | 33% | 69% | 67% | 72% | 85% | 85% | 82% | 92% | 93% | 95% |
| The way you monitor systems or network traffic | 1% | 3% | 3% | 12% | 16% | 12% | 37% | 36% | 33% | 68% | 70% | 63% | 89% | 85% | 88% |
| Your network security | 6% | 2% | 3% | 22% | 15% | 17% | 79% | 91% | 88% | 95% | 98% | 97% | 95% | 93% | 96% |
Other statements included in the segmentation
| Low W1 | Low W2 | Low W3 | Gov W1 | Gov W2 | Gov W3 | Tech W1 | Tech W2 | Tech W3 | Mostly W1 | Mostly W2 | Mostly W3 | High W1 | High W2 | High W3 | |
| In the last 12 months, has your organisation carried out any work to formally assess or manage the potential cyber security risks presented by any of these suppliers? | 0% | 1% | 3% | 24% | 24% | 22% | 9% | 9% | 11% | 19% | 17% | 17% | 70% | 73% | 71% |
| One or more board members whose roles include oversight of cyber security risks | 20% | 21% | 26% | 48% | 53% | 54% | 25% | 35% | 27% | 53% | 48% | 55% | 80% | 76% | 76% |
| A designated staff member responsible for cyber security, who reports directly to the board | 22% | 21% | 27% | 64% | 64% | 69% | 32% | 42% | 37% | 69% | 67% | 70% | 85% | 86% | 88% |
| Average number of activities | 4 | 4 | 4 | 11 | 11 | 11 | 9 | 9 | 9 | 15 | 15 | 15 | 19 | 19 | 19 |
| Base N | 270 | 146 | 100 | 330 | 196 | 143 | 263 | 163 | 126 | 523 | 287 | 266 | 355 | 269 | 217 |
Stability of cyber resilience
The pathways to cyber security resilience are complex, involving both positive and negative change. Only around two-thirds (65%) of Highly prepared organisations remained at a High level of preparation between the two consecutive pairs of waves (Table 9.3). Around one in five (21%) moved into the Mostly prepared group, suggesting they were undertaking an average of around four fewer activities than previously. There may be various reasons for this decrease in activity. It may reflect resource constraints or a lag in technical updates that extend beyond twelve months or a change in policy. For example, in the qualitative research, one business reported less resilience due to the acquisition of another (less well prepared) business in the last year. Further research is required to assess why organisations, especially Highly prepared organisations, slip in their levels of cyber security resilience.
Table 9.3: Wave on wave transitions in segment group
| Post-Wave Low | Post-Wave Governance | Post-Wave Technical | Post-Wave Mostly | Post-Wave High | Base | |
| Pre-wave Low | 51% | 18% | 16% | 13% | 2% | 146 |
| Pre-wave Governance | 10% | 34% | 15% | 27% | 13% | 234 |
| Pre-wave Technical | 20% | 14% | 39% | 21% | 6% | 169 |
| Pre-wave Mostly | 4% | 18% | 11% | 46% | 21% | 330 |
| Pre-wave High | 1% | 11% | 2% | 21% | 65% | 246 |
Volatility does seem to be highly prevalent in cyber security practice more generally. For example, only one-third (34%) of Governance organisations remained in the same group in their post wave interview. However, the majority of these improved their cyber resilience with 27% moving on an upward trajectory to Mostly prepared and 13% to Highly prepared. Only 10% showed a negative move to Low prepared and 15% moved into the Technical group.
The Technical organisations also showed a high degree of volatility, with only 39% remaining in group. Their trajectories included around one-fifth (21%) moving to the Mostly prepared group and 6% into Highly prepared. However, another fifth (20%) moved backwards to the Low prepared group. Similarly, the Mostly prepared organisations showed both forward and backward trajectories, with 21% improving to the High prepared group, 18% to Governance, 11% to Technical and 4% to Low. Around half (51%) of the Low prepared group remained stable with a slight inclination towards the Governance group (18%), 16% to the Technical group and 13% to Mostly prepared.
There were few differences between businesses and charities in terms of their changes in patterns of cyber resilience. Only for the Highly prepared were businesses more likely to remain stable (72%) than charities (49%).
Table 9.4: Sector and changes in cyber resilience
Pre-wave Low
| Post-Wave Low | Post-Wave Governance | Post-Wave Technical | Post-Wave Mostly | Post-Wave High | Base | |
| Business | 51% | 17% | 16% | 17% | * | 89 |
| Charity | 53% | 19% | 16% | 12% | * | 57 |
| Sub-total | 51% | 18% | 16% | 13% | 2% | 146 |
Pre-wave Governance
| Post-Wave Low | Post-Wave Governance | Post-Wave Technical | Post-Wave Mostly | Post-Wave High | Base | |
| Business | 9% | 31% | 18% | 28% | 15% | 137 |
| Charity | 12% | 38% | 11% | 27% | 11% | 97 |
| Sub-total | 10% | 34% | 15% | 27% | 13% | 234 |
Pre-wave Technical
| Post-Wave Low | Post-Wave Governance | Post-Wave Technical | Post-Wave Mostly | Post-Wave High | Base | |
| Business | 19% | 13% | 39% | 21% | 8% | 120 |
| Charity | 20% | 18% | 39% | 22% | 0% | 49 |
| Sub-total | 20% | 14% | 39% | 21% | 6% | 169 |
Pre-wave Mostly
| Post-Wave Low | Post-Wave Governance | Post-Wave Technical | Post-Wave Mostly | Post-Wave High | Base | |
| Business | 4% | 18% | 13% | 43% | 21% | 203 |
| Charity | 3% | 19% | 7% | 50% | 21% | 127 |
| Sub-total | 4% | 18% | 11% | 46% | 21% | 330 |
Pre-wave High
| Post-Wave Low | Post-Wave Governance | Post-Wave Technical | Post-Wave Mostly | Post-Wave High | Base | |
| Business | * | 11% | * | 17% | 72% | 166 |
| Charity | * | 21% | * | 30% | 49% | 80 |
| Sub-total | * | 14% | * | 21% | 65% | 246 |
Pre-wave Total
| Post-Wave Low | Post-Wave Governance | Post-Wave Technical | Post-Wave Mostly | Post-Wave High | Base | |
| Business | 13% | 17% | 16% | 27% | 27% | 715 |
| Charity | 14% | 23% | 12% | 32% | 19% | 410 |
| Sub-total | 13% | 19% | 15% | 29% | 24% | 1125 |
*indicates cells treated to suppress small numbers of cases
Resilience and cyber security experience
Some improvements in cyber resilience may be triggered by a cyber security incident. To explore this hypothesis, transitions between the segment groups were explored by experience of cyber incidents, impacts and outcomes measured during the pre-wave data collection. Experience of a cyber security incident was anticipated to be associated with improvements in the cyber resilience grouping, using those that experienced no incident as a baseline. However, whilst there is some support for this hypothesis, the evidence showed mixed results.
Among those with Low preparation, 55% of organisations that experienced no incident pre-wave remained in the Low group post-wave, compared to 45% of their counterparts that had experienced an incident, i.e., the experience of an incident was consistent with triggering an improvement among 10% of Low organisations. This appeared to result in more moves either to Technical or Mostly prepared status. When considering impacts, rather than incidents, 56% of non-impacted organisations stayed stable in the Low group compared to 40% of the impacted group, which suggests that 16% of Low prepared organisations may have been motivated by the impact. However, small sample sizes mean that these results need to be treated with caution. Additionally, there were too few Low organisations reporting outcomes to provide reliable results.
Amongst Highly prepared organisations, incidents, impacts and outcomes all seemed to act as triggers for not degrading cyber resilience. Among those that did not experience an incident, around half moved in a negative direction (49%), 28% to Mostly and 21% to Governance. Of those who did experience an incident, 71% remained in the High level of preparedness group and of those that regressed, it was generally to the Mostly prepared group (18%).
Among those in the Governance group, organisations that experienced an incident were less likely to remain in the Governance group (32%) than those that did not experience an incident (36%). However, those experiencing an incident were more likely to move into the Mostly group (31% compared to 24%) or the High group (17% compared to 10%) than those that did not experience an incident. A similar pattern of results was seen for both outcomes and impacts.
The results for the Technical and Mostly prepared groups were more complex. Organisations in the Technical group experiencing an incident were slightly more likely to move to Low (22% compared to 16%) than their counterparts not experiencing an incident. However, in contrast, 25% of organisations experiencing an incident were in the Mostly group compared to 18% of their counterparts with no incident. This pattern of results was not as clear cut when considering impacts and outcomes. For impacts, there was still a tendency for impacted Technical organisations to move into the Mostly prepared group. However, for outcomes, there were no notable differences between the impacted and non-impacted transition destinations, though small numbers of affected organisations limits the precision of these results.
For the Mostly prepared organisations, incidents had little impact on their post-wave destinations. However, counterintuitively, those experiencing an outcome were less likely to move into the High group than those not experiencing an outcome (16% compared to 23%). A similar finding emerged for impacts (25% compared to 16%).
Table 9.5a: Influence of cyber security incidents on segment group transitions
Pre-wave Low
| Incident | Post-Wave Low | Post-Wave Governance | Post-Wave Technical | Post-Wave Mostly | Post-Wave High | Base |
| No | 55% | 19% | 14% | 13% | * | 95 |
| Yes | 45% | 16% | 20% | 20% | * | 51 |
Pre-wave Governance
| Incident | Post-Wave Low | Post-Wave Governance | Post-Wave Technical | Post-Wave Mostly | Post-Wave High | Base |
| No | 12% | 36% | 18% | 24% | 10% | 120 |
| Yes | 9% | 32% | 11% | 31% | 17% | 114 |
Pre-wave Technical
| Incident | Post-Wave Low | Post-Wave Governance | Post-Wave Technical | Post-Wave Mostly | Post-Wave High | Base |
| No | 16% | 18% | 43% | 18% | 6% | 80 |
| Yes | 22% | 11% | 36% | 25% | 6% | 89 |
Pre-wave Mostly
| Incident | Post-Wave Low | Post-Wave Governance | Post-Wave Technical | Post-Wave Mostly | Post-Wave High | Base |
| No | 3% | 20% | 13% | 44% | 21% | 135 |
| Yes | 5% | 17% | 9% | 47% | 22% | 195 |
Pre-wave High
| Incident | Post-Wave Low | Post-Wave Governance | Post-Wave Technical | Post-Wave Mostly | Post-Wave High | Base |
| No | * | 21% | * | 28% | 51% | 78 |
| Yes | * | 11% | * | 18% | 71% | 168 |
*indicates cells treated to suppress small numbers of cases
Table 9.5b: Influence of cyber security outcomes on segment group transitions
Pre-wave Low
| Outcome | Post-Wave Low | Post-Wave Governance | Post-Wave Technical | Post-Wave Mostly | Post-Wave High | Base |
| No | 51% | 18% | 16% | 15% | * | 130 |
| Yes | 56% | 44% | * | * | * | 16 |
Pre-wave Governance
| Outcome | Post-Wave Low | Post-Wave Governance | Post-Wave Technical | Post-Wave Mostly | Post-Wave High | Base |
| No | 11% | 33% | 16% | 26% | 14% | 196 |
| Yes | 5% | 42% | 8% | 34% | 11% | 38 |
Pre-wave Technical
| Outcome | Post-Wave Low | Post-Wave Governance | Post-Wave Technical | Post-Wave Mostly | Post-Wave High | Base |
| No | 19% | 15% | 40% | 20% | 6% | 136 |
| Yes | 21% | 12% | 33% 27% | 6% | 33 |
Pre-wave Mostly
| Outcome | Post-Wave Low | Post-Wave Governance | Post-Wave Technical | Post-Wave Mostly | Post-Wave High | Base |
| No | 3% | 19% | 12% | 43% | 23% | 256 |
| Yes | 7% | 16% | 5% | 55% | 16% | 74 |
Pre-wave High
| Outcome | Post-Wave Low | Post-Wave Governance | Post-Wave Technical | Post-Wave Mostly | Post-Wave High | Base |
| No | * | 17% | * | 22% | 61% | 184 |
| Yes | * | 6% | * | 18% | 76% | 62 |
*indicates cells treated to suppress small numbers of cases
Table 9.5c: Influence of cyber security impacts on segment group transitions
Pre-wave Low
| Impact | Post-Wave Low | Post-Wave Governance | Post-Wave Technical | Post-Wave Mostly | Post-Wave High | Base |
| No | 56% | 19% | 10% | 15% | * | 106 |
| Yes | 40% | 15% | 30% | 15% | * | 40 |
Pre-wave Governance
| Impact | Post-Wave Low | Post-Wave Governance | Post-Wave Technical | Post-Wave Mostly | Post-Wave High | Base |
| No | 13% | 36% | 18% | 24% | 8% | 148 |
| Yes | 6% | 30% | 9% | 33% | 22% | 86 |
Pre-wave Technical
| Impact | Post-Wave Low | Post-Wave Governance | Post-Wave Technical | Post-Wave Mostly | Post-Wave High | Base |
| No | 18% | 16% | 38% | 21% | 6% | 98 |
| Yes | 21% | 11% | 41% | 21% | 6% | 71 |
Pre-wave Mostly
| Impact | Post-Wave Low | Post-Wave Governance | Post-Wave Technical | Post-Wave Mostly | Post-Wave High | Base |
| No | 4% | 20% | 13% | 39% | 25% | 183 |
| Yes | 4% | 17% | 8% | 54% | 16% | 147 |
Pre-wave High
| Impact | Post-Wave Low | Post-Wave Governance | Post-Wave Technical | Post-Wave Mostly | Post-Wave High | Base |
| No | * | 19% | * | 24% | 56% | 124 |
| Yes | * | 9% | * | 18% | 73% | 122 |
*indicates cells treated to suppress small numbers of cases
9.3 Cyber security certifications and standards
The preceding section focused on resilience as a combination of technical activities, policies and procedures. However, there is also value in understanding the stability of organisations in undertaking key individual cyber security activities. This section focuses on two such key activities: accreditation through ISO standards or Cyber Essentials certification, and board engagement with cyber security. Government views Cyber Essentials certification as an effective protection measure against a range of common cyber-attacks and cyber security as a critical, board level issue. Certification is first explored over the two waves as positive and negative change, including a distinction between those whose certification status remained stable with some scheme in place from those not adhering to any certification at both waves. Finally, the relationship between the stability of certification status and incidents, impacts and outcomes is explored to assess any evidence for a link between experience of adverse events as a primer (or consequence) of change in certification status.
Cyber security certification
The Cyber Essentials scheme has two levels: Cyber Essentials Standard and Cyber Essentials Plus, both of which require five technical rules or processes to be in place. Cyber Essentials is a verified self-assessment, whereas Cyber Essentials Plus involves independent technical verification by a Certification Body. ISO 27001 is another scheme requiring protective practices which can be implemented as an alternative or in addition to Cyber Essentials. Respondents were asked if their organisation adhered to these three standards but were not directly asked if they were currently accredited.
Overall, 62% stated they were not adhering to one of the cyber security certifications or standards at the pre-wave interview (Table 9.6). However, 20% said they were adhering to Cyber Essentials Standard. Just under one in ten (9%) stated they adhered to Cyber Essentials Plus. Around 14% reported adhering to the ISO 27001 standard. Just over 5% of organisations said they adhere both to ISO 27001 and one of the Cyber Essentials certifications.
Table 9.6: Pre-wave certification status
| Count | Percent | |
| None | 702 | 62% |
| Cyber Essentials Standard | 193 | 17% |
| Cyber Essentials Plus | 69 | 6% |
| ISO 27001 | 100 | 9% |
| ISO 27001 & Cyber Essentials Standard | 26 | 2% |
| ISO 27001 & Cyber Essentials Plus | 35 | 3% |
| Total | 1125 | 100% |
Of those not adhering to a certification pre-wave, 81% remained with no certifications post-wave, with 10% moving to Cyber Essentials Standard and 3% to Cyber Security Plus. Some 4% adhered to ISO 27001 only, and another 1% to ISO 27001 with either Cyber Essentials Standard or Plus.
There was some degree of volatility in reporting standards between waves and it is not clear how much of this represents real change and how much indicates confusion over the standards among organisations. Those reporting that they adhere to one of the Cyber Essentials schemes pre-wave were most likely to report adherence to the same scheme post-wave, around 60% to 62%. However, 20% of those reporting Cyber Essentials Standard pre-wave reported no scheme post-wave, as did 16% of those reporting Cyber Essentials Plus. Those adhering to ISO 27001 pre-wave were most volatile. Just under half (46%) reported adhering to ISO 27001 post-wave, with 28% reporting no standards post-wave, although 16% reported adhering to both ISO 27001 and one of the Cyber Essentials standards post-wave. A combined pre-wave ISO 27001/Cyber Essentials status was also volatile with only 48% remaining stable. However, whilst 18% reported no longer adhering to any certifications or standards, the remainder dropped adherence to just one.
Table 9.7: Certification: wave-on-wave change
| Post-Wave None | Post-Wave | CE | Post-Wave CE+ | Post-Wave ISO 27001 | Post-Wave ISO 27001 & CE/CE+ | Base | |
| Pre-Wave None | 81% | 10% | 3% | 4% | 1% | 702 | |
| Pre-Wave CE | 20% | 60% | 8% | 4% | 9% | 193 | |
| Pre-Wave CE+ | 16% | 9% | 62% | 1% | 12% | 69 | |
| Pre-Wave ISO 27001 | 28% | 7% | 3% | 46% | 16% | 100 | |
| Pre-Wave ISO 27001 & CE/CE+ | 18% | 11% | 11% | 11% | 48% | 61 |
Note: ISO 27001 with Cyber Essentials or Cyber Essentials Plus were combined into a single category.
As seen in table 9.8, to understand change, improvements were classified as positive if organisations were seen to adhere to certifications or standards at post-wave but had none at pre-wave (gained). Vice-versa, negative change was classified as moving from adhering to certifications or standards at pre-wave to none at post-wave (lost). With none and retained as two further categories, certification change was considered for each of the segmentation groups.
Organisations most likely to gain certification between waves were those that already tended to have strong protection, i.e., 38% of Highly prepared organisations and 22% of those that were Mostly prepared. Organisations with Low levels of protection were least likely to gain certification (8%), with 15% of Governance and 16% of Technical organisations also gaining.
Organisations in the Low (43%) and Technical segments (42%) were most likely to report no longer adhering to certifications post-wave, compared to 23% of Mostly, 16% of High and 15% of Governance organisations.
Table 9.8: Certification gains and losses by cyber resilience group
| Certification | Low | Governance | Technical | Mostly | High |
| None | 92% | 85% | 84% | 78% | 62% |
| Gained | 8% | 15% | 16% | 22% | 38% |
| Lost | 43% | 15% | 42% | 23% | 16% |
| Retained | 57% | 85% | 58% | 77% | 84% |
Businesses and charities were equally likely to gain accreditation adherence post-wave (19%). However, 28% of charities reporting losing their adherence to certifications or standards post-wave compared to 18% of businesses.
Table 9.9: Certification change by business/charity status
Pre-wave certification: None
| Post-wave certification | Business | Charity | Base |
| None | 81% | 81% | 571 |
| Yes, at least one | 19% | 19% | 131 |
Pre-wave certification: At least one certification was in place
| Post-wave certification | Business | Charity | Base |
| None | 18% | 28% | 88 |
| Yes, at least one | 82% | 72% | 335 |
There is some evidence that experience of a cyber security incident pre-wave had some influence on accreditation status (Figure 9.1). Among organisations that did not experience an incident, 15% gained adherence to certifications compared to 23% of those organisations that had experienced a pre-wave incident. Conversely, 24% of organisations with no pre-wave experience of an incident lost their certification status compared to 19% of organisations that had experienced a cyber security incident at the earlier wave.
Figure 9.1: Certification status by pre-wave incident experience
Change over time in certification among those organisations that experience an incident in their pre-wave results
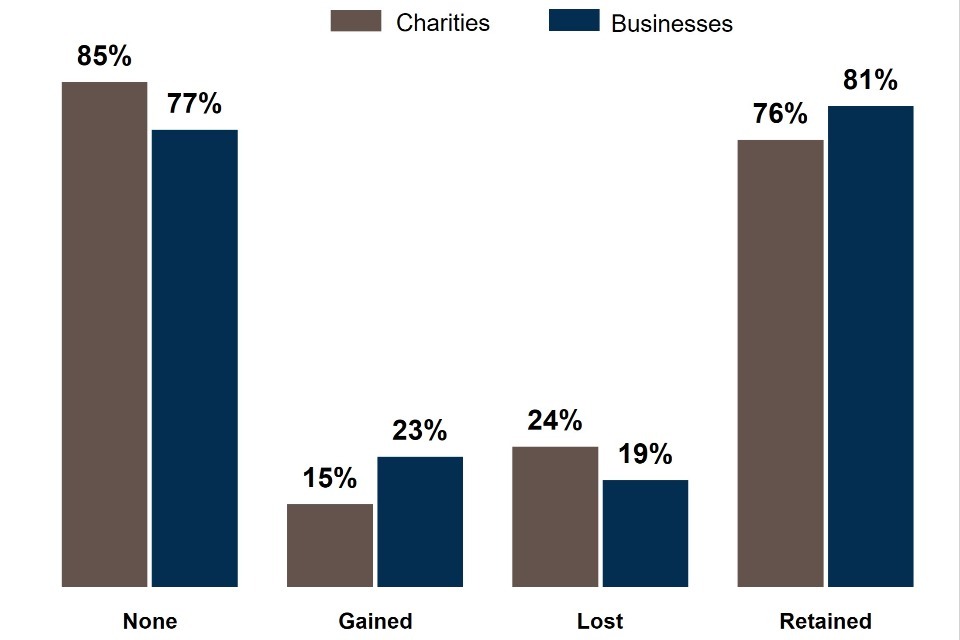
Base: 1,125 organisations interviewed in Wave 1 and Wave 2 and/or Wave 2 and Wave 3.
9.4 Board representation
Organisations were asked questions about various engagement activities concerning cyber security over the last twelve months. These included:
- Does your organisation have one or more board members whose roles include oversight of cyber security issues?
- How much would you agree/disagree the board integrates cyber security issues into wider business areas?
- Have the board received any cyber security training?
- What is the frequency of board discussion on cyber security?
Nearly three-quarters (72%) of organisations reporting that a board member held a role for cyber security responsibility pre-wave reported also having one post-wave (Table 9.10). In contrast, nearly one-third (32%) of those organisations reporting no board member with cyber security responsibility gained a responsible member post-wave. Overall, the results suggest a growing trend in board responsibility for cyber security issues.
Table 9.10: Board has cyber security role member
| Pre-wave status | Don’t know | Stable | Worsened | Improved | Base |
| Yes | 5% | 72% | 23% | N/A | 541 |
| No | 3% | 65% | N/A | 32% | 515 |
| Total | 4% | 69% | 12% | 16% | 1056 |
Organisations’ perceptions of the extent to which the board integrates cyber security issues into the wider organisation showed a substantial degree of volatility (Table 9.11). Nevertheless, around half of those that strongly agreed pre-wave gave a negative response post wave (49%). Although not shown in Table 9.11, the vast majority of these were moves from strongly agree to tend to agree rather than these organisations indicating complete disengagement. However, of those initially tending to agree, 31% at post-wave gave a negative response with 17% moving to strongly agree. Of those organisations starting with less resilience, the tendency was towards improvement: 67% of those who strongly disagreed pre-wave gave an improved response post wave. The comparable figures for those tending to disagree were 55% and for those that were neutral it was 40%.
Table 9.11: Board integrates cyber security issues into wider business
| Pre-wave status | Don’t know | Stable | Worsened | Improved | Base |
| Strongly agree | 5% | 46% | 49% | N/A | 205 |
| Tend to agree | 6% | 46% | 31% | 17% | 369 |
| Neither agree nor disagree | 15% | 31% | 14% | 40% | 194 |
| Tend to disagree | 21% | 19% | 4% | 55% | 98 |
| Strongly disagree | 33% | 0% | N/A | 67% | 30 |
| Don’t know | 100% | 0% | 0% | 0% | 61 |
| Total | 18% | 36% | 26% | 20% | 957 |
Overall, cyber security training for the board showed an improvement between waves (Table 9.12), with 26% of organisations with no board training showing improvement compared to 18% of organisations that had formerly reported training not doing so at post-wave. However, among organisations reporting no training at pre-wave, 65% still reported no training post-wave.
Table 9.12: Board receives cyber security training
| Pre-wave status | Don’t know | Stable | Worsened | Improved | Base |
| Yes | 9% | 74% | 18% | N/A | 454 |
| No | 9% | 65% | N/A | 26% | 492 |
| Don’t know | 100% | N/A | N/A | N/A | 179 |
| Total | 24% | 58% | 7% | 11% | 1125 |
Volatility was also apparent in responses to the questions on the frequency of board discussions on cyber security (Table 9.13). From a positive perspective, nearly half (47%) of organisations stating their board never discussed cyber security pre-wave, did so with some frequency post-wave. However, 49% of organisations with no board discussion at pre-wave also had no post-wave board discussion. Among organisations reporting cyber security board discussions every 6 months or less often, 34% improved in that they became more frequent, though 12% reported no post-wave discussion. However, of those reporting the most frequent pre-wave board discussions on cyber security, there was a tendency for the period between discussions to lengthen. One-third (33%) of organisations reporting quarterly discussions pre-wave had longer intervals post-wave, with 14% reporting more frequent discussions. Of those reporting monthly or more frequent discussions pre-wave, 40% reported a longer interval between discussions post-wave.
Table 9.13: Frequency of board discussion on cyber security
| Pre-wave status | Don’t know | Stable | Worsened | Improved | Base |
| Never | 4% | 49% | N/A | 47% | 168 |
| 6 months or less often | 5% | 49% | 12% | 34% | 385 |
| Quarterly | 7% | 46% | 33% | 14% | 276 |
| Monthly or more often | 8% | 52% | 40% | N/A | 178 |
| Not known | 100% | N/A | N/A | N/A | 118 |
| Total | 16% | 44% | 19% | 22% | 1125 |
Board representation with a designated cyber security role (Figure 9.2) tended to show a high degree of stability over time, especially among High (73%) and Low (70%) prepared organisations, as might be expected. There was a tendency to show more improvement over time than loss of the role, except for High prepared organisations, where 9% showed improvement and 12% regressed. However, the other segmentation groups were more likely to show an improvement than a regression, with this most pronounced among the Technical group (17% showing an improvement and 7% a regression post-wave).
Figure 9.2: Stability of board cyber security role by segmentation group
Change in whether organisations have a cyber security role on their board, between two time periods and split by segment
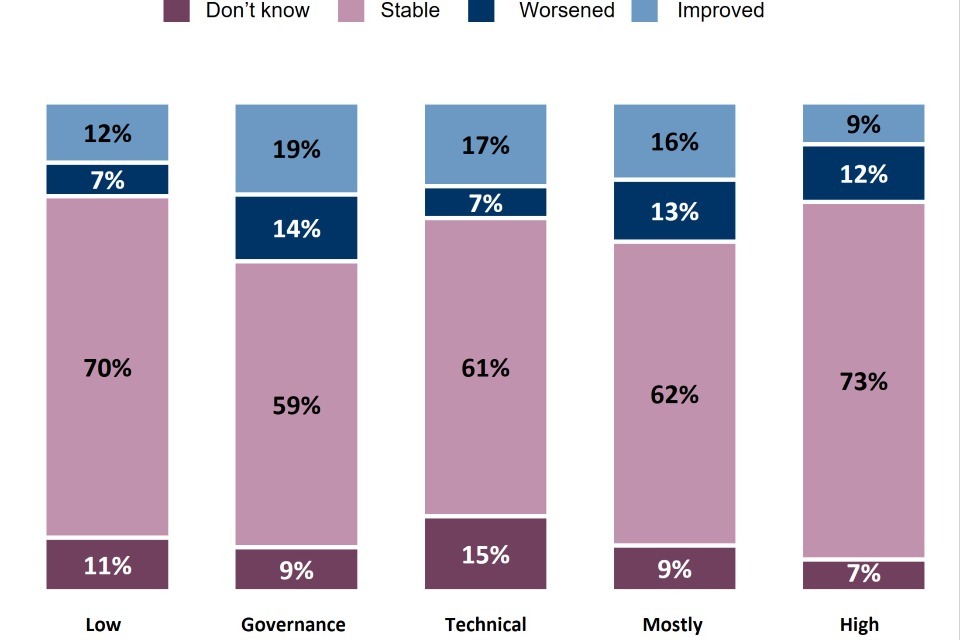
Base: 1,125 organisations interviewed in Wave 1 and Wave 2 and/or Wave 2 and Wave 3.
Stability and cyber resilience
When considering the stability and volatility of board engagement by degree of cyber resilience (as measured by segmentation group), levels of knowledge particularly among the Low prepared group and, to a lesser extent the Technical group, were lower. For example, 71% of Low prepared organisations were unable to give a response or did not know about the extent to which the board integrates cyber security risks across the wider business. For Technical organisations, the comparable figure was 44%. In contrast only 5% of High prepared organisations gave the same response, as did 20% of Mostly prepared and 27% of Governance organisations. This was an extreme across the four questions and levels of unknown/don’t know responses are lower for other questions, but the Low prepared and Technical organisations tend to be less aware than others, albeit with a much lower differential.
Stability of the integration of cyber security into the wider organisation by the board was confounded to some extent by lower levels of knowledge, especially among Low prepared and Technical organisations. However, as seen in Figure 9.3, there was a general tendency for a net move towards less integration, among those who gave a response. This change was especially notable among the Governance group, with 26% lessening and 17% improving their integration. Additionally, 29% of High prepared organisations stepped backwards compared to 21% that improved. Mostly prepared organisations saw 23% take a forward step and 24% a backward step. On the other hand, Technical organisations saw 20% improve compared to 14% that reduced integration. Low prepared organisations saw 10% improve and 8% step backward.
Figure 9.3: Stability of board integration of cyber security risks by segmentation group
Change in whether organisations’ board cover cyber security risks, between two time periods and split by segment
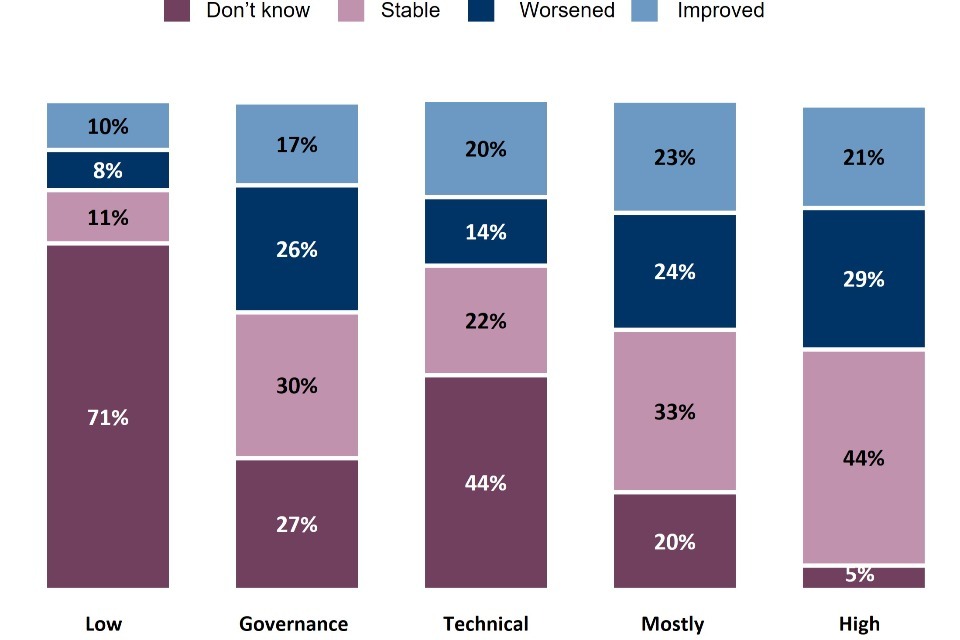
Base: 1,125 organisations interviewed in Wave 1 and Wave 2 and/or Wave 2 and Wave 3.
Training in cyber security of board members also showed relatively low levels of awareness among respondents ranging from a low of 17% of Highly prepared organisations that were unable to respond to 28% of Mostly prepared organisations. However, the general trend was towards improvement, especially among Low prepared and Technical organisations. Among the Low prepared group 4% reported a downgrade in training and 11% an improvement. For the Technical group, 3% reported a downgrade in training post-wave compared to 12% reporting an improvement.
Figure 9.4: Stability of board training in cyber security by segmentation group
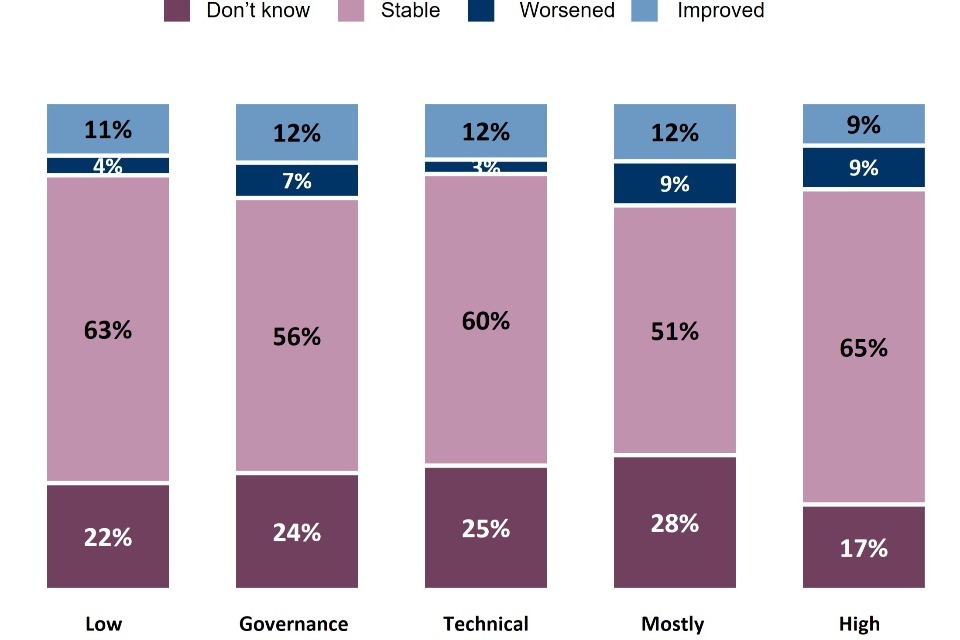
Change in whether board’s receive cyber security training over time, split by segment
Base: 1,125 organisations interviewed in Wave 1 and Wave 2 and/or Wave 2 and Wave 3.
Organisations with lower cyber resilience generally showed improvement in having a dedicated member of staff with responsibility of reporting on cyber security to the board. Among Low prepared organisations, 25% reported an improvement post-wave and 9% a loss of the role. For Governance organisations, 24% reported an improvement compared to 18% a loss. Among Technical and Mostly prepared organisations, the net growth was two percentage points and for Highly prepared organisations there was a net loss of three percentage points.
Figure 9.5: Stability of cyber security updates to board by segmentation group
Change in cyber security updates to board between two time periods, split by segment group
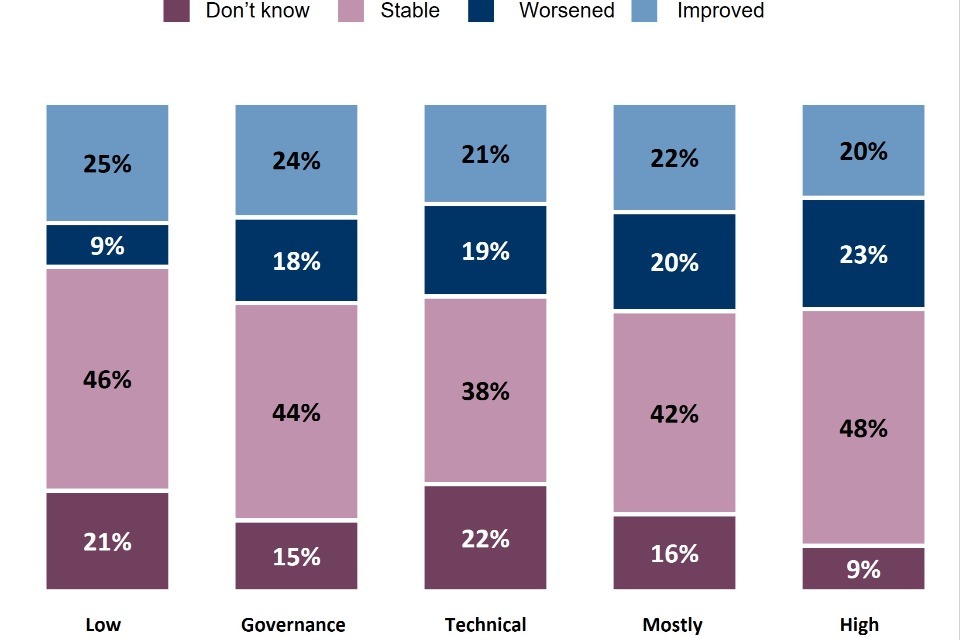
Base: 1,125 organisations interviewed in Wave 1 and Wave 2 and/or Wave 2 and Wave 3.
Stability and cyber incidents
Among organisations that experienced no cyber security incident pre-wave, 26% of organisations that reported having a person responsible for cyber security at the board reported losing that person post-wave. In contrast, among those organisations that experienced a cyber incident pre-wave, the comparable figure was lower at 21%, suggesting experience of the incident lowered the propensity to lose the board level role. In addition, again using the circumstance of no pre-wave cyber incident as a baseline, 30% of such organisations gained a designated board member with cyber security responsibility. Among those organisations that did experience a pre-wave incident, 33% gained a designated board member with cyber security responsibility. These differentials are comparatively small and should be treated with a degree of caution. However, they do support the hypothesis that experiencing a cyber security incident can act as a trigger for improving resilience through improving the visibility of cyber security at board level.
Figure 9.6: Incidents and change in organisations with a board designated cyber security role
Change in the level of incidents among organisations with different types of cyber security representation at board-level
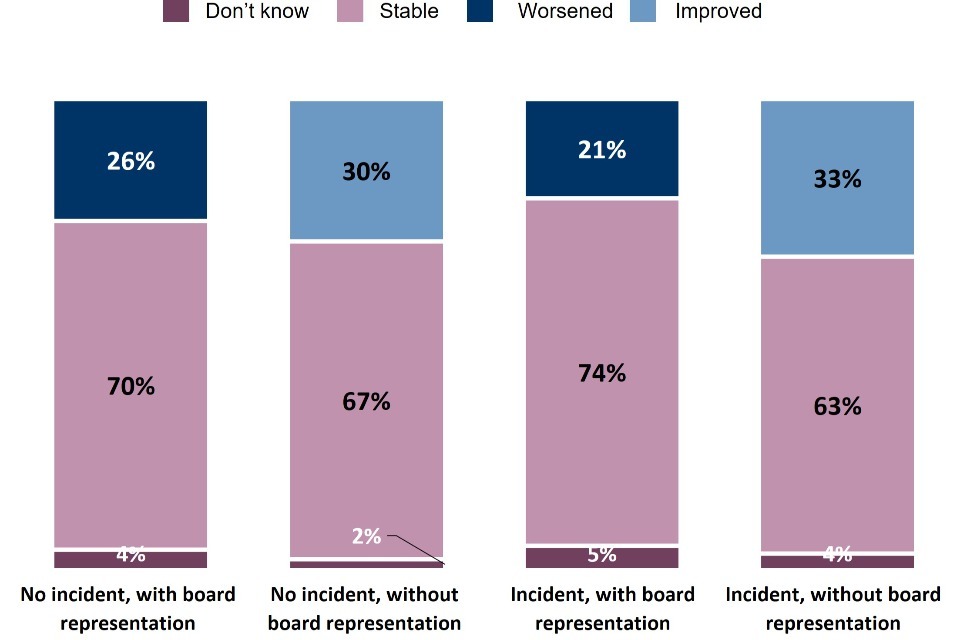
Base: 1,056 organisations interviewed in Wave 1 and Wave 2 and/or Wave 2 and Wave 3; excludes 69 organisations with missing values/Don’t know status in both waves.
When considering training of the board in cyber security, the contrast between those reporting a pre-wave incident and those not experiencing an incident is even greater. Some 20% of organisations with pre-wave training that did not experience an incident reported no training at the post-wave compared to a 16% loss among their counterparts that did experience an incident. Additionally, among those with no board training pre-wave, 20% reported post-wave training when no cyber incident had been experienced compared to 32% of their counterparts that had experienced an incident.
Figure 9.7: Incident and change in board that have received cyber security training
Change in the level of incidents among organisations with different levels of cyber security training at board level
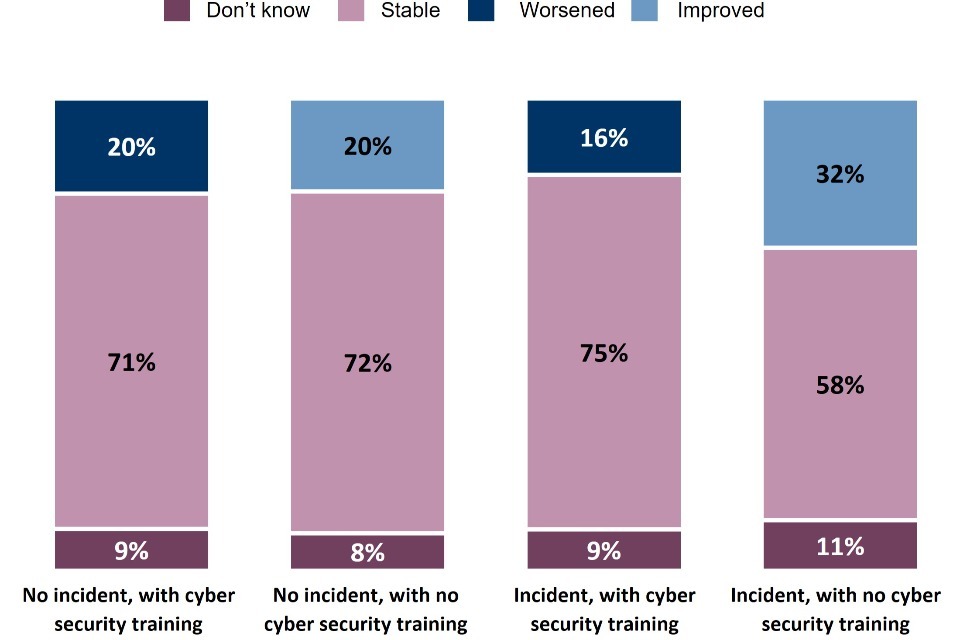
Base: 946 organisations interviewed in Wave 1 and Wave 2 and/or Wave 2 and Wave 3; excludes 179 organisations with missing values/Don’t know status in both waves.
Responses to the remaining two board questions are more complex due to multiple response options. It is possible to explore frequency of board discussions on cyber security but not integration of cyber security into the wider organisation because of the small sample size for some categories.
Frequency of board discussions on cyber security show a similar pattern to the previous two questions, with those experiencing an incident less likely to report a reduced frequency and more likely to report an increased frequency. For example, among those reporting board discussions monthly (or more often), 55% reported a decreased post-wave frequency of discussions when no pre-wave incident had occurred. In contrast, for the comparable group that had experienced an incident, the equivalent figure was lower at 34%. Similarly, among those reporting no discussions of cyber security at board level, 45% of organisations with no cyber security incidents reported some post-wave board discussions compared to 50% among organisations that had experienced an incident. Where pre-wave discussions only took place at 6-monthly (or less frequent) intervals pre-wave, the change for those not experiencing an incident was that 25% improved their frequency and 13% worsened. In contrast, where an incident had been experienced, the comparable figures were 41% and 11%, suggesting the experience of the incident resulted in more discussion at board level.
Table 9.14: Incidents and changes in board discussion on cyber security
Pre-wave no incident
| Board discussion on cyber security | Don’t know | Stable | Improved | Worsened | Base |
| Never | 6% | 49% | 45% | N/A | 102 |
| 6 months or less often | 5% | 56% | 25% | 13% | 179 |
| Quarterly | 9% | 44% | 16% | 31% | 93 |
| Monthly or more often | 5% | 40% | N/A | 55% | 55 |
Pre-wave has had an incident
| Board discussion on cyber security | Don’t know | Stable | Improved | Worsened | Base |
| Never | 2% | 48% | 50% | N/A | 66 |
| 6 months or less often | 5% | 43% | 41% | 11% | 206 |
| Quarterly | 5% | 48% | 13% | 34% | 183 |
| Monthly or more often | 9% | 57% | N/A | 34% | 123 |
9.5 Conclusions
There is some evidence suggesting that the experience of cyber incidents and the resulting impacts and outcomes may act as a trigger for change in cyber resilience levels. It is not possible to state with certainty that experience of impact caused the change in behaviour, but the evidence is consistent with this causal interpretation. However, the effect appears to have been limited to those organisations with Low, Governance and High levels of preparation. It is less clear cut for Technical organisations and appeared to be in a reverse direction for Mostly prepared organisations. Hence, the link between resilience and experience of a cyber security incident is complex. Whilst it may act as a trigger for some, it does not do so for all and may even occasionally lead to lower resilience. Clearly, further insight is required to understand the complexities of this relationship.
Adherence to Cyber Essentials certifications and the ISO 27001 standard was relatively low and remained so across all three waves. Whilst change was both positive and negative, it resulted in a net gain. Perhaps not surprisingly, adherence to certifications and standards was most likely among those organisations with stronger patterns of cyber resilience, with higher levels of gain in standards and lower levels of losses. Charities were more likely to lose their adherence over time than businesses but there were no sectoral differences in uptake of adherence. Again, there was some suggestion that experience of a cyber incident resulted in more positive changes (and less negative change) in adherence status, but this was for a minority of organisations. Additionally, the potential effects of cyber incidents varied in a complex way depending upon an organisation’s level of resilience (as defined by the segmentation group). For example, the High, Low and Governance groups tended to react more positively to a cyber incident, whereas the Technical group showed mixed effects and the Mostly group seemed to show little effect.
Among the board engagement activities explored, again there was some degree of volatility over time with both progressive and regressive transitions. However, for three of the activities, the net gain was positive. The exception was integration of cyber security into the wider organisation, which was confounded by low levels of familiarity among organisations, especially those in the Low prepared and Technical groups. There was some evidence that organisations with lower levels of resilience were more likely to improve their levels of board activities over time but were likely starting from a lower base. Again, the experience of cyber incidents generally seemed to act as a trigger for improvements in board engagement among some organisations but far from all.
Conclusions
The findings outlined in the publication above represent the third wave of a multi-wave Cyber Security Longitudinal Survey. The survey is designed to help understand the trends that have underpinned medium-sized and large businesses, along with large-income charities. This includes chapters designed to provide insight into organisations’ cyber security processes and policies, and to demonstrate the prevalence of cyber incidents among businesses and charities.
The following section outlines the key conclusions drawn from the survey as well as highlighting areas of strength and for improvement among organisations.
Stability in key metrics
Overall, there have been improvements across many metrics between Wave One and Wave Three. However, the majority of these metrics are consistent between Wave Two and Wave Three.
This trend is particularly pronounced among charities, where the stability across all three waves is most marked. By contrast, businesses show more improvements compared to Wave One, but again remain stable between Waves Two and Three. This reflects the general trend for businesses to often have a more advanced approach to cyber security than charities.
For example, in Wave Three similar proportions of both businesses and charities have taken steps to improve their cyber security in the last twelve months (85% among businesses, 87% among charities), both similar to Wave Two (85% and 86% respectively). By contrast there is a notable increase when comparing the proportion of businesses with the equivalent Wave One figure (79%).
This stability between Wave Two and Wave Three is further highlighted by the qualitative interviews. Participants from medium-sized companies and charities struggle to maintain the pace of change in cyber security. This is often further accentuated by changes in the wider economic context which stretch organisations more widely.
However, it is vital to note that there have been some areas of change. For example, the prevalence of cyber security insurance has increased across the three waves.
Underlying this overall stability there is some change
Within the longitudinal data specifically, organisations can be classified into different patterns of cyber resilience defined partly by the number of activities they undertake (Low, Mostly and High), but also by a focus on specific types of protection (Technical and Governance). There is a degree of volatility in terms of how organisations’ resilience improves or deteriorates over time. This can be masked in the cross-sectional data but was highlighted by the longitudinal analysis.
To some extent, these changes may be relatively minor. For example, around one-fifth (21%) of the High group move to Mostly and another fifth from Mostly to High (21%). Additionally, around half (51%) of Low resilience organisations remain Low but the other half improve. This suggests that there is some degree of volatility in cyber resilience levels. Some of this volatility has relatively minor impacts on general levels of resilience, with some organisations showing potentially positive improvements and other organisations reporting lower resilience.
Overall, it is clear that the path to cyber resilience is complex and non-linear, involving both positive and negative steps for some organisations. This report only captures a small period in time of the cyber resilience journeys that organisations are already involved with. It is also likely that factors such as resource and cost interact with improvements in cyber security to influence decision making on cyber resilience.
Larger businesses have a more sophisticated approach to cyber security
As with previous waves of the survey, there is a consistent relationship between the size of the business and a more developed approach to cyber security. Large businesses (those with 250 employees or more) are more likely to score highly on many metrics. For example:
- the use of AI is more common among large and very large businesses (32% vs. 20% among medium-sized businesses)
- large businesses are more likely to have all five cyber risk management documents asked about in the survey in place (31% vs. 19% among medium-sized businesses)
- very large businesses with 500 or more employees are especially likely to have undertaken cyber security staff training (78% vs. 64% of other large businesses and 57% of medium-sized businesses)
- large businesses are more likely to adhere to one of the three cyber security accreditations prompted in the survey (47% vs. 35% of medium-sized businesses).
- very large businesses are also more likely to have all five technical controls in place required to attain Cyber Essentials certification
- very large businesses are more likely than businesses overall to include mention of cyber security in their annual report
- large businesses are also most likely to have invested in patch management and user monitoring than medium-sized firms, as well as to look into the risks posed by their suppliers
Given this, it seems that large businesses have a more sophisticated approach to cyber security. As noted above, medium-sized firms find it challenging to keep pace with developments in cyber security. Large businesses, with their greater access to resources, find it easier to keep developing their processes.
Reactive mindset
Many organisations have put in place processes or policies that are reactive. However, more proactive measures are not as common among organisations.
For example, patch management is the least common Cyber Essentials technical control that organisations have in place (67% among businesses, 66% in charities). It is also one of the least common areas that organisations have invested in within the last year (54% among businesses, 45% in charities). Further to this, just over half of organisations have put in place the capacity to monitor user activity (58% among businesses, 55% in charities). Finally, and most prominently, only a minority of organisations have invested in threat intelligence (39% among businesses and 33% among charities).
This suggests that both businesses and charities are less likely to take steps that would keep their organisations safe in future and instead have built policies and procedures to handle their response to cyber security incidents. This reflects a finding from Wave Two and challenging this mindset is potentially a major obstacle for government bodies to address. However, it is important to note that Wave Three of this survey has seen an increase in the proportion of businesses that have these processes in place compared to Wave One.
Board engagement
As with previous wave of the survey, maintaining board engagement is a key theme for helping organisation to improve their cyber security resilience. In Wave Three approximately half of organisations (55% of businesses, 45% of charities) have a member of their board that has oversight of cyber security, and more than six in ten have a specific staff member that reports to the board (66% of businesses, 61% of charities). However, only just over four in ten (43%) of business boards and just over one-third (37%) of charity boards discuss cyber security at least quarterly. Further to this, only around two in ten organisations (18% of businesses, 23% of charities) cover cyber security in their annual reports.
All of this suggests that organisations’ boards acknowledge the importance of cyber security, but that their engagement is relatively shallow. The findings from the qualitative interviews suggested the boards of organisations fit cyber security into a broader ‘risk’ category, placing it alongside financial security and data protection responsibilities.
Given the potential benefits of strong board engagement, encouraging boards to take up cyber security as a separate issue will be a key move to take this forward.
Areas of continued strength
In Wave Three there are some clear areas of cyber security engagement among organisations, for example:
- VPN usage among organisations remains very high (81% of businesses and 69% of charities force employees to connect via a VPN).
- Staff cyber security training or awareness raising sessions are also common (59% of businesses, 62% of charities).
- Among both businesses and charities, around six in ten (62% of businesses, 59% of charities) have in place all the necessary technical controls required to attain Cyber Essentials. Almost all businesses and charities have the following in place: IT access rights, malware protection, network firewalls and security controls. However, patch management is the least common (67% among businesses, 66% among charities).
- With regards to incident management processes, a considerable majority of businesses and charities have these in place: guidance for reporting incidents externally (78% of businesses, 87% of charities), legal or regulatory requirements (66% of businesses, 74% of charities), and communications and public engagement plans (66% businesses, 70% charities).
As noted above, there is some evidence that organisations tend to have a reactive mindset with cyber security. The areas of strength outlined above largely concern setting up procedures to respond to a cyber security incident.
Areas showing some improvement
The findings from Wave Three are largely consistent with Wave Two and as such there have only been sporadic improvements between the two waves. However, there have been some improvements between Wave One and Wave Three, particularly among businesses. These include:
- Compared to Wave One, a higher proportion of businesses have in place the following documentation to help manage cyber risk: a business continuity plan (76% in Wave Three vs. 69% in Wave One), a written list of the organisation’s IT estate and vulnerabilities (61% in Wave Three vs. 54% in Wave One), a risk register that covers cyber security (55% in Wave Three vs. 48% in Wave One), and documentation outlining how much cyber risk the organisation is willing to accept (33% in Wave Three vs. 26% in Wave One).
- There has been a shift between Wave One (53% of businesses, 66% of charities) and Wave Three (69% of businesses, 79% of charities) in the proportion of organisations that have a cyber insurance policy. This reflects higher proportions among both cyber-specific insurance policies and broader policies that covers cyber security risk.
- The proportion of businesses that have put in place procedures to identify cyber security risks (90%) has increased compared to Wave One (82%). The biggest driver behind this is the change in risk assessment covering cyber security risks (73% in Wave Three vs. 65% in Wave One and 67% in Wave Two).
Areas to improve
Despite this there are still several relatively low-scoring metrics in Wave Three. These include:
- There remains a high proportion of charities (56%) that allow staff to access work systems on their personal devices. This is a substantial cyber risk to organisations and an important area to challenge.
- A further gap in organisations’ cyber resilience is supplier assessments. Only a low proportion of organisations complete assessments of their suppliers’ cyber security (28% of businesses, 26% of charities).
- The proportion of organisations that employ cyber security tools that use AI or machine learning (23% of businesses, 16% of charities) is low. This suggests that organisations are not embracing the most cutting-edge technology available to them.
- Despite the majority of organisations having the necessary technical controls in place to attain Cyber Essentials certification, relatively few are accredited with a cyber security standard (38% of businesses, 36% of charities). This ensures that some organisations are missing out on the additional benefits of these certifications and standards.
- Further to this, NCSC guidance is used by less than half of organisations, especially so among businesses (29% of businesses, 43% of charities).
Given all of the above, there are some key measures that could be taken to help boost organisations’ cyber resilience:
- increase senior and board-level buy-in
- help to educate organisations about the potential risks of allowing staff to access systems using their personal devices, alongside the risks of insufficiently assessing suppliers’ resilience
- advertise information and resources from NCSC and others to help make organisations access best practice, including more proactive measures
The outcome of such measures could help to boost organisations’ cyber resilience in future.
Final thoughts
Overall, this survey has only just begun to understand the way that organisations’ cyber security develops over time. The longitudinal analysis has unveiled that cyber security is multi-dimensional and non-linear. It has shown that some organisations show wave-on-wave stability, whether that be at high, low or intermediate levels of resilience. It has also shown that levels of resilience improve for some organisations but deteriorate for others. However, the focus has been on change in resilience across two years, which may not sufficiently account for lags in natural rates of growth in resilience and external factors such as funding and staff availability.
The analysis of change in cyber security resilience after an experience of an incident, impact or outcome is based on the hypothesis that these experiences can encourage organisations to mitigate the risk of future experiences. However, whilst there is some evidence to support the hypothesis, it is often weak. Furthermore, the processes by which negative experiences influence future behaviour are more complex than considered here.
For example, due to the limited longitudinal sample size over the three waves, this study has not attempted to unpack the change over time of different types of organisations and the potential cause of any differences which may underpin the data. This is a key challenge to any longitudinal study when making detailed investigations over longer periods of time. This report has pooled consecutive waves of data to provide extra depth at the expense of a longer run of time, i.e. two wave transitions rather than three years of data. The three-year run of data provides a smaller sample, which constrains the depth of detail to which organisations’ cyber resilience over three years can be viewed.
With further waves of research, there is the potential to offer continued insight into organisations’ cyber resilience. This is especially true of the longitudinal analysis which is currently limited by sample size. More complex and detailed analyses require larger samples to support deeper cuts of the data. A fourth wave would help support a more detailed opportunity to explore changes across waves.
Annex A: Further information
The Department for Science, Innovation and Technology would like to thank Ipsos and Steven Furnell of the University of Nottingham for their work in the development and carrying out of the survey and for their work compiling this report.
This research report is accompanied by infographics and a technical report. These can be found here.
The responsible DSIT analyst for this release is Emma Johns. For enquiries on this release, please contact us at cybersurveys@dsit.gov.uk.
For general enquiries contact:
Department for Science, Innovation and Technology
100 Parliament Street
London
SW1A 2BQ
Telephone: 020 7211 6000
For media enquiries only (24 hours) please contact the DSIT press office on 020 7211 2210.
This work was carried out in accordance with the requirements of the international quality standard for Market Research, ISO 20252, and with the Ipsos UK Terms and Conditions which can be found at www.ipsos.com/terms.
Annex B: Guide to statistical reliability
The final data from the survey are based on weighted samples, rather than the entire population of UK businesses or charities. Percentage results are therefore subject to margins of error, which vary with the size of the sample and the percentage figure concerned. For example, for a question where 50% of the 542 businesses sampled in the survey give a particular answer, the chances are 95 in 100 that this result would not vary more or less than 4.9 percentage points from the true figure – the figure that would have been obtained had the entire UK business population responded to the survey. The margins of error that are assumed to apply in this report are given in the following table.
Margins of error (in percentage points) applicable to %s at or near these levels
| Weighted base | Effective base | 10% or 90% | 30% or 70% | 50% | |
| Total | 852 | 695 | ±2.2 | ±3.4 | ±3.7 |
| All Business | 542 | 400 | ±2.9 | ±4.5 | ±4.9 |
| Medium business | 418 | 274 | ±3.6 | ±5.4 | ±5.9 |
| Large business | 95 | 207 | ±4.1 | ±6.3 | ±6.8 |
| Charity | 310 | 310 | ±3.3 | ±5.1 | ±5.6 |
| ISO 27001 | 127 | 108 | ±5.7 | ±8.7 | ±9.5 |
| The Cyber Essentials standard | 171 | 136 | ±5.1 | ±7.7 | ±8.4 |
| The Cyber Essentials Plus standard | 77 | 70 | ±7.1 | ±10.8 | ±11.8 |
| Cyber incident (any) | 650 | 540 | ±2.5 | ±3.9 | ±4.2 |
| Cyber incident (excluding phishing) | 460 | 389 | ±3.0 | ±4.6 | ±5.0 |
| No cyber incident | 202 | 155 | ±4.7 | ±7.2 | ±7.9 |
4th Floor 100 Parliament Street London SW1A 2BQ
© Crown copyright 2023 You may re-use this information (not including logos) free of charge in any format or medium, under the terms of the Open Government Licence. To view this licence, visit www.nationalarchives.gov.uk/doc/open-government-licence/ or write to the Information Policy Team, The National Archives, Kew, London TW9 4DU, or email: psi@nationalarchives.gsi.gov.uk
-
Subgroup differences highlighted are either those that emerge consistently across multiple questions or evidence a particular hypothesis (i.e., not every single statistically significant finding has been commented on). ↩
-
Statistical significance is a determination that the results in the data are not explainable by chance alone. For more information on significance testing, see the Cyber Security Longitudinal Survey Wave Three Technical Report. ↩
-
The NCSC provides a variety of types of guidance for organisation to use. This can include GDPR regulation https://www.ncsc.gov.uk/information/gdpr, Board Toolkit https://www.ncsc.gov.uk/collection/board-toolkit and CAF guidance https://www.ncsc.gov.uk/collection/caf among other forms of guidance ↩
-
The survey was set up predominantly as a telephone survey but using a multimode (telephone and online) approach aims to maximise response rates, and to reduce non-response bias, by allowing respondents the choice of whether to complete the survey by telephone or online (via a unique survey link emailed if requested during the initial telephone conversation). Participants with a valid phone number were given the option to complete the survey over the phone or online. ↩
-
The quantitative fieldwork dates were 17 March-12 June 2023 ↩
-
Subgroup differences highlighted are either those that emerge consistently across multiple questions or those that evidence a particular hypothesis (i.e., not every single statistically significant finding has been commented on). ↩
-
Some references to very large businesses (500+ employees) are included where data is of particular interest. Unless stated otherwise, references to large businesses incorporate all businesses with 250+ employees. ↩
-
If organisations had been confirmed as eligible and included when first interviewed in Wave One or Wave Two, but now have fewer than 50 employees (businesses) or an income below £1 million (charities), they are still considered eligible to participate in this wave. ↩
-
Developed and operated by the National Cyber Security Centre (NCSC), Cyber Essentials is a foundation level certification designed to provide a statement of the basic controls an organisation should have in place to mitigate the risk from common cyber threats. ↩
-
The protections that need to be put in place are the same as for Cyber Essentials, but for Cyber Essentials Plus a hands-on technical verification is carried out. ↩
-
An international standard on how to manage information security. An Information Security Management System (ISMS) is a set of policies, procedures, and roles designed to ensure cyber security risks are identified and managed. ↩
-
As in Figure 5.2, these figures exclude ‘Don’t Know’ responses ↩
-
The NCSC provides a variety of types of guidance for organisation to use. This can include GDPR regulation https://www.ncsc.gov.uk/information/gdpr, Board Toolkit https://www.ncsc.gov.uk/collection/board-toolkit and CAF guidance https://www.ncsc.gov.uk/collection/caf among other forms of guidance ↩
-
The cost estimates in this section are presented to three significant figures, or to the nearest whole number (if under 100). The mean and median scores exclude “don’t know” and “refused” responses. They merge the answers from respondents who gave a numeric value as well as those who gave only a banded value (because they did not know the exact answer). For the latter, we have imputed numeric values from the given banded values. We lay out this approach in detail in the Technical Annex. The cost estimates for ‘All businesses’ include those with 50+ employees when first interviewed but now with fewer than 50 employees. Findings where the Base is lower than 50 should be treated with caution. ↩
-
Not all questions from these groups of items were included in the segmentation. Some items were removed because they were very highly correlated with other items. ↩