Fire and rescue workforce and pensions statistics: England, April 2019 to March 2020
Updated 22 October 2020
Applies to England

© Crown copyright 2020
This publication is licensed under the terms of the Open Government Licence v3.0 except where otherwise stated. To view this licence, visit nationalarchives.gov.uk/doc/open-government-licence/version/3 or write to the Information Policy Team, The National Archives, Kew, London TW9 4DU, or email: psi@nationalarchives.gov.uk.
Where we have identified any third party copyright information you will need to obtain permission from the copyright holders concerned.
This publication is available at https://www.gov.uk/government/statistics/fire-and-rescue-workforce-and-pensions-statistics-england-april-2019-to-march-2020/fire-and-rescue-workforce-and-pensions-statistics-england-april-2019-to-march-2020
Frequency of release: Annual
Forthcoming release: Home Office statistics release calendar
Home Office responsible statistician: Deborah Lader
Press enquiries: 0300 123 3535
Public enquiries: FireStatistics@homeoffice.gov.uk
This release presents statistics for two time periods, as at 31 March 2020 and the 2019-20 financial year (1 April 2019 to 31 March 2020) for fire and rescue services (FRSs) in England.
32,171 staff (FTE) were employed as firefighters on 31 March 2020. This was virtually unchanged compared with the previous year (32,232 in 2019). Since 2010 the number of firefighters has decreased by 23 per cent.
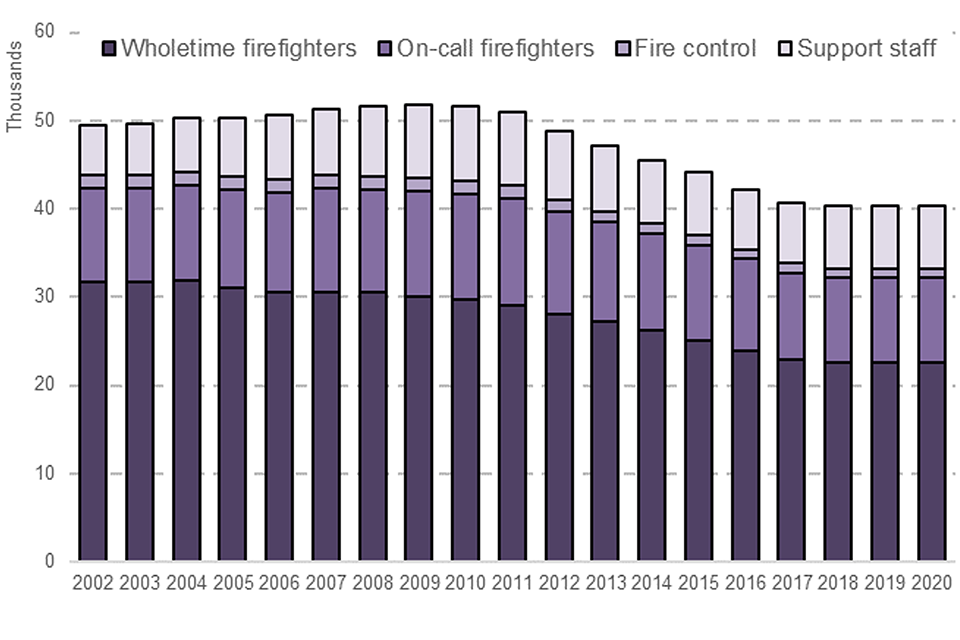
This stacked bar chart shows that between 2002 and 2009 the number of staff employed by FRAs increased gradually. Between 2009 and 2020 there was a relatively large decrease in staff. Total staff in 2020 was around 40,000 people (full time equivalent) compared with over 50,000 in 2009. The chart also shows that the majority of FRS staff are wholetime firefighters. After wholetime firefighters more staff are on-call firefighters, then support staff and finally fire control.
On 31 March 2020, seven per cent (2,461) of firefighters were women and four per cent (1,410) were from an ethnic minority.
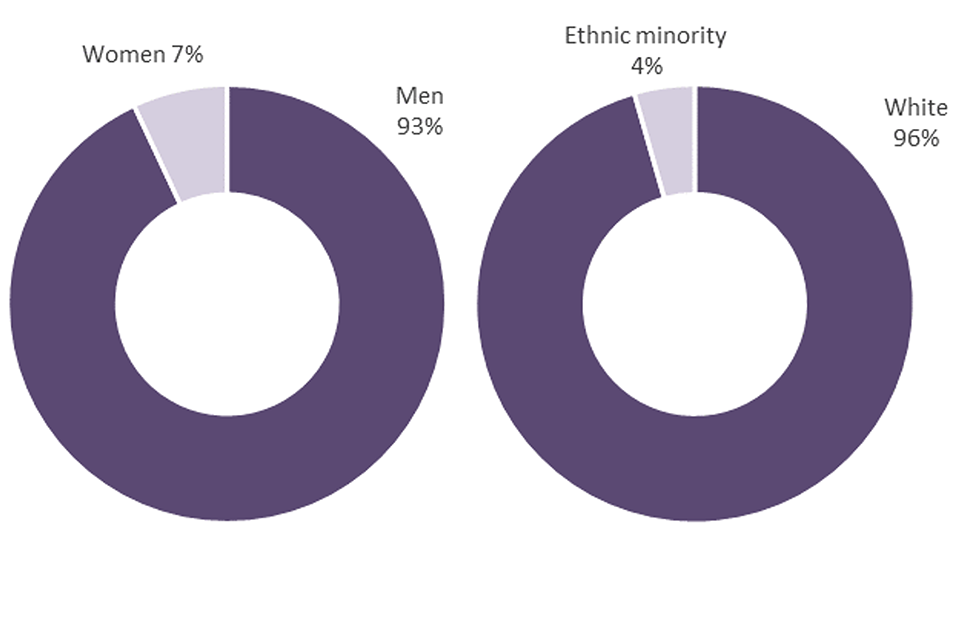
The first doughnut chart shows that in 2020 7% of firefighters were women. The second doughnut chart shows that in 2020 4% of firefighters were from an ethnic minority.
1. Total workforce, leavers and joiners
Key results
As at 31 March 2020:
- 40,408 staff (FTE) were employed by Fire and Rescue Authorities (FRAs), similar to 2019 (40,424), an eight per cent decrease compared with five years ago (44,101 in 2015) and a 22 per cent decrease compared with ten years ago (51,651 in 2010)
- 32,171 staff (FTE) were employed by FRAs as firefighters, virtually unchanged compared with the previous year (32,232 in 2019), down ten per cent from five years ago (35,925 in 2015) and a 23 per cent decrease compared with ten years ago (41,632 in 2010)
- 1,078 staff (FTE) were employed by FRAs as fire control, similar to 2019 (1,063), a four per cent decrease compared with five years ago (1,120 in 2015) and a 29 per cent decrease compared with ten years ago (1,510 in 2010)
- 7,159 staff (FTE) were employed by FRAs as support staff, again similar to 2019 (7,128), a one per cent increase compared with five years ago (7,056 in 2015) but a 16 per cent decrease compared with ten years ago (8,509 in 2010)
- during the year ending March 2020, 4,194 staff left FRAs and 4,048 joined (around 9% of headcount)
Staff in post employed by fire and rescue authorities by role
- Wholetime firefighter – a full-time firefighter, regardless of rank
- On-call firefighter – a firefighter responding when required during their ‘on-call’ hours, sometimes called Retained Duty System
- All firefighters – wholetime plus on-call firefighters
- Fire control – a uniformed member of staff working in a fire and rescue service control centre to answer emergency calls and deal with mobilising, communications and related activities, regardless of rank
- Support staff – a member of staff employed by the FRA who is not a firefighter or in fire control; it includes, for example, administrative roles, clerical support, analytical support, finance, vehicle maintenance, property management etc.
1.1 Total workforce
Figure 1.1 shows that the total full-time equivalent (FTE) workforce gradually increased from around 49,400 in 2002 to a peak of around 51,700 in 2009. This was an average increase of less than one per cent per year (0.7%). Over this time the number of total firefighters (FTE) was broadly stable (decreasing by around 400), while support staff (FTE) increased by around 2,500.
Figure 1.1: Total staff employed (FTE) by FRAs in England, 2002 to 2020
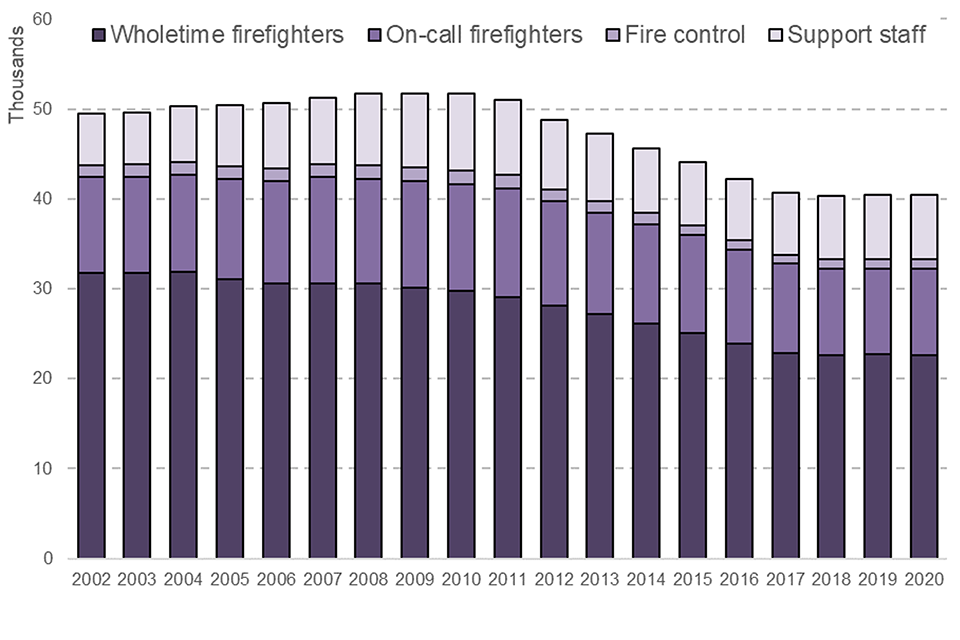
Source: FIRE1101
This stacked bar chart shows that between 2002 and 2009 the number of staff employed by FRAs increased gradually. Between 2009 and 2020 there has been a relatively large decrease in staff. Total staff in 2020 was around 40,000 people (full time equivalent) compared with over 50,000 in 2009. The chart also shows that the majority of FRS staff are wholetime firefighters. After wholetime firefighters more staff are on-call firefighters, then support staff and finally fire control.
Since 2009 the total workforce (FTE) has decreased, from around 51,700 to around 40,400 in 2020 (22% lower). This shows an average decrease of more than two per cent per year over this period (2.2%). There were around 9,800 fewer firefighters (23% lower) compared with 2009, although the decrease was greater for wholetime (25%) than on-call (20%) firefighters.
1.2 Workforce leavers and joiners
Information on leavers and joiners is collected on a headcount (i.e. an individual rather than FTE) basis.
During 2019-20, 4,194 staff left FRSs (9% of the headcount at 31 March 2019) and there were 4,048 new staff (9% of the 31 March 2020 headcount).
Since data became available in 2009-10, the proportion of FRS staff that left the FRS increased slowly from seven per cent to ten per cent in 2018-19, decreasing slightly to nine per cent in 2019-20. This is partly caused by increases in the rate of staff retiring through either “normal retirement” or “early retirement”.
The proportion of FRS staff that were new joiners has increased each year from when data became available in 2016-17 from five per cent to nine per cent 2019-20. For all firefighters, this was four per cent in 2016-17 and eight per cent in 2019-20.
Overall, there were 61 fewer firefighters (FTE) in 2020 since the previous year (see Figure 1.2), compared with almost no change in the number of firefighters in 2019 since 2018. This followed a period of sustained decrease in firefighters of between around 1,200 and 1,600 per year from 2012 to 2017.
Figure 1.2: Change in number of firefighters (FTE) compared with the previous year in England, 2010 to 2020
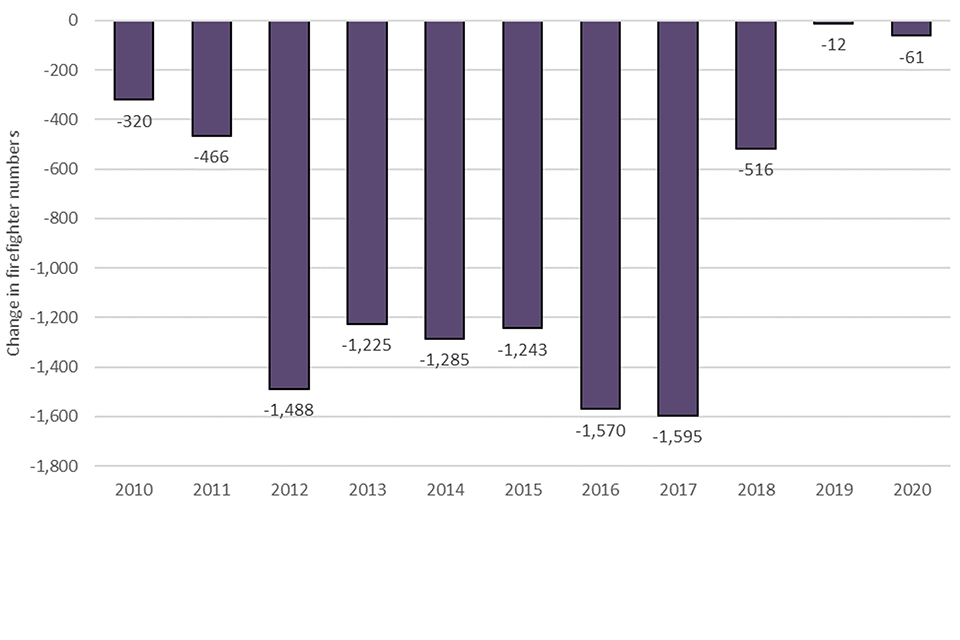
Source: FIRE1101
1.3 Reasons for leaving
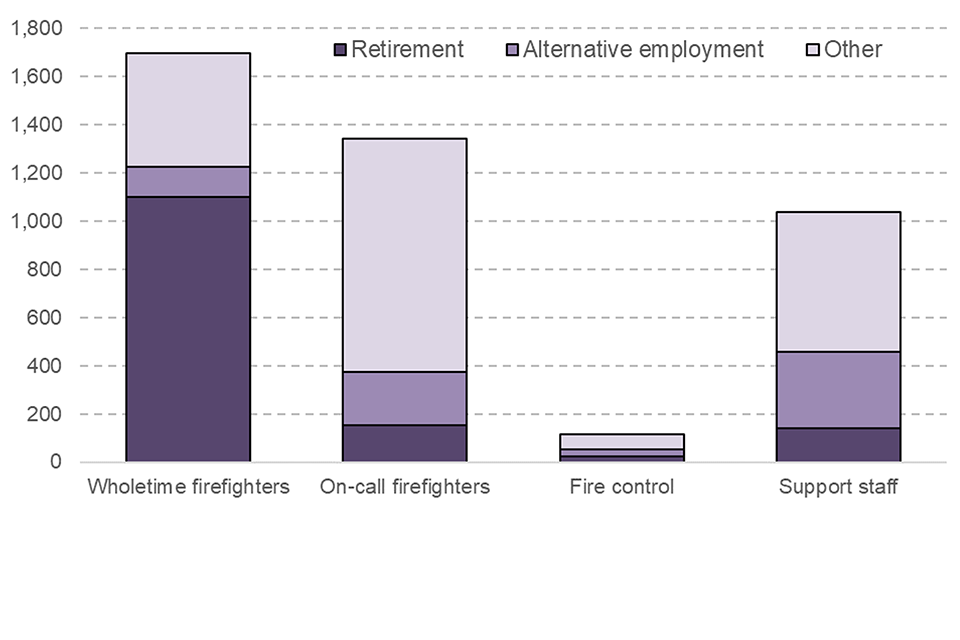
For the 4,194 staff who left FRSs in 2019-20, the most common reason for leaving was “normal” or “early” retirement (Figure 1.3), which accounted for a total of 34 per cent (1,415). This was 32 per thousand members of FRS staff. In the previous year this rate was 33 people, while five years ago the rate was 27 people. The main cause for the increase in the rate of people leaving the FRS due to retirement over the five year period is due to a decrease in the number of staff employed by the FRA, as opposed to more staff leaving due to retirement.
The second most common reason staff left FRSs in 2019-20 was ‘resignation – to take up alternative employment’, which accounted for 17 per cent (696) of those leaving. Of those whose reason for leaving was ‘resignation – to take up alternative employment’, 46 per cent were support staff and 32 per cent were on-call firefighters.
In 2019-20, 41 FRS staff left due to “ill health”, one per cent of those leaving. This was 0.9 per thousand members of FRS staff. In the previous year this rate was 1.2 people, while five years ago the rate was 1.9 people.
Figure 1.3: Total staff (headcount) leaving FRAs by reason in England, 2020
Source: FIRE1111
This stacked bar chart shows the number of staff who left FRAs in 2020 by role and whether this was retirement, resigned to take alternative employment or ‘other’. It shows that retirement is the main reason for wholetime firefighters to leave but is the smallest category for on-call firefighters, fire control and support staff.
2. Workforce diversity
This section covers information on five diversity characteristics – gender, ethnicity, age, religion and sexual orientation, for all FRS staff, those joining FRSs and apprentices. The figures in this section are taken as of 31 March 2020, except the joiners’ figures which are for FRS staff that joined during 2019-20.
Key results
As at 31 March 2020:
- 7.0 per cent (2,461) of all firefighters employed by FRAs were women compared with 6.4 per cent (2,231) in the previous year and 4.7 per cent (1,783) five years ago
- continuing the trend identified in 2018-19, for the first time since 2006, the main reason for the increase in the proportion of firefighters who are female is due to the increase in female firefighters, as opposed to a decrease in male firefighters
- 4.4 per cent (1,410) of firefighters employed by FRAs who stated their ethnicity were from an ethnic minority, compared with 4.3 per cent (1,368) in the previous year and 3.8 per cent (1,276) five years ago
- the average age of firefighters employed by FRAs was 41, the same as the previous year and five years ago
- of those who stated their sexual orientation, 3.3 per cent (872) of staff employed by FRAs were Lesbian/Gay or Bisexual, compared with 3.2 per cent (788) in the previous year and 2.7 per cent (501) five years ago
2.1 Gender
Fewer than a fifth (17.3%) of all staff employed by FRAs were women as at 31 March 2020. This is slightly higher than in previous years (16.7 per cent in 2019, 14.5% five years ago and 15.1% ten years ago).
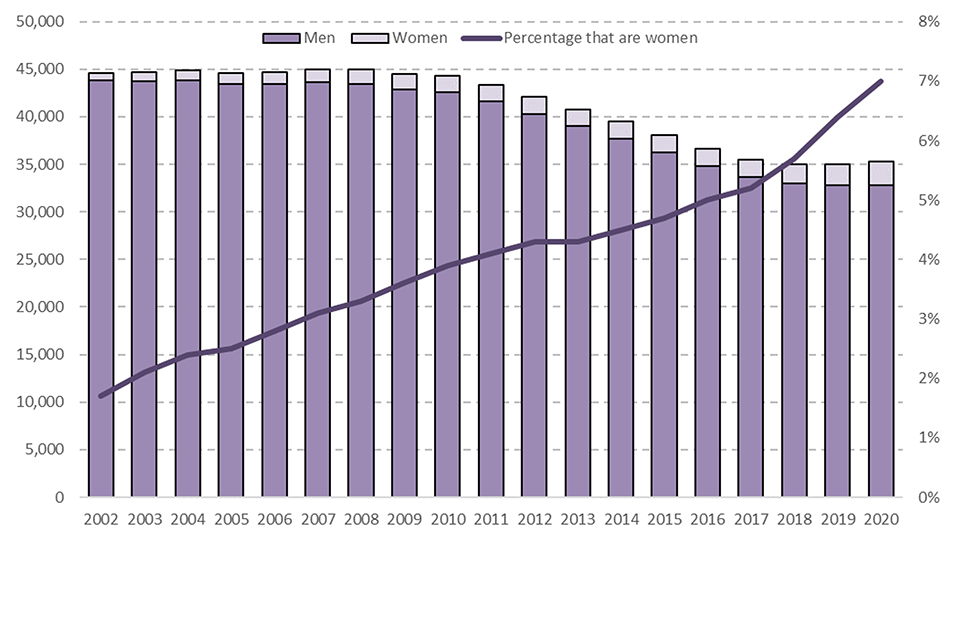
The number and proportion of women firefighters has slowly increased from 2002 (the first year for which comparable data are available). In 2002, 1.7 per cent (753) of all firefighters were women and by 2020 this proportion had reached 7.0 per cent (2,461). By comparison, the percentage of police officers in England in 2020 that were women (31%)[footnote 1] is over four times greater.
Figure 2.1: Gender of firefighters in England, 2002 to 2020
Source: FIRE1103
This chart shows the number of firefighters (by headcount) has decreased overall since 2009 and while the number of women has increased it is still a very small percentage compared with men. The chart also shows the percentage of firefighters that are women, which has slowly increased from just under two per cent to seven per cent.
For each year from 2009 to 2018, the main cause for the increase in the proportion of women firefighters was a decrease in the number of men firefighters. However, in 2019 and 2020 this changed and for the first time more female firefighters joined than male firefighters left. Since 2009, the number of women firefighters has slightly increased by 856 whilst the number of men firefighters has decreased by 10,064.
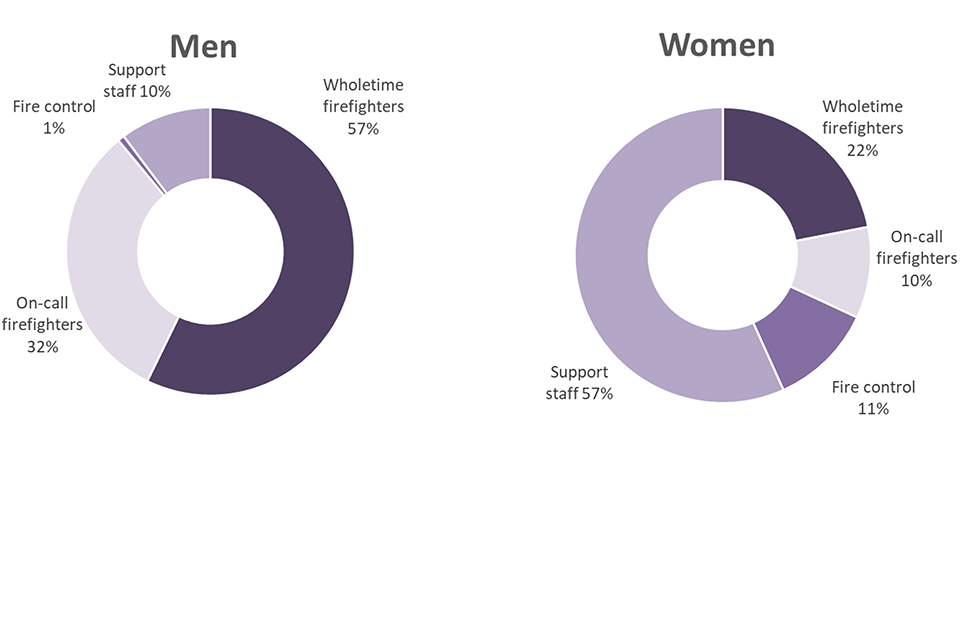
In 2020, as shown in Figure 2.2, when looking at women by role; 32 per cent were firefighters and 57 percent were support staff. In contrast, 89 per cent of all men employed by FRAs were firefighters and 10 per cent of were support staff.
Figure 2.2: Gender of staff employed by FRAs, by role in England in 2020
Source: FIRE1103
These doughnut charts show that while 89 per cent of men employed by FRAs are firefighters, only 32 per cent of women are. 57 per cent of women employed by FRAs are support staff.
Over half (53.6%) of support staff were women as at 31 March 2020. This is similar to previous years (53.2% in 2019, 52.5% five years ago and 55.6% ten years ago).
Over three-quarters (76.1%) of fire control staff were women as at 31 March 2020, compared with 77.0 per cent in the previous year, 77.0 per cent five years ago and 78.8 per cent ten years ago.
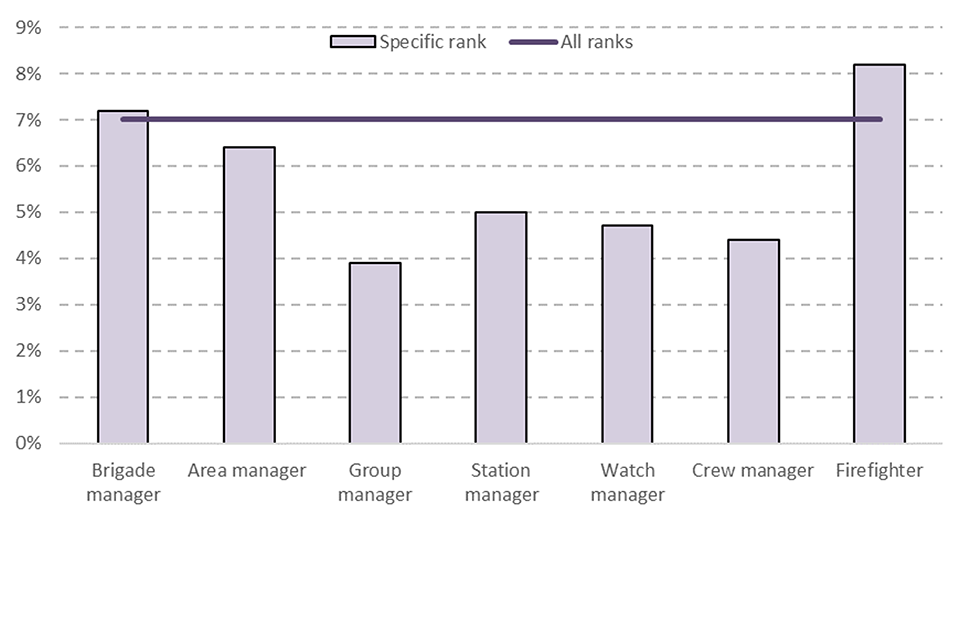
The rank of women firefighters shows a mixed story, with the top and lowest ranks (brigade managers and firefighters) showing above average proportions of women (7.2 per cent and 8.2 per cent respectively, compared with 7.0 per cent for all ranks). The middle ranks (area manager, group manager, station manager, watch manager and crew manager) all showed proportions of women lower than the average for all ranks (ranging from 3.9 per cent to 6.4 per cent).
Figure 2.3: Proportion of staff who are women, by rank in England in 2020
Source: FIRE1108
This chart shows a mixed story with the rank of women. The highest and lowest ranks (brigade managers and firefighters) show above average proportions of women. The middle ranks (area manager, group manager, station manager, watch manager and crew manager) all showed proportions of women lower than the average.
2.2 Ethnicity
All FRSs collect and provide ethnicity information to the Home Office, however, 4,502 (10.1%) of staff did not state an ethnicity in 2020. This proportion has varied between 7.2 per cent and 11.3 per cent over the past ten years. Ethnicity statistics are published at an FRS level in table 1104.
The proportion of firefighters that were from an ethnic minority group[footnote 2] has increased slowly from 3.5 per cent in 2011 (from when consistent data are available) to 4.4 per cent in 2020. This compares with 14.6 per cent of the English population in the 2011 Census[footnote 3]. The percentage of police officers in England in 2020 that are from an ethnic minority group (7.3 per cent) is over one and a half times the percentage of firefighters that are from an ethnic minority group (4.4 per cent).
From each year from 2011 to 2018, the main cause for the increase in the proportion of firefighters from an ethnic minority group was due to the decrease in white firefighters. From 2019 onwards, however, the main reason is due to an increase in the number of firefighters from an ethnic minority group (up by 75 in 2019 and 42 in 2020) as opposed to a decrease in the number of white firefighters. All four ethnic minority groups were under-represented as firefighters when compared with the general population in the 2011 Census[footnote 3].
Overall, at 31 March 2020 5.1 per cent (2,027) of all FRS staff were from an ethnic minority group, compared with 5.0 per cent in the previous year (1,980) and 4.3 per cent five years ago (1,798).
Fewer fire control staff were from an ethnic minority group (2.9%) than for firefighters. This compares with 2.5 per cent in the previous year and 3.3 per cent five years ago.
Eight per cent (586) of support staff were from an ethnic minority group, the similar to last year (8.1%) but slightly higher than five years ago (6.9%). Seventy per cent of FRS staff from an ethnic minority group were firefighters (one percentage point higher than the previous year). In comparison, 80 per cent of those with a white ethnicity employed by FRAs were firefighters (the same as the previous year).
2.3 Age
Statistics on the age of FRS staff by role are published at an FRS level in table 1105.
From 2011 to 2018 the average age of firefighters gradually increased from 40 to 42. In 2019 and 2020, however, the average age of firefighters was 41.
A third (33%,11,750) of firefighters were between 46 and 55 years of age as at 31 March 2020. This was a decrease from 35 per cent (12,125) the previous year and was 34 per cent (12,756) five years ago. These figures are higher than the 22 per cent of the resident population[footnote 4] aged 16 to 64 (and hence “working age”) who were aged 46 to 55 in June 2019.
Only four per cent (1,400) of firefighters were aged 16 to 24 as at 31 March 2020. This proportion was four per cent in the previous year (1,328) and three per cent five years ago (1,163). These figures are far lower than the 17 per cent of the resident population aged 16 to 64 (and hence “working age”) who were aged 16 to 24 in June 2019.
Experimental statistics and data quality
Statistics on religion and sexual orientation remain as experimental statistics due to some quality limitations and other issues which users should be aware of, for example:
- some FRSs do not collect these data
- the data contain a relatively high proportion of “not stated” entries; the proportion varies significantly across different FRSs, 38 per cent of data for religion and 42 per cent for sexual orientation are either not collected or not stated in 2020; therefore, the figures may not be fully representative of FRSs as a whole
- for data protection reasons we have combined or suppressed any categories with very small figures and statistics are published at an England level only; FRS level figures would require heavy suppression, greatly limiting the usefulness of many of the statistics
The statistics serve a public good in understanding the diversity of the FRS workforce, but given the current quality limitations which have not improved since last year, they are still published as “Experimental Statistics”. Experimental Statistics are statistics which are published in order to involve users and stakeholders in their development and as a means to build in quality at an early stage. Statisticians have been working with the FRSs with the highest proportions of ‘not stated’ to try to improve the data.
Although we also collect statistics on disability they are not sufficiently complete or comparable to publish at present. We are looking to improve our understanding of these statistics and the scope for improving the quality. Also, these statistics would need to be heavily suppressed as described above.
2.4 Religion (experimental statistics)
Religion statistics are published in table 1106.
Four FRSs did not provide information on religion in the datasets they supplied to the Home Office in 2020, meaning that no data were available for three per cent of staff (this compares with 27% in 2011). A further 35 per cent of all FRS staff chose to not state their religion in 2020 (broadly the same percentage as previous years). All of these responses are excluded from the calculations below.
Figures on religion of FRSs workforce are available from 2011 with firefighters stating their religion as ‘Christian’ accounting for the majority of firefighters: the proportion decreased from a peak of 62 per cent in 2012 down to 49 per cent in 2020. These compare with 59 per cent of England’s resident population in the 2011 Census identifying as ‘Christian’.
The second largest group of firefighters is those that stated they had “no religion”, generally increasing from a low of 32 per cent in 2012 to a high of 43 per cent in 2020. This compares with 25 per cent of England’s resident population in the 2011 Census.
2.5 Sexual orientation (experimental statistics)
Sexual orientation statistics are published in table 1107.
The same four FRSs that did not provide information on religion also did not provide information on sexual orientation in the datasets they supplied to the Home Office in 2020, meaning that no data were available for three per cent of staff (compared with 27% in 2011). A further 38 per cent of all FRS staff chose to not state their sexual orientation in 2020 (broadly the same percentage as previous years). All of these responses are excluded from the details reported here.
Figures are available from 2011 and have shown the proportion of firefighters that stated they were gay, lesbian or bisexual has been around three per cent in each year between 2011 and 2020.
2.6 Workforce joiner diversity
The Home Office collects information on the diversity of those joining FRSs. This was voluntary in 2016-17 but has been mandatory for the last three years.
There was a higher proportion of new joiner firefighters in 2019-20 who were women, were from an ethnic minority group or were aged 35 or under compared with the pre-existing stock of firefighters (those in post prior to 2019-20).
Overall, 25.7 per cent of new staff were women. This is greater than the current 17.3 per cent of all staff that are women and the 23.4 per cent of new joiners in 2018-19. Of new firefighters in 2019-20, 12.7 per cent were women. This is greater than the current 7.0 per cent of all firefighters that are women but similar to the 12.6 per cent of new joiners in 2018-19.
Firefighters from an ethnic minority group made up 5.5 per cent of new firefighters in 2019-20, which is greater than the 4.4 per cent of all firefighters that were from an ethnic minority group and the 5.3 per cent of new joiners in 2018-19.
Seventy per cent of new firefighters in 2019-20 were aged 35 or under, which is greater than the 29 per cent of all firefighters that were aged 35 or under but slightly lower than the 71 per cent of new joiners in 2018-19.
2.7 Apprentice diversity
This year, for the second time, the Home Office collected mandatory information on the diversity of apprentices who were employed by FRAs on 31 March 2020 and those joining in 2019-20.
There were 998 wholetime firefighter apprentices employed by FRAs in 2019-20 with 56 per cent (557) of these being new joiners.
The proportion of new wholetime firefighter apprentices who were women or who were aged 35 or under decreased from 2018-19 to 2019-20. Conversely, the proportion of new wholetime firefighter apprentices from an ethnic minority group increased over the same time period.
- 13.8 per cent of wholetime firefighter apprentices were women as at 31 March 2020, down from 14.7 per cent as at 31 March 2019
- 13.1 per cent of new joiner wholetime firefighter apprentices were women in 2019-20, down from 15.3 per cent in 2018-19
- 10.3 per cent of wholetime firefighter apprentices were from an ethnic minority group as at 31 March 2020, up from 8.1 per cent as at 31 March 2019
- 9.4 per cent of new joiner wholetime firefighter apprentices were from an ethnic minority group in 2019-20, up from 7.6 per cent in 2018-19
- 78.6 per cent of wholetime firefighter apprentices were aged 35 or under as at 31 March 2020, down from 82.8 per cent as at 31 March 2019
- 75.8 per cent of new joiner wholetime firefighter apprentices were aged 35 or under in 2019-20, down from 83.9 per cent in 2018-19
3. Firefighters’ health and safety
Key results
During 2019-20:
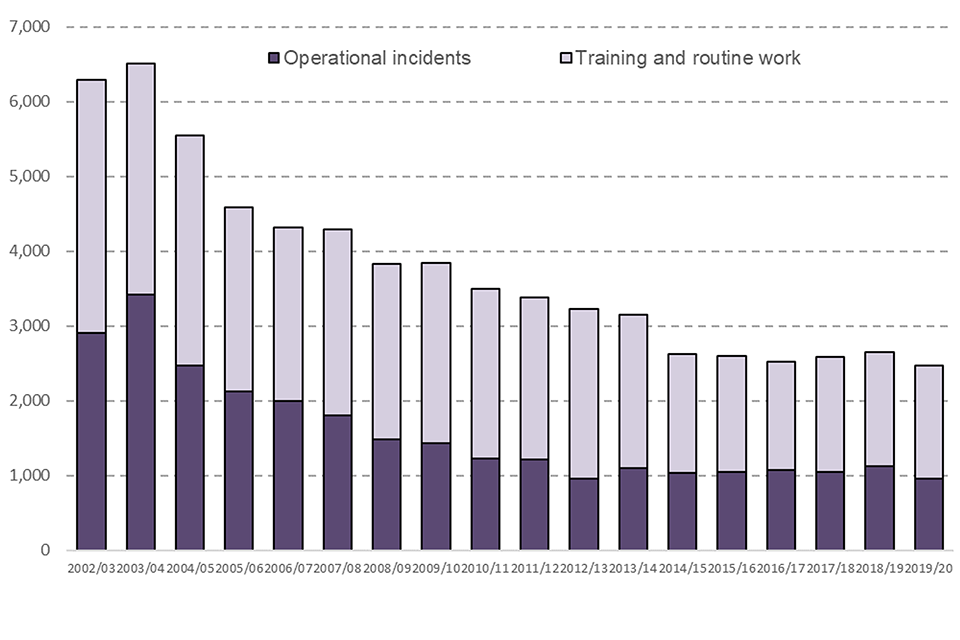
- there was a total of 2,466 firefighter injuries, seven per cent fewer than in the previous year (2,646) and six per cent lower than five years previously (2,627)
- 963 firefighter injuries were sustained during operational incidents, 15 per cent fewer than in the previous year (1,129) and seven per cent fewer than five years previously (1,073)
- 52 were classed as major injuries[footnote 5], compared with 54 in the previous year and 81 five years earlier
- there were no firefighter fatalities recorded; over the last decade there have been eight firefighter fatalities in total
Data are collected on injuries sustained by on-duty firefighters and whether they were sustained during operational incidents (at fires, road traffic collisions or at other special service incidents) or during training (operational or fitness) and routine activities. The collection asks for the total number of personnel injured, the number of ‘over seven-day injuries’, the number of RIDDOR[footnote 6] major injuries, and the number of fatalities.
Between 2003-04 and 2014-15 the number of firefighters injured was on a downward trend, partly reflecting the reduced number of incidents attended as well as other factors. Injuries decreased in both operational incidents (by more than two-thirds) and training and routine activities (by around a half). Since 2014-15 the number of injuries has plateaued at around 2,600 injuries per year then decreasing slightly to 2,466 injuries in 2019-20.
Figure 3.1: Total injuries to firefighters by activity type, England; 2002-03 to 2019-20
Source: FIRE0508
This chart shows the number of injuries to firefighters has had a decreasing trend since 2003-04, from around 6,500 in that year to around 2,500 in 2019-20. The figure has been relatively stable for the past four years. It also shows there are usually more injuries in training and routine work than in operational incidents.
4. Attacks on firefighters
Key results
In 2019-20:
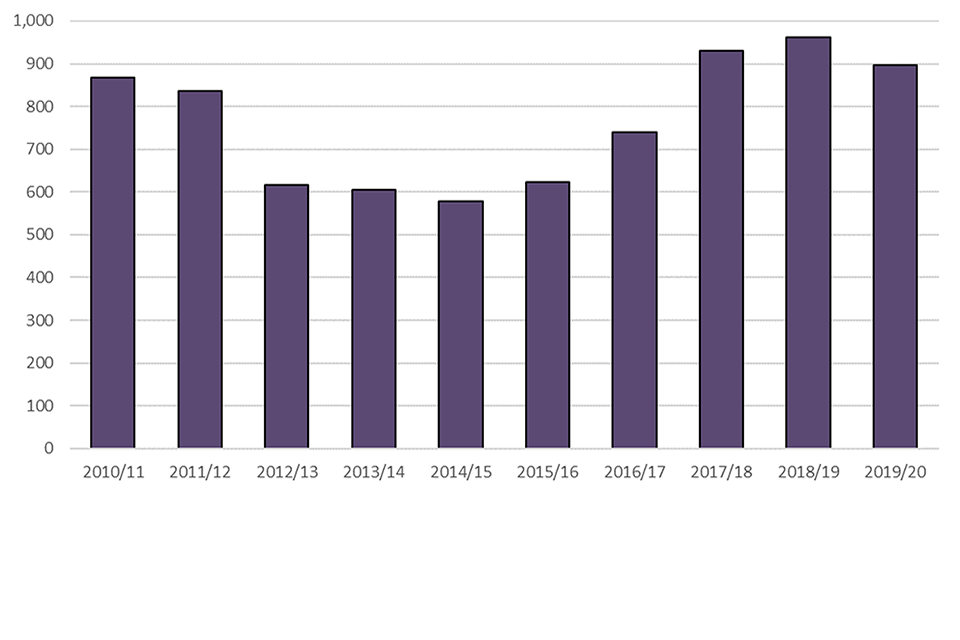
- there were 897 incidents involving an attack on firefighters, a decrease of seven per cent (64) on the previous year
- the majority of incidents involving an attack involved verbal abuse (64%, 576 incidents).
This chapter summarises the number of incidents attended by FRSs in England involving an attack on firefighters. The statistics are sourced from the Home Office’s Incident Recording System[footnote 7].
Attacks on firefighters
It should be noted that the IRS does not provide a complete picture of attacks on firefighters as it only covers incidents attended by firefighters through an emergency call. It does not cover attacks occurring on, for example, training or routine activities. In addition, it provides a count of the number of incidents that involved an attack not the number of attacks, as more than one firefighter could have been attacked at one incident. The IRS only allows one option to be coded and FRSs record the one that best describes it, so there may be an undercount of some types of attacks and it may be possible for verbal attacks to include an injury and vice versa.
Figure 4.1: Attacks on firefighters, England; 2010-11 to 2019-20
Source: FIRE0510
This chart shows the number of attacks on firefighters was relatively high in 2010-11 and 2011-12, then was relatively low from 2012-13 to 2014-15. The figure increased each year since 2014-15 until reaching a peak of 961 incidents in 2018/19, followed by a slight decrease to 897 in 2019-20.
The majority of incidents involving an attack involved verbal abuse (64%, 576 incidents in 2019-20) and a further 19 per cent involved objects being thrown at firefighters and/or appliances (169 incidents). The remaining incidents involved physical abuse (5%, 42 incidents), harassment (3%, 24 incidents) and other acts of aggression (10%, 86 incidents). These proportions were similar to those in previous years.
In 2019-20, there were 68 injuries in total from these 897 incidents. The majority (58) were classified as slight and the remaining ten as serious (requiring a hospital stay). This was an increase of two injuries (3%) on the previous year[footnote 8].
5. Firefighters’ pensions
This section provides income, expenditure and membership submitted by all 45 fire and rescue authorities (FRAs) in England. This includes data from 1 April 2019 to 31 March 2020. There are three pension schemes for firefighters: the 1992 Scheme, the 2006 Scheme and the 2015 Scheme (See full definitions).
Key results
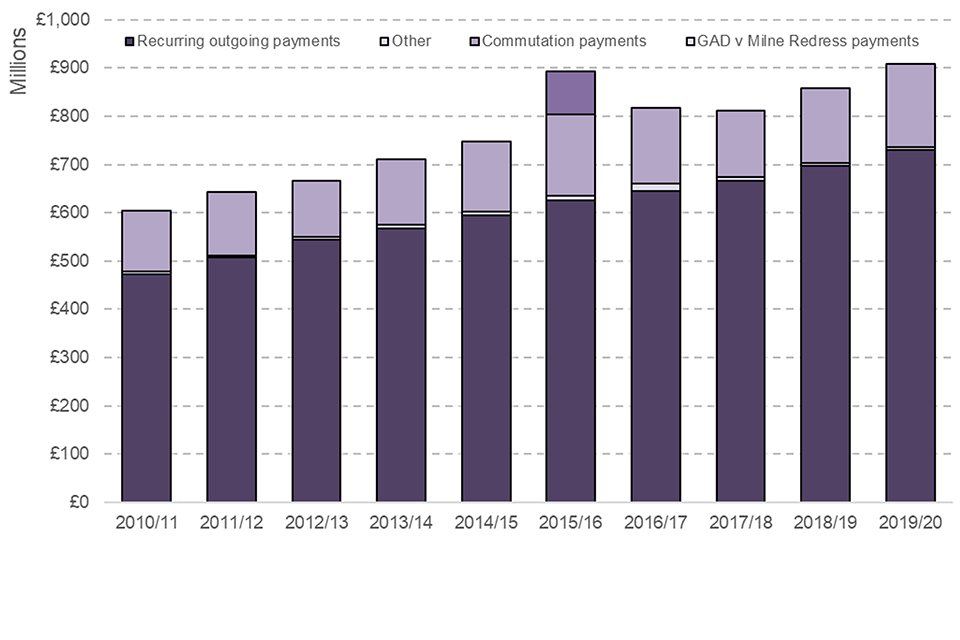
- Firefighters’ Pension Scheme expenditure in 2019-20 was around £908 million, a six per cent increase compared with the previous year (£858 million in 2018-19) and 22 per cent higher than five years previously (£747 million in 2014-15)
- in 2019-20, 80 per cent of expenditure was “recurring outgoing payments”, 19 per cent was “commutation payments”, and “transfers” and “miscellaneous expenditure” together total less than one per cent
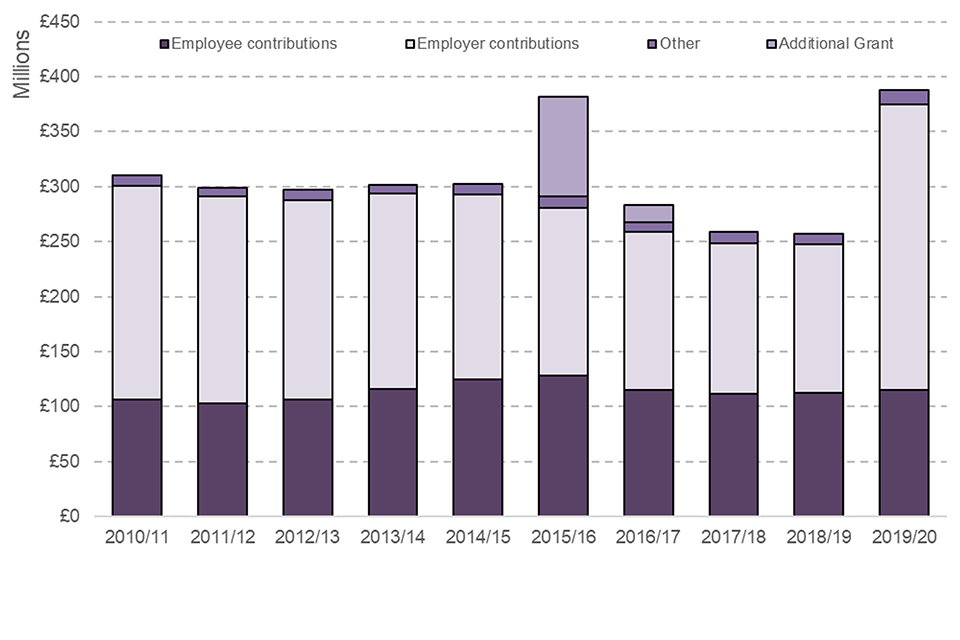
- Firefighters’ Pension Scheme income in 2019-20 was around £387.5 million, a 51 per cent increase compared with the previous year (£257 million in 2018-19) and 28 per cent increase from five years previously (£302.5 million in 2014-15)
- employer contributions nearly doubling from £135 million in 2018-19 to £260 million in 2019-20 as a result of changes to the discount rate set by HM Treasury from April 2019
- in 2019-20, 67 per cent of income was “employer contributions”, 30 per cent was “employee contributions” and the remaining three per cent comprised transfers, miscellaneous income and ill-health charges
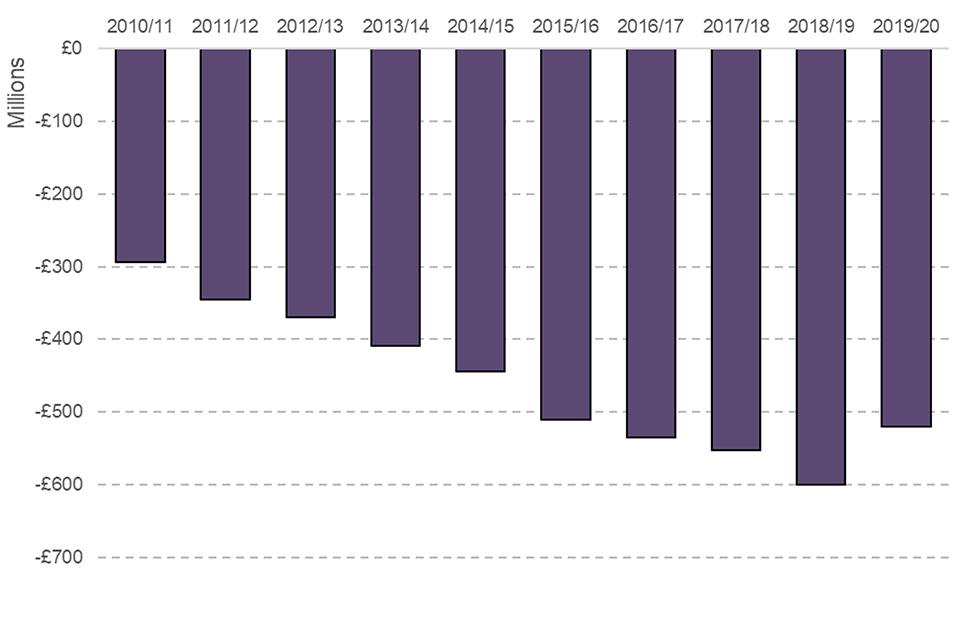
- the Firefighters’ Pension Scheme deficit in 2019-20 was around £520 million, a 13 per cent decrease compared with the previous year (£600 million in 2018-19) but a 17 per cent increase compared with five years previously (£444 million in 2014-15)
- as at 31 March 20, the total number of pensioner members was 46,228 and of these, 94 per cent (43,473) were members who have retired and were in receipt of benefits from the 1992 Scheme, down from 95 per cent on 31 March 2019.
5.1 Pension scheme expenditure and income
Pension Scheme Expenditure – the total eligible pension spend by employers in respect of their retired employees, paid directly out of their local pension fund account.
Between 2010-11, from when consistent and comparable data were collected, and 2016-17, the firefighters’ pension scheme expenditure gradually increased, with the 2016-17 total (around £820 million) 35 per cent greater than in 2010-11 (around £600 million). The only exception to the gradual increase was caused by a large redress payment[footnote 9] of £89 million in 2015-16. A slight decrease in 2017-18 was followed by two consecutive increases to around 908 million in 2019-20 (Figure 5.1).
Figure 5.1: Firefighters’ pension scheme expenditure in England, 2010-11 to 2019-20
Source: FIRE1301
This stacked bar chart shows that firefighter pension scheme expenditure has been on an upward trend from 2010-11 (the first year of the chart). There was an anomaly in 2015-16 which has a high figure because of GAD v Milne Redress payments. The chart also shows that recurring outgoing payments make the largest proportion of expenditure.
Pension Scheme Income – the cash flow paid into the local pension fund account by an employee (member of the scheme) and employer.
The Firefighters’ pension scheme income was broadly stable from 2010-11, when consistent and comparable data have been collected from, until 2014-15, at around £300 million per year. Since then, excluding the additional grant payments received by FRAs in respect of GAD v Milne and the employee contributions holiday, income decreased gradually to a series low of £257 million in 2018-19. However, in 2019-20, income increased by 51 per cent to £387.5 million, mainly due to employer contributions nearly doubling from £135 million in 2018-19 to £260 million in 2019-20 as a result of changes to the discount rate set by HM Treasury from April 2019. For more information, see the House of Commons Library ‘Public service pensions – employer contributions’ briefing.
Figure 5.2: Firefighters’ pension scheme income in England, 2010-11 to 2019-20
Source: FIRE1302
This stacked bar chart shows that firefighter pension scheme income was relatively stable from 2010/11 (the first year of the chart) to 2014-15. There was an anomaly in 2015-16 which has a high figure because of GAD v Milne Redress payments. From 2016-17 the income decreased to 2018-19. In 2019-20 there was an increase of 51 per cent, mainly due to employer contributions nearly doubling. The chart also shows that employer contributions make the largest chunk.
Pension Scheme Deficit – the annual difference in expenditure and income of the Firefighters’ Pension Fund
The Firefighters’ Pension Scheme deficit in 2019-20 was around £520 million. This was a 13 per cent decrease compared with the previous year (£600 million in 2018-19) but a 17 per cent increase compared with five years previously (£444 million in 2014-15). Between 2010-11 and 2018-19 the general trend of increasing expenditure and decreasing income led to eight consecutive increases in the firefighters’ pension scheme deficit. Although expenditure continued to increase in 2019-20, this was overtaken by the near-doubling of employer contributions to pension scheme income leading to the first decrease in deficit in the series.
Figure 5.3: Firefighters’ pension scheme total deficit in England, 2010-11 to 2019-20
Source: FIRE1303
This inverted bar chart shows that the Firefighters’ Pension Scheme Total Deficit increased every year from 2010-11 (the first year of the chart) to 2018-19. The deficit doubled in that time and in 2018-19 was at around 599 million pounds. In 2019-20, however, the deficit decreased for the first time shown to around £520 million pounds.
5.2 Pension scheme membership
The statistics on Pension Scheme membership reflect data returns submitted by all 45 FRAs in England. The information on Firefighters’ Pension Scheme membership within this release covers the three schemes in England - the 1992, 2006 and 2015 Schemes (See full definitions here). Regular firefighters employed before 6 April 2006 were eligible for membership of the 1992 Scheme, which was closed to new membership on 5 April 2006. The 2006 Scheme was introduced for regular (i.e. wholetime) and on-call (or retained) firefighters employed since 6 April 2006. A Modified Scheme was introduced in April 2014 in response to an Employment Tribunal decision in 2011 that required retained firefighters, employed during the period 1 July 2000 and 5 April 2006 inclusive, to be given access to a pension arrangement that provided similar benefits as those provided by the 1992 Scheme. Newly recruited regular and retained firefighters are now only eligible to join the 2015 Scheme which was introduced in England on 1 April 2015. The data published in this release amalgamate the 2006 and Modified Scheme membership data.
The data refer to 2016 to 2020 only. This is due to a change in the way Firefighters’ Pension Fund (FPF) forms collected data on membership, which means that data are not directly comparable with previous years.
The total number of pensioner members as at 31 March 2020 was 46,228. Of these, 94 per cent (43,473) were members who have retired and were in receipt of benefits from the 1992 Scheme, down from 95 per cent on 31 March 2019. The other six per cent were in different schemes. Pensioners are those firefighters who have retired from service and are in receipt of their pension benefits.
Fifteen per cent of deferred members were still employed as a firefighter. Deferred members include those firefighters who continue in employment but have elected to opt-out of their membership of the pension scheme, and those who have left their employment before reaching the age at which they are entitled to receive their pension benefits.
Eighty-eight per cent (20,610) of active regular members and 92 per cent (8,245) of active retained members belonged to the 2015 Scheme as at 31 March 2020. That the majority of members are in the 2015 Scheme is due to the transition of 1992 and 2006 Scheme members to the 2015 Scheme on 1 April 2015. Regular firefighter members are personnel currently employed in the role of a wholetime firefighter and who are members of one of the pension schemes and pay employee contributions based on the pensionable pay that they earn. Retained firefighter members are personnel contracted to be available for agreed periods of time for firefighting purposes, but who may also have an alternative employment and occupational pensions elsewhere.
Home Office is no longer collecting information on pension scheme membership opt-outs. For the most recent figures on these, please see Fire and rescue workforce and pensions statistics: England, April 2017 to March 2018.
Further information on fire pension scheme membership can be found in fire data tables 1304 and 1305.
6. Further information
This release contains administrative statistics about workforce and pensions for fire and rescue services (FRSs) in England. This release also contains statistics from the Home Office’s online Incident Recording System (IRS) for incidents attended by FRSs where there were attacks on firefighters.
Fire and Rescue Incident Statistics and other Home Office statistical releases are available from the Statistics at Home Office pages on the GOV.UK website.
Data tables linked to this release and all other fire statistics releases can be found on the Home Office’s ‘Fire statistics data tables’ page. The sections above state the most relevant tables for each section. The tables can be found here: Fire statistics data tables.
Guidance for using these statistics and other fire statistics outputs is available on the fire statistics collection page, found here: Fire statistics guidance .
The information published in this release is kept under review, taking into account the needs of users and burdens on suppliers and producers, in line with the Code of Practice for Statistics. If you have any comments, suggestions or enquiries, please contact the team via email using firestatistics@homeoffice.gov.uk or via the user feedback form on the fire statistics collection page.
6.1 Revisions
The figures in this release refer to activity that occurred in the financial year 2019-20, the year up to and including 31 March 2020. The statistics published may not match those held locally by FRSs and revisions may occur in the future.
Due to a clerical error, retained firefighters were omitted from the deferred pension membership figures in table FIRE1304 for the 2018-19 release. The total deferred pension members figure for 2019 has been amended from 7,696 to 14,528.
6.2 Other related publications
Home Office publish five other statistical releases covering fire and rescue services:
- Fire and rescue incident statistics, England: provides statistics on trends in fires, casualties, false alarms and non-fire incidents attended by fire and rescue services in England, updated quarterly
- Detailed analysis of fires attended by fire and rescue services in England: focuses on fires attended by fire and rescue services across England, and fire-related fatalities and non-fatal casualties in those fires; including analyses of the causes of fires and smoke alarms ownership and operation
- Detailed analysis of non-fire incidents attended by fire and rescue services, England: focuses on non-fire incidents attended by fire and rescue services across England, including analysis on overall trends, fatalities and non-fatal casualties in non-fire incidents, and further detailed analysis of different categories of non-fire incidents
- Fire prevention and protection statistics: focuses on trends in smoke alarm ownership, fire prevention and protection activities by fire and rescue services, in England
- Response times to fires attended by fire and rescue services, England: covers statistics on trends in average response times to fires attended by fire and rescue services.
The Ministry of Housing, Communities and Local Government publish one statistical release on fire:
- English housing survey: fire and fire safety report: focuses on the extent to which the existence of fire and fire safety features vary by household and dwelling type.
Fire statistics are published by the other UK nations:
Scotland and Wales publish statistics and Northern Ireland fire statistics are published by the Northern Ireland Fire and Rescue Service.
-
The Operational Statistics data collection collects ethnicity information using five groups- White, Mixed, Asian or Asian British, Black or Black British and Chinese or Other Ethnicity. The other option is “not stated” and these responses are removed from the calculations above. ↩
-
The total resident population, not just those of working age. ↩ ↩2
-
All data related to Population estimates for the UK, England and Wales, Scotland and Northern Ireland: mid-2019. ↩
-
For a full definition please see the Fire Statistics Definitions Document. ↩
-
For full definitions of RIDDOR injuries, see the HSE online guidance. ↩
-
More information on the IRS can be found in the Fire Statistics Definitions Document. ↩
-
The figures presented in this chapter relate to incidents attended by FRSs during the period April 2019 to the end of March 2020. In response to the coronavirus pandemic, restrictions in England and Wales started from 12 March 2020 and lockdown was applied on 23 March 2020, which imposed strict limits on daily life. The start of the restrictions and the first eight days of lockdown are therefore captured in IRS data for the year ending March 2020. ↩
-
In May 2015, the Pensions Ombudsman’s findings in the case of Milne v the Government Actuary’s Department (GAD) meant that FRAs were required to pay commutation redress to affected members of the 1992 Scheme who retired between 2001 and 2006. ↩