How many people continue their stay in the UK?
Published 24 May 2019

© Crown copyright 2019
This publication is licensed under the terms of the Open Government Licence v3.0 except where otherwise stated. To view this licence, visit nationalarchives.gov.uk/doc/open-government-licence/version/3 or write to the Information Policy Team, The National Archives, Kew, London TW9 4DU, or email: psi@nationalarchives.gov.uk.
Where we have identified any third party copyright information you will need to obtain permission from the copyright holders concerned.
This publication is available at https://www.gov.uk/government/statistics/immigration-statistics-year-ending-march-2019/how-many-people-continue-their-stay-in-the-uk
Back to ‘Immigration Statistics, year ending March 2019’ content page.
This is not the latest release. View latest release.
Data in this section relate to the year ending March 2019 and all comparisons are with the year ending March 2018, unless indicated otherwise. A more detailed annual summary can be found in ‘Immigration statistics, year ending June 2018’.
This section contains data on:
- Decisions on applications for extensions of temporary stay in the UK from non-European Economic Area (EEA) nationals
- Decisions on applications for settlement from non-EEA nationals
- Residence documentation issued to EEA nationals and their family members
- Applications for British citizenship
Key findings of the test phases of the EU Settlement Scheme can be found on GOV.UK at EU Settlement Scheme private beta 1, EU Settlement Scheme private beta 2 and EU Settlement Scheme public beta testing phase report.
The Home Office will be publishing high-level progress information on the EU Settlement Scheme through monthly Official Statistics, with the first publication scheduled for 30 May 2019, and a more detailed quarterly Official Statistics publication from August 2019.
1. Extension of temporary stay in the UK
There were 189,739 main applicants granted an extension to their stay in 2018 (the latest available data by previous reason for stay). Of these:
- 26% were for work (49,556)
- 21% were for study (39,254)
- 43% were for family reasons (82,018)
- 10% were for other reasons (18,911)
Of the 189,739 extensions granted in 2018 to main applicants, 137,027 (72%) allowed the individual to stay within their original broad category of stay, with 52,712 (28%) switching to a different broad category. In 2017 a lower proportion switched (22%). The increase in the proportion who switched largely reflects a rise in those switching into the Family Life (10 year) route.
There were 47,915 extensions granted in 2018 to people who were previously students. Of these, 80% were for individuals to continue to study, 15% switched to work categories, and 4% to family categories.
Table 5: Grants of extension of stay in 20181, current broad category compared with previous broad category
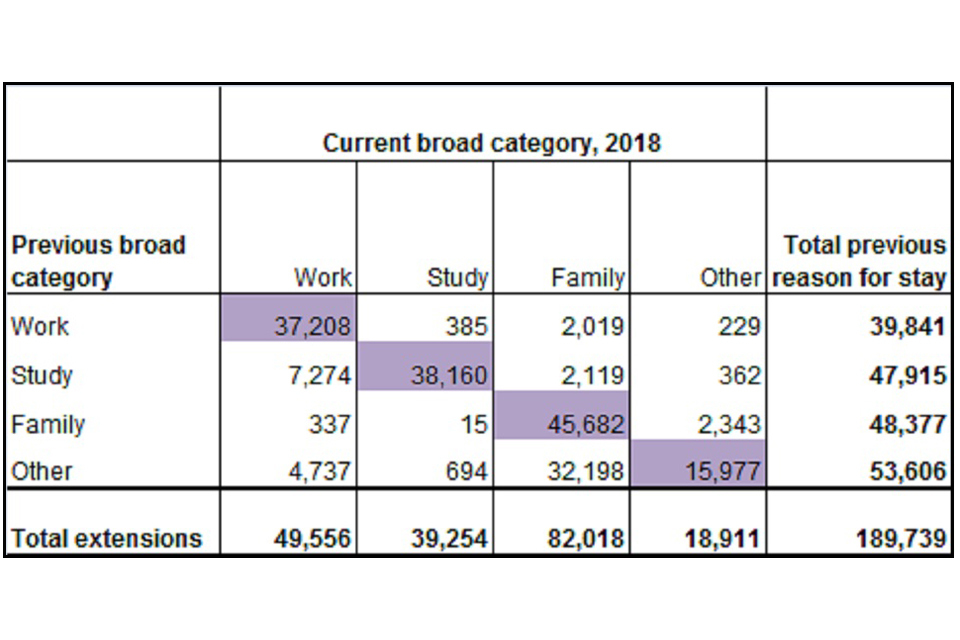
Alternative text not provided by author.
Source:
Table ex pc 01 (Extensions tables).
Table note:
- Figures exclude dependants.
2. Settlement
There were 92,636 decisions on applications for settlement in the UK in the year ending March 2019, 21% more than in the previous year. Of these, 89,146 (96%) resulted in a grant. There were increases in settlement:
- For family reasons (which more than doubled to 17,774), reflecting family rule changes in July 2012 that increased the qualifying period for settlement from 2 to 5 years. Individuals on a 5-year route to settlement following the rule change are now becoming eligible to apply (further information about the rules changes are available at: ‘Family and private life immigration rule changes 9 July 2012’)
- For work reasons (up 31% to 25,938), which was driven by an increase of 6,549 in grants to those in the Tier 2 (Skilled) work category
- Following a grant of leave to stay following an asylum claim (up 2% to 21,853) – the asylum category accounted for a quarter of settlement grants in the year ending March 2019
Settlement granted to those previously in the UK for other reasons fell by 1% to 23,581.
Table 6: Outcome of applications for settlement in the UK by reason for grant, year ending March 2019 compared with March 20181,2
| Year ending | Total decisions1 | Total grants | Work | Asylum | Family | Other2 | Refusals |
|---|---|---|---|---|---|---|---|
| March 2018 | 76,853 | 72,474 | 19,785 | 21,451 | 7,510 | 23,728 | 4,379 |
| March 2019 | 92,636 | 89,146 | 25,938 | 21,853 | 17,774 | 23,581 | 3,490 |
| Change: latest 12 months | +15,783 | +16,672 | +6,153 | +402 | +10,264 | -147 | -889 |
| Percentage change | +21% | +23% | +31% | +2% | +137% | -1% | -20% |
Source:
Table notes:
- The number of decisions in a given year can be affected by changes in casework resource allocation. Such fluctuations can be examined in more detail in the quarterly data that are available in the published Settlement tables.
- Includes grants on the basis of Long Residence and grants on a discretionary basis. Also includes a small number of cases where the category of grant has not been recorded.
Figure 9: Grants of settlement by reason, year ending March 2010 to March 2019
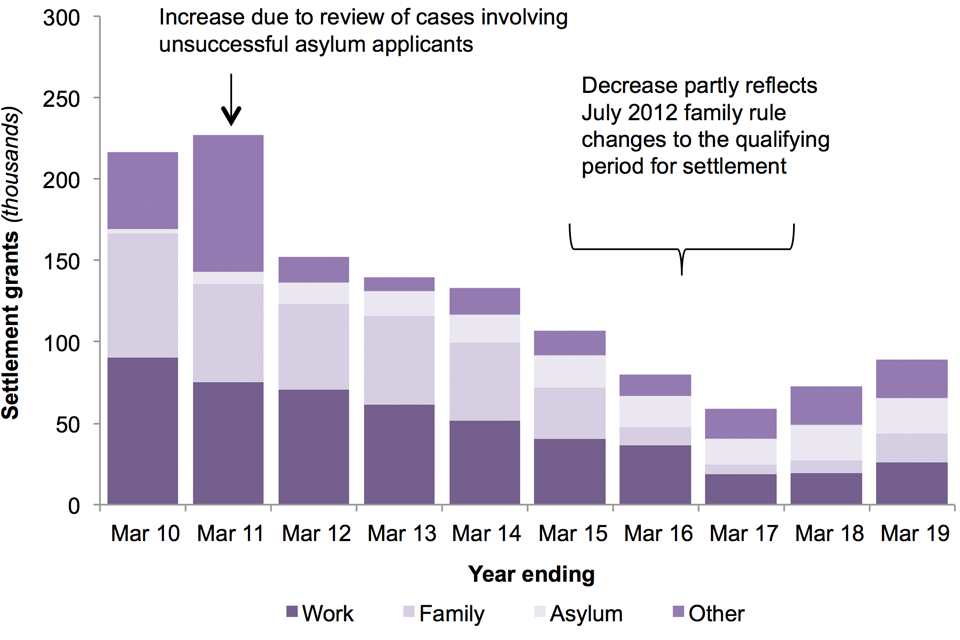
The chart shows the number of people granted settlement by reason over the last 10 years.
Source:
3. EEA nationals and their family members
Under European law, EEA nationals and their dependants do not need to obtain documentation confirming their right of residence in the UK.
EEA nationals can apply for registration certificates and documents certifying permanent residence in the UK. Their family members (who are non-EEA nationals) can apply for residence and permanent residence cards. These act as confirmation of their right to stay in the UK. There is no need to apply for a residence card as a family member but it can help residence card holders prove their status.
EEA nationals only need to apply for a document certifying permanent residence if they want to either apply for British citizenship or sponsor their partner’s visa application under the Immigration Rules.
3.1 Registration certificates and registration cards
In the year ending March 2019, there were 95,900 registration certificates and registration cards issued, 15% fewer than in the previous year. This fall followed the large increases seen in the period immediately following the referendum on membership of the EU in June 2016. The current level remains higher than before the referendum.
There were 37% fewer registration certificates issued to EU nationals (down 26,777 to 45,812), while documents issued to non-EU nationals increased by 23% (up 9,412 to 50,088).
Table 7: Registration certificates and residence cards issued, top 5 increases and decreases, year ending March 2019 compared with March 20181
| Nationality | Registration certificates and residence cards issued | Change |
|---|---|---|
| India | 9,511 | +3,581 |
| Pakistan | 6,441 | +1,374 |
| Albania | 3,127 | +1,079 |
| Brazil | 5,128 | +848 |
| Ghana | 2,615 | +629 |
| Poland | 1,298 | -1,905 |
| Spain | 5,312 | -3,552 |
| Romania | 4,731 | -3,718 |
| Portugal | 7,379 | -3,739 |
| Italy | 16,199 | -8,777 |
| Total | 95,900 | -17,365 |
Source:
Table note:
- EEA, including EU, nationals are issued registration certificates while their non-EEA dependent family members are issued residence cards.
Figure 10: Number of EEA1 residence documents issued to EU and non-EU2 nationals, year ending March 2010 to March 2019
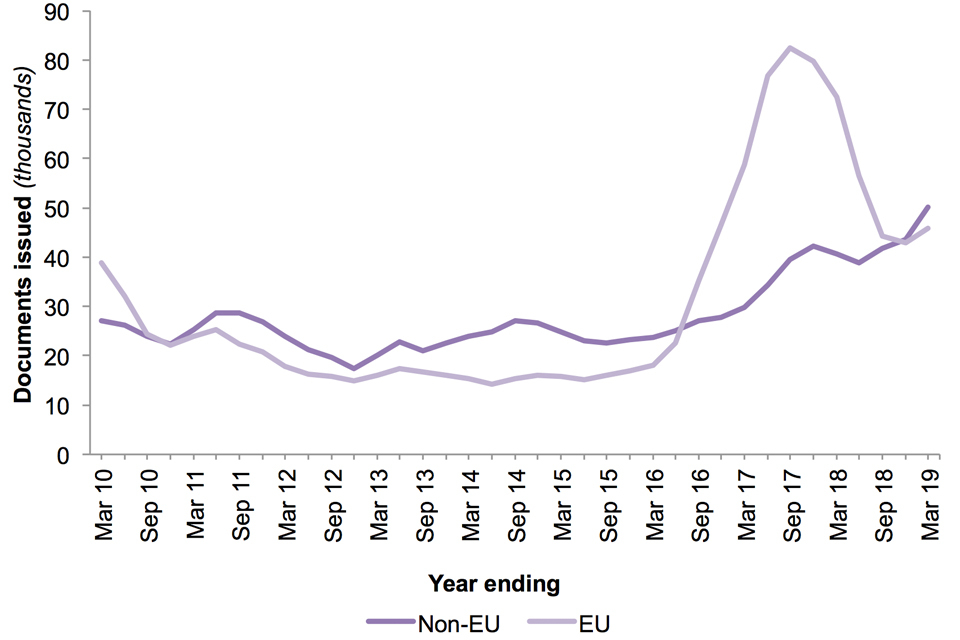
The chart shows registration certificates and registration cards issued to EEA nationals and their family members for the last 10 years.
Source: EEA table ee 02 q.
Chart notes:
- The EEA consists of the 28 countries of the EU, plus Iceland, Liechtenstein and Norway. See the user guide for a list of countries within the EU.
- Non-EU includes non-EEA family members of EEA nationals and small numbers of EEA nationals from Iceland, Lichtenstein and Norway, and Swiss nationals.
3.2 Documents certifying permanent residence and permanent residence cards
There were 98,856 documents certifying permanent residence and permanent residence cards issued in the year to March 2019, 30% fewer than the previous year.
Although having fallen since the peak of 168,406 in 2017, current levels remain considerably higher than prior to the EU referendum.
Figure 11: Number of EEA1 permanent residence documents issued to EU and non-EU2 nationals, year ending March 2010 to March 2019
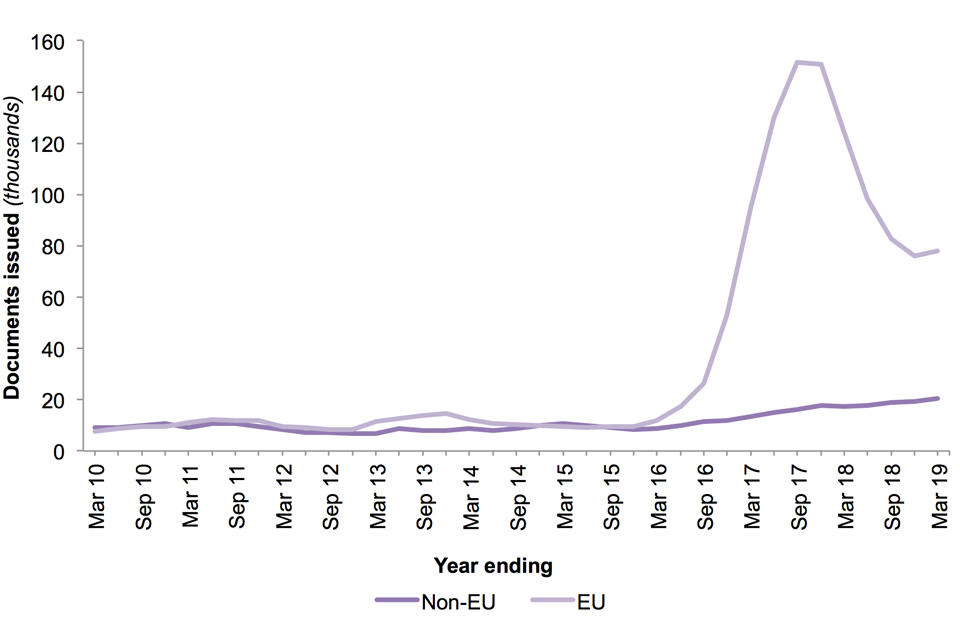
The chart shows the number of documents issued certifying permanent residence and permanent residence cards for EEA nationals and family members for the last 10 years.
Source:
Chart notes:
- The EEA consists of the 28 countries of the EU, plus Iceland, Liechtenstein and Norway. See the user guide for a list of countries within the EU.
- Non-EU includes non-EEA family members of EEA nationals and small numbers of EEA nationals from Iceland, Lichtenstein and Norway, and Swiss nationals.
4. Citizenship
There were 175,891 applications for British citizenship in the year to March 2019, 24% more than in the previous year.
In the last 12 months, applications for citizenship by EU nationals increased by 35% to 55,301. EU nationals now account for 31% of all citizenship applications, compared with 12% in 2016. Increases in citizenship applications from EU nationals in the last 2 years are likely to result from more people seeking to confirm their status following the EU referendum.
Applications made by non-EU nationals increased by 19% in the most recent year to 120,590, following falls in the previous 2 years. There was a doubling in applications for citizenship from Jamaican nationals (up 2,618 to 4,667), mainly due to applications made through the Windrush scheme (see ‘The Windrush Scheme’ for details on Windrush).
Figure 12: Applications for British citizenship from EU and non-EU nationals1, year ending March 2010 to March 20192,3
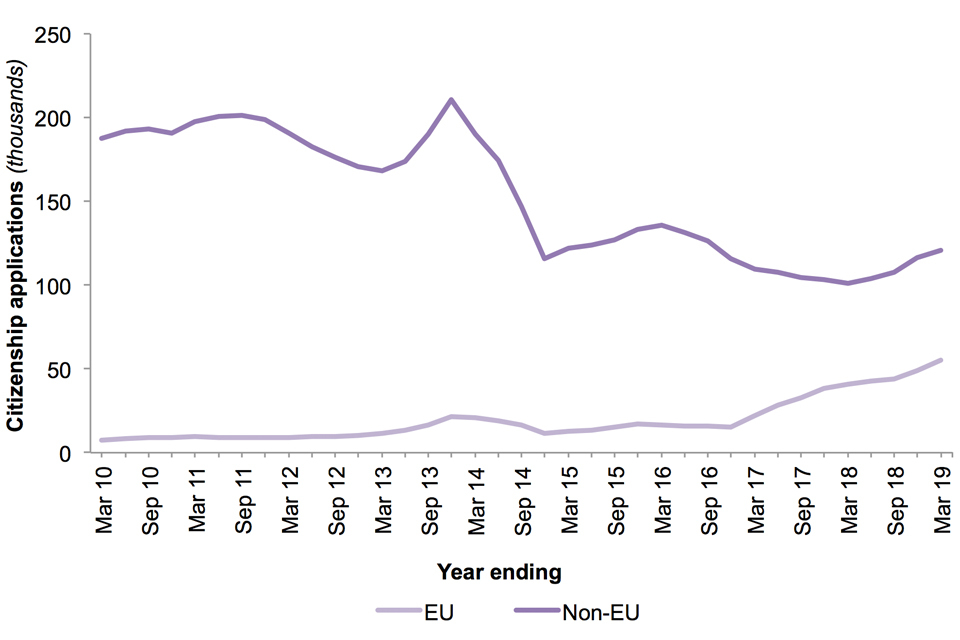
The chart shows numbers of applications for British citizenship made by EU and non-EU nationals for the last 10 years.
Source:
Chart notes:
- Series are based on current EU membership; for example, Croatians are included in the EU total throughout the time series.
- The increase in applications made in 2013 may have reflected people anticipating the rule change to the English language element of the Life in the UK test as of 28 October 2013. See the Policy and Legislative Changes Timeline for details.
- Variations in numbers of applications can be affected by policy and other changes in earlier periods.
5. Staying in the UK
In May 2019 the Home Office published the ‘Migrant Journey: 2018 report’, which explores changes in non-European Economic Area (non-EEA) migrants’ visa and leave status as they journey through the UK’s immigration system.
This analysis shows that of the migrants issued a visa in 2013, a quarter (25%) held valid leave (temporary) or settlement (permission to stay in the UK permanently) after 5 years at the end of 2018. The proportion of migrants with valid leave or settlement after 5 years has decreased for each cohort since 2004 (the earliest year examined).
1 in 6 students (16%) granted a visa in 2013 held valid leave or settlement after 5 years, at the end of 2018. Student migrants are less likely than those on other categories to have valid leave or have been granted settlement after five years. Migrants granted initial Family visas were the most likely to hold valid leave or settlement after 5 years (85%).
The proportion of Family migrants with settlement after 5 years fell markedly for migrants arriving in 2013 (44%), compared to those arriving the previous year (69%), and is close to half the proportion of those issued Family visas in 2010 (82%). This can be accounted for by the changes in July 2012 to the immigration rules for Family visas, which changed the eligibility period for settlement from 2 years to 5 years.
Of all migrants granted settlement in 2018:
- 29% had originally entered the UK on a Study visa;
- 18% on a Work visa;
- 15% on a Family visa;
- 7% on an entry clearance visa for immediate settlement;
- 3% on a Dependant joining or accompanying visa;
- 28% came to the UK for other reasons.
6. About these statistics
The statistics in this section refer to individuals who have leave to remain in the UK who wish to extend, or make permanent, their right to remain in the UK.
Data in this section should be viewed in the context of wider policy and legislative changes, which can impact the number of applications and decisions. It should also consider the availability and allocation of resources within the Home Office, which can affect the number of decisions made in a given period. For example, fewer citizenship decisions were made in 2015 when UK Visas and Immigration (UKVI) resources were used to assist HM Passport Office.
The statistics should not be used to make inferences about the size of the non-British population in the UK. The data do not show whether, or for how long, an individual remains in the UK once their right to remain has been extended or made permanent. Statistics on resident foreign populations in the UK are published by the Office for National Statistics.
6.1 Extension of temporary stay in the UK
Extensions of temporary stay in the UK relates to individuals inside the UK extending or changing the status of their right to stay in the UK. An individual is required to apply for an extension or change in status before their existing permission to enter or stay in the UK expires.
The statistics in this section show the number of grants and refusals in a given year on applications for extension of temporary stay in the UK. One individual may have made multiple applications for an extension, so may account for multiple decisions in a given period. Data in this section include dependants and take account of the outcomes of reconsiderations and appeals.
The statistics do not show the number of people applying to extend their temporary stay in the UK, nor do they show how long an individual stayed in the UK following their extension.
The statistics in the previous immigration category of students granted an extension were estimated for 2013, 2014, 2015, 2016 and 2018. The data are provisional and subject to revision.
Further information on the statistics in this section can be found in the extension section of the user guide.
6.2 Settlement
Settlement can be granted to individuals, subject to immigration control, to allow them to work, study and travel into and out of the UK without restriction. To be granted settlement, individuals generally must have lived in the UK for a certain length of time in a qualifying category. Those granted settlement can access state benefits and register their UK-born children as British citizens. It does not entitle the individual to a British passport (which requires British citizenship) or to vote in a general election (which requires British, Commonwealth or Irish Republic citizenship).
The statistics in this section show the number of grants and refusals in a given year on applications for settlement in the UK. They take account of the outcomes of reconsiderations and appeals.
The data on settlement refusals relate to cases where settlement was refused and no other form of leave was granted. Cases where settlement was refused but an extension was granted instead (for example where an individual has not met the qualifying period for settlement) will not be included in the refusal figure.
Individuals who leave the UK for more than 2 years may have their settlement status revoked, except in exceptional circumstances. The statistics do not differentiate between those granted settlement for the first time, and those granted settlement multiple times.
6.3 EEA nationals and their family members
EEA and Swiss nationals have freedom of movement throughout the EEA. Non-EEA nationals who are dependants of EEA national residents in the UK can share their residence if they satisfy certain conditions. See the user guide for details.
The statistics in this section show the number of registration certificates and registration cards issued, and the number of documents certifying permanent residence and permanent residence cards issued.
More information about applying for residence documentation and how the status of EU citizens in the UK will be secured after the UK leaves the EU is available on GOV.UK. Figures on applications received and cases currently outstanding in the European casework route (along with other information such as percentage processed within service standards) can be found in ‘In-country migration data’ on GOV.UK.
6.4 Citizenship
British citizens can live and work in the UK free of any immigration controls. They can apply for a British passport, register to vote in all forms of election and referenda, and share in all the other rights and responsibilities of their status.
Dual citizenship (also known as dual nationality) is allowed in the UK. This means people can be a British citizen and a citizen of other countries.
If someone is not already a British citizen based on where and when they were born, or their parents’ circumstances, they can apply to become one.
The statistics in this section show the number of applications for British citizenship. Data on the number of grants of citizenship are available in the associated data tables.
In May 2019 the Home Office published the ‘Migrant Journey: 2018 report’, which explores changes in non-European Economic Area (non-EEA) migrants’ visa and leave status as they journey through the UK’s immigration system.
7. Data tables
Data referred to here can be found in the following tables:
We welcome your feedback
If you have any comments or suggestions for the development of this report, please provide feedback by emailing MigrationStatsEnquiries@homeoffice.gov.uk. Please include the words ‘PUBLICATION FEEDBACK’ in the subject of your email.
See section 7 of the ‘About this release’ section for more details.