DCMS Sectors Economic Estimates (2018 provisional): Business Demographics
Published 29 May 2020

© Crown copyright 2020
This publication is licensed under the terms of the Open Government Licence v3.0 except where otherwise stated. To view this licence, visit nationalarchives.gov.uk/doc/open-government-licence/version/3 or write to the Information Policy Team, The National Archives, Kew, London TW9 4DU, or email: psi@nationalarchives.gov.uk.
Where we have identified any third party copyright information you will need to obtain permission from the copyright holders concerned.
This publication is available at https://www.gov.uk/government/statistics/dcms-sectors-economic-estimates-2018-business-demographics/dcms-sectors-economic-estimates-2018-provisional-business-demographics
This release provides estimates of the number and size of businesses within the DCMS sectors. Other economic measures, such as gross value added (GVA), employment and trade are available in separate publications. These releases enable stakeholders to evaluate the economic contribution of DCMS sectors, which are not traditional National Account sectors, and to understand how current and future policy interventions can be most effective. The DCMS sectors cover:
- Civil Society[footnote 1]
- Creative Industries
- Cultural Sector
- Digital Sector
- Gambling
- Sport
- Telecoms
- Tourism
Please note that the 2018 estimates are provisional and subject to revisions. More information is available in the Introduction.
Key Findings
- In 2018 there were 637,000 UK businesses in DCMS sectors (excluding Civil Society), representing 25.7% of the UK non-financial business economy (UKNFBE).
- The number of businesses in DCMS sectors grew 2.2% between 2017 and 2018 compared to 1.8% for the wider UKNFBE.
- Nearly 9 in 10 (88.3%) businesses in DCMS sectors (excluding Civil Society) employed fewer than 10 people, similar to the proportion for the wider UKNFBE (89.3%).
- The vast majority (99.0%) of businesses in DCMS sectors (excluding Civil Society) in 2017[footnote 2] were UK owned, similar to the wider UKNFBE (98.9%).
Contents
This release is composed of the following sections:
Chapter 1: Introduction
In June 2019, the DCMS Sector Economic Estimate series were designated as National Statistics. This affirms that the statistics have met the requirements of the Code of Practice for Statistics.
Background
Released: 29 May 2020
Geographic Coverage: United Kingdom (unless otherwise stated)
This release provides estimates for the number of businesses in DCMS sectors. These numbers are broken down by:
- The number of people employed
- The turnover generated
- The ownership status (i.e. UK- vs. foreign-owned)
- Involvement in international trade
The release also provides estimates for the number of UK business sites in DCMS sectors, by region and devolved administration.
Estimates are available for 2018 (provisional), except for the analyses by region and ownership status where only 2017 are currently available.
The Office for National Statistics (ONS) is the provider of the underlying data used for the analysis presented within this release. As such, the same data sources are used for DCMS estimates as for national estimates, enabling comparisons to be made on a consistent basis. However, please note that there was a break in ONS business survey data between 2015 and 2016[footnote 3]. Therefore, estimates of the number of businesses in DCMS sectors have not been published for reference years prior to 2016 to discourage inappropriate comparisons.
A definition for each sector is available in the associated methodology note, along with details of methods and data limitations. There is significant overlap between DCMS sectors so users should be aware that the estimate for “DCMS sectors total” is lower than the sum of the individual sectors.
Definition of Tourism within this release
The methodology used to produce estimates for Tourism within this release differs to that used in other DCMS Sector Economic Estimates releases. The DCMS GVA and Employment releases are based on results from the Tourism Satellite Account, which estimates the direct economic impact of tourism (or tourists) within the tourism industries. The Tourism Satellite Account does not currently produce estimates of the number of the number of businesses that are directly supported by tourism, hence this release is based on a “tourism industries” approach, which counts any establishment for which the principal activity is a tourism characteristic activity. As such, the estimates for Tourism within this release account for a greater proportion of the DCMS sectors (excluding Civil Society) total.
Summary
The data presented in this report on businesses:
- Are based on Official Statistics data sources.
- Are based on internationally-harmonised codes, meaning the estimates are:
- Comparable at both a national and international level.
- Comparable over time, allowing trends to be measured and monitored.
- Subject to the limitations of the underlying classifications of the UK economy. For example, the SIC codes were developed in 2007 and have not been revised since. Emerging sectors, such as Artificial Intelligence, are therefore hard to capture and may be excluded or mis-coded.
- Are based on survey data (Annual Business Survey). As with all data from surveys, there will be an associated error margin surrounding these estimates[footnote 4].
- This means that when our best estimates, from a survey based on a sample of the population suggest that the figure is 20%, the true population figure could perhaps be 18% or 22%.
- This is not an issue with the quality of the data or analysis; rather it is an inherent principle when using survey data to inform estimates.
- Are based on the most recent, reliable data and on assumptions to estimate the values where this is not possible. Whilst robust, there will likely be future revisions to account for:
- The receipt of additional data from businesses responding late to the Annual Business Survey (ABS).
- The correction of errors to existing data by businesses responding to the ABS.
How accurate are these data?
- As in all surveys, the estimates from the ABS are subject to various sources of error. Sampling errors are available for each standard industrial class. Further information on the quality of the ABS data is published by the ONS.
- The ONS ensures that published estimates are as accurate as possible. However, if significant changes are made to source data after publication, then estimates will be revised. Revisions do arise as part of the normal course of operation of the ABS, due to either the receipt of additional data from late responding businesses or the correction of errors to existing business data.
Alternative economic measures of DCMS Sectors are produced by other organisations, including DCMS’s Arm’s Length Bodies. A summary of these statistics and the varying methodologies used is available in Annex B of this report.
Chapter 2: Number of businesses
This section provides estimates of the number of UK businesses[footnote 5] in each DCMS sector. These data are from the Annual Business Survey (ABS).
Due to the way businesses are defined in this publication, the estimates do not include small businesses below the VAT or PAYE thresholds. Further information on methodology is available in the published methodology note.
As mentioned previously[footnote 6], estimates have not been published for reference years prior to 2016 due to a structural break in ONS business survey data between 2015 and 2016.
Understanding DCMS sector overlaps
For each DCMS sector, definitions were developed individually, based on internal, UK or international best practice/standards for that sector. With the exception of Civil Society, all definitions used in this release are based on the Standard Industrial Classification 2007 (SIC) codes. Some of the SIC codes were allocated into more than one sector when the sector definitions were developed. Therefore, bringing the sectors together creates overlap between them. Figure 2.1 illustrates these overlaps and how much each sector contributes to the DCMS total. Due to these overlaps adding up the individual sector business numbers would give a total greater than the actual value. When calculating the DCMS sector total, these businesses are only counted once rather than multiple times.
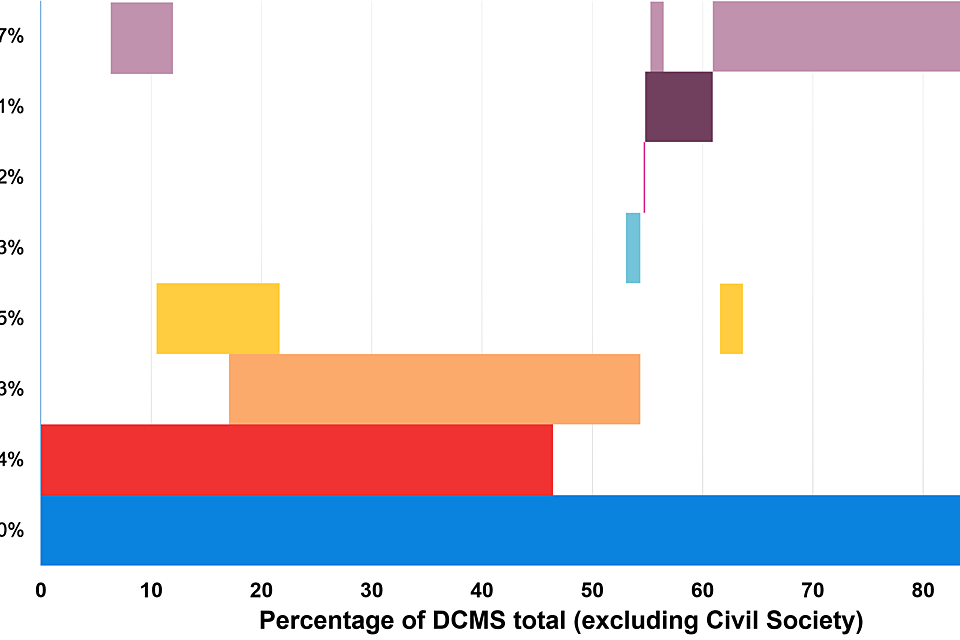
Almost all businesses in the cultural sector are also within the creative industries. The overlap between the creative Industries and the Digital sector is extensive, and the entirety of the telecoms sector sits within the latter.
(p): The estimates for 2017 are provisional i.e. based on a business’ initial return to the Annual Business Survey (ABS). They are subject to further revisions - an inherent part of the ABS process.
*: The DCMS Sector total excludes Civil Society
Chapter 2 of the methodology note illustrates the overlap between SIC codes in DCMS Sectors, but does not provide the number/proportion of businesses within these overlaps. For the overlap between sectors in terms of the number of businesses, please refer to Figure 2.1 in this document.
As shown in Table 2.2, there is substantial overlap between sectors, and growth in certain sub-sectors can drive these sectors in the same direction. Notably:
- All of the Gambling sector, 42.1% of the Sport sector, and 42.6% of the Cultural Sector overlap with the Tourism sector.
- 97.4% of the Cultural Sector and 78.8% of the Digital Sector overlap with Creative Industries.
- 63.3% of Creative Industries, 40.1% of the Cultural Sector, and all of the Telecoms sector overlap with the Digital Sector.
Table 2.2: Number of UK businesses (thousands) in multiple DCMS sectors (excluding Civil Society)
| Sector | Creative Industries | Cultural Sector | Digital Sector | Gambling | Sport | Telecoms | Tourism | Total |
|---|---|---|---|---|---|---|---|---|
| Creative Industries | 295.8 | 71.1 | 187.2 | 0.0 | 0.0 | 0.0 | 30.7 | 295.8 |
| Cultural Sector | 71.1 | 73.0 | 29.3 | 0.0 | 0.0 | 0.0 | 31.1 | 73.0 |
| Digital Sector | 187.2 | 29.3 | 237.6 | 0.0 | 0.0 | 8.4 | 0.0 | 237.6 |
| Gambling | 0.0 | 0.0 | 0.0 | 1.1 | 0.0 | 0.0 | 1.1 | 1.1 |
| Sport | 0.0 | 0.0 | 0.0 | 0.0 | 38.9 | 0.0 | 16.4 | 38.9 |
| Telecoms | 0.0 | 0.0 | 8.4 | 0.0 | 0.0 | 8.4 | 0.0 | 8.4 |
| Tourism | 30.7 | 31.1 | 0.0 | 1.1 | 16.4 | 0.0 | 297.5 | 297.5 |
| Total | 295.8 | 73.0 | 237.6 | 1.1 | 38.9 | 8.4 | 297.5 | 637.0 |
Detail on individual DCMS sectors
The DCMS sectors with the largest number of businesses in 2018 were Tourism and Creative Industries, which each made up about half of the total number of businesses in DCMS sectors (excluding Civil Society), and account for 12.0% and 11.9% of the UKNFBE respectively. Results for other DCMS sectors showed that:
- Sport was the fastest growing sector, with the number of businesses increasing by 3.1% between 2017 and 2018.
- Gambling and Telecoms were the only two sectors that saw a decrease in the number of businsses between 2017 and 2018 (down 5.0% and 0.9% respectively). However, the gambling sector is small and volatile, with this decrease only representing 52 businesses.
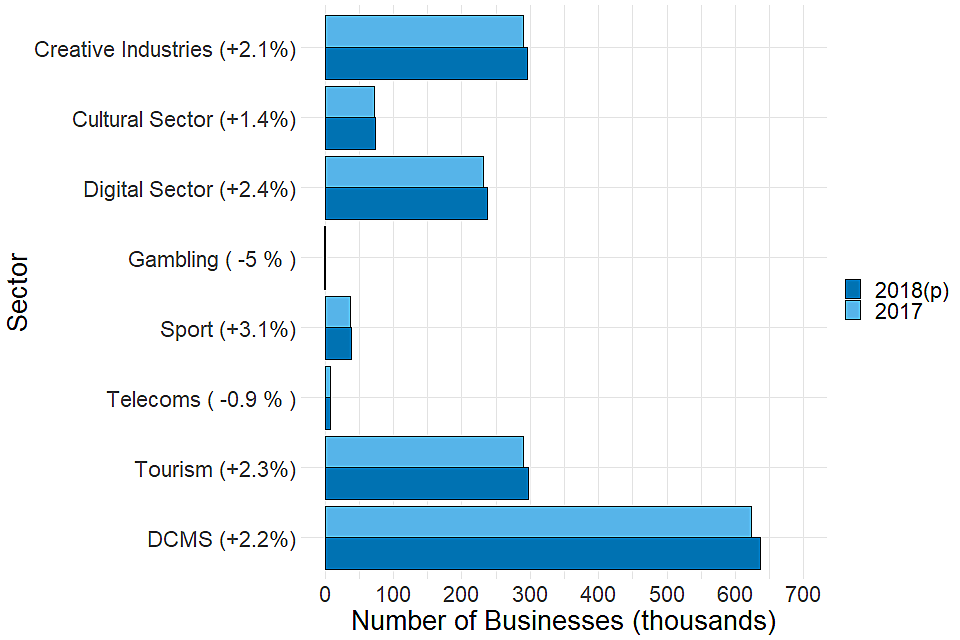
Tourism, Creative Industries, and Digital sectors had the largest number of businesses in 2018. Gambling and Telecoms had the least. Gambling and Telecoms decreased from 2017 to 2018, while all other sectors grew.
(p): The estimates for 2017 are provisional i.e. based on a business’ initial return to the Annual Business Survey (ABS). They are subject to further revisions - an inherent part of the ABS process.
Civil Society
The Civil Society organisations included in this section are:
- Charities registered with the Charity Commission of England and Wales.
- Community Interest Companies (CICs).
- Public Service Mutuals.
Due to data limitations, the Civil Society businesses not included in this section are:
- Any voluntary organisations not registered with the Charity Commission[footnote 7].
- Social enterprises[footnote 8].
The nature of Civil Society means that the data sources used to produce business estimates for the other DCMS sectors cannot be used to produce estimates for Civil Society. Estimates for elements of the Civil Society are reported here to provide context and to give an indication of the size of the sector. However, the following limitations should be noted:
- The estimates have been collated from a range of external sources and are not consistent with the estimates for other DCMS sectors presented in this release.
- The estimates do not cover all elements of Civil Society and are therefore an underestimate of the number of Civil Society organisations operating in the UK.
- The geographical coverage of the data available differs between sources.
- The methodology used for Civil Society here is different from that used to estimate GVA in current prices in the ‘DCMS Sector Economic Estimates 2018: Gross Value Added’ publication. Although the current price GVA figures did not cover the whole of Civil Society either, the methodology used was consistent with the approach to estimating GVA used for other sectors so it was possible to identify overlaps with other sectors and include them in the DCMS total.
These limitations should be taken into consideration when interpreting and comparing the findings presented here.
Summary
Data collated for individual sectors within Civil Society show there were:
- 168,200 charities registered with the Charity Commission of England and Wales.
- 15,700 CICs in the United Kingdom.
- 129 Public Service Mutuals in England.
Table 2.4: Number of organisations by Civil Society Sector
| Sub-sector | Year | Coverage | Estimated number | Source |
|---|---|---|---|---|
| Charities | 2018 (year to September 2018) | England and Wales | 168,200 | Charity Commission for England and Walesa |
| Community Interest Companies | April 2018 - March 2019 | United Kingdom | 15,700 | CIC Regulatorb |
| Public Service Mutuals | 2019 | England and Wales | 129 | DCMSc |
a: Charity Commission Annual Report, 2018-2019
b: CIC Regulator: Annual Report 2018 to 2019
c: Public Service Mutuals: State of the Sector 2019
Definitions
Charities
The Charities Act says that a ‘charity’ is an institution which:
- is established for charitable purposes; and
- is subject to the control of the High Court’s charity law jurisdiction.
Table 2.5 gives information regarding the number of charities in England and Wales at 31 December 2015-2019 (excluding linked charities[footnote 9]). These figures are taken from the Charity Commission for England and Wales.
Table 2.5: Number of Charities in England and Wales: 2015-2019
| Year | Number | Annual gross income (£000’s) | Number of large charities (annual income > £10 million) | Proportion of total income (%) |
|---|---|---|---|---|
| 2015 | 165,300 | 70,070,000 | 1,200 | 61.7 |
| 2016 | 167,100 | 73,110,000 | 1,200 | 62.2 |
| 2017 | 168,200 | 75,350,000 | 1,200 | 62.4 |
| 2018a | 168,200 | 77,404,000 | 2,300b | 72.6b |
| 2019c | Missing | 79,000,000 | Missing | Missing |
a: 2018 Data was only available until September.
b: This figure represents those with annual income > £5 million as this was all that was available for 2018.
c: Data was only partly available for 2019.
Community Interest Companies
Community Interest Companies (CICs) are limited companies which operate to provide a benefit to the community they serve. They are not strictly ‘not for profit’, however, the purpose of a CIC is primarily one of community benefit rather than private profit.
The Office of the Regulator of Community Interest Companies publishes information about all new community interest companies registered per month. In March 2019 there were 15,729 CICs in the UK.
Table 2.6: Number of CICs in the UK April 2005 to March 2019.
| Year | Approved | Dissolved | Converted | Cumulative |
|---|---|---|---|---|
| April 2005 - March 2006 | 208 | 0 | 0 | 208 |
| April 2006 - March 2007 | 637 | 0 | 0 | 845 |
| April 2007 - March 2008 | 814 | 35 | 4 | 1,621 |
| April 2008 - March 2009 | 1,120 | 86 | 2 | 2,653 |
| April 2009 - March 2010 | 1,296 | 372 | 5 | 3,572 |
| April 2010 - March 2011 | 1,824 | 483 | 7 | 4,905 |
| April 2011 - March 2012 | 2,087 | 590 | 11 | 6,391 |
| April 2012 - March 2013 | 2,055 | 765 | 11 | 7,670 |
| April 2013 - March 2014 | 2,494 | 976 | 11 | 9,177 |
| April 2014 - March 2015 | 2,569 | 1,104 | 3 | 10,639 |
| April 2015 - March 2016 | 2,727 | 1,433 | 11 | 11,922 |
| April 2016 - March 2017 | 2,812 | 1,665 | 14 | 13,055 |
| April 2017 - March 2018 | 2,844 | 1,631 | 14 | 14,254 |
| April 2018 - March 2019 | 3,217 | 1,711 | 31 | 15,729 |
Public Service Mutuals
A Public Service Mutual is an organisation which:
- has left the public sector (also known as ‘spinning out’).
- continues to deliver public services and aims to have a positive social impact.
- has a significant degree of staff influence or control in the way it is run.
It was estimated that there were at least 129 Public Service Mutuals at the end of 2019. Mutuals do not have a responsibility to inform DCMS when they launch and, therefore, this is likely to be an underestimate. A Public Service Mutual is not a legal form, therefore a large proportion of these will also be included in Community Interest Companies figures. A small number may be included in the charities figure.
Chapter 3: Size of Business
This section provides estimates of the number of UK businesses[footnote 10] in each DCMS sector (excluding Civil Society) by size. These data are from the Annual Business Survey (ABS).
Business size can be measured either as the number of employees, or the turnover (the value of sales, work done and services rendered by businesses, excluding VAT). For ease of analysis, number of employees and turnover are grouped into bands.
Due to the way the Annual Business Survey (ABS) is conducted, the estimates do not include small businesses below the VAT or PAYE thresholds. This is particularly pertinent for interpreting the results within this chapter, because it means the number and proportion of businesses in the smallest employee and turnover sizebands are likely to be an underestimate. Further information on methodology are available in the published methodology note.
Size of businesses by employment band
On the whole, businesses in the DCMS sectors (excluding Civil Society) followed a very similar size distribution to businesses in the wider UK non-financial business economy (UKNFBE) in 2018 (see Figure 3.1). The vast majority (88.3%) of businesses in DCMS sectors fell into the micro (0-9) employee sizeband. Fewer businesses in DCMS sectors (excluding Civil Society) fell into the small (10-49) and medium (50-249) employee sizebands (10.1% and 1.4%, respectively), with very few (0.3%) in the large (250+) sizeband.
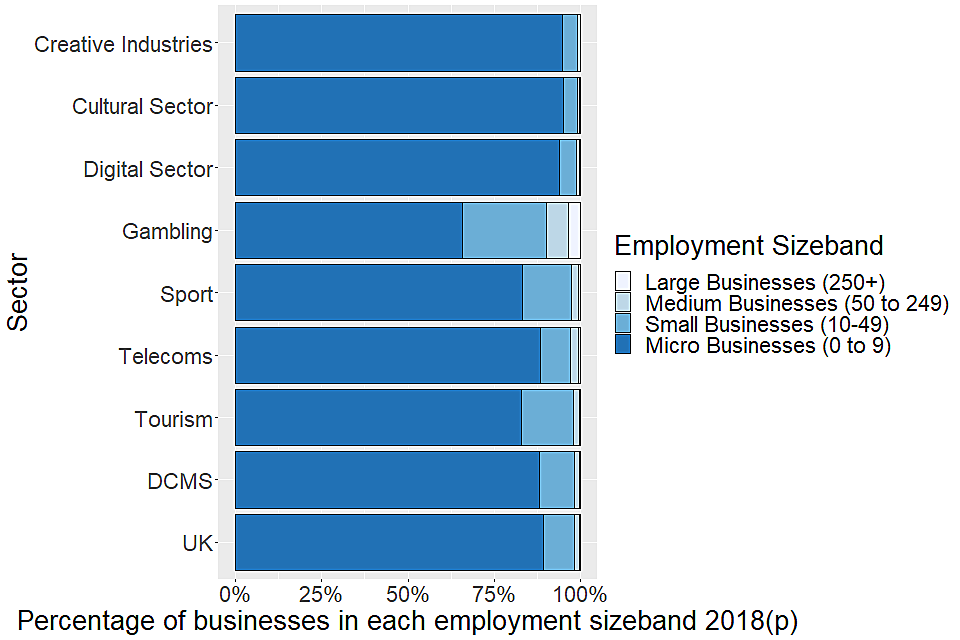
The majority of businesses in all sectors are micro businesses (0 to 9 employees), followed by small businesses (10 to 49 employees), then medium businesses (50 to 249 employees), then large businesses (above 250 employees).
a. Estimates for the Civil Society sector are not included here because they are not available on a basis consistent with the other DCMS sectors.
b. The estimates for 2018 are provisional i.e. based on a business’ initial return to the Annual Business Survey (ABS). They are subject to further revisions - an inherent part of the ABS process.
Although on the whole the size distribution of businesses in DCMS sectors (excluding Civil Society) was very similar to the wider UK non-financial business economy in 2017, some individual sectors showed different patterns:
- Creative Industries, the Cultural Sector and the Digital Sector all have greater proportions of micro businesses, alongside fewer proportions of small, medium and large than the UKNFBE average.
- Sport and Tourism have more small business than other sectors, except for the Gambling sector, which has more small, medium and large businesses than any other sector, and, conversely, fewer micro businesses.
Size of business by turnover band
Businesses in DCMS sectors (excluding Civil Society) tended to have lower turnovers then those in the wider UK non-financial business economy in 2018; a larger proportion of DCMS sector businesses occupied the lower turnover bands compared to the UKNFBE average. In 2018:
- 32.0% of DCMS sector businesses had a turnover in the range £50,000 to £99,999, compared to 27.9% for the wider UKNFBE[footnote 11].
- 19.7% of businesses in DCMS sectors were in the turnover ranges over £250,000, compared to 23.9% for the wider UKNFBE.
In general, there was a decrease in the proportion of businesses in DCMS sectors in turnover bands above £100,000 p.a. and an increase in the proportion of businesses in turnover bands under £100,000 p.a. between 2017 and 2018. In comparison, the distribution of businesses in the wider UKFNBE across the turnover bands was relatively stable between 2017 and 2018.
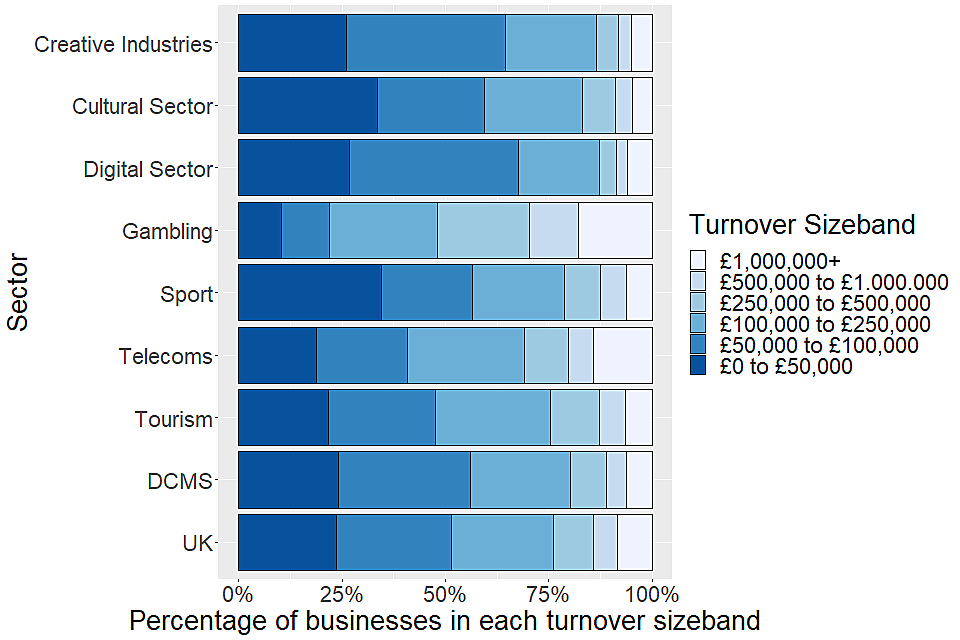
Most DCMS sectors had similar numbers of businesses in the lowest three turnover size bands (£0 to £50 k, £50 k to £100 k, and £100 k to £250 k). Less than a quarter of businesses were in the larger size bands, except for in the Gambling sector.
a. Estimates for the Civil Society sector are not included here because they are not available on a basis consistent with the other DCMS sectors.
b. The estimates for 2018 are provisional i.e. based on a business’ initial return to the Annual Business Survey (ABS). They are subject to further revisions - an inherent part of the ABS process.
The proportion of total sector turnover accounted by business in each turnover and employment sizeband is shown in Figures 3.3 and 3.4. Businesses in the largest employment band accounted for over 40.0% of total turnover in all sectors, but were fewer than 4.0% of all the businesses in any sector. The proportion of total turnover accounted for by the largest businesses was greater for DCMS sectors (57.4%) than the UK average (51.4%).
The sectors with the largest disparities between the proportion of businesses in the largest employment sizeband and the proportion of total turnover generated were Telecoms and Tourism, with businesses in the largest employment band accounting for 78.0% and 62.0% of the total turnover, but only 0.6% and 0.4% of the total number of businesses, respectively. The sector with the lowest proportion of turnover caused by the largest employment band was Creative Industries, with 43.6% of sector turnover generated by 0.1% of the sector’s businesses.
This distribution of turnover by employment band remained relatively stable for DCMS sectors and the UK as a whole between 2017 and 2018, with small fluctuations between -0.6% and +0.6%. Individual sector differences were larger, with the largest decrease within the Sport Sector for micro businesses at 3.6 percentage points, and the largest increase within the Cultural Sector for large businesses at 1.4 percentage points.
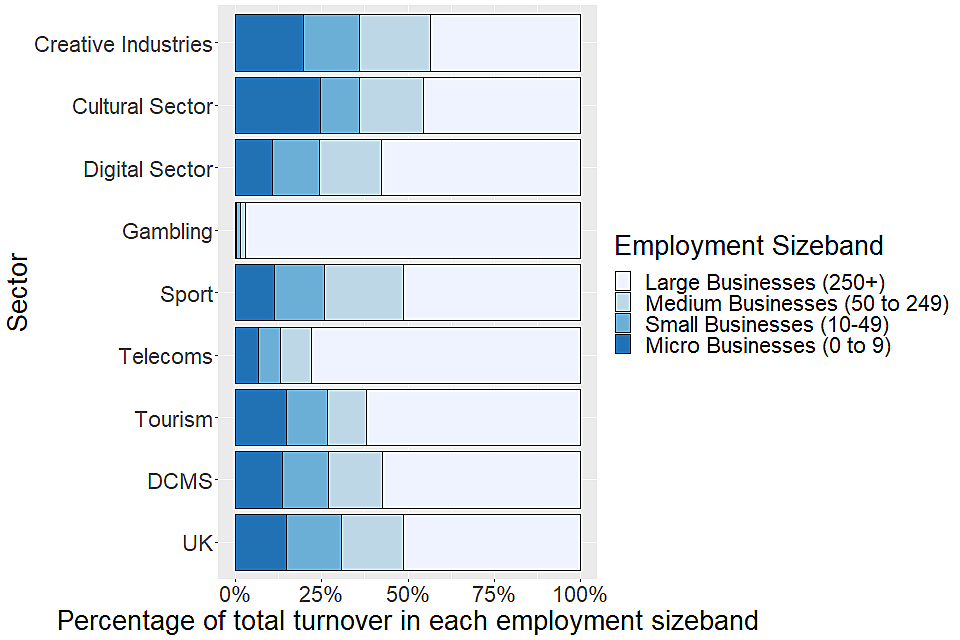
Figure 3.3: Percentage of each sector’s turnover by employment sizeband for all DCMS sectors (excluding Civil Society) and the wider UK non-financial business economy: 2018(p)
a. Estimates for the Civil Society sector are not included here because they are not available on a basis consistent with the other DCMS sectors.
b. The estimates for 2018 are provisional i.e. based on a business’ initial return to the Annual Business Survey (ABS). They are subject to further revisions - an inherent part of the ABS process.
Businesses with turnover over £1,000,000 accounted for the vast majority of turnover within each sector in 2018 (89.3% of DCMS sector businesses and 91.6% of businesses in the wider UKNFBE). The Gambling and Telecoms sectors had the highest proportion of total sector turnover accounted for by high turnover businesses at 99.7% and 98.1% respectively, the Sport sector the lowest at 85.3%. These patterns were consistent with the prior year, showing very little change.
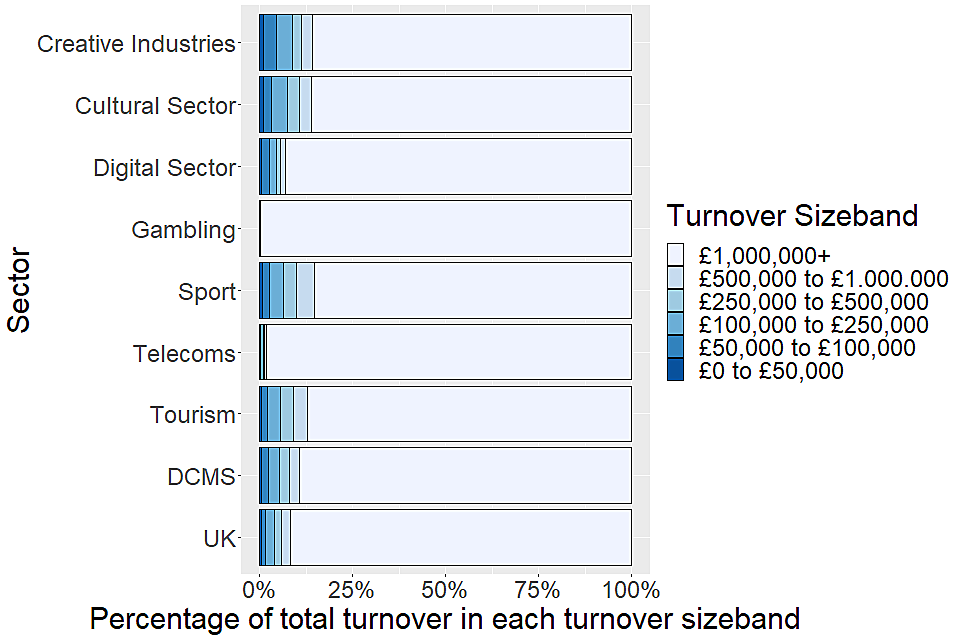
Businesses in the highest turnover band (£1,000,000+) account for the majority of turnover within all DCMS sectors, with this pattern being the most extreme for the Gambling and Telecoms sectors.
a. Estimates for the Civil Society sector are not included here because they are not available on a basis consistent with the other DCMS sectors.
b. The estimates for 2018 are provisional i.e. based on a business’ initial return to the Annual Business Survey (ABS). They are subject to further revisions - an inherent part of the ABS process.
Charities
Data for charities are available for 2018[footnote 12] by income bracket, shown below in Table 3.5. The income of charities is typically small, with those under £100,000 annual income representing 73.3% of all charities.
Table 3.5: Number of charities in each income bracket in 2018
| Annual Income Bracket | Number of charities | Percentage of total (%) | Annual income (£000’s) | Percentage of total income (%) |
|---|---|---|---|---|
| £0 to £10,000 | 65,176 | 38.8 | 21,600 | 0.3 |
| £10,001 to £100,000 | 58,054 | 34.5 | 207,100 | 2.7 |
| £100,001 to £500,000 | 22,484 | 13.4 | 494,100 | 6.4 |
| £500,001 to £5,000,000 | 9,355 | 5.6 | 1,400,000 | 18.1 |
| over £5,000,000 | 2,263 | 1.3 | 5,617,600 | 72.5 |
| Sub-Total | 157,332 | 93.6 | 7,740,400 | 100.0 |
| Not yet known | 10,854 | 6.4 | 0 | 0.0 |
| Total | 168,186 | 100.0 | 7,740,400 | 100.0 |
Chapter 4: Regional distribution of business sites
This section provides information on the number of business sites across the UK[footnote 13]. Data are available for 2017. The reason for the additional lag in the regional data compared to the national data is due to the publication schedule for ABS results. The lag is not indicative of any quality issues with the regional data, it simply reflects the usual ABS publication cycle.
Summary
Of the 696,000 business sites in DCMS sectors (excluding Civil Society), almost a quarter (24.3%) of these were located in London, compared to 19.1% of the wider UKNFBE. Creative Industries, the Cultural Sector, and the Digital Sector account for much of this different, having 33.5%, 42.4%, and 30.1% of their respective businesses located in London. DCMS sector businesses also have a high proportion of business sites in the South East of England (16.3%) and the East of England (9.2%). This pattern was less extreme for business sites in the Gambling, Sport and Telecoms sectors, which were more regionally dispersed. DCMS sectors accounted for the smallest proportion of business sites in Northern Ireland, with only 1.8% of non-financial business sites belonging to DCMS sectors (excluding Civil Society). All other regions sat between 2.5% and 16.3%.
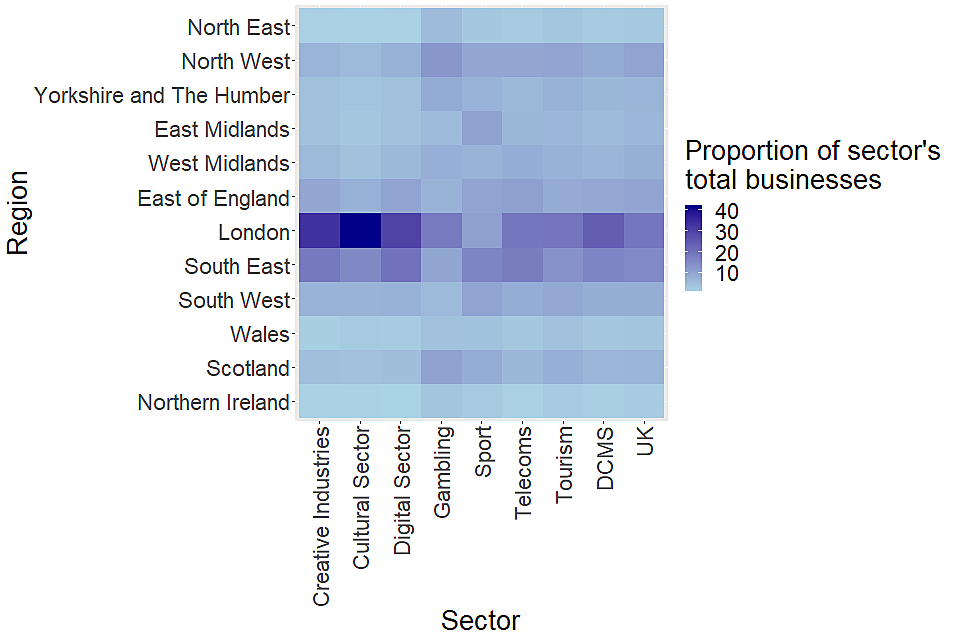
Figure 4.1 Regional distribution of business sites in DCMS sectors (excluding Civil Society)a and the wider UKNFBE: 2017
a: Estimates for the Civil Society are not included here because they are not available on a basis consistent with the other DCMS sectors.
Civil Society
Regional data for community interest companies (CICs) is shown below in Table 4.2. The regional distribution of CICs largely follows that of DCMS sector businesses, with the highest proportions in London and the South East (15.1% and 12.8%, respectively). Northern Ireland had the lowest share of the national total (2.1%). The vast majority (87.9%) were in England (compared to 88.2% of DCMS sector businesses).
Table 4.2: Regional distribution of CICs across the UK 2018/2019
| Region | Number | Percentage of UK (%) |
|---|---|---|
| East Midland | 896 | 5.7 |
| East of England | 1,201 | 7.6 |
| London | 2,376 | 15.1 |
| North East | 760 | 4.8 |
| North West | 2,002 | 12.7 |
| South East | 2,012 | 12.8 |
| South West | 1,975 | 12.6 |
| West Midlands | 1,604 | 10.2 |
| Yorkshire and the Humber | 1,000 | 6.4 |
| Northern Ireland | 333 | 2.1 |
| Scotland | 1,000 | 6.4 |
| Wales | 570 | 3.6 |
| England Total | 13,826 | 87.9 |
| UK Total | 15,729 | 100.0 |
Chapter 5: Foreign ownership and trade
This chapter presents information on the number of businesses in DCMS sectors (excluding Civil Society) by ownership status (UK-owned vs foreign-owned) and the number which are involved in international trade.
Business by ownership status
The ownership status of a business can be determined by the nationality of its parent. Where control of the business is shared, country of ownership is determined by the country of residence of the majority ultimate owner. Where businesses do not belong to an enterprise group (and are therefore not under the control of another institutional unit) they have been classified as UK-owned. The latest data available are for 2017. The reason for the additional lag in these data compared to the national data is due to the publication schedule for ABS results. Whilst provisional national figures for a given reference year (e.g. reference year 2018) are published in the November of the following year (i.e. November 2019), results by ownership status are not published until the following summer (i.e. Summer 2020). The lag is not indicative of any quality issues with the data, it simply reflects the usual ABS publication cycle.
In 2017, the vast majority of businesses (99.0%) in DCMS sectors (excluding Civil Society) were UK-owned, with the remaining 1.0% being foreign-owned. This was similar to the wider UK non-financial business economy (UKNFBE), where 98.9% of businesses were UK-owned. However, of the businesses which were foreign-owned, those in DCMS sectors were less likely to be EU-owned compared to the non-financial economy average. Of foreign-owned businesses in DCMS sectors, 36.8% were EU-owned, compared to 41.4% in the wider UKNFBE.
The DCMS sectors with the highest instance of foreign-ownership in 2017 were Gambling (3.6% of the sector’s businesses were foreign-owned) and Telecoms (2.9% foreign-owned). By comparison, only 0.5% of businesses in the Sport Sector and 0.7% in the Tourism sector were foreign-owned. The DCMS sector with the largest number of foreign-owned businesses was the Digital Sector. Within the Digital Sector, 3,700 businesses were foreign-owned businesses, accounting for 57.8% of foreign-owned businesses in DCMS Sectors overall, and 14.2% of foreign-owned businesses in the wider UK non-financial business economy.
Business by involvement in international trade
Results around involvement in international trade are based on a question in the Annual Business Survey which asks enterprises whether they have either purchased (imported) or provided (exported) goods and/or services to individuals, businesses or other organisations based outside the UK. Enterprises are said to be trading internationally if they have exported and/or imported services and/or goods. Data are available for 2017 and 2018. Please be aware that the following section covers enterprises in Great Britain only (i.e. results for enterprises in Northern Ireland are not included).
In 2018:
- 14.0% of enterprises in the DCMS sectors (excluding Civil Society) engaged in international trade. This was similar to the average for the non-financial business economy of Great Britain (GBNFBE) as a whole (13.9%).
- 65,800 DCMS sector enterprises were engaged in exporting (this represents 10.5% of the DCMS business population of Great Britain overall).
- 59,000 DCMS sector enterprises were engaged in importing (or 9.4% of the total DCMS business population). This pattern was the opposite to that of the wider GBNFBE, with 9.6% of enterprises engaged in exporting and 10.0% of enterprises engaged in importing.
- 41.2% of the DCMS sector enterprises involved in international trade engaged in both exporting and importing (5.8% of all DCMS enterprises), compared to 40.2% for the wider GBNFBE (5.6% of all GBNFBE enterprises).
- Despite a small absolute decrease of 600 in enterprises that engaged in importing, and an increase of 3,000 in DCMS enterprises that engaged in exporting, the proportions of enterprises that engaged in this remained relatively stable between 2017 and 2018 at 9.7% and 10.3% for importing and exporting respectively in 2017, and 9.4% and 10.5% for importing and exporting respectively in 2018.
- The DCMS sectors with the highest and lowest proportions of enterprises trading internationally in 2018 were the Cultural Sector (23.1% were exporters and/or importers), and the Tourism sector (7.0% were exporters and/or importers).
- There were significant changes in the Gambling sector, with 100 (10.0%) of enterprises being exporters and/or importers in 2018, compared with less than 50 enterprises total in 2017, meaning the proportion was not reported. The proportion of the telecoms sector that were importers and/or exporters also fell from 27.7% in 2017 to 15.9% in 2018.
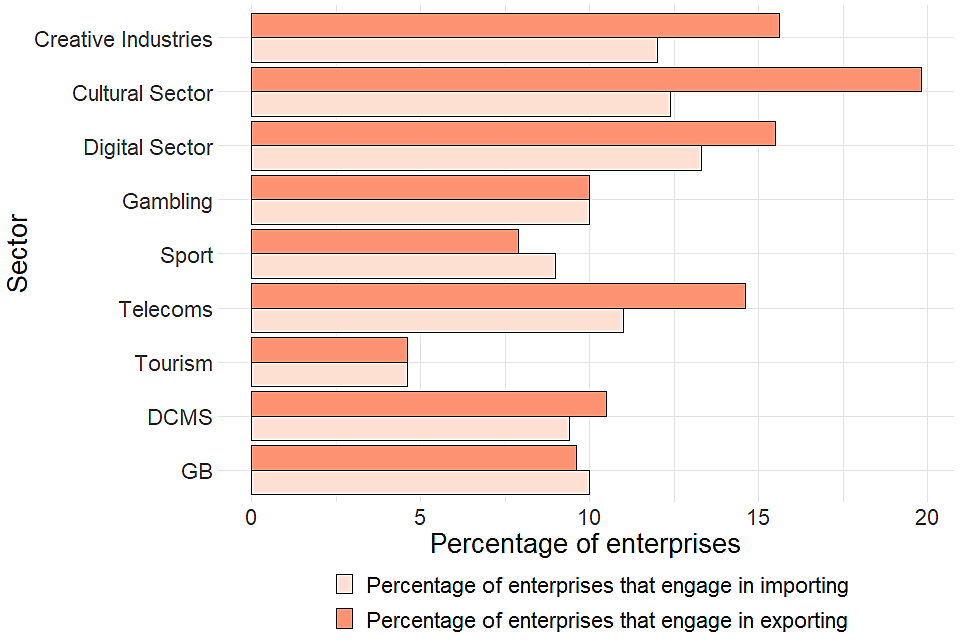
Figure 5.1: Percentage of enterprisesa which are exporters or importers for all DCMS sectors (excluding Civil Society)b and the wider non-financial business economy of Great Britain: 2018(p)c
a: These percentages are based on underlying data which is rounded to the nearest 100.
b: Estimates for the Civil Society sector are not included here because they are not available on a basis consistent with the other DCMS sectors.
c: The estimates for 2018 are provisional i.e. based on a business’s initial return to the Annual Business Survey (ABS). They are subject to further revision- an inherent part of the ABS process. </sup>
Chapter 6: Next Steps
DCMS have developed a suite of economic estimates which help support policy and understand the economic impact our sectors have on the UK economy. The estimates of business numbers and characteristics in this release are expected to be used by customers both within and outside the government. In combination with other economic indicators, estimates of business numbers help build a comprehensive picture of the UK economy, and of the DCMS Sector’s importance within it.
Upcoming work in the DCMS Economic Estimates series includes:
- Trade of DCMS sector businesses.
- Earnings of those working in DCMS sectors.
The date for these publications will be announced via the DCMS statistical release calendar nearer the time.
Feedback and consultation
DCMS aims to continuously improve the quality of estimates and better meet user needs. We encourage our users to engage with us so that we can improve our statistics and identify gaps in the statistics that we produce. If you would like to comment on these statistics or have any enquiries on the statistics please get in touch at evidence@culture.gov.uk.
Annex A: Definitions and Limitations
This annex outlines the definitions used within Economic Estimates: Business Demographics and the limitations of the data.
Definition of a business
Within this release, a business is defined as any Reporting Unit held on the Inter Departmental Business Register (IDBR). A business is held on the IDBR if it is registered for Value Added Tax (VAT) with HM Revenue and Customs (HMRC), registered for a Pay As You Earn (PAYE) scheme with HMRC, or an incorporated business registered at Companies House. Business sites are also referred to within this release - these are defined as any local units held on the IDBR. The table below[footnote 14] outlines the differences between these types of unit and another high-level grouping – the enterprise.
| Business Unit | Description | Example | Referred to in this release as |
|---|---|---|---|
| Enterprise | The smallest combination of legal units (generally based on VAT and/or PAYE records) which has a certain degree of autonomy. An enterprise carries out one or more activities at one or more locations, but may still be a sole legal unit. | Arcadia (who own Topshop, Topman, Dorothy Perkins and Burton among others) | “Enterprise” |
| Reporting unit | Put simply, the Reporting Unit holds the mailing address to which the survey questionnaires are sent. The questionnaire can cover the enterprise as a whole, or parts of the enterprise identified by lists of local units. | Topshop | “Business” |
| Local unit | A local unit is an enterprise or part thereof (e.g. a workshop, factory, warehouse, office, mine or depot) situated in a geographically identified place. | An individual Topshop store e.g. on a local high street or in a shopping mall | “Business site” |
In practice, in the vast majority of cases, the local unit and business unit are the same unit- only about 2% of businesses operate more than one local unit. As such, most of the time the terms ‘enterprise’, ‘business’, and ‘local unit’ may be used interchangeably.
Limitations
The estimates set out in this report are robust but there are some limitations which users should be aware of:
Sport- For the purpose of this publication the statistical definition of sport has been used. This incorporates only those 4 digit Standard Industrial Classification (SIC) codes which are predominantly sport (see methodology note Table 2.1).
DCMS also publishes estimates of sport based on the EU agreed Vilnius definition. The Vilnius definition is a more comprehensive measure of sport which considers the contribution of sport across a range of industries, for example sport advertising, and sport related construction. The methodology for the DCMS Sport Satellite Account is currently being reviewed and therefore has not been used in these estimates.
Tourism- The methodology used to produce estimates for Tourism within this release differs to that used in other DCMS Sector Economic Estimates releases. This release is based on a “tourism industries” approach, which counts any establishment for which the principal activity is a tourism characteristic activity. This differs to the direct approach used in DCMS GVA and Employment releases and the Tourism Satellite Account, which estimates the direct economic impact of tourism (or tourists) within the tourism industries. As such, the estimates for Tourism within this release account for a greater proportion of the DCMS sectors (excluding Civil Society) total. Estimates for tourism used in this publication are based on the tourism industries, rather than direct tourism only. Tourism industries are defined within Table 2.2 of the methodology note.
Heritage- The heritage sector is depicted in our estimates by one SIC code “91.03 Operation of historical sites and building and similar visitor attractions”. DCMS use Standard Industrial Classification (SIC) codes to construct these estimates, which enables international comparability as well as comparability with national estimates. As the balance and make-up of the economy changes, the international SIC codes used here are less able to provide the detail for important elements of the UK economy related to DCMS sectors. It is therefore recognised that the published estimates are likely to be an underestimate for the Heritage sector.
Office for Civil Society- The Office for Civil Society (OCS) leads cross-government work in support of the voluntary, community and social enterprise sector. Estimates have been provided in throughout report which outline the number of businesses in the different parts of the Office for Civil Society. However, this sector is not defined by SIC codes, and therefore different data sources have to be used to measure the size of this sector to the other DCMS sectors. Comparisons made between Civil Society and other sectors will not be on a comparable basis and should therefore be treated with caution.
More details of limitations are available in the methodology note.
Annex B: External data sources
It is recognised that there were always different ways to define sectors, but their relevance depends on what they are needed for. Government generally favours classification systems which are
- rigorously measured,
- internationally comparable,
- nationally consistent, and
- ideally applicable to specific policy interventions.
These are the main reasons for DCMS using SIC code based definitions for its sectors. However DCMS accept that there are limitations with this approach (see Annex A), and alternative definitions can be useful where a policy-relevant grouping of businesses crosses existing Standard Industrial Classification (SIC) codes. DCMS are aware of other estimates of DCMS Sectors. These estimates use varying methodologies and can be useful for serving several purposes, e.g. monitoring progress under specific policy themes such as community health or the environment, or measuring activities subsumed across a range of SICs. While potentially useful, the quality of the data depends on that of the evidence used to estimate the appropriate share of existing SICs. The table below shows different sources of analysis measuring the economic contribution of different DCMS policy areas from other organisations[footnote 15]. It is recognised that there will be many other sources of evidence from industry bodies, for example, which have not been included in this table. This will be developed over time to capture a wider spectrum of stakeholder’s releases.
| Sector | Sub sector | Organisation | Publication | Summary of use |
|---|---|---|---|---|
| Creative Industries | Architecture | Royal Institute of British Architects (RIBA)a | The List 19b | RIBA holds information about the number of chartered architectural practices in the UK. They publish full contact details of these practices to serve as a directory to help potential clients identify and choose an architect. The numbers differ from DCMS figures as businesses in the Architecture sub-sector may not necessarily be chartered practices. |
| Creative Industries; Cultural Sector | Crafts | Crafts Councilc | Measuring the Craft Economyd | The Crafts Council produce three figures for Craft – one matches the DCMS definition exactly, another (called ‘DCMS+’) consists of some additional SICs identified by the Crafts Council as belonging to the Crafts sector, these are then summed together to produce a total for Craft. They use business counts from the Inter-departmental Business Register, together with data from Department for Business, Energy & Industrial Strategy’s Business Population Estimates, which enables them to include businesses below the VAT/PAYE threshold. In the Crafts Council release, it is these businesses below the VAT/PAYE threshold that are referred to as micro businesses, rather than those with 0-9 employees. |
| Creative Industries; Cultural Sector | Arts | Arts Council England (ACE)e | Contribution of the arts and culture industry to the UK economyf | ACE details the number of enterprises broken down by employment sizeband in the broad industries from which the Arts and Culture Industry definition is drawn. They use similar SIC codes to DCMS’ Economic Estimates, but they use different employment bands, and draw the data from Department for Business, Energy & Industrial Strategy’s Business Population Estimates rather than from the Annual Business Survey. The analysis uses data at the 2 digit SIC level, rather than the 4 digit level, hence reporting on the broad industries from which the Arts and Culture Industry definition is drawn, rather than the Arts and Culture Industry itself. |
| Creative Industries; Cultural Sector; Digital Sector | Film, TV, video, radio and photography; IT, software and computer services | British Film Institute (BFI) | BFI Statistical Yearbook: The UK Film Economyg | BFI provides an estimate of the number of companies in the Film Industry, including the size (by turnover) and regional distributions. They use similar SIC codes to DCMS’ Economic Estimates, but rather than using results from the Annual Business Survey, they use results from the Inter-Departmental Business Register (IDBR) – the comprehensive list of businesses in the UK from which the ABS sample is drawn. Any variation in estimates from the ABS and IDBR is due to differences in the sources, sample size and the time periods during which the data are collected. The estimates derived from the ABS are National Statistics and considered by the ONS to be the more robust data. They tend to value down turnover compared to the IDBR. |
| Creative Industries; Cultural Sector | Museums, Galleries and Libraries; Museums and Galleries | Arts Council England (ACE)e | The Economic Impact of Museums in Englandh | ACE have commissioned a report which looks at the economic impact of museums in England in 2013, which includes details of the number of organisations, sites, and the average employment in each organisation. This methodology varies greatly to DCMS’ Economic Estimates. The definition of museums is much wider than is used in DCMS’ estimates, which is based on one SIC code. ACE have identified the limitations with using SIC codes for museums, namely that to be included in the official statistical surveys, the museum needs to be registered for PAYE or VAT, which means some of the small museums would not be included in these official sources. The same applies to local authority delivered museum services which would be coded under the Public Administration SIC code. As a result ACE have used a bottom-up approach of developing a database of museums in England then using various sources to identify the economic measures for each museum. This is for England and was produced in 2013 |
| Gambling | Gambling | Gambling Commissioni | Industry Statisticsj | Gambling Commission produce industry statistics twice a year covering various economic impacts, including number of businesses (betting shops, bingo premises, casinos). They use a different method to DCMS’ Economic Estimates, reflecting differences in data sources available to the Gambling Commission and their policy needs. The Gambling Commission derive their estimates from returns from their operators - it is a license requirement for operators to submit returns, so essentially the collection is a census. This has benefits over using survey data like DCMS use. In addition, the industry definition by Gambling Commission is wider. DCMS only use SIC 92 to define Gambling; however it is likely that there will be companies outside of SIC 92 included in the Gambling Commission statistics. For example, some working men’s clubs may hold a license but would not be classified under SIC 92 by virtue of their other primary activities. |
a: Royal Institute of British Architecture
b: The List 19 - Directory of Chartered Practices
c: Crafts Council
d: Measuring the Craft Economy
e: Arts Council England
f: Contribution of the arts and culture industry to the UK economy
g: BFI Statistical Yearbook: The UK Film Economy
h: The Economic Impact of Museums in England
i: Gambling Commission
j Gambling Commission, Industry statistics
Annex C: Further Information
- The next update to these statistics will be published in early 2021, following the publication of 2019 (provisional) Annual Business Survey data.
- The responsible statistician for this release is Sam Atkin. For enquiries on this release, please email evidence@culture.gov.uk.
- For general enquiries contact: Department for Digital, Culture, Media and Sport 100 Parliament Street London SW1A 2BQ
- For media enquiries, contact 020 7211 2210.
- DCMS statisticians can be followed on Twitter via DCMSInsight.
- The DCMS-Sector Economic Estimates were designed as National Statistics on 26th June 2019. This followed a report by the Office for Statistics Regulation in December 2018 which stated that the series could be designated as National Statistics, subject to meeting certain requirements.
-
Civil Society figures are not available on a basis consistent with the other DCMS sectors. Estimates for parts of the Civil Society are included throughout, but these are based on different data sources and should not be compared directly to the other DCMS sector estimates. ↩
-
Latest available data on ownership are for 2017. ↩
-
Further information available on the Annual Business Survey page at the ONS website ↩
-
Sampling error is the error caused by observing a sample (as in a survey) instead of the whole population (as in a census). While each sample is designed to produce the “best” estimate of the true population value, a number of equal-sized samples covering the population would generally produce varying population estimates. ↩
-
Within this release, a business is defined as any Reporting Unit held on the Inter-Departmental Business Register. A business is held on the IDBR if it is registered for Value Added Tax (VAT) with HM Revenue and Customs (HMRC), registered for a Pay As You Earn scheme with HMRC, or an incorporated business registered at Companies House. Prior to February 2018, we published estimates on the number of enterprises. For further information on the difference between these two units, please refer to Annex A. ↩
-
Further information is available in the Annual Business Survey (2016) publication on the ONS website ↩
-
Some charities are not required to register with the Charity Commission. This could be the case if their income is lower than £5,000, they are excepted charities (further information on gov.uk) or they are exempt (a list of exempted charities is published on gov.uk). ↩
-
In early 2016, Office for Civil Society (then part of the Cabinet Office) published the report ‘Social Enterprise: Market Trends’ (available here) using data from the BEIS (then BIS) Small Business Survey in 2014. One of the limitations of the report is the difficulty defining and identifying social enterprises within the data. In 2017, BEIS published an updated version of the report (available here) that looked at improving the method for identifying social enterprises in the UK small business population. However, a major limitation of the report is that it still only covers social enterprises in the small business population. ↩
-
Charities that are connected or have the same trustees can apply to be linked- this means they can prepare just one set of accounts and share a charity number. ↩
-
Within this release, a business is defined as any Reporting Unit held on the Inter-Departmental Business Register. A business is held on the IDBR if it is registered for Value Added Tax (VAT) with HM Revenue and Customs (HMRC), registered for a Pay As You Earn scheme with HMRC, or an incorporated business registered at Companies House. Prior to February 2018, we published estimates on the number of enterprises. For further information on the difference between these two units, please refer to Annex A. ↩
-
As mentioned previously, smaller businesses may exist that are not counted here. ↩
-
Data for 2018 was only available until September, so this represents the year until that point. ↩
-
Please note that the UK totals for number of business sites referred to in this section will differ to any references in Chapter 2 to the number of businesses in 2017 as one business may have multiple business sites. ↩
-
Information for this table was taken from the article ‘Further information about Inter-Departmental Business Register (IDBR) sources, structure and updating for publications’ on the ONS website ↩
-
Please note that organisations that provide estimates for the number of businesses in the Civil Society Sector are not included in the table to avoid repetition. ↩