United Kingdom drug situation 2019: Focal Point annual report
Updated 31 March 2021

© Crown copyright 2021
This publication is licensed under the terms of the Open Government Licence v3.0 except where otherwise stated. To view this licence, visit nationalarchives.gov.uk/doc/open-government-licence/version/3 or write to the Information Policy Team, The National Archives, Kew, London TW9 4DU, or email: psi@nationalarchives.gov.uk.
Where we have identified any third party copyright information you will need to obtain permission from the copyright holders concerned.
This publication is available at https://www.gov.uk/government/publications/united-kingdom-drug-situation-focal-point-annual-report/united-kingdom-drug-situation-focal-point-annual-report-2019
1. Overview of illicit drug use in the United Kingdom
1.1 Drug use in the general population
There are 3 general population surveys that investigate the overall prevalence of illicit drug use among adults in the UK:
- In England and Wales, the annual Crime Survey for England and Wales (CSEW) covers use in 16 to 59 year olds.
- In Scotland, the Scottish Crime and Justice Survey (SCJS) covers use in people aged over 16, and is published every 2 years.
- The All Ireland Drug Prevalence Survey covers drug use in Northern Ireland in 15 to 64 year olds and is published every 3 years.
To compare the countries of the UK, we have presented Scottish data for 16 to 64 year olds as supplied to the Focal Point by the Scottish government. Comparisons between the countries are made using these age groups, unless otherwise stated.
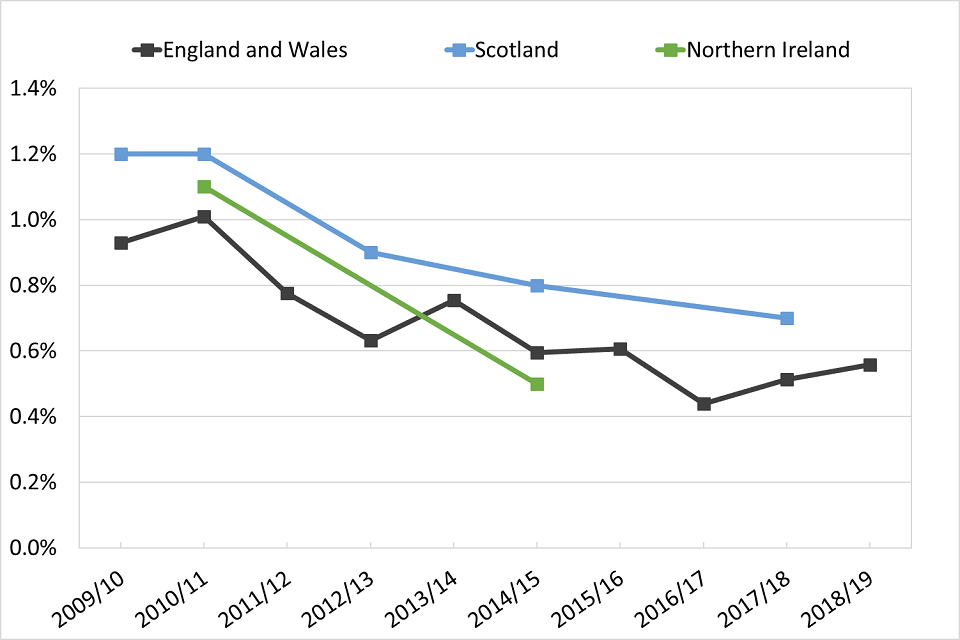
The proportion of 16 to 59 year olds in England and Wales who took drugs in the last year currently stands at 9.4%. The proportion of 16 to 64 year olds in Scotland who took drugs in the last year was 12% in 2017 to 2018, an increase from 7.6% reported in the 2014 to 2015 survey. Northern Ireland has the lowest prevalence in the UK of drug use in the last year: 5.9% of 15 to 64 year olds reported it in 2014 to 2015.
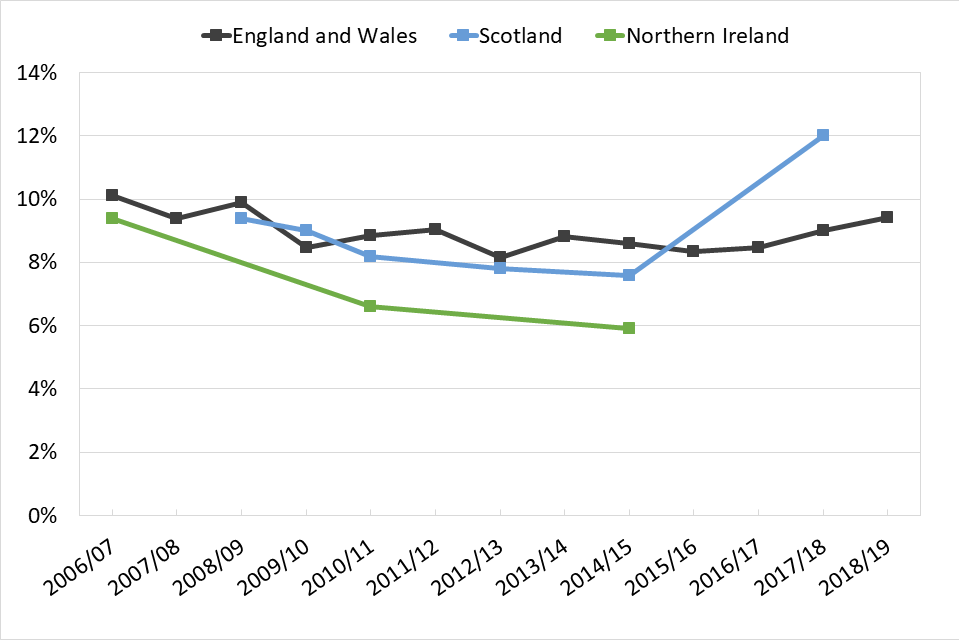
Line graph showing trends over time of the percentage of people who reported that they had used drugs in the last year, split by country.
*England and Wales: 16 to 59; Scotland: 16 to 64; Northern Ireland: 15 to 64
1.2 Drug use among school children
There are 3 surveys that look at substance use in school age children in the UK:
- In England, the Smoking Drinking and Drug Use Among Young People in England survey (SDD) covers use in children aged 11 to 15, and is now published every 2 years.
- In Scotland, the Scottish Schools Adolescent Lifestyle Substance Use Survey (SALSUS) covers use in children aged 13 and 15, and is published every 2 years.
- In Northern Ireland, the Young Persons’ Behaviour and Attitudes Survey (YPBAS) covers use in children aged 11 to 16 and is published every 3 years. The Focal Point only has access to detailed YPBAS data up until 2013 so we have not included any data from this survey in the report.
These surveys will be referred to throughout the report.
Prevalence of drug use among school children in the UK had previously seen a general decline. However, there has been a recent increase in the proportion of 15 year olds in England who have taken a drug at any time in their life, from 24% in 2014 to 38% in 2018. Similarly, the proportion of 15 year olds in Scotland who had ever taken a drug was previously in decline, but increased from 18% in 2013 to 21% in 2018.

Line graph showing trends over time of the percentage of 15 year olds in England and Scotland who reported ever using drugs.
1.3 Indirect prevalence estimates of high risk drug use
Drug users who are at the highest risk of harm often have lifestyles that lead to them being underrepresented in general population surveys. So, mathematical modelling is used to estimate how many people are using the substances that are most associated with harm in each country of the UK.
Estimating the size of these groups is important for informing policy and service provision. It also helps assess the impact of interventions to reduce drug-related harm.
The methodology used in each country aims to estimate the number of prolonged and routine users (sometimes referred to as ‘problematic’ users) rather than occasional or recreational users. These estimates should not be interpreted as estimates of prevalence of overall drug use in the population.
The drugs included in the modelling vary in each country of the UK. In England, estimates are produced for people who use opioids and/or crack cocaine. In Wales, the most recent estimates included injecting drug users and long-term or regular users of opioids, cocaine and/or amphetamines. In Scotland estimates include opioid use and/or illicit use of benzodiazepines.
Table 1: Most recent estimated number of high risk drug users and rate per 1,000 population aged 15 to 64, by country
| Country | Definition | Year | No. of high risk users (95% CI) |
Rate (95% CI) |
|---|---|---|---|---|
| England | Use of opioids and/or crack | 2016 to 2017 | 313,971 (309,242 – 327,196) |
8.9 (8.7 – 9.2) |
| Wales | Injecting drug use, or long-term or regular use of opioids, cocaine and/or amphetamines | 2015 to 2016 | 49,370 (42,230 – 58,540) |
25.3 (21.6 – 29.9) |
| Scotland | Use of opioids and/or benzodiazepines | 2015 to 2016 | 57,300 (55,800 – 58,900) |
16.2 (15.8 – 16.7) |
2. Opioids
2.1 Indirect prevalence estimates of high risk opioid users
The latest available estimate of high risk opioid users, using data up to 2018, suggests there are about 8.2 users per 1,000 people aged 15 to 64 in Great Britain. This was the highest rate reported in the EU in the most recent European Drug Report.
The most recent estimates for England, Scotland and Wales are shown below.
Scotland does not produce a separate estimate of opioid users, however, the estimated number of people using opioids and/or benzodiazepines is shown below for comparison. This is because most people who use illicit benzodiazepine in Scotland also use opioids. The figures suggest that the highest rate of high risk opioid use is in Scotland, followed by Wales.
Table 2: Most recent estimated number of high risk opioid* users and rate per 1,000 population aged 15 to 64 in Great Britain
| Country | Year | Estimate (95% CI) |
Rate per 1,000 |
|---|---|---|---|
| England | 2016 to 2017 | 261,294 (259,018 – 271,403) |
7.4 (7.3 – 7.6) |
| Wales | 2017 to 2018 | 18,980 (16,870 – 22,460) |
9.7 (8.6 – 11.5) |
| Scotland* | 2015 to 2016 | 57,300 (55,800 – 58,900) |
16.2 (15.8 – 16.7) |
| Great Britain | 2015 to 2018 | 337,574 (331,688 – 352,763) |
8.2 (8.1 – 8.6) |
*Estimates for Scotland include both opioid and illicit benzodiazepine users
2.2 Opioid users in drug treatment
Number starting treatment and in long-term treatment
The Focal Point receives treatment data from across the UK on people starting treatment during the year. We also have data on individuals who are in treatment at the beginning of the calendar year in England and Wales. These people are referred to throughout the report as being in continuous treatment.
The data on people starting treatment in 2018 does not include data from Northern Ireland. Treatment data for 2018 includes those starting treatment in prisons in England and Scotland.
The main substance that caused someone to come to treatment is the ‘primary’ substance. If someone reports use of multiple substances, the ‘primary’ substance is decided clinically by the treatment provider and the other substances are called ‘adjunctive’ substances.
Of the 114,752 people starting treatment in Great Britain during 2018, 50% reported primary use of opioids. The majority of those reported heroin as their primary drug, corresponding to 42% of all those starting treatment. This proportion was similar in England (43%) and Scotland (42%), and slightly lower in Wales (36%). Four-fifths (81%) of people who were in continuous treatment in England and Wales at the start of 2018 had primary opioid use, with 71% saying heroin was their primary substance.
The UK has one of the largest opioid treatment populations in Europe. In 2017, there were 57,430 people who started treatment in the UK who said they had a primary problem with opioids. This was 35% of the 163,557 people reported starting treatment throughout the EU (although this total does not include those starting treatment in Germany).
Around one-third of people starting treatment for primary heroin use in England and Scotland in 2018 reported that they usually injected it (35% in England and 33% in Scotland). Just under two-thirds (62% in England and 64% in Scotland) said that they usually smoked heroin.
However, heroin is still the most commonly injected drug in the UK. Of those taking part in the 2018 Unlinked Anonymous Monitoring (UAM) survey in England, Wales and Northern Ireland who had injected in the past month, 94% had injected heroin. Scottish findings from the Needle Exchange Surveillance Initiative (NESI) in 2017 to 2018 were similar, with over 90% reporting injecting heroin in the past 6 months.
You can find more information in the Drug treatment section.
Trends in treatment for opioid use
Treatment data for people starting drug treatment in the community is available for England. The proportion of people starting treatment who reported heroin as their primary drug has decreased over the past decade, from 53% in 2009 to 45% in 2018. This decline is even more prominent among those who had never been treated before.

Line graph showing trends over time of the percentage of people starting community drug treatment who reported heroin as their primary drug.
Among people in continuous treatment, the proportion reporting primary heroin use has remained stable, between 75% and 78% over the past decade. However, the number of people in continuous treatment for primary opioid use has decreased from 113,869 in 2011 to 94,628 in 2018.
People starting treatment for primary opioid use in Great Britain in 2018 were the oldest compared to those starting treatment for use of other drugs. Opioid treatment patients were aged 38.3 years on average, with heroin patients being aged 38.3 and methadone patients 39.7.
In England, the proportion of people starting treatment who were aged 40 or over has increased from 13% in 2005 to 44% in 2018. This reflects a relatively static group of ageing heroin users accessing services. Of those in continuous treatment for primary heroin use in England and Wales in 2018, 59% were aged 40 or over.
2.3 Harms involving opioids
Data on drug-related deaths (DRDs) mentioned throughout this report will refer to deaths classified under 2 different definitions, the European Monitoring Centre for Drugs and Drug Addiction (EMCDDA) definition and the UK drug misuse definition. You can find further information on these definitions in the Drug-related deaths section.
Opioids were the most commonly mentioned drug class in drug misuse deaths registered in the UK in 2018. Of the 2,917 drug misuse deaths registered in England and Wales, heroin or morphine (which heroin breaks down into in the body) was mentioned in 1,336 (45%), the highest number on record. Methadone was the second most commonly mentioned opioid, reported in 419 deaths (14%).
In Scotland, methadone was implicated in, or potentially contributed to, 560 of the 1,187 DRDs registered in 2018 (47%). Heroin or morphine was implicated in, or potentially contributed to, 537 deaths (45%). Opioids were mentioned in 115 drug misuse DRDs registered in Northern Ireland in 2018, with heroin or morphine being involved in 40 deaths (25%).
You can find more information on DRDs involving opioids in the Drug-related deaths section.
2.4 Opioids market: seizures and purity
Heroin market
Data on drug seizures by police forces is provided to the Focal Point by the Home Office (covering England and Wales), the Scottish government and the Police Service of Northern Ireland. The Home Office also provides data on Border Force seizures for England and Wales.
The number of heroin seizures in the UK has been stable at around 10,000 seizures per year since the beginning of the decade, with 10,742 seizures recorded in 2017 to 2018.
Average purity of heroin at user level in England and Wales was 50% in 2007, but fell to its lowest point of 18% in 2011. Since then, global heroin supply has increased and has been reflected in an increase in purity, which was 46% in England and Wales in 2018.
Fentanyl market
According to a 2017 study, the UK is the largest European seller of fentanyls, accounting for 9% of global dark web sales. The US had the largest proportion of sales, at 40%. China is commonly thought to be a major source of fentanyl, but it only accounted for 4% of global dark web sales. The study suggested that sellers in Europe and the US are likely intermediaries rather than producers of fentanyls, and that China may still be the original source of these substances.
In 2018 to 2019, there were 22 seizures of fentanyl made by police and Border Force in England and Wales. There were also 8 seizures of fentanyl analogues made, including lofentanil, sufentanil and alfentanil. The amount of fentanyl seized was 1.6 kg. However, a far greater quantity (67 kg) of fentanyl analogues was seized by Border Force.
3. Cannabis
3.1 Prevalence of cannabis use
Cannabis use in the general population
Cannabis is the most commonly used illicit drug in each country of the UK. In the most recent survey in England and Wales, 7.6% of adults said that they had used cannabis in the last year, the highest proportion since 2008 to 2009. In 2018 to 2019, cannabis use in the last year among 16 to 24 year olds was 17%, its highest point for a decade.
In the most recent survey in Scotland, 8.4% of adults said they had used cannabis in the last year, with 19% of those aged 16 to 24 reporting use in the last year.
As with overall drug use, use of cannabis was lower in Northern Ireland than the other countries of the UK. The most recent survey (2014 to 2015) reported that 4.6% of 15 to 64 year olds had used cannabis in the last year.

Line graph showing trends over time of the percentage of people in the UK who reported using cannabis in the last year, split by country and also split into young adults and all adults.
Cannabis use among school children
Cannabis is the most popular drug reported in school surveys, with 22% of 15 year olds in England and 19% in Scotland saying they had ever used cannabis, in the most recent surveys. Use among 15 year olds has increased in both countries in recent years.

Line graph showing trends over time of the percentage of 15 year olds in England and Scotland who reported ever using cannabis.
3.2 Cannabis users in drug treatment
In 2018, cannabis was the second most common primary substance (22%) for people starting treatment in England, Wales and Scotland, after heroin. However, cannabis is the most common primary substance among those who have never been previously treated, with 43% of this group reporting primary cannabis use in 2018. In Northern Ireland, cannabis is the most common primary substance reported by people starting treatment and was 45% in 2017.
People in treatment for cannabis use are usually younger than other people in treatment. In 2018, those starting treatment for primary cannabis use had a mean age of 24.4, while the mean age of everyone starting treatment was 33.7.
The number of people starting treatment for primary cannabis use in the community in England increased substantially from 13,716 in 2005 to 22,213 in 2013. Since then, the number has fallen to 17,419 in 2018, despite the prevalence of use recorded in the CSEW remaining relatively stable.
3.3 Cannabis market
The type of cannabis being sold on the market has shifted since the beginning of the century. The majority of seizures by police in England and Wales has involved herbal cannabis rather than resin since 2004. After a long-term decline, the total number of cannabis seizures by police in England and Wales increased to 103,071 in 2018 to 2019

Figure 6: Number of herbal cannabis and cannabis resin seizures* made by police in England and Wales
*Data does not include seizures of cannabis plants
Scottish seizures data has also shown a long-term shift away from resin to herbal cannabis. The proportion of seizures involving resin has been consistently higher than in England and Wales, with the ratio of herbal to resin seizures being less than 3:1 in Scotland in 2017 to 2018, compared to more than 12:1 in England and Wales in the same year.
4. Powder cocaine
4.1 Prevalence of cocaine use
Cocaine use in the general population
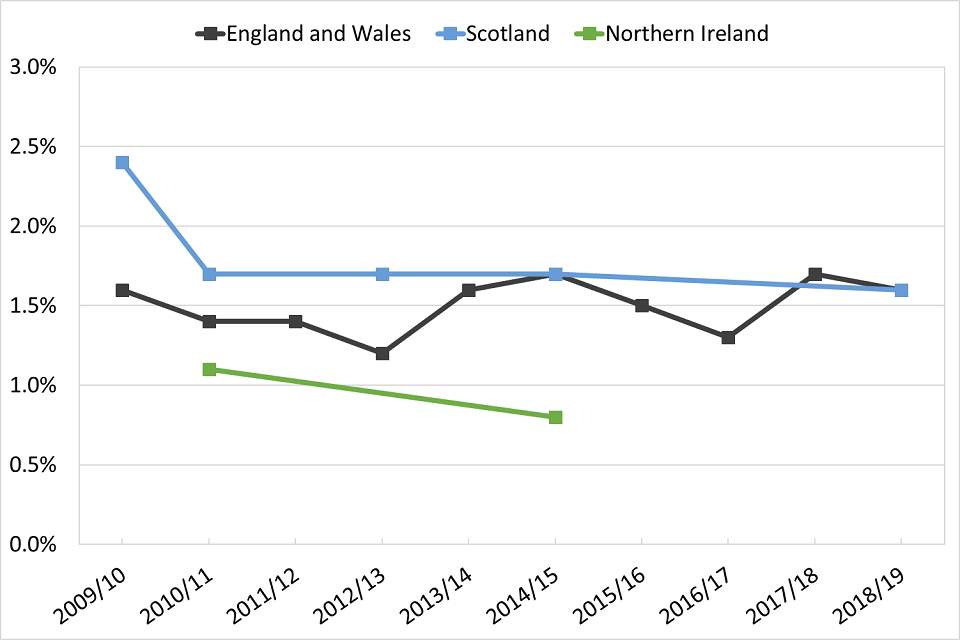
Powder cocaine is the most commonly used stimulant in the UK and the second most prevalent drug overall. In the most recent surveys available, use in the last year was reported at 2.9% in England and Wales, the highest figure since 2008 to 2009 (3.0%), and 1.8% in Northern Ireland. Use of cocaine (including crack) in Scotland has dropped from 3.7% in 2008 to 2009 to 2.3% in the most recent survey.
Line graph showing trends over time of the percentage of people who reported using powder cocaine in the last year, split according to country.
In Scotland, prevalence of cocaine use covers powder and crack use. However, the number of crack users captured in these surveys can be considered to be negligible.
Although it’s hard to compare surveys, data for 2017 to 2018 from England and Wales suggests that prevalence of cocaine use among adults in the UK was the highest of all European countries where figures were available. This suggestion is backed up by wastewater analysis done in several European cities including London and Bristol.
In the most recent survey, powder cocaine was the third most commonly used drug among people aged 16 to 24 in England and Wales (6.2%), after cannabis (17.3%) and nitrous oxide (8.7%). There has been an upward trend in reported use in the last year among this age group since 2012 to 2013, and the largest increase has been among those aged 20 to 24. However, recent increases are also clear in most age groups.

Line graph showing trends over time of the percentage of people in England and Wales who reported using powder cocaine in the last year, split into different age groups.
Cocaine use among school children
The proportion of 15 year olds in England who said they had ever used powder cocaine decreased from 4.4% in 2009 to 2% in 2013, but increased to 4.2% in 2018. In the most recent Scottish survey, 5% of 15 year olds said they had ever used cocaine (including crack).
4.2 Cocaine users in drug treatment
Thirteen per cent of people starting drug treatment in England, Scotland and Wales in 2018 reported primary use of powder cocaine. There has been a notable increase in the number of people starting treatment for primary cocaine use in these countries in recent years. England has historically had a higher proportion of people with primary cocaine problems than the other countries of the UK, but these differences have narrowed over the past 2 years.
For more information, see the drug treatment section.
English community treatment data clearly shows the recent increase in people starting treatment for primary cocaine use, particularly those who have never previously been treated.

Line graph showing trends over time of the percentage of people entering community drug treatment in England who reported using powder cocaine as their primary drug.
4.3 Harms involving cocaine
The number of deaths involving cocaine are increasing across the UK. Cocaine was mentioned in 637 DRDs (22% of drug misuse deaths) registered in England and Wales in 2018, more than 4 times the figure in 2012 (139). The increase in heroin deaths where cocaine was also present accounts for a large part of this increase in cocaine-related deaths. Crack and powder forms of cocaine are not distinguished in drug-related death statistics.
Cocaine has also been involved in an increasing number of deaths in Scotland and Northern Ireland. Cocaine was implicated in, or potentially contributed to, the cause of death in 237 cases registered in Scotland in 2018, a five-fold increase from 2014 (45).
Thirteen per cent of people who currently inject drugs (those who had injected in the previous 4 weeks) taking part in the 2018 UAM survey in England, Wales and Northern Ireland said they had injected cocaine, an increase from 6.9% in 2013. Injecting cocaine has become more common in Scotland, with 29% of current injectors in 2017 to 2018 saying they had injected powder cocaine in the past 6 months. This was a marked increase from the 13% recorded in 2015 to 2016. Injecting cocaine has been associated with an outbreak of HIV in Glasgow first detected in 2015.
4.4 Cocaine market: seizures and purity
Powder cocaine is the most seized stimulant in the UK, in both number of seizures and quantity of drug seized. The number of seizures has been relatively stable throughout the past decade, with nearly 20,000 seizures in most years.
The mean purity of cocaine powder at user level in England and Wales decreased steadily from 51% in 2003 to a low of 20% in 2009. Purity has since increased to 63% in 2018, the highest level on record. This reflects high production rates in source countries and increased availability of cocaine across Europe.
5. Crack cocaine
5.1 Estimates of crack cocaine use
The UK has the highest levels of crack cocaine problems in Europe. Of the roughly 11,000 people who came to treatment for primary crack problems in the EU in 2017, 65% of these were in the UK.
Crack is associated with chaotic lifestyles and crime, particularly among people also using opioids and is mainly seen in England. Household surveys are likely to under report this group, so prevalence of crack use is estimated as part of the indirect prevalence estimates for high risk drug use outlined above.
The prevalence of crack users within the population aged 15 to 64 in England was estimated to be 5.1 users per 1,000 in 2016 to 2017. This confirmed that the prevalence of crack use has stabilised after the increasing trend between 2011 to 2012 and 2013 to 2014.
Table 3: Estimated number of crack users, and rate per 1,000 population aged 15 to 64, in England
| Estimated no. of users (95% confidence interval) |
Estimated rate per 1,000 population (95% confidence interval) |
|
|---|---|---|
| 2011 to 2012 | 166,640 (161,621 – 173,706) |
4.76 (4.62 – 4.96) |
| 2012 to 2013 | 170,167 (165,196 – 177,799) |
4.87 (4.73 – 5.09) |
| 2013 to 2014 | 182,334 (175,707 – 191,459) |
5.21 (5.02 – 5.47) |
| 2014 to 2015 | 182,828 (176,675 – 190,782) |
5.21 (5.03 – 5.43) |
| 2016 to 2017 | 180,748 (176,583 – 188,066) |
5.10 (4.98 – 5.30) |
A qualitative study conducted by Public Health England and the Home Office published in March 2019 identified several factors which may have influenced the increase in crack use, including:
- a surge in global production of cocaine since 2013
- increased availability and affordability of crack
- aggressive marketing of the drug by dealers
5.2 Crack users in drug treatment
England had a far larger proportion of people (7.6%) starting treatment for primary crack use in 2018 than the other countries of the UK (3.2% in Wales and 1.8% in Scotland). However, the proportion of those reporting primary crack use has increased in all 3 countries over the past 3 years.
Crack was also the most common adjunctive substance reported in 2018.
Only 0.2% of those starting treatment in Northern Ireland in 2017 reported crack as their primary substance.
You can find more information on people in treatment for crack problems in the Drug treatment section.
5.3 Harms involving crack cocaine
Deaths involving crack cannot normally be distinguished from those involving powder cocaine. You can find the information on deaths involving all forms of cocaine in the harms involving cocaine section.
The proportion of current injectors who report injecting crack has increased markedly in the last 10 years in England (from 31% in 2009 to 62% in 2018), and Wales (from 7% in 2009 to 43% in 2018), as reported in the the 2018 UAM survey.
In contrast, the prevalence of crack injection by current injectors has remained much lower in Northern Ireland (6.3% in 2017 in the UAM survey), and in Scotland (5.7% in 2017 to 2018 in the NESI survey).

Line graph showing trends over time of the percentage of people who had recently injected drugs who had injected crack, split by country.
Recent injectors in England, Wales and Northern Ireland in the UAM survey injected in the past 4 weeks. Recent injectors in Scotland in the NESI survey injected in the past 6 months. NESI data is represented in the first year of the financial year, so data from 2008 to 2009 is represented in figures in 2008.
5.4 Crack market
Cocaine is almost always imported into the UK in powder form, and converted into crack in this country. This is reflected in the fact that Border Force is responsible for seizing the greatest quantity of cocaine powder in England and Wales, whereas virtually all crack seizures (both number and quantity seized) in England and Wales are made by police forces.
There was a decline in the number of crack seizures in England and Wales between 2007 to 2008 and 2014 to 2015, from 7,191 to 4,132 seizures. However, since then the number of seizures has increased by 59%, to 6,561 seizures in 2018 to 2019.
Since powder cocaine is converted to crack in the UK, the trend in crack purity is similar to powder cocaine purity (though purities of crack are usually higher). The purity of crack at user level in England and Wales rose from its lowest point of 26% in 2011 to a record 77% in 2018 and has been over 70% since 2016.

Line graph showing trends over time of the purity of powder and crack that has been seized in England and Wales.
6. Benzodiazepines
6.1 Prevalence of benzodiazepine use
Benzodiazepine use in the general population
Benzodiazepine use among the general population is captured under ‘tranquilisers and sedatives’ in the adult general population surveys. However, benzodiazepines are also used by high risk drug users, which these surveys may not report.
Since the 1990s, Scotland has had a high prevalence of illicit benzodiazepine use, particularly among existing opioid users. Illicit benzodiazepine use is included alongside opioid use in the Scottish estimates of high risk drug users. However, the estimates are not broken down into use of opioids or benzodiazepines alone.
Throughout the last decade there has been an increase in the use of ‘street’ benzodiazepines, especially in Scotland. These are sold without prescription in the illegal market, and despite often having the appearance of pharmaceutical grade diazepam or alprazolam tablets, most are counterfeit. These tablets commonly contain different compounds to what may be expected by their appearance. In Scotland phenazepam and more recently etizolam have been the major ingredients in ‘street’ benzodiazepines.
In 2017 to 2018, 0.8% of adults in Scotland reported using tranquilisers in the last year, compared to 0.4% in England and Wales in 2018 to 2019. The Northern Irish survey includes prescription use, while the other surveys reflect non-prescription, illicit benzodiazepine use. Prevalence of tranquiliser or sedative use in Northern Ireland was 10% in 2014 to 2015 .
Benzodiazepine use among school children
Like adult surveys, prevalence of benzodiazepine use in school surveys is captured under tranquiliser use. In 2018, 1.7% of 15 year olds surveyed in England said they had ever used tranquilisers. While this is not as high as other drugs such as cannabis, cocaine or MDMA, prevalence has risen from 0.5% in 2014. This has coincided with reports of increased use of alprazolam (‘Xanax’) among school children.
Prevalence of lifetime tranquiliser use among 15 year olds in Scotland has risen from 1.7% in 2015 to 2.8% in 2018.
6.2 Benzodiazepine users in drug treatment
The differences between countries in the misuse of benzodiazepines can be seen in the proportion of people who start treatment reporting use of these substances. There are higher proportions in Scotland and Northern Ireland then England and Wales.
In Scotland, benzodiazepines were the primary drug of 11% of people starting treatment in 2018. A further 19% reported adjunctive use of benzodiazepines, mostly alongside opioids. You can find more information on this subject in the Drug treatment section.
As well as an increase in prevalence in school surveys, there has also been an increase in the number of under-18s with benzodiazepine problems starting treatment in England over the past 3 years . This number trebled from 161 people in 2016 to 2017, to 483 in 2018 to 2019. The specific drug is not always recorded. However, the number of cases involving alprazolam increased from 8 in 2016 to 2017 to 53 in 2017 to 2018.
6.3 Harms involving benzodiazepines
The number of deaths where benzodiazepines were implicated in, or potentially contributed to the cause of death in Scotland has increased markedly over the past 3 years. The number went from 191 deaths registered in 2015 to 792 deaths in 2018 (67% of all DRDs).
The National Records of Scotland responded to the scale of recent increases in benzodiazepine-implicated deaths by introducing ‘street’ and ‘prescribable’ benzodiazepine categories into their National Statistics publication for deaths registered in 2018. Most of the increase has been due to street benzodiazepines, mainly etizolam.
A large proportion of DRDs in Northern Ireland also involve benzodiazepines, which were mentioned in 97 (51%) of the drug misuse deaths registered in 2018. Diazepam was the most common drug mentioned overall (76 deaths).
In 2018, 420 (16%) of drug misuse deaths in England and Wales mentioned benzodiazepines.
Line graph showing trends over time of the proportion of deaths in related to benzodiazepine drugs, split by country.
*Data is for deaths registered each year. In England and Wales, there are often long delays in registering DRDs. A large number of the deaths registered in any one year will have occurred the year before
6.4 Benzodiazepine market
Despite having a population size about one tenth the size of England and Wales, there are often more seizures of benzodiazepines made by police forces in Scotland than in England and Wales each year. In 2017 to 2018, there were 3,323 seizures made in Scotland, equivalent to 94 seizures per 100,000 population aged 15 to 64. This compares to 2,038 in England and Wales in 2017 to 2018, a rate of 5.4 per 100,000.
Approximately 680,000 tablets were seized in Scotland, with almost half (48%, 325,500 tablets) being etizolam. In the same year, 552,000 tablets were seized by police forces in England and Wales. Although the Scottish figure is higher than the England and Wales total, it’s actually a decrease from the 2,710,000 tablets seized in 2014 to 2015.
In Northern Ireland, there were 734 seizures of benzodiazepines in 2018. This represents a rate of 71 seizures per 100,000 population aged 15 to 64, which is over 13 times the rate in England and Wales.

Line graph showing trends over time of the proportion of 15 to 64 year olds who have had benzodiazepine drugs seized, split by country.
Benzodiazepines bought on the illicit market often do not contain the specific drug that the purchaser intended to buy. Data from the Welsh Emerging Drugs and Identification of Novel Substances (WEDINOS), in its October to December 2019 newsletter, showed that only around half the samples purchased as diazepam or alprazolam in the last quarter of 2019 contained those substances alone.
7. MDMA
7.1 Prevalence of MDMA use
MDMA use in the general population
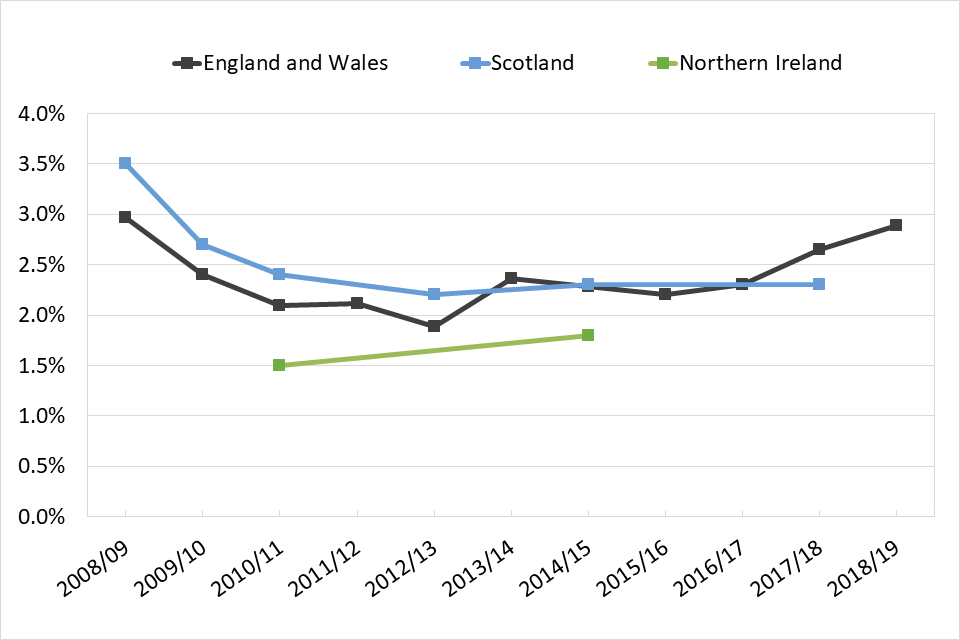
MDMA is the second most commonly reported stimulant in UK household surveys. In the most recent surveys, the proportion of adults who said they had used MDMA in the last year was 1.6% in England and Wales, 1.6% in Scotland and 0.8% in Northern Ireland.
Prevalence of MDMA use in the last year has been relatively flat throughout the lifetime of the England and Wales survey, fluctuating between 1 and 2%. Prevalence in Scotland has dropped from 2.4% a decade ago.
Line graph showing trends over time of the percentage of people who reported using MDMA in the last year, split by country.
The proportion of 16 to 24 year olds who said they had used MDMA in the last year in England and Wales was 4.7% in 2018 to 2019, an increase from 2.9% in 2012 to 2013. Prevalence among 16 to 19 year olds is now 4.5%, the highest since 2001 to 2002.

Line graph showing trends over time of the percentage of people in England and Wales who reported using MDMA in the last year, split into different age groups.
7.2 MDMA use among school children
The proportion of 15 year olds who had ever used MDMA decreased to its lowest point in 2013, at 2.1% in England and 2% in Scotland. Since then, use among this age group has risen to 3.9% in England and 6% in Scotland in 2018.

Line graph showing trends over time of the percentage of 15 year olds in England and Scotland who reported ever using MDMA.
7.3 MDMA users in drug treatment
MDMA users typically account for a small proportion of people in treatment. In 2018, 0.5% of those starting treatment in England, Scotland and Wales reported using MDMA as their primary drug. However, the number of young people starting treatment for this drug has increased in the last 4 years up to levels last seen a decade ago.
Figure 17 shows the number of people under 18 starting treatment in the community in England. Numbers decreased from 348 in 2007 to 32 in 2010, but have risen sharply since, from 107 in 2014, to 335 in 2018.
You can find further analysis on the age of people starting treatment for MDMA use in the Drug treatment section.

Line graph showing the trend over time of the number of people in England aged under 18 who reported MDMA as their primary drug when entering drug treatment.
7.4 Harms involving MDMA
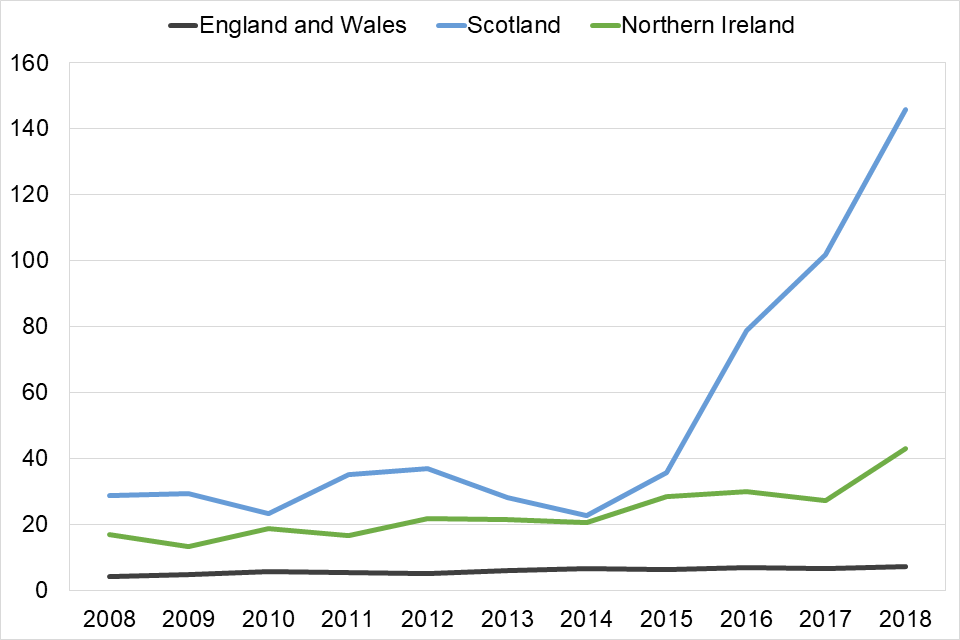
The number of MDMA-related deaths per year is much lower than for heroin, cocaine, benzodiazepines and amphetamine. However, the number of deaths involving MDMA registered in 2018 across the UK was the highest on record.
After dropping sharply to its lowest point of 8 deaths in 2010, there were 92 MDMA-related deaths registered in England and Wales in 2018.
Scotland has seen a similar picture, with no deaths involving MDMA in 2010, and 35 registered in 2018. The number of deaths involving MDMA registered in Northern Ireland was 11 in 2018, the highest number on record.
The number of deaths occurring in the youngest 2 age groups in England and Wales showed a marked increase between 2017 and 2018.

Line graph showing trends over time of the number MDMA-related deaths in England and Wales, split into different age groups.
7.5 MDMA market
The number of MDMA seizures in the UK has remained stable in the last decade. However, the quantity seized in England and Wales in 2018 to 2019 was the highest since 2006 to 2007, at 2,248,850 doses.
The potency of MDMA tablets has risen in recent years, and batches of high strength tablets have caused concern. Testing by WEDINOS found that the mean average strength of an MDMA tablet rose from 129.48 mg in 2016 to 156.05 mg in 2017. In 2018, the mean purity of MDMA powder at user level in England and Wales was 76%.
8. Amphetamine and methamphetamine
8.1 Prevalence of amphetamine and methamphetamine use
Amphetamine and methamphetamine use in the general population
The proportion of people who said that they had used amphetamine in the last year in England and Wales has decreased significantly, from 1.2% in 2008 to 2009, to 0.6% in 2018 to 2019. Use in the last year among adults has also fallen in Scotland, from 1.4% in 2008 to 2009, to 0.7% in 2017 to 2018.
Line graph showing trends over time of the percentage of people who reported using amphetamine in the last year, split by country.
Prevalence of methamphetamine use is low in the UK compared to the most common stimulants (0.03% in the most recent survey in England and Wales). Its use is mostly associated with men who have sex with men in ‘chemsex’, where people have sex under the influence of drugs. In this scenario, methamphetamine is typically used alongside GHB/GBL and mephedrone.
Amphetamine use among school children
In the most recent survey, 15 year olds in England were half as likely to have used amphetamines (including methamphetamine) than cocaine or MDMA, with 1.8% saying they had ever used amphetamines compared to 4.2% for cocaine and 3.9% for MDMA. In Scotland, 2.7% of 15 year olds in 2018 reported using amphetaimes at some point in their life.
8.2 Amphetamine and methamphetamine users in drug treatment
Wales has the highest proportion of people in the UK starting treatment for amphetamine or methamphetamine use. In 2018, 5.8% of all people starting treatment in Wales reported primary use of amphetamine or methamphetamine, compared to 1.8% in England and 1.5% in Scotland.
Amphetamines are regularly injected. In 2018, 43% of people starting treatment for methamphetamine and 13% starting treatment for amphetamine in Great Britain reported injecting as their main way of taking the drug.
8.3 Harms involving amphetamine and methamphetamine
Amphetamine was involved in 100 deaths registered in England and Wales in 2018. This number was similar to the previous 4 years, but is around twice the number of deaths every year from 2000 until 2013.
Amphetamine was implicated in, or potentially contributed to the cause of death in 46 cases in Scotland in 2018, the highest number on record.
8.4 Amphetamine and methamphetamine markets
There has been a decline in the number of amphetamine seizures in England and Wales over the past decade, from 7,760 in 2008 to 2009, to 3,664 in 2018 to 2019. However, there was a significant increase in methamphetamine seizures at the UK border in 2018 and according to the National Crime Agency, there are strong indications of methamphetamine production in North West England.
Average amphetamine sulphate powder purity at user level has ranged between 5% and 12% over the past decade. The mean purity in England and Wales in 2018 was 11%.
9. Ketamine
9.1 Prevalence of ketamine use
Ketamine use in the general population
Prevalence of ketamine use among adults in England and Wales is currently the highest on record, at 0.8%. People aged 16 to 24 are almost 4 times as likely to use ketamine as those aged 16 to 59. In 2018 to 2019, 2.8% of 16 to 24 year olds said they used it in the last year.
In Scotland in 2017 to 2018, 0.4% of adults aged 16 and over reported ketamine use in the last year. Like England and Wales, those aged 16 to 24 were more likely to use ketamine, with 2.8% reporting use in the last year.

Line graph showing trends over time of the percentage of 16 to 24 year olds in England and Wales and Scotland who reported using ketamine in the last year.
Ketamine use among school children
In 2018, 3.1% of 15 year olds surveyed in England said they had ever used ketamine. Use in the last year among this age group increased in the second half of the decade, from 1% in 2014 to 2.6% in 2018.
In Scotland, 3.1% of 15 year olds reported ever using ketamine in 2018.
9.2 Ketamine users in drug treatment
Trends of people starting treatment for ketamine use are similar to ketamine prevalence among young adults.
In England, the number of people starting treatment in the community for primary ketamine use increased between 2009 and 2013, but dropped in 2012. A large fall in the number of people starting treatment was also seen in 2014 and 2015. Since then, like prevalence, the number starting treatment has increased, and was 445 in 2018.

Line graph showing the trend over time of the number of people in England who reported ketamine as their primary drug when entering drug treatment.
9.3 Ketamine market
Similar to prevalence and treatment figures, the number of ketamine seizures in England and Wales fell between 2013 to 2014 and 2014 to 2015, from 1,639 to 558. The number has since increased, to 959 seizures in 2018 to 2019. Although the reason for the fall is not known, it was possibly due to issues affecting the ketamine supply chain before reaching the UK.
10. New psychoactive substances
New psychoactive substances (NPS) are drugs which are not controlled by the United Nations drug conventions, but which may pose a public health threat comparable to the substances listed in these conventions. The UK Focal Point plays an active role in the monitoring, assessment and reporting of these substances.
NPS availability has been reduced since the Psychoactive Substances Act 2016 imposed a ban on supplying psychoactive substances, which led to the closure of retail premises and online stores selling these products. ‘Street’ benzodiazepines (see the benzodiazepines section) and synthetic cannabinoid receptor agonists (SCRAs) are currently the most commonly available types of NPS in the UK.
10.1 Prevalence of NPS use
NPS use in the general population
The proportion of adults saying that they had used NPS (excluding mephedrone) in the last year in England and Wales was 0.5% in 2018 to 2019. This is similar to the previous 2 years’ surveys (0.4% in both years). These figures show a decrease in use from 0.9% in 2014 to 2015, when NPS were first included in the CSEW.
SCRA use among adults in the general population is not specifically reported in England and Wales. However, it’s possible to get some insight from data on the physical form of NPS used.
For instance, in 2018 to 2019, 0.5% of CSEW participants reported using NPS in the last year. Of these, 24% said that the last NPS that they had used was a herbal smoking mixture, most likely a SCRA.
Since 2015 to 2016, there has been a decrease in both the prevalence of NPS use (0.7% in 2015 to 2016) and the proportion of NPS users who last used a herbal smoking mixture (52% in 2015 to 2016).
Although it’s likely that these herbal smoking mixtures contain SCRAs, the CSEW data is not an accurate measure of SCRA use because:
- the herbal smoking mixtures may contain other drugs
- it does not capture people whose last NPS use was a powder NPS, but who also used a herbal smoking mixture previously in the same year
NPS use among the general population in Scotland and Northern Ireland is slightly lower than that in England and Wales. Prevalence of NPS (excluding mephedrone) use in the last year in the 2014 to 2015 Northern Ireland survey was 0.3%, compared with 0.8% in England and Wales in the same year. In Scotland, 1.8% of participants in the 2017 to 2018 survey reported ever using an NPS, compared to 2.5% in England and Wales in the same year.
Prevalence of SCRA use in the last year among all adults aged 16 and over in Scotland was 0.2% in 2017 to 2018.
Prevalence of NPS use among school children
In 2018, 5% of 15 year olds in Scotland said that they had ever used an NPS. Prevalence was slightly lower in England in the same year, with 3.8% of 15 year olds reporting having ever used an NPS.
The last 2 school surveys in England and Scotland have not asked about SCRA use.
Prevalence of NPS use among vulnerable populations
Use of NPS, particularly street benzodiazepines and SCRAs, is high among homeless and vulnerable people and those in prison. Use of street benzodiazepines among high risk drug users, especially in Scotland, is described in the benzodiazepines section above.
Research carried out in Manchester in 2016 suggests a high level of NPS use among the homeless population in the city. Survey data by the charity Homeless Link showed that 93% of rough sleepers had used an NPS in the last year, with qualitative research indicating that this was mostly SCRA use. NPS were more commonly used by this population than cannabis, cocaine (powder or crack) or heroin.
Ten per cent of prison inmates in England and Wales in 2015, and 14% of prisoners in Scotland in 2017, said they had used SCRAs in prison. In 2018 to 2019, 8.6% of prisoners undergoing random mandatory drug testing in England and Wales tested positive for NPS, the majority of whom are believed to have used SCRAs.
You can find more information on SCRA use in prisons in the drug use in prisons section.
10.2 Harms involving NPS
In 2018, there were 572 deaths registered in Scotland where at least one NPS was implicated in, or potentially contributed to, the cause of death. Of these, 568 involved benzodiazepine-type NPS, which are often used in combination with opioids. Only 8 of the NPS-related DRDs involved benzodiazepine-type NPS alone. There was only one death in Scotland in 2018 where SCRAs were implicated in, or contributed to, the cause of death .
NPS were mentioned on the death certificate in 125 deaths registered in England and Wales in 2018. This was a return to the 2016 level of 123 deaths, after 65 NPS-related DRDs were registered in 2017. The number of DRDs registered in which SCRAs were specifically mentioned on the death certificate rose from 8 in 2015 to 27 in 2016, and further increased to 60 in 2018. Only 3 such deaths had been recorded before 2015.
In Northern Ireland, 10 DRDs registered in 2018 mentioned an NPS, 2 less than in 2017.
10.3 NPS users in drug treatment
In 2018, 0.6% of people starting treatment in the community in England said their primary drug was an NPS, compared to 7% of people starting treatment in prisons.
Between 2012 and 2014, the proportion of people in treatment for primary NPS use was similar in prisons and in the community. However, since 2014, the proportion of prisoners in treatment for NPS has continued to increase, while the proportion in the community has remained at around 1% each year. The vast majority of those in treatment for NPS in prison are believed to be using SCRAs.
You can find more information on SCRAs in prison in the drug use in prisons section.

Line graph showing trends over time of the percentage of people in England who reported NPS as their primary drug when entering community drug treatment and drug treatment in prison.
11. Drug-related deaths
11.1 Main drug-related deaths data sources and definitions
There are 3 distinct general mortality registers, which record drug-related deaths (DRDs) in the UK:
- DRD statistics for England and Wales are produced by the Office for National Statistics (ONS) and most statistics are available for England and Wales separately.
- DRD statistics for Scotland are produced by National Records of Scotland.
- DRD statistics for Northern Ireland are produced by the Northern Ireland Statistics and Research Agency.
As mentioned previously, drug-related deaths are classified under 2 different definitions:
- EMCDDA definition: a death caused directly by the consumption of at least one illicit drug.
- UK drug misuse definition (DMD): a death where the underlying cause is drug abuse, drug dependence, or poisonings where any of the substances involved are scheduled under the Misuse of Drugs Act 1971.
Data captured using the EMCDDA definition counts the number of deaths that occurred each year. Due to delays in registering DRDs in England and Wales (see below), statistics produced using the EMCDDA definition are generally one year behind registration data. However, it is the most epidemiologically valid way to report UK totals. For this report, 2017 is the latest year for the EMCDDA definition, but data for deaths occurring in Northern Ireland in 2017 is not yet available. We refer to Great Britain throughout where Northern Ireland is not included in the analysis.
Data captured using the UK DMD counts the number of deaths registered each year, so some deaths counted in one year may have occurred the year before. In Scotland, there is a minimal delay to register DRDs, so the number of deaths counted by registration date is effectively equivalent to the number of deaths counted by the date they occur. However, in England and Wales, there are often long delays in registering DRDs and the 2 datasets can look quite different. So it’s not possible to create a combined UK count of DRDs using the UK DMD for the same year.
11.2 Numbers of drug-related deaths
In 2017, there were 3,284 DRDs in the UK (excluding Northern Ireland) using the EMCDDA definition. Even though data for 2017 is incomplete and late registrations will be added in next year’s revision, this is already greater than the 3,256 that occurred in 2016 in Great Britain. Of the deaths that occurred in 2017, 2,281 were in England, 828 in Scotland, and 175 in Wales.
Using the UK DMD, there were 2,670 DRDs registered in England, 1,187 in Scotland and 208 in Wales in 2018.
11.3 Profile of drug-related deaths
Using the EMCDDA definition, almost three-quarters (73%) of DRDs that occurred in 2017 were males, with little variation in this percentage between England, Wales and Scotland.
The mean age at death was around 3 years older for females (45.2) than for males (42.0).
The largest number of DRDs occurred in the 35 to 44 age group, which accounted for 34% of all DRDs.
Table 4: Number of drug-related deaths in England, Wales and Scotland occurring in 2017 under the EMCDDA definition
| Great Britain | England | Wales | Scotland | |
|---|---|---|---|---|
| All persons | 3,284 | 2,281 | 175 | 828 |
| Male | 2,392 | 1,680 | 130 | 582 |
| Female | 892 | 601 | 45 | 246 |
11.4 Trends in drug-related deaths
Using the EMCDDA definition, the UK drug-related mortality rate per million population aged 15 to 64 in 2017 was the highest on record, at 76 deaths per million. Data for 2017 does not include Northern Ireland. The rates for both sexes have increased since 2012, with the female rate at 39 per million, and the male rate at 109 per million in 2017.
The drug-related mortality rate in Scotland has consistently been higher than in the rest of the UK and increased notably between 2013 (143 per million) and 2017 (229 per million). The 2017 figure was the highest rate reported in Europe in that year. National reports in Scotland show that this trend has continued, with a further increase in the mortality rate in 2018.
The mortality rate for Northern Ireland more than doubled between 2008 (31 per million) and 2016 (79 per million).

Figure 23: Mortality rate (per million population aged 15 to 64) for DRDs in the UK registered using the EMCDDA definition
Since 2009, the highest mortality rate using the EMCDDA definition has been in the 35 to 44 age group. Mortality rates among the 45 to 54, 55 to 64 and 65 and over age groups have also increased over time, reflecting the ageing trend in DRDs. By contrast, the mortality rates among people aged 15 to 24 and 25 to 34 have decreased since 2008.

Figure 24: Mortality rate (per million population) for DRDs in the UK* registered using the EMCDDA definition, by age group
*Data for 2017 does not include Northern Ireland
11.5 Substances mentioned or implicated in deaths
The publications produced from each mortality register contain information about the drugs involved in DRDs in each country. In the most recent publications, covering death registrations in 2018, opioids were mentioned or implicated in around four-fifths of deaths in each country, with the highest proportion in Scotland (86%).
The most significant other class of drug mentioned in DRDs was benzodiazepines. In 2018, deaths involving these substances were particularly prevalent in Scotland (mentioned or implicated in 67% of deaths) and Northern Ireland (60%).
Cocaine (either in powder or crack form) was mentioned or implicated in about a quarter of DRDs in England (22%) and Scotland (23%), in 15% of DRDs in Wales and in 17% of DRDs in Northern Ireland.

Bar chart showing the percentage of registered drug-related deaths in 2018 by the different drug categories mentioned, split by country.
11.6 Opioids mentioned or implicated in deaths
Heroin was the most commonly mentioned or implicated drug in deaths registered in the UK in 2018. It was involved in more than half of all opioid-related deaths in England, Wales and Scotland, and 35% in Northern Ireland.
Methadone was the next most common opioid involved in DRDs. In 2018, the number of methadone-related deaths in Scotland (560) exceeded the number of heroin-related deaths (537). Methadone was involved in 47% of all DRDs in Scotland, a much higher percentage than in the other countries (20% in England, 10% in Wales and 13% in Northern Ireland). Buprenorphine was also more commonly mentioned in Scotland (9% of opioid deaths) than in the other countries.
Opioid-related deaths in Northern Ireland were more likely to involve prescription opioid drugs than in other UK countries. In 2018, tramadol was mentioned in 23% of all opioid-related deaths. Codeine, dihydrocodeine and fentanyl were also commonly mentioned.
Fentanyl was mentioned in 74 deaths in England, 12 deaths in Scotland and 10 deaths in Northern Ireland in 2018. Fentanyl analogues were mentioned in 30 deaths in England in the same year. Wales did not register any deaths in 2018 where fentanyl or its analogues were mentioned.

Bar chart showing the percentage of registered opioid-related deaths in 2018 by the specific opioid drugs mentioned, split by country.
12. Drug-related infectious diseases
12.1 Data sources
Information on the prevalence and nature of injecting behaviour and associated health harms is collected using regular surveys of people who access drug treatment services and specialist services like needle and syringe programmes.
The annual UAM survey monitors HIV, hepatitis B (HBV) and hepatitis C (HCV) prevalence in people who inject drugs (PWID). The survey covers England, Wales and Northern Ireland.
The NESI anonymous survey monitors the prevalence of infections and injecting risk behaviours among PWID in Scotland, and is conducted every 2 years. Throughout this section, NESI data is represented in the first year of the financial year, so data from 2008 to 2009 is represented in figures in 2008.
12.2 Main drug-related infectious diseases among drug users
Hepatitis C
The presence of antibodies to HCV (anti-HCV) shows that a person has been infected by HCV at some point in their lifetime. The prevalence of anti-HCV among participants in the 2018 UAM survey was 54%, the highest figure in the past decade. Anti-HCV prevalence in England was 55%, Wales was 56% and Northern Ireland was 22%.
In Scotland, the anti-HCV prevalence reported in the 2017 to 2018 NESI survey was 57%.
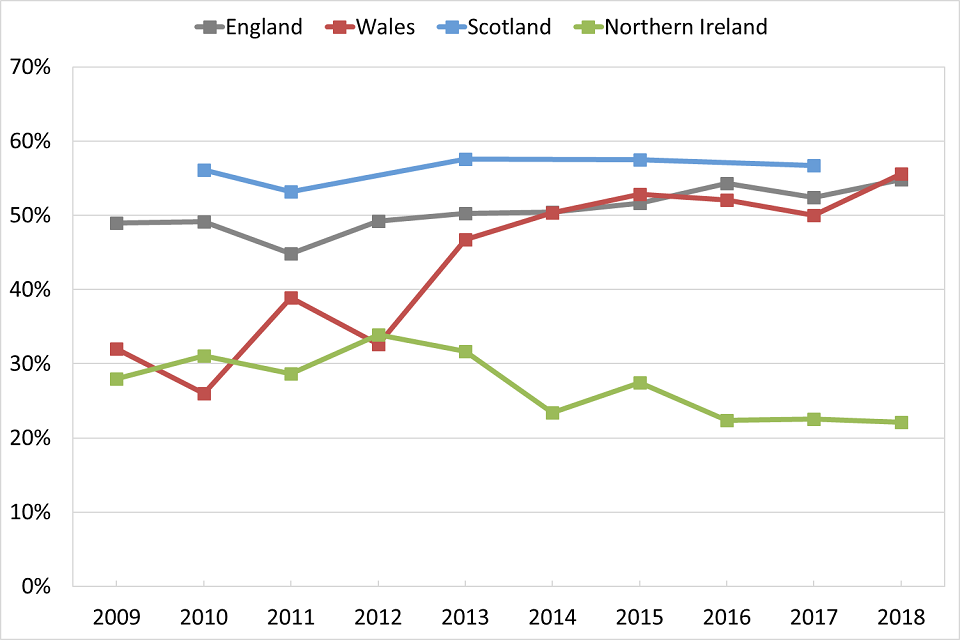
Line graph showing trends over time of the percentage of people who inject drugs who had tested positive for anti-HCV antibodies, split by country.
In 2018, 49% of people surveyed by the UAM who had ever been infected by HCV had a long-term, or chronic, infection. This proportion has decreased from 58% in 2011. The fall in the proportion of PWID with chronic HCV infection corresponds with an increase in direct acting HCV antiviral treatment in this group since 2015. In 2018, the proportion of those with chronic infection was 50% in England, 45% in Wales and 39% in Northern Ireland.
In Scotland, 55% of people who had ever been infected by HCV had a chronic infection in 2017 to 2018, a decrease from 68% in 2015 to 2016.
Hepatitis B
In 2018, 9.1% of participants in the UAM survey had antibodies to hepatitis B core antigen (anti-HBc), a marker of having ever been infected. Prevalence was highest in Wales (11%) for the first time since the survey began. Anti-HBc prevalence in England has halved over the past decade and was 9.3% in the most recent survey. HBV prevalence was not reported in Scotland in the most recent NESI.
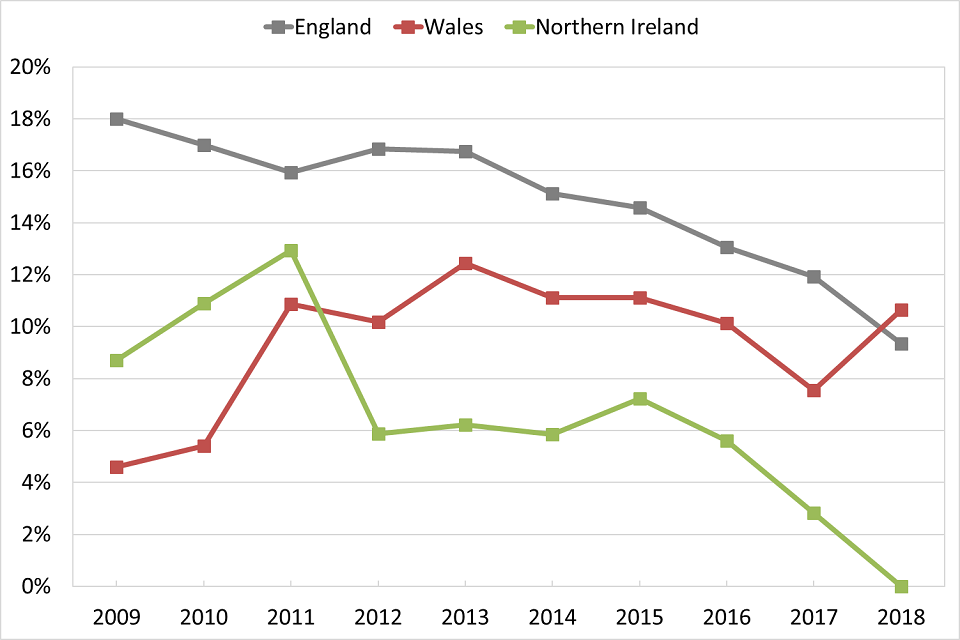
Line graph showing trends over time of the percentage of people who inject drugs who tested positive for anti-HBV antibodies, split by country.
Presence of hepatitis B surface antigen (HBsAg) in people testing positive for anti-HBc is an indicator of current HBV infection. In 2018, 4.7% of participants in the UAM with anti-HBc also had HBsAg detected, representing 0.4% of all the PWID surveyed that year.
HIV
The prevalence of antibodies to HIV (anti-HIV) among UAM survey participants was 1.2% in 2018. Prevalence was 1.2% in England, 1.8% in Wales, and 1.2% in Northern Ireland.
In Scotland, HIV testing for the most recent NESI was only undertaken for people in NHS Greater Glasgow and Clyde and NHS Lothian health board areas. The prevalence was 4.8% and 0.6% in these areas respectively.
Anti-HIV prevalence in the NHS Greater Glasgow and Clyde health board area is expected to have been affected by the outbreak detected in Glasgow in 2015.
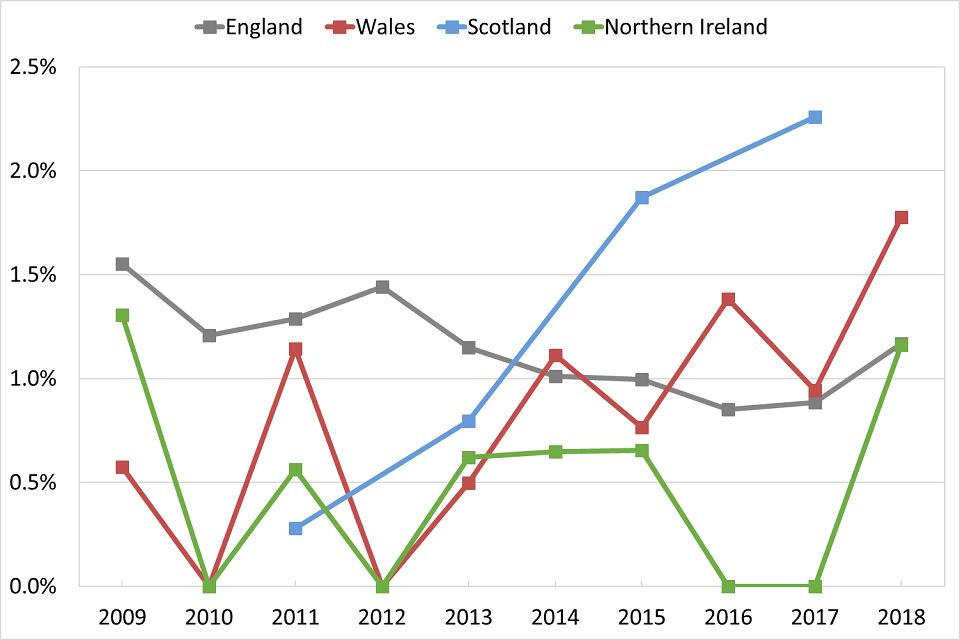
Line graph showing trends over time of the percentage of people who inject drugs who test positive for anti-HIV antibodies, split by country.
Data on anti-HIV prevalence from Scotland comes from the NHS Greater Glasgow and Clyde and NHS Lothian health boards only
Injection site infections
In 2018, 54% of PWID in the UAM survey who had injected during the previous year reported that they had experienced an abscess, a sore or an open wound at an injection site. This was an increase from 50% in 2017.
In Scotland, 20% of NESI respondents in 2017 to 2018 reported having a severe soft tissue infection in the last year.
13. Drug treatment
13.1 Drug treatment data for 2018
Drug treatment data collected by the UK Focal Point comes from:
- National Drug Treatment Monitoring System in England
- Scottish Drug Misuse Database
- Welsh National Database for Substance Misuse
- Substance Misuse Database in Northern Ireland
The data covers people starting treatment during the calendar year in England and Wales and during the financial year in Scotland and Northern Ireland. To make it easier to use, all data is referred to in calendar years. For example, data for 2017 to 2018 for Scotland and Northern Ireland is referred to as 2018 data. Data on people starting treatment in the most recent financial year in Northern Ireland is not available, so the most recent figures are for 2017.
England and Wales also record the number of people who are in treatment at the start of the calendar year, referred to throughout this report as being in ‘continuous treatment’. In the cases where someone in continuous treatment left treatment and came back later in the same year, their new treatment journey would not be counted in the statistics covering those starting treatment that year.
13.2 Total numbers of people starting drug treatment
In 2018, 114,752 people started drug treatment in England, Scotland and Wales, including 28,577 in prisons in England and Scotland. Across England and Wales, there were 234,101 people in treatment at any time during 2018, including those in continuous treatment.
Table 5: Number of people starting drug treatment services in England, Scotland and Wales and those in continuous treatment in England and Wales, in 2018
| People starting treatment | People in continuous treatment | All in treatment (England and Wales) | |
|---|---|---|---|
| England | 96,162 | 123,237 | 219,399 |
| Scotland | 10,997 | * | * |
| Wales | 7,593 | 7,109 | 14,702 |
| Total | 114,752 | 130,346 | 234,101 |
*Data not available
13.3 Primary substance of people in drug treatment
Primary substance among people starting treatment
When a person starts drug treatment, the substance that caused them to come to treatment is the ‘primary’ substance. If an individual reports use of multiple substances, the primary substance is decided clinically by the treatment provider and the other substances are called ‘adjunctive’ substances.
Heroin was the most commonly reported primary substance among people starting treatment in England (43%), Scotland (42%) and Wales (36%) in 2018. Cannabis was the second most common primary drug (23% in England, 20% in Scotland, 22% in Wales). In Northern Ireland in 2017, cannabis was the most common primary substance among those starting treatment (45%). Opioids other than heroin (12%) were more commonly reported than heroin (8%) in Northern Ireland.
Powder cocaine was the primary substance for between 12% and 13% of the people starting treatment in all 4 countries and the proportion of those reporting primary crack was highest in England. The benzodiazepines section shows that prevalence of benzodiazepine use is greater in Scotland and Northern Ireland and this is reflected in the proportions of people in treatment saying that benzodiazepines were their primary drug (11% in Scotland, 11% in Northern Ireland in 2017).

Bar chart showing the primary drugs reported by people starting drug treatment in the UK in 2018, displayed as a proportion of all people starting drug treatment and split by country..
Cannabis was the most commonly reported primary substance among people who had never been treated for drug use before in England (46%), Scotland (33%) and Northern Ireland (48%). Heroin was the most common primary substance among those never treated before in Wales (29%).

Bar chart showing the primary drugs reported by people starting drug treatment for the first time in 2018, displayed as a proportion of all people starting drug treatment for the first time and split by country.
Primary substance among people in continuous treatment in England and Wales
The length of time that people spend in drug treatment differs greatly depending on the drug they are in treatment for. For example, people with opioid problems are usually in treatment for much longer than people who have problems with other drugs.
In England, 72% of people in continuous treatment in 2018 reported heroin as their primary substance, with 10% reporting other opioids as their primary substance. In Wales, there was a smaller proportion of people in treatment for heroin than in England (56%), but a larger proportion reported other opioids (16%).

Bar chart showing the primary drugs reported by people in continuous drug treatment in England and Wales in 2018, displayed as a proportion of all people in continuous drug treatment.
Number of people in opioid substitution treatment
In 2018, 145,602 people in England and 1,966 people in Wales received opioid substitution treatment (OST). This was mainly methadone, but also buprenorphine.
In Scotland, 25,375 people were prescribed methadone at least once during 2017 to 2018). Due to data quality issues, this number should be treated as a minimum.
In 2017 to 2018, 984 people received OST across Northern Ireland, with methadone and buprenorphine being prescribed at similar levels.
Adjunctive substances among people starting treatment
The most common adjunctive substances reported by people starting treatment in England, Scotland and Wales were crack, alcohol, cannabis and benzodiazepines.
Four times as many people reported crack as an adjunctive substance (30,893) than as a primary substance (7,682) in England, Scotland and Wales. Crack was reported as a primary or adjunctive substance by 38% of those starting treatment in England in 2018, and 23% in Wales. There was minimal primary crack use among those starting treatment in Scotland and Northern Ireland.
In England, 66% of people starting treatment for primary heroin use said they also used crack, with 39% reporting adjunctive crack use in Wales. These were increases from 43% and 15% respectively in 2013. This increase in the proportion of people saying crack was an adjunctive substance might be partly due to improved data quality. However, other indicators suggest that prevalence of crack use is increasing (see the crack cocaine section).
Scotland (30%) and Northern Ireland (31%) had the greatest proportion of their treatment population reporting any use of benzodiazepines. In Scotland, 74% of people reporting adjunctive use of benzodiazepines were in treatment for primary opioid problems. In Northern Ireland the highest proportion of adjunctive benzodiazepine users were in treatment for primary cannabis use (45%).

Bar chart showing the proportion of people who entered drug treatment in 2018 who reported crack or benzodiazepines as their primary or adjunctive drug, split by country.
Age of people starting treatment
The mean age of all people starting treatment in the UK was 33.7 years. People who had never been in treatment before were 5 years younger (28.6) and those who had previously received treatment were 36.

Bar chart showing the primary drugs reported by people starting drug treatment in Great Britain in 2018, displayed as a proportion of all people starting drug treatment in Great Britain in 2018, and split by age group.
The mean age of people starting treatment in the community in England for primary synthetic cathinone use in 2018 was 34.9 years. This was more than 10 years older than those in 2013 (23.1) when data on these substances started to be collected, and reflects the ageing trend of the population using them and a drop in the number of younger clients.
13.4 Trends in treatment data
Trends in primary substance
We have a consistent time series of data covering England, Wales and Scotland from 2015 to 2018. Over this period, the total number of people starting treatment in these 3 countries decreased each year from 122,014 to 114,752, although the number starting treatment in Wales actually increased.
Between 2015 and 2018, the proportion of people starting treatment with primary heroin problems in Wales decreased from 44% to 36%. The proportions in Scotland (45% to 42%) and England (42% to 43%) were more stable.
All 3 countries have seen an increase in both the number and the proportion of people starting treatment for primary powder cocaine use. In 2015, the proportion of all those starting treatment for primary powder cocaine in England was double that of Scotland and Wales. However, in 2018 the difference between the countries was negligible.
There has also been a marked increase in the proportion of people who have never previously been treated in Scotland who reported primary powder cocaine use, which has more than doubled from 10% in 2015 to 22% in 2018.

Line graph showing trends over time of the percentage of all people starting drug treatment, and the percentage of people starting treatment for the first time, who reported powder cocaine as their primary drug, split by country.
Another recent concern has been an increase in crack use. Between 2015 and 2018, the number and proportion of people starting treatment for crack use increased in all 3 countries.

Line graph showing trends over time of the percentage of all people starting drug treatment, and the percentage of people starting treatment for the first time, who reported crack as their primary drug, split by country.
Trends in age
The mean age of people starting treatment in the UK has increased between 2015 and 2018, from 32.4 to 33.7 years (data for 2018 does not include Northern Ireland). The average age of primary opioid users continues to increase, going from 36.5 in 2015 to 38.3 in 2018.
One of the biggest decreases in average age has been among people starting treatment for primary MDMA problems. This has decreased from 22.1 in 2015 to 18.8 in 2018. In 2015, just over half (53%) the people starting treatment were aged under 20, but by 2018, three quarters (75%) of those starting treatment were in this age group.

Bar chart showing the trend over time of the proportion of people entering drug treatment who reported MDMA as their primary drug, split by age group.
*Data for 2018 does not include Northern Ireland
14. Drug use in prisons
14.1 Prison service overview
Three separate authorities manage prison services in the UK, covering England and Wales, Scotland and Northern Ireland.
On 1 April 2019 there were 136 prisons in the UK, holding about 92,500 adults and 1,000 young offenders. There were roughly 83,500 people in prison and young offender institutes in England and Wales, 8,000 in Scotland and 1,500 in Northern Ireland.
14.2 Drug use among prisoners
We can find out about a person’s drug use before they went to prison from self-reporting in surveys and testing data. Figures reported in surveys are generally higher than those from testing data.
The Scottish Prison Service carries out its prisoner survey every 2 years, which includes questions on drug use before and while in prison. There is no equivalent regular survey in England and Wales, but a detailed survey on drug use was carried out in 2014 to 2015.
Prison testing data is published annually for England and Wales. In Scotland, prison services carry out addiction prevalence tests (APT) during one month of the year, where people are tested for certain substances on entering or leaving prison. Prison services in England also carried out a screening programme to test people entering 10 prisons across the north-west of the country in 2014 and 2015.
Drug use before entering prison
In 2018 to 2019, 28% of male and 42% of female prisoners in England and Wales said they had drug misuse needs when they arrived at prison. This echoes a recent study that found a higher prevalence of drug use disorders in female prisoners worldwide.
Cannabis is the most prevalent drug used before entering prison, with 44% of Scottish prisoners testing positive in 2018 to 2019 and 38% reporting cannabis use in England and Wales in 2014 to 2015.
Fifteen percent of prisoners in England and Wales reported using heroin before entering prison in 2014 to 2015 and 29% of Scottish prisoners testing positive for opiates (codeine, morphine, dihydrocodeine or heroin) in 2018 to 2019. Cocaine is also commonly used before prison in England and Wales and Scotland.
Benzodiazepines were detected in one-third of Scottish prisoners tested on reception to prison in 2018 to 2019 and in 22% on reception to prisons in North West England in 2014 to 2015.
Drug use while in prison
Cannabis has previously been the most widespread drug misused inside prison, but SCRA use now appears to be at least as common.
During 2018 to 2019, 8.6% of prisoners tested in England and Wales gave a positive result for NPS. Anecdotal evidence suggests that most of these people will have used SCRAs. In the same year, 5.4% of prisoners tested positive for cannabis.

Bar chart showing the percentage prisoners in Scotland in 2018/2019 who tested positive for drugs on reception to prison and during their imprisonment, split by specific drug.
Use of heroin in prison appears to be around half the level reported by offenders before entering prison. Survey data from England and Wales in 2014 to 2015 found that 7% of prisoners reported using heroin in prison, compared to 15% before going to prison.
Illicit buprenorphine was the most commonly detected drug in Scottish APT in 2018 to 2019 (12% of people tested when leaving prison). Eight percent of people tested when leaving prison in 2018 tested positive for opiates, compared to 29% of those tested at reception to prison in the same year.
In England and Wales, 1.7% of prisoners tested were found to have taken buprenorphine in 2018 to 2019 and 2.1% tested positive for opiates.
14.3 People receiving treatment in prison
Data broken down by primary substance is available for people starting treatment in prison in England, Scotland and Northern Ireland. The most recent data for England is for people starting treatment in the 2018 calendar year, data for Scotland covers the 2017 to 2018 financial year and Northern Ireland is for the 2016 to 2017 financial year. To make it easier to use, we refer to the Scottish and Northern Irish data by calendar year, so data for 2017 to 2018 is referred to as 2018.
England
In 2018, there were 27,241 people who started drug treatment in prison, which was 28% of everyone starting treatment in England that year. As in the community, opioids were the most common primary drug, with a slightly higher proportion of prisoners saying they had opioid problems than people in the community.
Cannabis was the second most common reason for starting treatment in prison. There were 16% of prisoners who reported primary cannabis use, compared to 25% in the community.
Almost double the proportion of people reported primary crack use in prison than in the community. NPS were also much more commonly reported as a primary substance in prison. Seven percent of people starting treatment in prisons said that their primary drug was an NPS, compared to 0.6% starting treatment in the community.

Bar chart showing the primary drugs reported by people in drug treatment in England in 2018, displayed as a proportion of all people in drug treatment and split into prison and community treatment.
The most recent NDTMS data from secure settings reported that in 2017 to 2018 there was an increase in both the number and proportion of people starting treatment who said they had problems with crack alongside opioids. This increased from 26% in 2015 to 2016 to 36% in 2017 to 2018. Over the same period, the proportion of people reporting opioid use without crack decreased, from 22% to 14%.
Scotland
In 2018, 1,336 people were recorded as starting treatment in prisons in Scotland.
Of the 873 people with a known primary drug, the majority reported an opioid as their primary substance. Heroin was the most commonly reported opioid among those starting treatment in prison (29%), but this was less than the proportion starting treatment for heroin in the community (44%).
People starting treatment in prison were much more likely to report buprenorphine as their primary substance (15%) than those in the community (1.9%).

Bar chart showing the primary drugs reported by people in drug treatment in Scotland in 2018, displayed as a proportion of all people in drug treatment and split into prison treatment and other centre types.
Northern Ireland
In 2017, 591 people started treatment in prison in Northern Ireland, which was 24% of all people starting treatment in this country.
Cannabis was the most common reason for needing treatment and 39% of people starting treatment in prison said cannabis was their primary drug. This compares to 47% in the community.
Powder cocaine was the second most common primary drug and people in prison were more likely to report it as their primary substance (18%) than those in community services (11%). People starting treatment in prison were also more likely to report opioids as their primary substance (27%) than those starting treatment in the community (18%).

Bar chart showing the primary drugs reported by people in drug treatment in Northern Ireland in 2017, displayed as a proportion of all people in drug treatment and split into prison treatment and other centre types.
14.4 Drug-related deaths in prison
Data supplied to the Focal Point from the Prisons and Probation Ombudsman (PPO) shows that there has been a large increase in the number of drug-related deaths occurring in prisons, approved premises and immigration removal centres over the past 5 years.
In 2014 to 2015, 10 DRDs in these settings were recorded by the PPO. In 2018 to 2019, 42 DRDs were recorded.