Migrant journey: fourth report
Published 19 February 2014

© Crown copyright 2014
This publication is licensed under the terms of the Open Government Licence v3.0 except where otherwise stated. To view this licence, visit nationalarchives.gov.uk/doc/open-government-licence/version/3 or write to the Information Policy Team, The National Archives, Kew, London TW9 4DU, or email: psi@nationalarchives.gov.uk.
Where we have identified any third party copyright information you will need to obtain permission from the copyright holders concerned.
This publication is available at https://www.gov.uk/government/publications/migrant-journey-fourth-report/migrant-journey-fourth-report
Published: 19 February 2014
This report is the fourth in a series of reports that explore migrants’ journeys through the UK’s immigration system.
1. Introduction
Understanding the processes that migrants go through when they decide to stay in the UK or switch their status helps to inform the Government’s proposals for changes to the rules for settlement, and permanent and temporary migration routes.
The findings presented here are based on combining data collected from 2 UK Visas and Immigration (UKVI) databases. These databases hold records of individuals granted entry clearance visas, and any subsequent grants of extensions of stay in the UK. Findings are extended to migrants issued a visa during 2007.
This report updates analysis from The Migrant Journey – Third Report published in February 2013; and presents the data in two different and complementary ways, providing information on a forward-view and backward-view analysis of the extent to which migrants achieve settlement in the UK or are recorded as still having valid leave to remain. The data presented in this report relate to all cases (main applicant and dependants combined) and the supplementary tables separately identify all cases, by main applicants and by dependants.
2. Key facts
-
Twenty-five per cent (27,778) of those issued skilled work visas (with a potential path to settlement) in the 2007 cohort had been granted settlement 5 years later and a further 9% (9,981) still had valid leave to remain.
-
Indian nationals were issued the largest proportion of skilled work visas in the 2007 cohort (37%) and, of these skilled Indian nationals, 24% had received settlement after 5 years, while a further 9% still had valid leave to remain. Of the top 5 nationalities issued skilled work visas in the 2007 cohort, American and Australian nationals on work visas were less likely to have settled after 5 years (11%).
-
Sixty-four per cent of people (47,269) issued family visas in the 2007 cohort had been granted settlement 5 years later with a further 3% recorded as still having valid leave to remain. Of the top 5 nationalities issued family visas in the 2007 cohort, Americans were the least likely to have settled after 5 years (30%) and Bangladeshi (92%), Afghan (88%) and Pakistani nationals (82%) were the most likely.
-
Migrants granted student and work visas (not leading to settlement), both largely temporary migration routes, were less likely to have either achieved settlement or have valid leave to remain after 5 years (15% and 7% respectively). Of these, only a small proportion had achieved settlement (1% and 2% respectively) within the 5-year timeframe, due to the rules for these visa categories.
-
Migrants granted family visas in the 2007 cohort (67%) were more likely to achieve either settlement or have valid leave to remain after 5 years compared to the earlier cohorts (60% in the 2004 cohort). This trend is reversed for those granted a skilled work visa, work visa (not leading to settlement), study and visit visas, where migrants are less likely to have been granted settlement or have valid leave to remain in the 2007 cohort than in earlier cohorts. The period covered will include the recent economic recession, which may have reduced the likelihood of such migrants seeking to remain longer in the UK.
2.1 Migrants in each cohort still holding valid leave to remain or granted settlement after 5 years, by visa type
| Cohort | Family | Skilled work (with a potential path to settlement) | Work (not leading to settlement) | Study | Visit |
| 2004 | 60% | 46% | 11% | 23% | 3% |
| 2005 | 61% | 45% | 10% | 21% | 3% |
| 2006 | 67% | 42% | 9% | 19% | 3% |
| 2007 | 67% | 33% | 7% | 15% | 1% |
Table notes
Source: Home Office, Migrant journey, table MJ 01 to 05.
- A separate analysis of those granted settlement in 2012 shows that just over half (54%) had originally been issued a family or skilled work visa which could potentially lead to settlement and 12% were granted settlement on arrival. Around a third originally entered on a temporary route and later switched into a route that led to permanent settlement.
2.2 Immigration status after 5 years of those issued visas in the 2007 cohort, by visa type
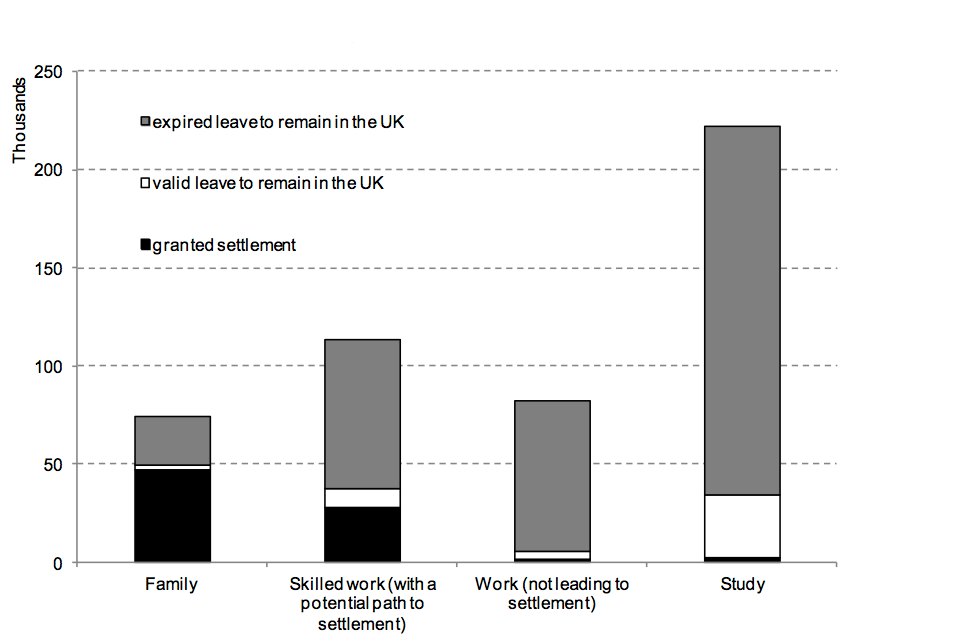
Chart notes
Source: Home Office, Migrant journey, table MJ 01 to MJ 04.
3. Forward-view analysis
The forward-view analysis examines migrants granted visas to the UK in 2004. In addition, potential changes in migrant behaviour over time are explored by comparing the revised results for the 2004 cohort with the later cohorts of 2005, 2006 and 2007.
There are 5 main routes of entry to the UK for migrants from outside the European Economic Area (EEA). The forward-view analysis explores these routes, which include:
- family
- skilled work (with a potential path to settlement)
- work (not leading to settlement)
- study
- visit (for those from non-European Economic Area (EEA) countries who are required to hold a visit visa)
The analysis tracks migrants who were granted visas in each of these routes through the immigration system in order to identify their immigration status at the end of the fifth year after their initial year of entry. The forward-view analysis of migrants granted visas in 2004, 2005, 2006 and 2007 identifies the points at which an individual’s entry clearance visa or extension of stay changed category or expired.
The expiration of an individual’s entry clearance visa or extension of stay does not necessarily confirm that the migrant has left the UK and returned to their home country. In fact, there are 4 possible outcomes for such migrants:
- the migrant has left the UK
- the migrant is still in the UK (as an overstayer)
- the migrant has made an application for a further extension of stay that has not been identified/recorded or
- the migrant never travelled to the UK (the visa was not used)
As the UK does not at present have full exit controls, it is not possible to estimate the proportion of those whose entry clearance visa or extension of stay has expired who have left the UK.
4. Family
For people issued a family visa in 2004, more than half (54%) had gained settlement (permission to stay permanently in the UK) 5 years later, and a further 6% still had valid leave to remain in the UK.
For people issued a family visa in 2005, the number granted settlement and with valid leave to remain in the UK was similar. However, for those arriving in 2006 and 2007, the proportion who had settled within 5 years was higher (62% and 64% respectively). This difference can be accounted for by more migrants on the family route taking up settlement when they become eligible after 2 years, rather than extending their leave to remain. Of the people issued a family visa in 2007, 41% had gained settlement after 2 years.
4.1 Comparison of migrant cohorts issued a visa through the family route, by immigration status 5 years later
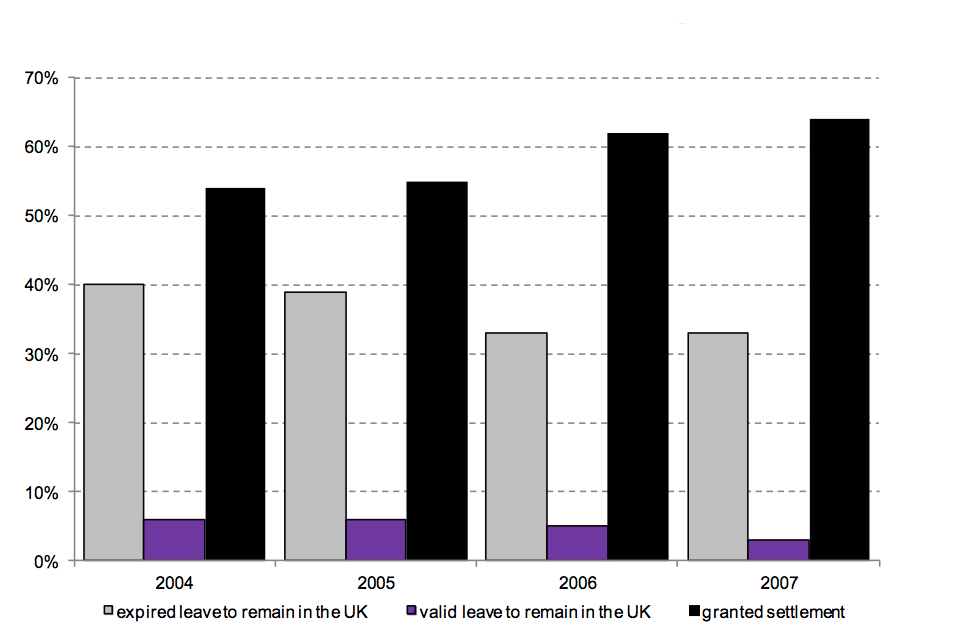
Chart notes
Source: Home Office, Migrant journey, table MJ 01.
Of the people issued a family visa in 2007, 68% were main applicants and 32% were their dependants. In the 2007 cohort, the top 5 nationalities accounted for nearly half (47%) of the visas issued through the family route.
4.2 Top 5 nationalities in the 2007 cohort issued family visas
| Nationality | Migrants in 2007 cohort | Proportion that were dependants | Immigration status 5 years later: % with expired leave to remain in the UK | Immigration status 5 years later: % with valid leave to remain in the UK | Immigration status 5 years later: % granted settlement |
| All nationalities | 74,386 | 32% | 33% | 3% | 64% |
| Of which: | |||||
| Pakistani | 11,869 | 17% | 15% | 2% | 82% |
| Indian | 11,586 | 54% | 45% | 2% | 53% |
| American | 4,941 | 53% | 67% | 3% | 30% |
| Afghan | 3,870 | 51% | 11% | 1% | 88% |
| Bangladeshi | 3,034 | 14% | 7% | 1% | 92% |
Table notes
Source: Home Office, Migrant journey, table MJ 01.
From the above table, it can be seen that the top 5 nationalities differ in the number with dependants and the proportion that settled at the end of the 5-year period. For example, 17% of the Pakistani group were dependants compared to 54% for Indians. A lower proportion of American nationals were settled after 5 years (30%) compared with nationals from Bangladesh (92%), Afghanistan (88%) and Pakistan (82%).
5. Skilled work (with a potential path to settlement)
For people issued a skilled worker’s visa in 2004, 31% had gained settlement 5 years later, and a further 16% still had valid leave to remain in the UK.
Comparison of the 2004 cohort to the 3 subsequent cohorts indicates that there has been a rise in the proportion of people whose leave had expired after 5 years, from 54% in 2004 to 67% in 2007. This is reflected in the fall in the proportion of people from these cohorts who had valid leave to remain after 5 years, from 16% in 2004 to 9% in 2007. Some of this difference may be due to the increasing influence of the economic recession over the period analysed, which may have reduced the likelihood of some migrants choosing to remain longer in the later cohorts.
The proportion of skilled non-EEA workers who gained settlement after 5 years was similar for 2004, 2005 and 2006 (31%, 32% and 30% respectively) but was lower for the 2007 cohort (25%). Of the people issued a skilled workers visa in 2007, 38% had expired leave after 2 years.
5.1 Comparison of migrant cohorts issued a visa through the skilled work route (with a potential path to settlement), by immigration status 5 years later
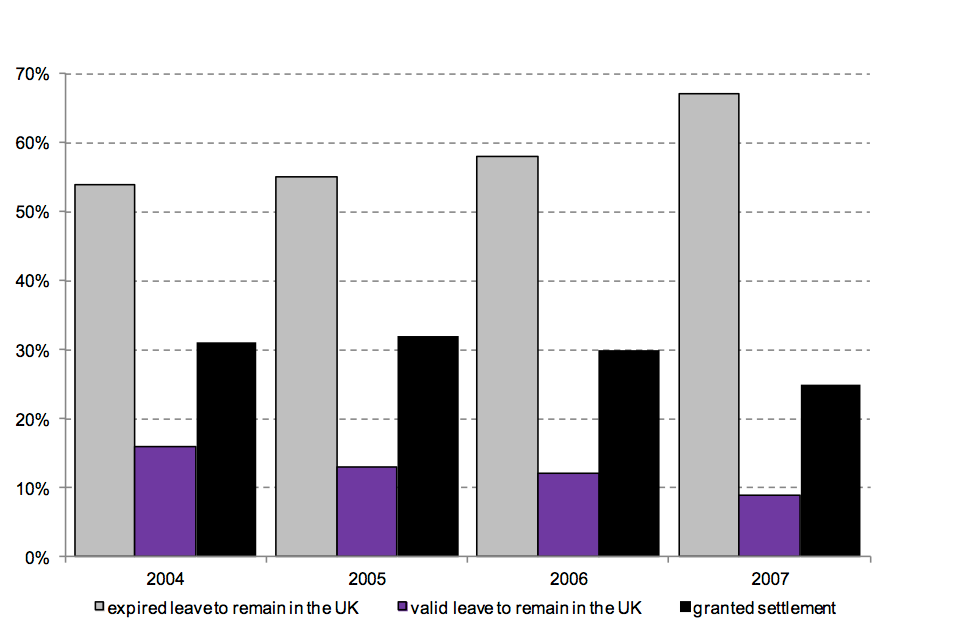
Chart notes
Source: Home Office, Migrant journey, table MJ 02.
Approximately two-thirds (63%) of those issued skilled work visas in the 2007 cohort were main applicants and 37% were their dependants. The number of dependants in this cohort is higher than other routes.
In the 2007 cohort, the top 5 nationalities accounted for nearly two-thirds (63%) of the skilled work route.
5.2 Top 5 nationalities in the 2007 cohort issued skilled work visas (with a potential path to settlement)
| Nationality | Migrants in 2007 cohort | Proportion that were dependants | Immigration status 5 years later: % with expired leave to remain in the UK | Immigration status 5 years later: % with valid leave to remain in the UK | Immigration status 5 years later: % granted settlement |
| All nationalities | 113,234 | 37% | 67% | 9% | 25% |
| Of which: | |||||
| Indian | 41,426 | 36% | 67% | 9% | 24% |
| American | 13,060 | 42% | 79% | 10% | 11% |
| Australian | 8,042 | 16% | 81% | 7% | 11% |
| South African | 4,654 | 28% | 59% | 11% | 30% |
| Filipino | 4,633 | 55% | 27% | 11% | 63% |
Table notes
Source: Home Office, Migrant journey, table MJ 02.
From the above table, it can be seen that the proportion of dependants arriving in 2007 differed by nationality. Filipinos were most likely to have been granted settlement after 5 years (63%) and had the highest proportion of dependants (55%) in comparison to other countries. In contrast, a lower proportion of Americans and Australians were granted settlement (11%).
6. Temporary work (not leading to settlement)
In contrast to skilled workers, just 3% of people issued a temporary work visa in 2004 had gained settlement 5 years later, and a further 9% still had valid leave to stay in the UK.
A slightly lower proportion of people from the 2005, 2006 and 2007 cohorts gained settlement after 5 years (2%). In addition, the proportion who still had valid leave after 5 years also fell, to 5% for the 2007 cohort.
The low stay rates are unsurprising given the nature of these temporary routes. The majority of migrants who entered the UK in this route appeared to stay in the UK for a relatively short period of time. After 2 years, 91% of the people issued a temporary work visa in 2007 had expired leave.
6.1 Comparison of migrant cohorts issued a visa through the work route (not leading to settlement), by immigration status 5 years later
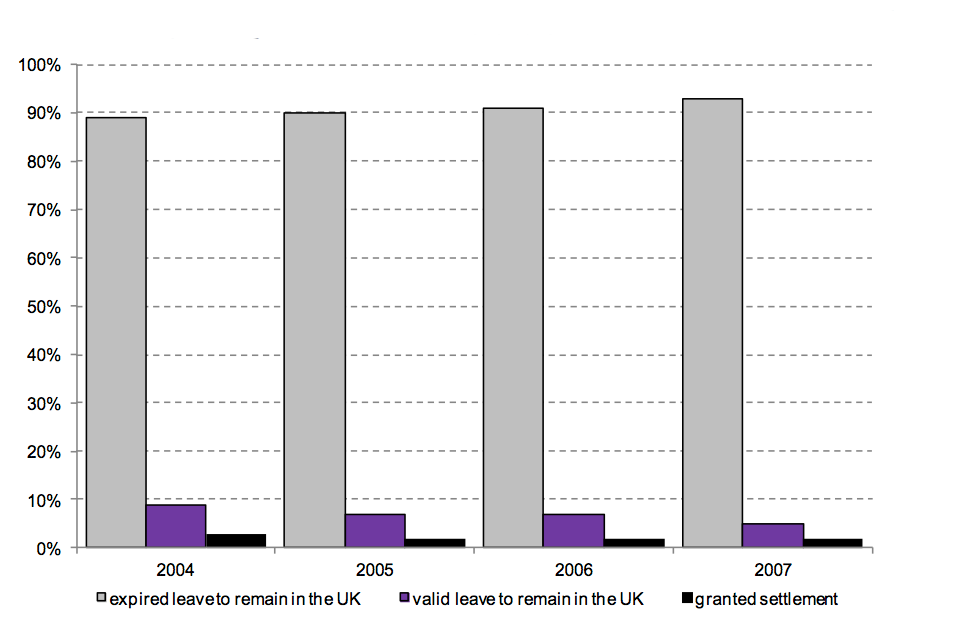
Chart notes
Source: Home Office, Migrant journey, table MJ 03.
The majority of those granted a work (not leading to settlement) visa in 2007 were main applicants (99.7%). In the 2007 cohort, the top 5 nationalities accounted for over half (56%) of the work (not leading to settlement) route.
6.2 Top 5 nationalities in the 2007 cohort issued work visas (not leading to settlement)
| Nationality | Migrants in 2007 cohort | Immigration status 5 years later: % with expired leave to remain in the UK | Immigration status 5 years later: % with valid leave to remain in the UK | Immigration status 5 years later: % granted settlement |
| All nationalities | 82,545 | 93% | 5% | 2% |
| Of which: | ||||
| Australian | 18,608 | 92% | 6% | 1% |
| Indian | 9,303 | 92% | 5% | 3% |
| South African | 7,376 | 88% | 8% | 4% |
| Filipino | 5,554 | 96% | 3% | 1% |
| Ukrainian | 5,492 | 99% | 1% | 0% |
Table notes
Source: Home Office, Migrant journey, table MJ 03.
This route does not lead to settlement and some categories do not allow migrants to bring their dependants. Those migrants in this route who have achieved settlement will in most cases have married settled persons or British citizens or switched into other routes. Analysis of the previous category of individuals granted an extension in 2011 and 2012 is given in the article ‘Extensions of stay by previous category’.
7. Study
For people issued a study visa in 2004, only 3% had gained settlement 5 years later, but a further 21% still had valid leave to stay in the UK, either as students or in another route. Those people arriving on a student visa would have switched into a permanent route (such as skilled work or marriage) in order to have obtained settlement.
Comparison of the 4 cohort years suggests that there has been a sizable fall in the proportion of student migrants who still had valid leave to remain in the UK 5 years after their arrival, or who had achieved permanent settlement in the UK, from 23% in the 2004 cohort to 15% in the 2007 cohort. This is consistent with the tightening of the Immigration Rules for students since September 2007, for details please see the user guide policy changes, but may also be partly related to the economic recession which occurred towards the end of the period analysed here, and which will have reduced the incentive for students to remain and seek work in the UK.
Comparison of the latest results for the 4 cohorts indicates a 2 percentage point reduction in students gaining settlement after 5 years and a 7 percentage point reduction in students with valid leave to remain in the UK after the same time. This trend equates to an increase of 8 percentage points for students whose leave has expired after 5 years across the 4 cohorts. Of the people issued a study visa in 2007, 61% had expired leave after just 2 years, reflecting the fact that many people on student visas will come to study shorter courses and not just longer degree courses.
7.1 Comparison of migrant cohorts issued a visa through the study route, by immigration status 5 years later
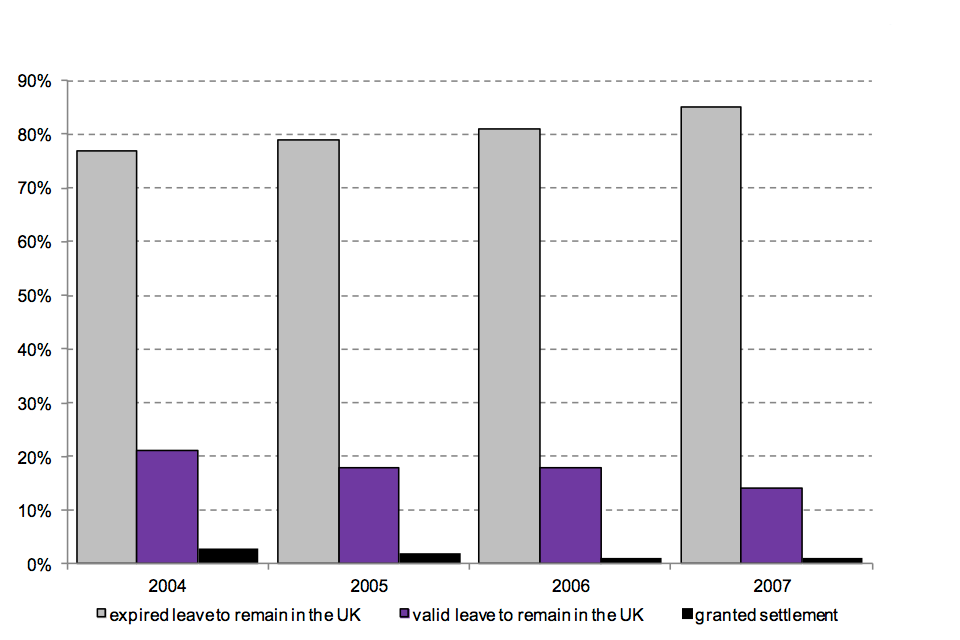
Chart notes
Source: Home Office, Migrant journey, table MJ 04.
Just over 9 in 10 (92%) of those granted a study route visa in 2007 were main applicants (the student); the remaining 8% comprised those travelling as a dependent family member.
In the 2007 cohort, the top 5 nationalities accounted for nearly two-fifths (39%) of the study route.
7.2 Top 5 nationalities in the 2007 cohort issued study visas
| Nationality | Migrants in 2007 cohort | Proportion that were dependants | Immigration status 5 years later: % with expired leave to remain in the UK | Immigration status 5 years later: % with valid leave to remain in the UK | Immigration status 5 years later: % granted settlement |
| All nationalities | 221,723 | 8% | 85% | 14% | 1% |
| Of which: | |||||
| Indian | 22,983 | 8% | 77% | 23% | 1% |
| Chinese | 22,783 | 2% | 80% | 19% | 1% |
| Russian | 22,026 | 0% | 98% | 2% | 0% |
| Pakistani | 11,473 | 15% | 62% | 35% | 3% |
| American | 10,886 | 5% | 91% | 8% | 1% |
Table notes
Source: Home Office, Migrant journey, table MJ 04.
Of the visas issued to Pakistani students, 15% were issued to dependants; this was the highest proportion of the top 5 nationalities. In contrast, nearly all (99.8%) of the visas issued to Russian students were to main applicants. Of the visas issued to Indian students, 8% were issued to dependants and in line with the student average. Most Russian students’ leave to remain in the UK had expired after 5 years. Over a third (35%) of Pakistani students had valid leave to remain in the UK after 5 years compared with only 14% for all students.
8. Visit
Some nationalities, referred to as non-visa nationals, can enter the UK without a visa providing the purpose of the stay is visit-related. All other non-EEA nationals require a visit visa, which provides leave to stay in the UK for up to 6 months. Different types of visit visas are available to suit the purpose of the visit (for example, tourism, business, family and study). This section provides details of the migrants who started their journey with a visit visa granted in the cohort year.
For people issued a visit visa in 2004, 2% had valid leave to stay in the UK after 5 years and a further 1% had gained settlement after the same period. The same results were observed for the 2005 and 2006 cohorts, followed by a small fall for the 2007 cohort.
As the purpose of travel for most visitors is short-term and temporary, it is not expected that many visitors are present 5 years after their initial arrival. The vast majority of visit journeys are ‘visit visa only’ (that is there is no subsequent application for a non-visit visa or case recorded on the ‘in-country’ administrative database). Of the people issued a visit visa in 2007, 95% had expired leave after 2 years.
9. 2007 cohort by end-of-year immigration status
Around 40% (30,626) of those issued a family visa in the 2007 cohort had received a grant of settlement in 2009, having spent 2 years in the UK; 55% had received a grant after 3 years, 60% after 4 years and 64% after 5 years. This is consistent with the settlement rights of the visa categories that make up the family route. Spouses and partners joining a British citizen or settled person in 2007 could apply for settlement after a 2-year probationary period. The findings of the forward analysis thus indicate that family route migrants take up their opportunity to obtain settlement soon after they become eligible.
Skilled workers with visas that potentially lead to settlement are normally eligible to apply for settlement after 5 years. Dependants issued a visa in 2007 were eligible to apply for settlement at the same time as the principal applicant, provided they had completed a 2-year probationary period. This means that a migrant could bring a wife or husband to live in the UK after up to 3 years of living here, and both spouses would be able to apply together for settlement once the sponsor completed 5 years of working in the UK on a route to settlement; the dependants may appear in the 2007 cohort but the main applicant may have arrived in an earlier year. Three per cent (3,298) of those issued skilled worker visas in the 2007 cohort received a grant of settlement in 2009, of which 99% (3,264) were dependants. This increased to 6% after 3 years (6,533, of which 98% were to dependants), 10% after 4 years (11,621, of which 95% were to dependants) and 25% after 5 years (27,778, of which 65% were to dependants). This shows that the take up of the opportunity for skilled workers to settle is lower as compared with those on family route visas, with trends over time influencing the increased granting of settlement in the fourth and fifth year after arrival. This difference may be because people coming to work do not necessarily intend to stay permanently in the UK.
9.1 Migrants in the 2007 cohort granted settlement at the end of each year, by visa type
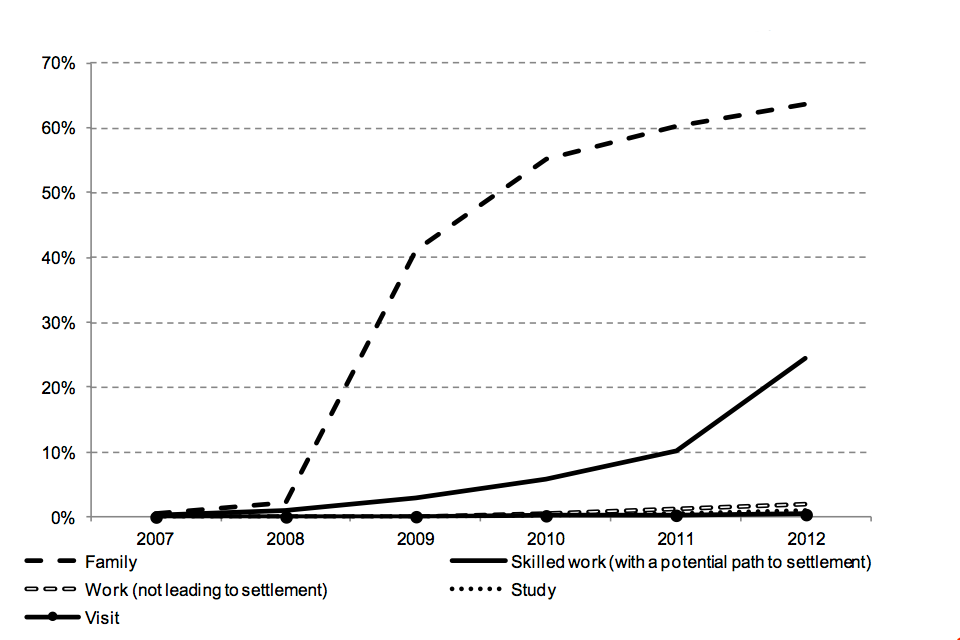
Chart notes
Source: Home Office, Migrant journey, table MJ 01 to MJ 05.
From the chart below, it can be seen that those issued a family visa in the 2007 cohort were most likely to have achieved settlement or have valid leave to remain after 5 years (67%; 49,530) compared to those on the work (not leading to settlement; 7% or 5,564) and visit routes (1%; 20,144). As one might expect the decline over time is most rapid for those initially with visit visas and is slowest for the family visas where the majority ultimately are granted settlement. The decline for those originally arriving on study visas is less rapid than for those on work visas (not leading to settlement) but more rapid than those on skilled work visas (with a potential path to settlement).
Just over a third (36%; 26,707) of those on the 2007 family route cohort received a grant of valid leave to remain in 2009. This compares with 59% (66,722) of those on the skilled workers route and 39% (85,900) of those on the study route. A small proportion of students attend 1-year courses and so leave the system fairly early, while those on mid-length courses (e.g. graduate and post-graduate degrees) are likely to remain in the UK for 3 years or more. The small proportion of migrants with valid leave to remain as a student in 2012 may represent either those on longer-term career education (e.g. medical students) or those individuals who have undertaken more than 1 course of study.
Of the 2007 work route (not leading to settlement) cohort, 54% (44,416) had received a grant of valid leave to remain in 2008 but this dropped considerably, to 9% (7,790) in 2009. This reduction is expected, as those who applied under a temporary worker scheme (the work route that doesn’t lead to settlement) are likely to have only intended to stay in the UK for a short period of time.
9.2 Migrants in the 2007 cohort still holding valid leave to remain or granted settlement at the end of each year, by visa type
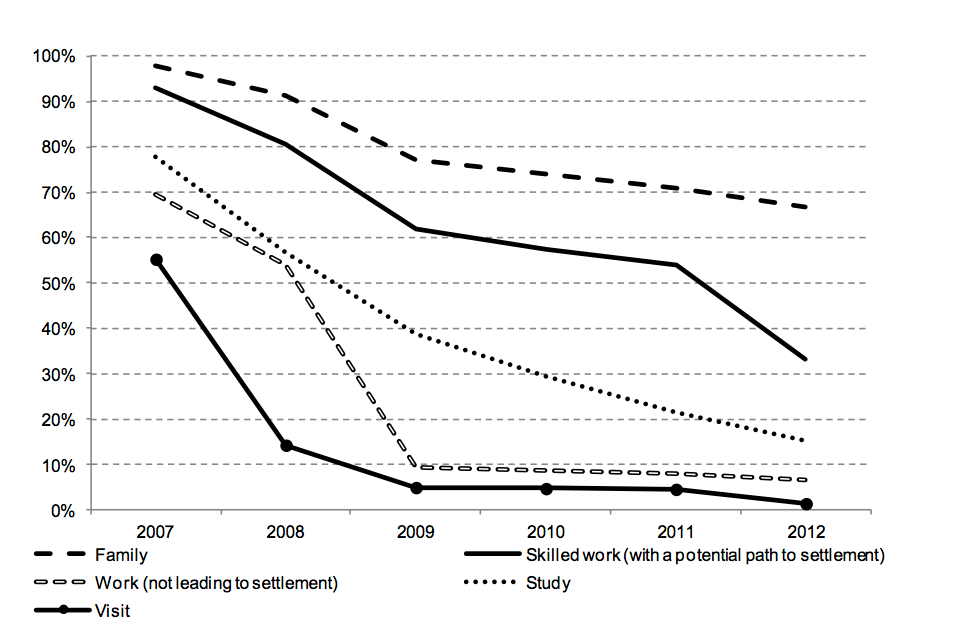
Chart notes
Source: Home Office, Migrant journey, table MJ 01 to MJ 05.
10. Backward-view analysis
The migrant journey does not only look at those cohorts of people who were issued a visa to come to the UK in a particular year and what happens to them but also looks at those whose entry to the UK ultimately results in them applying for settlement – permission to stay permanently in the UK – and which visas they used to do so.
The second half of this report looks at the immigration case histories of migrants who were granted settlement in 2009 (185,985 cases), 2010 (230,026 cases), 2011 (159,261 cases) and 2012 (123,681 cases). The analysis involved tracing migrants back through their immigration records, identifying the grants of leave they received for their original entry clearance.
Limitations of data matching, available data and the rules for settlement mean that it was not always possible to trace every case back to the first visa record. In addition, some original entry records will pre-date the electronic databases used for this analysis.
A number of cases had settlement as their first record, meaning that they either had been granted settlement on arrival (indefinite leave to enter (ILE)) or a grant of indefinite leave to remain (ILR) as their earliest record. Further analysis of migrants with indefinite leave to remain as a first record found that some migrants could not be linked to an initial visa record, in most cases probably because they entered the UK prior to the establishment of the electronic databases from which these data were drawn. The higher volume of cases granted settlement in 2010 reflect more grants given on a discretionary or other basis resulting from a review of the backlog of cases involving unsuccessful asylum applications announced in July 2006 by the then Home Secretary.
The proportion of settlement grants that derive from an original visa category with a normal route to settlement – the family or skilled work (with a potential path to settlement) routes – has fluctuated from 53% for cases in 2009, 42% in 2010, 48% in 2011 and 53% in 2012.
The most common pathways to settlement were the direct routes to settlement allowed under the Immigration Rules. These are the family route and skilled work routes. Of those migrants granted settlement in 2012, 29% had originally entered the UK on a skilled work route, while 25% were granted settlement having arrived in the family route, without moving through another immigration route. Both of these routes allow a grant of settlement without the migrant switching to another immigration category. A further 12% had settlement as their first record and this still leaves a third of settlement cases who had arrived in a temporary route and later switched into a route to permanent settlement, including the one-sixth of settlement grants which were to people who originally entered the UK as students or accompanying a student.
10.1 Common immigration routes of those granted settlement in 2009-2012
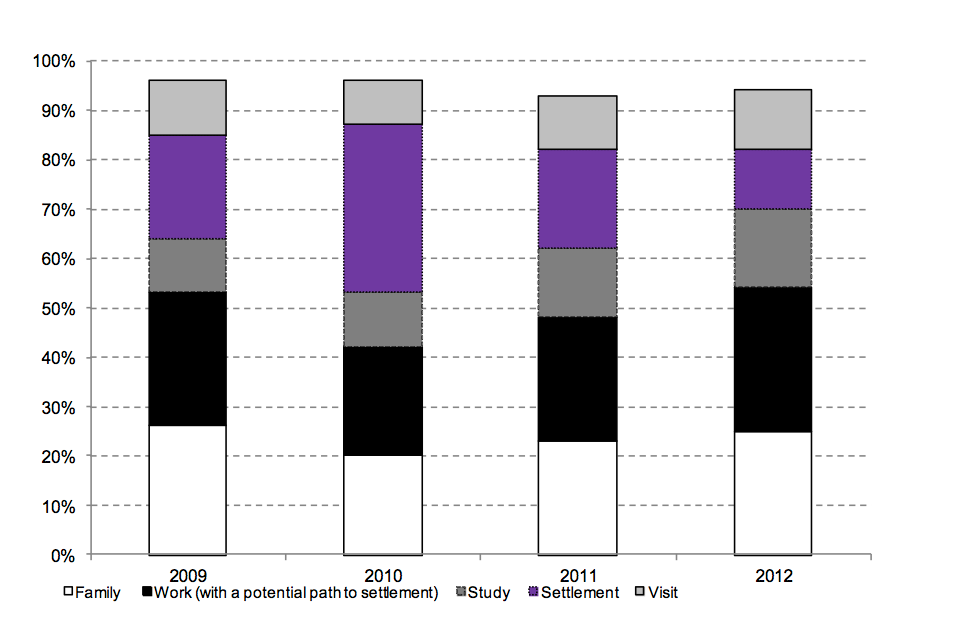
Chart notes
Source: Home Office, Migrant journey, table MJ 06. The chart displays the most common immigration routes and excludes other categories which include EEA family permits and work (not leading to settlement).
From the table below, it can be seen that the number of dependants granted settlement in 2012 differed by the initial route of entry. Approximately two-thirds (68%, 84,006) of the total number of settlement grants in 2012 were issued to main applicants and 32% (39,675) were issued to their dependants. Of the dependants granted settlement in 2012, nearly half (49%, 19,634) initially entered the UK on a work visa (with a potential path to settlement).
10.2 Common immigration routes of those granted settlement in 2012
| Initial route of entry | Total | Main applicant | Dependants |
| Total | 123,681 | 84,006 | 39,675 |
| Of which: | |||
| Family | 30,368 | 23,294 | 7,074 |
| Skilled work (with a potential path to settlement) | 35,330 | 15,696 | 19,634 |
| Study | 19,813 | 16,946 | 2,867 |
| Settlement | 14,852 | 8,999 | 5,853 |
| Visit | 15,387 | 12,181 | 3,206 |
Table notes
Source: Home Office, Migrant journey, table MJ 06. The table displays the most common immigration routes and excludes other categories which include EEA family permits and work (not leading to settlement).
In the 2012 cohort, the top 5 nationalities accounted for 46% of the total number of settlement grants in that year. The numbers of migrants from particular nationalities will reflect the make-up of migrants on a path to settlement (entering some years earlier) and may not reflect the pattern amongst those migrants arriving now.
10.3 Top 5 nationalities granted settlement in 2012 by initial route of entry to the UK
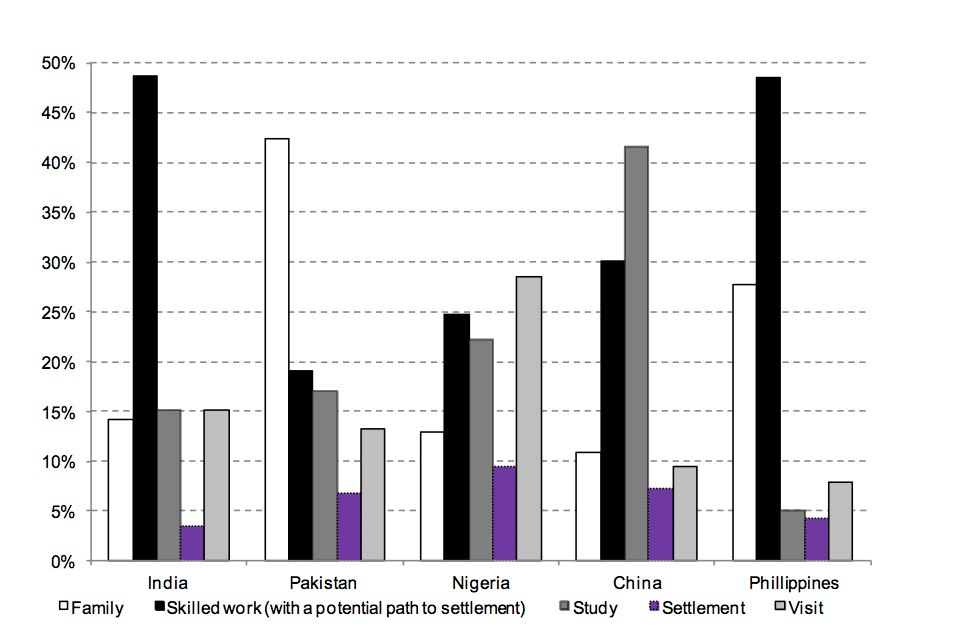
Chart notes
Source: Home Office, Migrant journey, table MJ 06. The chart displays the most common immigration routes and excludes other categories which include EEA family permits and work (not leading to settlement).
Of those granted settlement in 2012, 25,992 (21%) were Indian migrants. Of these, 49% (12,637) initially entered the UK on a work (with a potential path to settlement) visa. Three-thousand-nine-hundred-and-twenty-seven (15%) of Indian migrants who were granted settlement in 2012 initially came to the UK to study, which was the highest number in comparison with other nationalities, and 3,920 (15%) came on a visit visa.
Pakistani was the second highest-volume nationality in the 2012 group, with just over 12,500 migrants granted settlement. Of these, 42% were originally issued family route visas. A further 19% (2,403) came to the UK on a work (with a potential path to settlement) visa, 17% (2,139) came to study and 13% (1,669) came on a visit visa.
The third largest group in 2012 were Nigerians: 29% (1,816) who were granted settlement in the 2012 cohort initially entered the UK on a visit visa and 25% (1,580) on a work (with a potential path to settlement) visa.
Chinese migrants granted settlement tended to come to the UK as students (42%; 2,484); the second highest number of students in the 2012 group. A further 30% (1,800) came to the UK to work (with a potential path to settlement).
Of the Filipino migrants, just under half (49%; 2,677) were originally issued work (with a potential path to settlement) visas and 28% (1,531) were issued family visas.
South Africans, the sixth highest-volume nationality in the 2012 group, had the highest number (1,794; 37%) of migrants granted settlement who initially entered the UK on a work (not leading to settlement) visa.
11. Data tables
Further data are available in migrant journeys tables MJ 01 to MJ 06.
12. About the figures
This is the fourth in a series of research reports based on the ‘Migrant Journey’ cohort data. We plan in future to move to publishing an update of information annually as an official statistics release. This would naturally complement data already published as part of our regular National Statistics publication on Migration Statistics. If as a user you have any comments on this plan please email MigrationStatsEnquiries@homeoffice.gov.uk.
The findings presented here are based on data collected from 2 Home Office administrative databases. These databases hold records of individuals granted entry clearance visas, and any subsequent grants of extensions of stay in the UK. The User Guide to the Home Office Migrant Journey provides further detail on this topic including definitions used, how figures are compiled, data quality and issues arising from figures based on data sourced from an administrative database.
Checks on the alignment of entry clearance visa endorsements are ongoing and may be reviewed in the next report. Skilled work (with a potential path to settlement) relates to work categories that were eligible to apply for settlement after a specified time period. These were mainly routes equivalent to PBS Tiers 1 and 2, and some unskilled routes e.g. domestic workers. More information can be found in the User Guide to the Home Office Migrant Journey.
The numbers of applications and decisions made reflect changes in levels of immigration over time, as well as policy and legislative changes, including changes to immigration legislation. Details of these policy changes, together with information on changes to immigration legislation affecting the statistics, can be found in the Policy and Legislative Changes Timeline published alongside this report.
All data are provisional.
13. Other related data
In September 2010 the Home Office published ‘The Migrant Journey’, which presented data on the cohort of migrants who came to the UK in 2004. The findings reported the immigration status of these migrants over the subsequent 5 years, where migrants changed their category of leave and how migrants in temporary and permanent immigration routes achieved settlement in the UK.
In August 2011, the migrant journey second report extended the September 2010 analysis by reporting on specific migrant nationalities granted visas in 2004.
In February 2013, the migrant journey third report extended the August 2011 analysis by providing updates for 2 later cohorts of migrants, namely 2005 and 2006 for the forward-view analysis and 2010 and 2011 for the backward-view analysis.
A short statistical article on ‘Extensions of stay by previous category’ has also been published alongside the Immigration Statistics April-June 2013 release to provide further detailed information.