UK House Price Index (HPI) for June 2017
The UK House Price Index shows house price changes for England, Scotland, Wales and Northern Ireland.
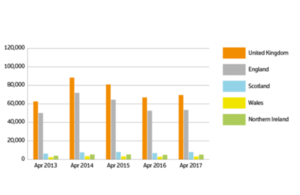
sales volumes by country
The June data shows:
- an annual price increase of 4.9% which takes the average property value in the UK to £223,257
- house prices have risen by 0.8% since May 2017
- the monthly index figure for the UK was 117.1
The data shows:
-
in England, an annual price increase of 5.2% which takes the average property value to £240,325. Monthly house prices have risen by 0.8% since May 2017
-
in Wales, an annual price increase of 3.6% which takes the average property value to £151,672. Monthly house prices have risen by 2.9% since May 2017
-
in London shows an annual price increase of 2.9% which takes the average property value to £481,556. Monthly house prices have fallen by 0.7% since May 2017
The regional data indicates that:
- the East of England experienced the greatest increase in average property price over the last 12 months, with a movement of 7.2%
- Yorkshire and the Humber experienced the greatest monthly price growth with an increase of 2.2%
- the North East saw the lowest annual price growth with an increase of 2.5%
- London saw the most significant monthly price fall of 0.7%
The UK Property Transaction statistics showed that in June 2017 the number of seasonally adjusted property transactions completed in the UK with a value of £40,000 or above increased by 1% compared with June 2016. Comparing June 2017 with May 2017, property transactions fell by 3.3%. See the economic statement.
Sales during April 2017, the most up-to-date HM Land Registry figures available, show that:
- the number of completed house sales in England rose by 1.6% to 53,410 compared with 52,590 in April 2016
- the number of completed house sales in Wales rose by 9.9% to 3,101 compared with 2,822 in April 2016
- the number of completed house sales in London rose by 1.3% to 5,823 compared with 5,746 in April 2016
- there were 510 repossession sales in England in April 2017
- there were 52 repossession sales in Wales in April 2017
- the lowest number of repossession sales in England and Wales in April 2017 was in the East of England
Price change by region for England
| Region | Monthly change % since May 2017 | Annual change % since June 2016 | Average price June 2017 |
|---|---|---|---|
| East Midlands | 1.0 | 7.1 | £182,166 |
| East of England | 0.3 | 7.2 | £286,623 |
| London | -0.7 | 2.9 | £481,556 |
| North East | 1.9 | 2.5 | £130,065 |
| North West | 1.9 | 5.5 | £156,392 |
| South East | 0.6 | 4.9 | £320,168 |
| South West | 0.7 | 5.3 | £246,159 |
| West Midlands | 0.5 | 4.7 | £185,082 |
| Yorkshire and the Humber | 2.2 | 4.9 | £157,762 |
Average price by property type for England
| Property type | June 2017 | June 2016 | Difference % |
|---|---|---|---|
| Detached | £359,615 | £342,170 | 5.1 |
| Semi-detached | £222,438 | £210,756 | 5.5 |
| Terraced | £194,301 | £185,472 | 4.8 |
| Flat/maisonette | £227,549 | £215,500 | 5.6 |
| All | £240,325 | £228,430 | 5.2 |
Price change for Wales
| Wales | Monthly change % since May 2017 | Annual change % since June 2016 | Average price June 2017 |
|---|---|---|---|
| Wales | 2.9 | 3.6 | £151,672 |
Average price by property type for Wales
| Property type | June 2017 | June 2016 | Difference % |
|---|---|---|---|
| Detached | £225,354 | £219,789 | 2.5 |
| Semi-detached | £145,783 | £140,409 | 3.8 |
| Terraced | £118,296 | £114,076 | 3.7 |
| Flat/maisonette | £112,412 | £105,906 | 6.1 |
| All | £151,672 | £146,447 | 3.6 |
Average price by property type for London
| Property type | June 2017 | June 2016 | Difference % |
|---|---|---|---|
| Detached | £897,788 | £885,121 | 1.4 |
| Semi-detached | £574,586 | £560,281 | 2.6 |
| Terraced | £489,944 | £483,455 | 1.3 |
| Flat/maisonette | £429,372 | £413,275 | 3.9 |
| All | £481,556 | £468,120 | 2.9 |
Sales volumes for England
| Month | Sales 2017 England | Sales 2016 England | Difference % |
|---|---|---|---|
| March | 65,939 | 111,901 | -41.1 |
| April | 53,410 | 52,590 | 1.6 |
Sales volumes for Wales
| Month | Sales 2017 Wales | Sales 2016 Wales | Difference % |
|---|---|---|---|
| March | 3,571 | 5,354 | -33.3 |
| April | 3,101 | 2,822 | 9.9 |
Sales volumes for London
| Month | Sales 2017 London | Sales 2016 London | Difference % |
|---|---|---|---|
| March | 7,472 | 16,322 | -54.2 |
| April | 5,823 | 5,746 | 1.3 |
Funding, buyer and building status for England
| Transaction Type | Monthly price change % since May 2017 | Annual price change % since June 2016 | Average price June 2017 |
|---|---|---|---|
| Cash | 1.0 | 5.3 | £226,238 |
| Mortgage | 0.8 | 5.1 | £247,422 |
| First time buyer | 1.0 | 5.2 | £202,630 |
| Former owner occupier | 0.7 | 5.1 | £271,594 |
| New build | -1.0 | 15.5 | £318,741 |
| Existing resold property | 1.0 | 4.6 | £235,470 |
Funding, buyer and building status for Wales
| Transaction Type | Monthly price change % since May 2017 | Annual price change % since June 2016 | Average price June 2017 |
|---|---|---|---|
| Cash | 2.9 | 3.2 | £147,397 |
| Mortgage | 2.9 | 3.8 | £154,208 |
| First time buyer | 3.2 | 3.6 | £131,477 |
| Former owner occupier | 2.6 | 3.5 | £175,095 |
| New build | 1.7 | 15.0 | £215,563 |
| Existing resold property | 3.0 | 3.0 | £148,297 |
Funding, buyer and building status for London
| Transaction Type | Monthly price change % since May 2017 | Annual price change % since June 2016 | Average price June 2017 |
|---|---|---|---|
| Cash | -0.6 | 3.3 | £509,562 |
| Mortgage | -0.7 | 2.7 | £472,989 |
| First time buyer | -0.6 | 2.9 | £422,246 |
| Former owner occupier | -0.7 | 2.8 | £541,828 |
| New build | -2.2 | 12.6 | £531,700 |
| Existing resold property | -0.5 | 2.1 | £477,715 |
Repossession
| Repossession sales | April 2017 |
|---|---|
| East Midlands | 41 |
| East of England | 15 |
| London | 53 |
| North East | 80 |
| North West | 108 |
| South East | 50 |
| South West | 41 |
| Yorkshire and the Humber | 82 |
| West Midlands | 40 |
| England | 510 |
| Wales | 52 |
Notes to editors
-
The UK House Price Index (HPI) is published on the second or third Tuesday of each month with Northern Ireland figures updated quarterly. The July 2017 UK HPI will be published at 9.30am on 12 September 2017. See calendar of release dates.
-
The UK HPI revision period has been extended to 13 months, following a review of the revision policy (see calculating the UK HPI section 4.4). This ensures the data used is more comprehensive.
-
New revision tables have been introduced for England and Wales within the downloadable data. Tables will be available in csv format. See about the UK HPI for more information.
-
Data for the UK HPI is provided by HM Land Registry, Registers of Scotland, Land & Property Services/Northern Ireland Statistics and Research Agency and the Valuation Office Agency.
-
The UK HPI is calculated by the Office for National Statistics (ONS) and Land & Property Services/Northern Ireland Statistics and Research Agency. It applies a hedonic regression model that uses the various sources of data on property price, in particular HM Land Registry’s Price Paid Dataset, and attributes to produce estimates of the change in house prices each month. Find out more about the methodology used from the ONS and Northern Ireland Statistics & Research Agency.
-
The first estimate for new build average price (April 2016 report) was based on a small sample which can cause volatility. A three-month moving average has been applied to the latest estimate to remove some of this volatility.
-
Work has been taking place since 2014 to develop a single, official HPI that reflects the final transaction price for sales of residential property in the UK. Using the geometric mean, it covers purchases at market value for owner-occupation and buy-to-let, excluding those purchases not at market value (such as re-mortgages), where the ‘price’ represents a valuation.
-
Information on residential property transactions for England and Wales, collected as part of the official registration process, is provided by HM Land Registry for properties that are sold for full market value.
-
The HM Land Registry dataset contains the sale price of the property, the date when the sale was completed, full address details, the type of property (detached, semi-detached, terraced or flat), if it is a newly built property or an established residential building and a variable to indicate if the property has been purchased as a financed transaction (using a mortgage) or as a non-financed transaction (cash purchase).
-
Repossession data is based on the number of transactions lodged with HM Land Registry by lenders exercising their power of sale.
-
For England this is shown as volumes of repossessions recorded by Government Office Region. For Wales there is a headline figure for the number of repossessions recorded in Wales.
-
The data can be downloaded as a .csv file. Repossession data prior to April 2016 is not available. Find out more information about repossessions.
-
Background tables of the raw and cleansed aggregated data, in Excel and CSV formats, are also published monthly although Northern Ireland is on a quarterly basis. They are available for free use and re-use under the Open Government Licence.
-
As a government department established in 1862, executive agency and trading fund responsible to the Secretary of State for Business, Energy and Industrial Strategy, HM Land Registry keeps and maintains the Land Register for England and Wales. The Land Register has been open to public inspection since 1990.
-
With the largest transactional database of its kind detailing more than 24 million titles, HM Land Registry underpins the economy by safeguarding ownership of many billions of pounds worth of property.
-
For further information about HM Land Registry visit www.gov.uk/land-registry.
-
Follow us on Twitter @HMLandRegistry and find us on our blogLinkedIn and Facebook
Contact
Email HMLRPressOffice@landregistry.gov.uk
Press Office 0300 006 3365