Housing Benefit debt recoveries statistics: April 2020 to March 2021
Published 1 September 2021

© Crown copyright 2021
This publication is licensed under the terms of the Open Government Licence v3.0 except where otherwise stated. To view this licence, visit nationalarchives.gov.uk/doc/open-government-licence/version/3 or write to the Information Policy Team, The National Archives, Kew, London TW9 4DU, or email: psi@nationalarchives.gov.uk.
Where we have identified any third party copyright information you will need to obtain permission from the copyright holders concerned.
This publication is available at https://www.gov.uk/government/statistics/housing-benefit-debt-recoveries-statistics-april-2020-to-march-2021/housing-benefit-debt-recoveries-statistics-april-2020-to-march-2021
The latest release of these statistics can be found in the collection of Housing Benefit: debt recoveries statistics.
This summary contains statistics on Housing Benefit Debt Recoveries (HBDR) covering the period from April 2020 to March 2021.
Data for all four quarters of the financial year ending (FYE) 2021 (April 2020 to March 2021).
Housing Benefit (HB) is an income related benefit that is intended to help meet housing costs for rented accommodation.
These Department for Work and Pensions (DWP) statistics show the amount of HB that is overpaid to claimants, the subsequent recoveries and amounts written off.
1. Main stories
During the FYE 2021:
-
£380 million HB overpayments identified
-
£414 million HB overpayments recovered
-
£63 million HB overpayments written off
The total GB value of HB outstanding overpayments at the beginning of January 2021 (Q4 of the FYE 2021) was £1.87 billion.
During the FYE 2021, the outstanding overpayments decreased in each consecutive quarter. The total outstanding, identified, recovered and written off overpayments all decreased in the FYE 2021 when compared with the FYE 2020 for Great Britain (GB). Within the FYE 2021, some variability was observed between quarters, with the amount of identified overpayments decreasing in Q1, Q2 and Q3 before experiencing an increase in Q4. The amount of recovered overpayments decreased in Q1 and Q2 before increasing in Q3 and Q4.
These decreases should be seen in context with the effects of the COVID-19 pandemic. This included local authorities (LAs) making operational decisions to redeploy staff to frontline activities and staff working from home, resulting in the majority of debt recovery staff not being in post for several months. In addition DWP paused all debt deduction recovery from DWP benefits for a period of at least 6 months.
When comparing to Q4 of the FYE 2020, only the South West and Scotland experienced an increase (23% and 37% respectively) in the amount of written off overpayments in Q4 of the FYE 2021.
During Q4 of the FYE 2021, the average identified overpayments per claimant per month was £11 in GB. This is a reduction of £2 compared to Q4 of the FYE 2020 (£13). Care must be taken when interpreting this yearly comparison as the makeup of claimants may have also changed, so this should be only used for indicative purposes.
2. What you need to know
This summary contains statistics relating to amounts of incorrectly overpaid HB.
Housing Benefit Debt Recoveries
Following the introduction of the Single Fraud Investigation Service (SFIS), which was live in all LAs by Q1 of the FYE 2017, this publication no longer includes fraud data. The publication was renamed ‘HBDR statistics’ to reflect this change.
HBDR data is aggregate level data received on a quarterly basis from each LA and published bi-annually at March and September. The March publication covers the first two quarters of the year (April to September). The publication in September covers finalised data for all four quarters of the year.
The amount of outstanding debt at the beginning of a quarter is a sum of the amount of debt outstanding at the beginning of the previous quarter and the debt recovery activities during the previous quarter. For example, the amount of debt outstanding at the beginning of Q2 is the sum of the amount of debt outstanding at the beginning of Q1 and the amount of debt identified during Q1, minus the amount of debt recovered and written off during Q1. In principle, the amount of debt outstanding at the beginning of any given reporting quarter could be estimated from the released figures of the previous quarter’s publication, as any new debt identified, written off or recovered related to a historic period would be reported in the current period and would be accounted for in the overall outstanding debt at the beginning of the following quarter. However, the reported debt at the beginning of the quarter is not always in line with these estimations. DWP is working with LAs to understand, address and minimise these discrepancies.
Some LAs do not send completed data forms every quarter, or cannot supply data for all fields. This produces missing data in the returns that affects the reported GB totals. In previous publications, DWP statisticians filled the gap created by missing data by imputing or estimating what the missing value might have been. Read the methodology document for a full explanation of this. In recent years the number of non-returner LAs have reduced to the point that imputation is now unnecessary. From September 2017, all figures in this statistical summary are based on actual returned data.
The number of people claiming HB has been gradually decreasing and will continue to fall as Universal Credit replaces HB for working age claimants. Accordingly, this is evident in decreases seen across HB debt recovery measures that LAs record and report to DWP between Q4 FYE 2019 through to the start of COVID-19 pandemic lockdown in March 2020. Since then, the decrease in HBDR measures has also been further impacted by the COVID-19 pandemic.
Supplementary statistics
Data tables containing data that underpin the charts and figures featured in this statistical summary are available. These include information by LA on outstanding overpayments at the beginning of each quarter and identified, recovered and written off overpayments at the end of each quarter.
Uses and users
HBDR are aggregate level data received on a quarterly basis from each LA. These data are used to produce established statistics on the amount of HB overpaid to claimants. The statistics also provide a means of comparing and contrasting information between LAs.
These statistics will be used to feed in to a range of briefings for Ministers and other senior officials and will be used to answer Parliamentary Questions and Freedom of Information requests. The statistics will also be used for other policy functions including monitoring and informing changes to related policies.
LA and regional data
The HBDR data are generated from the HB claims that LAs administer on behalf of DWP and are reported to DWP as total sums of HB overpayments by each LA. While for all LAs the majority of HB claims administered relate to households within their respective administrative geographical boundaries, for some LAs a small number of HB claims could relate to households outside of their boundaries. Therefore, care needs to be taken when interpreting individual LA’s HBDR data, as it is possible that not all the overpayment sums reported by a LA relate to households within its geographical boundaries. The HBDR data relates to the LAs and regions where the HB claims that have been overpaid were administered, regardless of where HB claimants reside.
The HB caseload data that some of the calculations in these statistics are based on also relates to the number of HB claims administered by LAs and regions regardless of where the claimants reside.
Rounding policy
Percentage figures provided in this document are based on data rounded to the nearest thousand (see the data tables accompanying each release of these statistics.
Recalculating the same percentage figures from data in this document might yield different results due to differences in rounding order.
Coronavirus (COVID-19)
During the FYE 2021, LAs made operational decisions to redeploy staff to frontline activities and moving to work from home, resulting in the majority of debt recovery staff not being in post. Debt recovery resources remained below pre-pandemic levels for the whole financial year.
Levels of debt recovered and written off have been affected by less enforcement activity taking place, and DWP pausing all debt deductions from other DWP benefits for a period of at least 6 months.
There has also been less activity on identifying overpayments as a result of redeployed staffing and changes to operational processes as a result of the pandemic, as well as fewer people having improvements to their circumstances.
Hackney data issue
HB datasets do not include figures for Hackney LA from October 2020 (Q3 FYE 2021), as a result of a cyber-attack suffered by the LA impacting data provision. These data problems are unlikely to be fixed until late into 2021. Therefore, all HB debt recovery figures for Hackney will be omitted from October 2020 onwards until resolution, in line with our standard approach for handling missing data. Analysis for Hackney using historical data shows that this is likely to affect the total outstanding, identified, recovered and written off measures by less than 2% at GB level. The effect at regional (London) level is an undercount of around 5% for the outstanding, identified and recovered and 11% for written off measures.
3. Housing Benefit outstanding overpayments at the start of the quarter
The total value of HB outstanding overpayments in GB continued to decrease during each consecutive quarter of the FYE 2021.
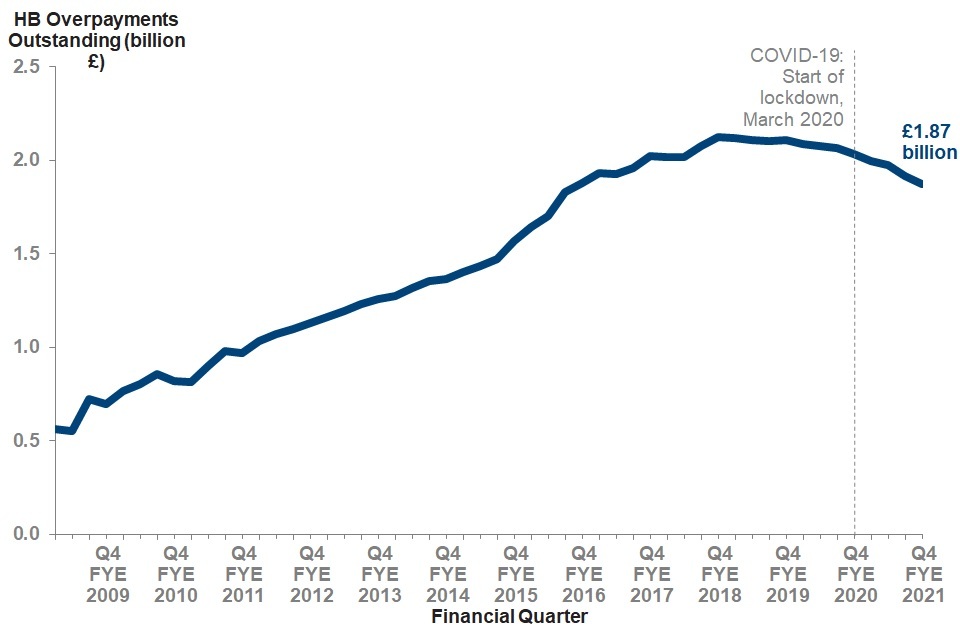
There was £1.87 billion in HB outstanding overpayments at January 2021 (the beginning of Q4 of the FYE 2021).
Outstanding overpayments (£ billions) in GB from April 2008 to January 2021
Source: HBDR data tables accompanying this release.
The value of outstanding overpayments followed a generally increasing trend from £554 million in Q2 FYE 2009, until it reached a peak of £2.12 billion in Q4 of the FYE 2018 and has gradually declined since. During the FYE 2021, the total value of outstanding overpayments continued to follow a decreasing trend throughout all four quarters.
The total GB value of HB outstanding overpayments at the beginning of January 2021 (Q4 of the FYE 2021) was £1.87 billion; a decrease of £157 million (8%) on January 2020.
Please see the additional information about the HBDR data.
London LAs reported 32% of the total outstanding overpayments at the beginning of Q4 of the FYE 2021.
Distribution across regions of outstanding overpayments, at the start of Q4 of the FYE 2021
| Region | HB outstanding overpayments at start of Q4 FYE 2021 (%) |
|---|---|
| North East | 4% |
| North West | 10% |
| Yorkshire and The Humber | 5% |
| East Midlands | 5% |
| West Midlands | 9% |
| East | 7% |
| London | 32% |
| South East | 12% |
| South West | 5% |
| Wales | 3% |
| Scotland | 8% |
Source: HBDR data tables accompanying this release.
At the start of Q4 of the FYE 2021 the value of HB outstanding overpayments reported by London accounted for 32% of the total GB figure, while the value of HB outstanding overpayments reported by Wales made up 3% of the GB total.
At January 2021, 90% (£1.68 billion) of the total outstanding HB overpayment was reported by England.
Outstanding overpayments (£ thousands) by country, at the start of Q4 of the FYE 2021
| Country | HB outstanding overpayments at start of Q4 FYE 2021 (£ thousands) |
|---|---|
| England | 1,680,025 |
| Wales | 51,596 |
| Scotland | 142,438 |
Source: HBDR data tables accompanying this release.
At the beginning of January 2021 (Q4 of the FYE 2021), London reported £609 million of the national total amount of outstanding HB overpayments.
Outstanding overpayments (£ thousands) by region, at the start of Q4 FYE 2021
| Region | HB outstanding overpayments at start of Q4 FYE 2021 (£ thousands) |
|---|---|
| North East | 65,601 |
| North West | 191,064 |
| Yorkshire and The Humber | 101,654 |
| East Midlands | 90,896 |
| West Midlands | 168,683 |
| East | 130,421 |
| London | 608,704 |
| South East | 220,129 |
| South West | 102,873 |
| Wales | 51,596 |
| Scotland | 142,438 |
Source: HBDR data tables accompanying this release.
At the start of Q4 of the FYE 2021, £829 million of outstanding HB overpayments were reported by London and the South East. This represents 44% of the total GB outstanding HB overpayments.
4. Housing Benefit identified overpayments during the quarter
The total value of HB identified overpayments decreased in consecutive quarters from Q1 to Q3 of the FYE 2021 and then increased in Q4 of the FYE 2021.
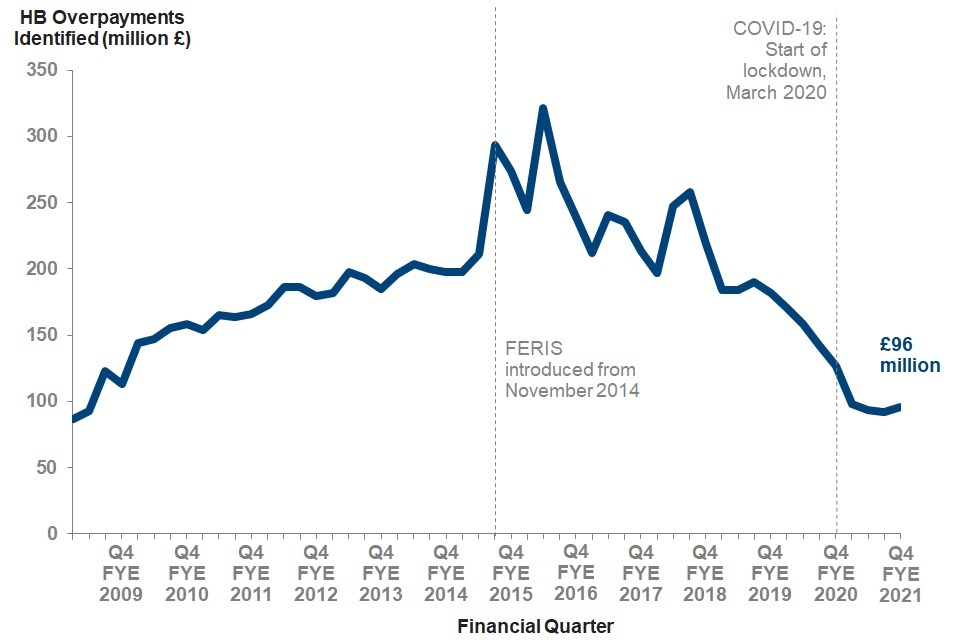
Identified overpayments (£ millions) in GB from Q1 of the FYE 2009 to Q4 of the FYE 2021
Source: HBDR data tables accompanying this release.
There was an increasing trend on the amount of identified overpayments from the FYE 2009 to Q2 of the FYE 2016 where the amount identified in one quarter reached a record high of £321 million. The FYE 2016 also saw the introduction of the Fraud and Error Reduction Incentive Scheme (FERIS) and Real Time Information (RTI) identifying long-term overpayments. Since then, the quarterly amounts of overpayments identified have become more unstable. This decrease in stability reflects pauses in RTI to allow LAs to manage their financial year end activities. Q2 of the FYE 2016 was followed by an overall decreasing trend of quarterly identified amounts, with the identified amount in Q3 of the FYE 2021, being the lowest quarterly figure reported by LAs since Q1 of the FYE 2009.
During the FYE 2021, the total value of HB identified overpayments was £380 million, a decrease of £219 million (37%) compared to identified overpayments in the FYE 2020.
The total value of identified overpayments decreased in Q1 of the FYE 2021 from £127 million at March 2020 (Q4 of the FYE 2020) to £98 million at Q1 of the FYE 2021. Identified overpayments continued to decrease in Q2 and Q3 of the FYE 2021, to £92 million in Q3. This is the lowest value of identified overpayments in any quarter since Q1 FYE 2009. Then at Q4, the total value of identified overpayments increased to £96 million.
The total amount of HB identified overpayments in Q4 of the FYE 2021 was £96 million. This was a decrease of £31 million (24%) from Q4 of the FYE 2020.
Please see the additional information about the HBDR data.
In Q4 of the FYE 2021 the average amount of identified HB overpayment per claimant per month in GB was £11.
Average HB overpayment identified (£) per claimant per month by region during Q4 FYE 2021
| Region | Average HB overpayments identified per claimant per month during Q4 FYE 2021 (£s) |
|---|---|
| Great Britain | £11 |
| North East | £7 |
| North West | £9 |
| Yorkshire and The Humber | £7 |
| East Midlands | £9 |
| West Midlands | £15 |
| East | £11 |
| London | £17 |
| South East | £13 |
| South West | £9 |
| Wales | £7 |
| Scotland | £7 |
During Q4 of the FYE 2021, in GB the average identified overpayments per claimant per month was £11. This compares to £13 in Q4 of the FYE 2020 which is a reduction of £2. Care must be taken when interpreting this yearly comparison as the makeup of claimants may have also changed, so this should be only used for indicative purposes.
During Q4 of the FYE 2021, London reported the largest average amount of identified debt per claimant per month (£17), based on HB caseload figures for all claimants in total (regardless of whether there is an overpayment in their HB claim or not) during this quarter, as published in Stat-Xplore.
London reported the largest average amount of identified debt per claimant per month. This indicates that if all regions had the same number of claimants, London would still have the largest amount of identified debt.
£86 million (90%) of identified overpayments in GB, were reported from English LAs.
Identified overpayments (£ thousands) reported by country during Q4 FYE 2021
| Country | HB identified overpayments during Q4 FYE 2021 (£ thousands) |
|---|---|
| England | 86,276 |
| Wales | 3,406 |
| Scotland | 6,334 |
Source: HBDR data tables accompanying this release.
Of the £96 million of HB identified overpayments in GB during Q4 of the FYE 2021, £86 million (90%) were reported by England, £6 million (7%) by Scotland and £3 million (4%) by Wales.
5. Housing Benefit overpayments recovered during the quarter
There was an overall decrease in overpayments recovered during the FYE 2021 compared to the FYE 2020.
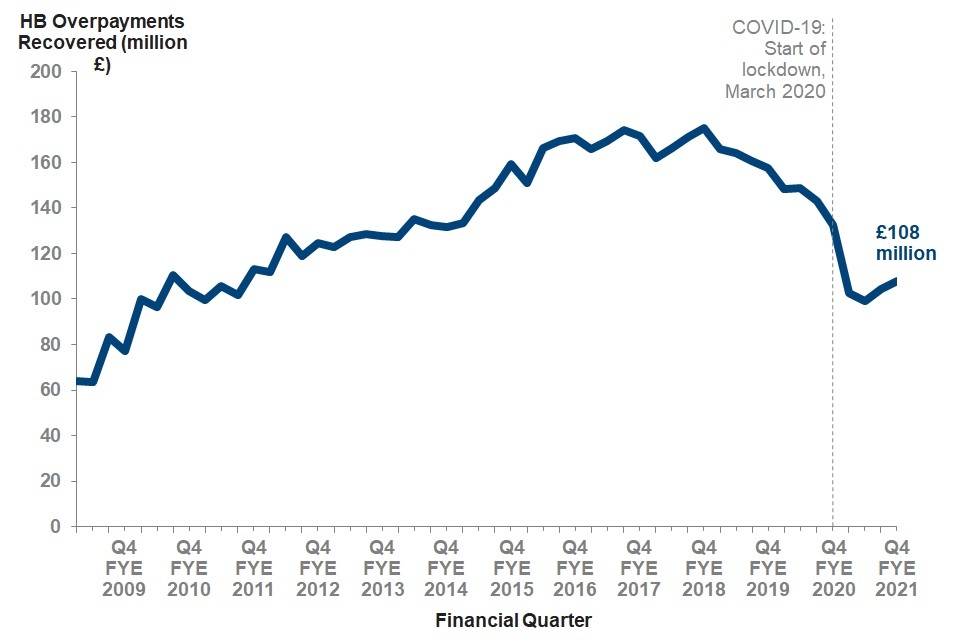
Recovered overpayments (£ millions) in GB from Q1 of the FYE 2009 to Q4 of the FYE 2021
Source: HBDR data tables accompanying this release.
Historically, the total value of overpayments recovered has tended to vary seasonally between quarters. Overall it has followed an upwards trend, reaching a high of £175 million in Q4 of the FYE 2018. The FYE 2019 was the first financial year where the amount of overpayments recovered saw a decreasing trend. There is a continuation of this decreasing trend in Q1 and Q2 of the FYE 2021, with the decrease from Q4 of the FYE 2020 and Q1 of the FYE 2021 (a decrease of £30 million) being the greatest decrease observed between consecutive quarters, within the time series. This decrease should be seen in context with the effects of the COVID-19 pandemic, which resulted in staff redeployment and changes to operational processes. At Q3 and Q4 of the FYE 2021, the total value of overpayments recovered increased from Q2 of the FYE 2021.
In the FYE 2021 the total GB value of HB overpayments recovered was £414 million, a decrease of £159 million (28%) when compared to overpayments recovered during the FYE 2020.
The total value of overpayments recovered decreased in Q1 of the FYE 2021, from £132 million at March 2020 (Q4 of the FYE 2020) to £103 million at June 2020. The value of overpayments recovered continued to decrease at Q2 of the FYE 2021, to £99 million. The total value of overpayments increased at Q3 to £104 million and then again at Q4 of the FYE 2021 to £108 million.
The total value of overpayments recovered in Q4 of the FYE 2021 was £108 million. This was a decrease of £25 million (19%) from Q4 of the FYE 2020.
Please see the additional information about the HBDR data.
During Q4 of the FYE 2021, London and the West Midlands reported 40% of the total amount of HB overpayments recovered in GB.
Overpayments recovered (£ thousands) by region, during Q4 of the FYE 2021
| Region | Overpayments recovered during Q4 FYE 2021 (£ thousands) |
|---|---|
| North East | 3,831 |
| North West | 10,051 |
| Yorkshire and The Humber | 6,180 |
| East Midlands | 6,359 |
| West Midlands | 14,824 |
| East | 8,528 |
| London | 28,033 |
| South East | 13,817 |
| South West | 6,473 |
| Wales | 3,693 |
| Scotland | 6,088 |
Source: HBDR data tables accompanying this release.
In Q4 of the FYE 2021, £98 million (91%) HB overpayments were recovered in England.
Overpayments recovered (£ thousands) by country, during Q4 FYE 2021
| Country | HB overpayments recovered during Q4 FYE 2021 (£ thousands) |
|---|---|
| England | 98,096 |
| Wales | 3,693 |
| Scotland | 6,088 |
Source: HBDR data tables accompanying this release.
In Q4 of the FYE 2021 of the £108 million of HB overpayments recovered in GB, £98 million (91%) were recovered by England, £6 million (6%) by Scotland and £4 million (3%) by Wales.
6. Housing Benefit overpayments written off during the quarter
The total value of HB overpayments written off in GB has increased in each consecutive quarter of the FYE 2021 after a decrease from Q4 of the FYE 2020.
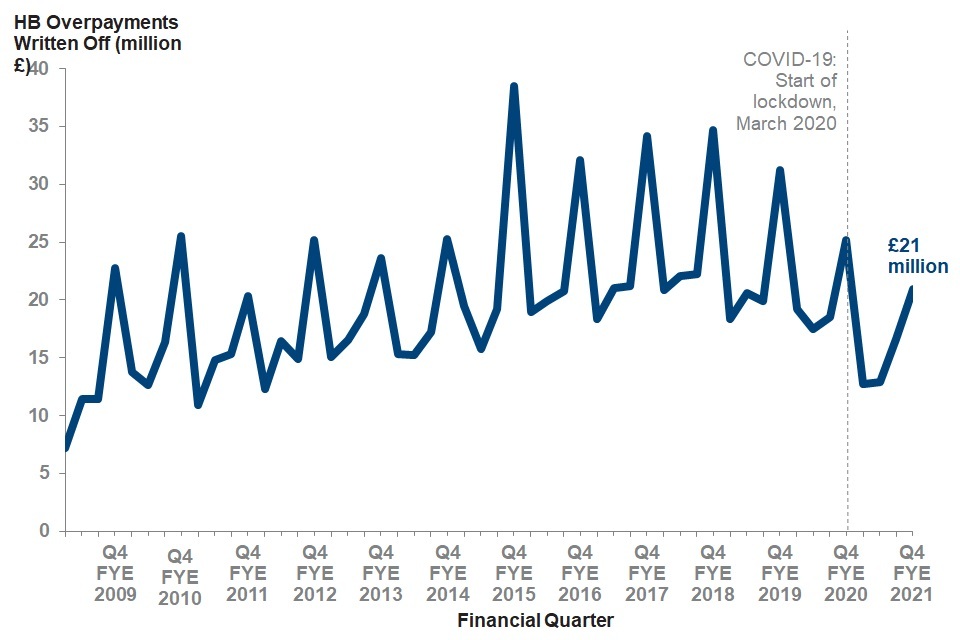
Overpayments written off (£ millions) in GB, from Q1 of the FYE 2009 to Q4 of the FYE 2021
Source: HBDR data tables accompanying this release.
The total GB value of HB overpayments written off during the FYE 2021 was £63 million which is a decrease of £17 million (22%) in comparison to those written off during the FYE 2020. This decrease should be seen in context with the effects of the COVID-19 pandemic, which resulted in staff redeployment and changes to operational processes.
There is an observable seasonal trend in the amount of overpayments written off throughout the year. It is generally highest in Q4 (March) of each financial year, followed by a sharp decrease during Q1 of the following financial year. In line with this there has been a decrease in the total amount of overpayments written off from £25 million at March 2020 (Q4 of the FYE 2020) to £13 million in June 2020 (Q1 of the FYE 2021). Each consecutive quarter during the FYE 2021 has seen an increase in the total amount of overpayments written off to £21 million in Q4 of the FYE 2021.
The total value of HB overpayments written off at Q4 of the FYE 2021 was £21 million. This was a decrease of £4 million (17%) from the total amount of HB overpayments written off in Q4 of the FYE 2020.
Please see the additional information about the HBDR data.
In Q4 of the FYE 2021, of the £21 million of written off HB overpayments in GB, £18 million (84%) were written off by England.
Overpayments written off (£ thousands) by country, during Q4 of the FYE 2021
| Country | HB overpayments written off during Q4 FYE 2021 (£ thousands) |
|---|---|
| England | 17,524 |
| Wales | 638 |
| Scotland | 2,736 |
Source: HBDR data tables accompanying this release.
In Q4 of the FYE 2021, of the £21 million of written off HB overpayments in GB, £18 million (84%) were identified by England, £3 million (13%) by Scotland and £1 million (3%) by Wales.
7. HBDR data: collection processes and accuracy
Data collection
The following table details the list of questions asked to LAs as part of the data collection process.
| Field | Overpayment Questions |
|---|---|
| 1 | Total value of HB overpayments outstanding at the start of the quarter |
| 2 | Total value of HB overpayments identified during the quarter |
| 3 | Total value of HB overpayments recovered during the quarter |
| 4 | Total value of HB overpayments written off during the quarter |
Average data return rates
| Collection Period | Average LA Return Rate (across all quarters) |
|---|---|
| FYE 2009 | 89.7% |
| FYE 2010 | 99.2% |
| FYE 2011 | 99.5% |
| FYE 2012 | 99.6% |
| FYE 2013 | 99.8% |
| FYE 2014 | 99.7% |
| FYE 2015 | 99.3% |
| FYE 2016 | 99.9% |
| FYE 2017 | 99.5% |
| FYE 2018 | 100% |
| FYE 2019 | 100% |
| FYE 2020 | 99.6% |
| FYE 2021 | 99.0% |
In previous years, some LAs could not complete some questions, making the completion rate lower than the values quoted. DWP have previously published additional estimates, using imputation (at GB level), accounting for LAs unable to provide data. These additional figures gave a sense of scale of this impact. Since September 2017, all published figures in this summary are based on actual data returned by LAs.
The average LA return rate also takes into account the impact of Hackney data being omitted from October 2020 (Q3 of the FYE 2021) as a result of the cyber-attack.
Additional information
HBDR is aggregate level data received from each LA, and is subject to a significant degree of variation both in and between different LAs. From 2014, we have observed a significant amount of variation in the overpayment data. This could be due to a wide range of factors such as:
-
differences and issues with LAs software suppliers
-
changes in LA return rates
-
additional side effects due to the phased implementation of SFIS
-
the implementation of the FERIS, RTI and factors unique to each LA (for example, increases or decreases in resources, bulk clearing of historical overpayments)
8. About these statistics
Known issues, changes and revisions
Our Methodology and Background Information Note provides further information on the DWP HBDR statistics, including some of the processes involved in developing and releasing these statistics.
Data tables containing data that underpin the charts and figures featured in this statistical summary are also published.
National Statistics status
The UK Statistics Authority has designated these statistics as National Statistics, at June 2012, in accordance with the Statistics and Registration Service Act 2007 and signifying compliance with the Code of Practice for Statistics.
National Statistics status means that our statistics meet the highest standards of:
-
trustworthiness
-
quality
-
public value
Once statistics have been designated as National Statistics it is our responsibility to maintain compliance with these standards.
Since the assessment date the following improvements have been made to this publication
-
statistics have been made more accessible through improvement in presentation of the first release and formatting of supporting data tables
-
value has been added by including HB caseload data to calculate regional average HB overpayments amounts per HB claimant, and by introducing interactive visualisations of regional and LA data
-
quality assurance processes have been strengthened by optimising automation in implementing analyst checks and by putting in place a thorough peer review process for each publication cycle
-
increased user and stakeholder engagement activities by setting up working groups with participants from across policy and operations
-
in 2019, HBDR users were consulted on the frequency of publishing for these statistics – read the outcome of this consultation
Other National and Official Statistics
Details of other National and Official Statistics produced by the DWP:
-
a schedule of statistical releases over the next 12 months and a list of the most recent releases
-
detailed background notes and methodology relating to this publication
Supplementary statistics
Data tables containing data that underpin the charts and figures featured in this statistical summary are available. These include information by LA on outstanding overpayments at the beginning of each quarter and identified, recovered and written off overpayments at the end of each quarter.
9. User engagement
Specific HBDR statistics feedback can be submitted via our HBDR user questionnaire
Completed questionnaires can be returned by email to Stats-consultation@dwp.gov.uk or by post to the following address:
Client statistics,
Data and Analytics,
Department for Work and Pensions,
Room BP5201,
Benton Park Road,
Longbenton,
Newcastle Upon Tyne,
NE98 1YX
Users can also join the “Welfare and Benefit Statistics” community. DWP announces items of interest to users via this forum, as well as replying to users’ questions.
Producer: James Gray james.gray9@dwp.gov.uk
Lead Statistician: Dominique Radcliffe dominique.radcliffe@dwp.gov.uk
Media enquiries, DWP Press Office: 020 3267 5144
ISBN: 978-1-78659-354-2