3. Measures of anxiety, depression, loneliness and life satisfaction
Updated 12 April 2022
Applies to England

© Crown copyright 2022
This publication is licensed under the terms of the Open Government Licence v3.0 except where otherwise stated. To view this licence, visit nationalarchives.gov.uk/doc/open-government-licence/version/3 or write to the Information Policy Team, The National Archives, Kew, London TW9 4DU, or email: psi@nationalarchives.gov.uk.
Where we have identified any third party copyright information you will need to obtain permission from the copyright holders concerned.
This publication is available at https://www.gov.uk/government/publications/covid-19-mental-health-and-wellbeing-surveillance-report/3-triangulation-comparison-across-surveys
Introduction
This is chapter 3 of the COVID-19: mental health and wellbeing surveillance report. It presents a comparison of some important indicators of mental health and wellbeing across different surveys and studies (triangulation) to assess consistency of findings. They appear to generally show that the various different data sources are broadly in agreement, although there are some differences.
The is the final version of this regularly updated chapter. The 2 main categories of information are as follows:
- Weekly data drawn from the UCL COVID-19 Social Study up to 28 November 2021 and ONS up to 12 February 2022.
- The analysis from a range of ongoing academic research projects, this has not been updated since the last search up to 6 September 2021.
Weekly data serves as an early warning system for potential large changes. It should not be used to draw conclusions about smaller changes up or down from week to week. This is because the data has not been analysed to control for any confounding factors or potential biases.
The analysis from academic research offers a more precise picture of change over time and differences between groups. This intelligence is the basis for a more nuanced interpretation and feeds into the Important findings chapter. Also, please note that intelligence relating to the relative effects on different population groups is covered in more detail in the Spotlight chapters.
To enable this chapter to be as up to date as possible some ‘pre-print’ academic research is presented. This research has not yet been peer reviewed. It is included here to enable timely reporting. Even with this approach there is still a time delay between data being gathered and findings reported.
Note: Any short-term deteriorations in self-reported mental health should not automatically be interpreted as an increase in mental illness or need for mental health services. The period of the pandemic is recognised as a difficult and stressful time for many.
Note The UCL COVID-19 Social Study concentrates on the psychological and social experiences of adults living in the UK during the COVID-19 pandemic. This study is not representative of the UK population but instead was designed to have good stratification across a wide range of socio-demographic factors with data weighted to the national population. Some of the baseline levels for the UCL COVID-19 Social Study graphs use data from other countries and therefore may not be wholly representative of UK pre-COVID-19 levels.
The basis for the intelligence included is presented in the Methodology document.
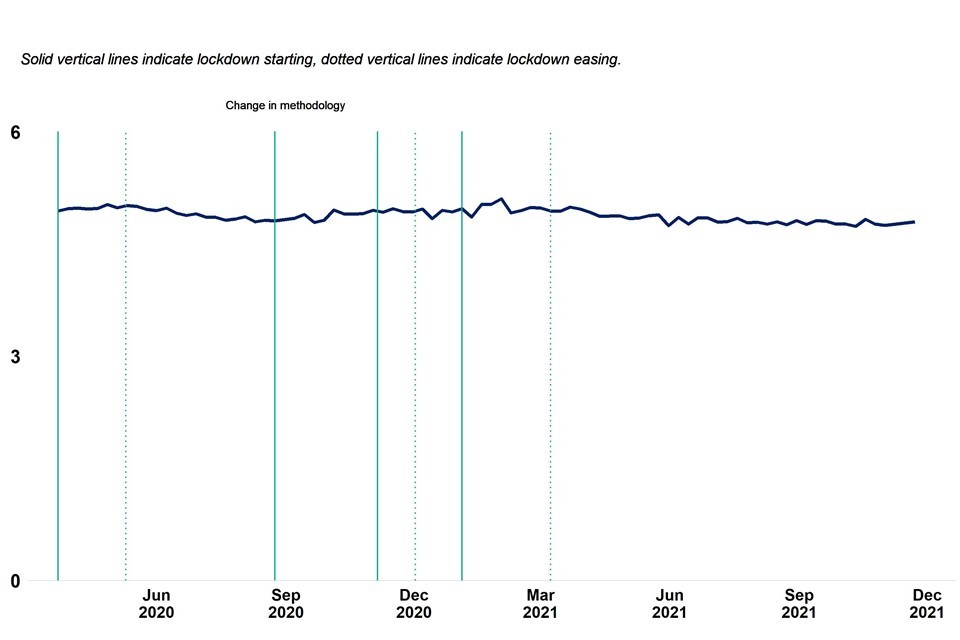
Anxiety
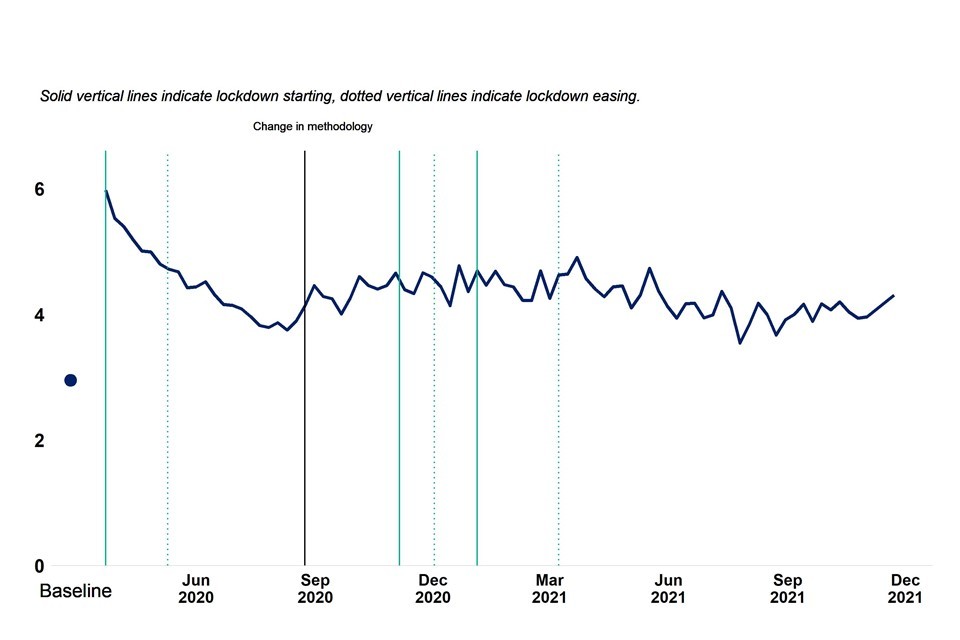
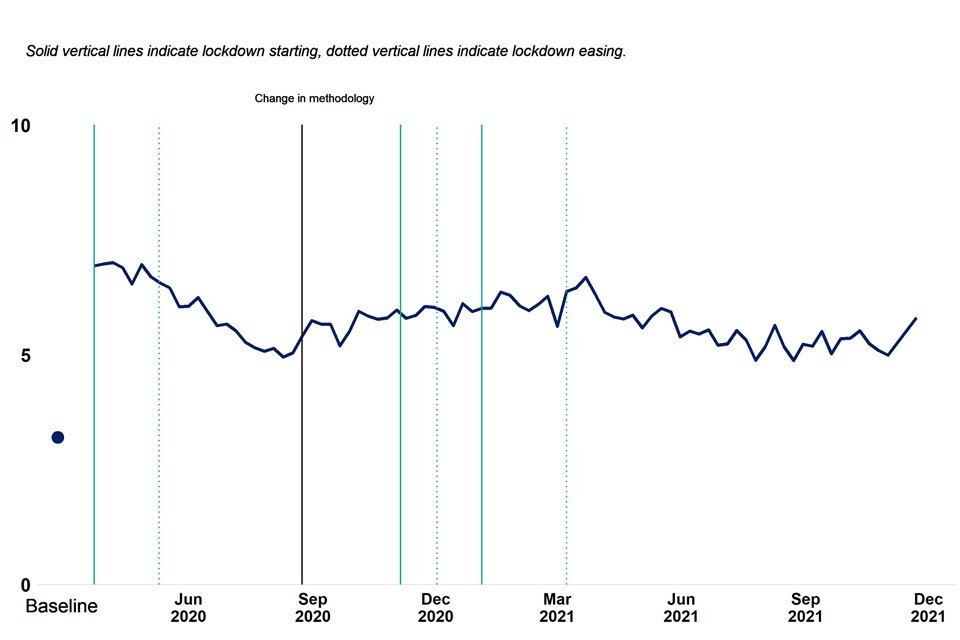
Two sources of weekly data on levels of anxiety symptoms in the general population, that use different samples and measurement, are shown in the graphs below. Both suggest an initial trend of reducing anxiety from a high point measured early in the first national lockdown. Trends then level off through late spring and summer 2020 but remain above the best available pre-pandemic baseline. There is evidence of a further increase in average levels of anxiety between August and mid-winter 2020, but not back to the levels reported early in the first lockdown.
The data suggests that in the first half of 2021 there has been signs of ongoing improvement in average levels of anxiety, although levels are still elevated compared to the available baseline measure. Since summer 2021 there are signs of another increase in average levels of anxiety through to the end of 2021.
Figure 1: anxiety, ONS “Coronavirus and the social impacts on Great Britain” survey
Circa 1,500 adults weighted to population (Overall, how anxious did you feel yesterday? 0 = “not at all” and 10 = “completely”). Data matched to closest calendar week. Baseline is average 2019 score.

Figure 2: anxiety, UCL COVID-19 social study
Panel of 20,000 to 70,000 adults weighted to the national population. Data provided by UCL and used with permission (GAD-7 score, 5 to 9 = mild, 10 to 14 = moderate, 15 to 21 = severe). Baseline from German study (Löwe et al. 2008).
COVID-19 related academic literature supports the picture of an initial increase in anxiety levels in April 2020 followed by a subsequent reduction and then levelling off through to summer 2021.
Two studies, one a longitudinal study with pre and post March 2020 survey responses from 2 generations of people (aged around 30 and 60) residing or born in southwest England, the other a cohort of mothers in Bradford, found that anxiety levels were higher, particularly among younger adults, in April 2020 than pre-pandemic.
Two studies started in March 2020, one from a representative sample (2,000 participants) and the other from a convenience sample (3,000 participants), found that mean scores for anxiety in April 2020 were higher than previous population estimates. Low income, loss of income, pre-existing health conditions in self and others, young age, living with children, high perceived risk of infection and being female were all associated with increased risk of anxiety in one or both studies.
Two studies using data from the COVID-19 Social Study assessed change in self-reported anxiety in the period following the first national lockdown. The first suggested that following a peak in April 2020 average measures of anxiety improved over the next 6 weeks. The second, covering the first 20 weeks of the pandemic, suggested this trend continued, although not back to the level of the best available benchmarks from before the pandemic.
More recent evidence suggests (PDF, 14.3MB) that there was a second deterioration in anxiety between autumn 2020 and early 2021, followed by a period of recovery.
Another population study looking at anxiety found that psychological responses to the pandemic stabilised for the majority of the population between April 2020 and May 2021. The authors classified over two thirds of their respondents as ‘resilient’ (stable and low distress throughout), about 15% as ‘moderate-stable’ (continuously mid-levels of distress) and roughly 6% as ‘Chronic’ (continuously high distress). They also categorised 2 changing groups, 4.7% of the population were ‘deteriorating’ (low distress early on but increasing over course of pandemic) and 6.5% were ‘adaptive’ (started with high distress but decreased over time).
There is further evidence that while average population levels changed, most individuals reported low and stable levels of anxiety since the onset of the pandemic. This suggests the changes in average level are mostly driven by higher risk groups. These higher risk groups have broadly remained the same since before the onset of the pandemic, but have been more likely to report initial larger deteriorations followed by periods of faster recovery than lower risk groups.
At the start of the first national lockdown women, younger adults, people with lower levels of educational attainment, and people living with children reported worse symptoms of anxiety. However, over the 20 weeks following the first national lockdown they also reported subsequent faster improvement, which narrowed but did not eliminate the gaps observed in April 2020. There was no evidence that these changes were related to ethnicity, household income or having a pre-existing mental health condition.
Longitudinal studies established since the onset of the pandemic cannot estimate the initial rise in anxiety because they do not have comparable data from before the pandemic. The UKHLS does have comparable data but measures psychological distress rather than anxiety. Analysis of this data suggests that young adults and women were more likely to report larger increases in psychological distress around the start of the first national lockdown.
One study found that adults who experienced probable COVID-19 symptoms in April 2020 were also more likely to report increased levels of psychological distress over the subsequent 3 months than those who had not experienced probable COVID-19 symptoms. Another study looking at the same period found people experiencing economic adversity were more likely to have general symptoms of anxiety about the pandemic.
Another UKHLS based study considering the period early 2020 to mid 2021 shows that long-term distress was highest among younger people, women, people living without a partner, those who had no work or lost income, and those with previous health conditions or COVID-19 symptoms.
Depression
The figure from the UCL COVID-19 Social Study, shown below, looks at symptoms of depression. The data suggests that average levels were highest early in the pandemic, followed by a period of recovery through to autumn 2020 and then a second increase peaking in spring 2021. Between spring and autumn 2021 there was evidence of a second recovery. Most recent data points suggest average levels are stable.
Figure 3: depression, UCL COVID-19 social study
Panel of 20,000 to 70,000 adults weighted to the national population. Data provided by UCL and used with permission (PHQ-9 score, 5 to 9 = mild, 10 to14 = moderate, 15 to 19 = moderate to severe, 20 to 27 = severe). Baseline from US study (Tomitaka et al. 2018).
COVID-19 related academic literature provides a mixed picture of changes in depression during the pandemic, and suggests some key determinants associated with worsening of depressive symptoms.
Two studies, one a longitudinal study with pre and post March 2020 survey responses from 2 generations of people (aged around 30 and 60) residing or born in southwest England, the other a nationally representative sample of over 3,000 adults, found no evidence that levels of depression early in the pandemic were different from pre-pandemic.
However, 2 studies, set up March 2020, one from a representative sample (2,000 participants), the other from a convenience sample (3,000 participants) found mean scores for depression in April 2020 were worse than the best available pre-pandemic benchmarks. These findings were supported by research from a cohort of mothers in Bradford that found a significant increase in depressive symptoms during the first national lockdown, compared to a pre-pandemic baseline. Also a longitudinal study found evidence of an increase in the proportion of people with depressive symptoms, and that on average symptoms were worse in June 2020 than before the pandemic.
Two studies using data from the COVID-19 Social Study assessed change in self-reported depressive symptoms in the period following the first national lockdown. The first suggested that levels were relatively stable during the first 6 weeks. The second, covering the first 20 weeks of the pandemic, suggested this was followed by an improvement and subsequent levelling off around August 2020.
More recent evidence suggests that there was a second increase in symptoms of depression between autumn 2020 and early 2021, followed by a period of recovery (PDF, 21MB).
There is evidence that while average levels changed, most individuals reported low and stable depressive symptoms since the onset of the pandemic. This suggests the changes in average level are mainly driven by the higher risk groups.
At the start of the first national lockdown women, younger adults, people with lower levels of educational attainment, people from lower-income households, people with pre-existing mental health conditions and people living alone reported higher levels of depressive symptoms than the population overall. However, the same study also reported faster improvements in depressive symptoms over the 20 weeks following lockdown, which narrowed but did not eliminate some of the gaps observed in April 2020. People living alone experienced the same trends of depressive symptoms as people living with other adults (but no children). There was no evidence that changes were associated with ethnicity, household income or pre-existing mental health conditions.
Note: The groups that reported the highest levels of depressive symptoms during the first national lockdown were also the groups more likely to report high levels of depressive symptoms pre-pandemic (based on the 2014 Adult Psychiatric Morbidity Survey and the 2017 Mental Health of Children and Young People in England Survey (for young adults)).
Analysis of data from the English Longitudinal Study of Aging of adults aged 52 and over found the prevalence of clinically significant depressive symptoms increased from 12.5% pre-pandemic to 22.6% in June and July 2020, with a further rise to 28.5% in November and December. This was accompanied by increased loneliness and deterioration in quality of life.
One study found no evidence of a difference in depression between urban and rural areas in the early stages of the pandemic. Another study looking at depressive symptoms in adults aged over 50 reported that living in an urban area was a risk factor for poor mental health in women but not men.
Caregivers have also been shown to have a higher risk of having depressive symptoms before, and during, the pandemic. There is also evidence that people who provide informal care showed higher levels of depressive symptoms. Symptoms may have been highest in those providing care for children or people with learning disabilities, and also in those who lost formal help during the first national lockdown. One study found there was an increased risk of depression during the pandemic in people with certain common cancers, which was associated with loneliness.
People who reported higher quality and/or more social contacts were shown to have less depressive symptoms. A study that analysed internet use in people aged 55 to 75 in June and July 2020 while social distancing found that frequent internet users had lower depression symptoms and higher quality of life scores. Impacts varied with purpose of internet use. Those who reported using the internet for communication purposes had higher quality of life. However, use for health-related or government services information searching was associated with more symptoms of depression.
Life satisfaction
Two sources of data on levels of life satisfaction, using different samples with the same measure, are presented in the graphs below. Levels recorded in the ONS sample were generally higher than those in the UCL sample between April 2020 and Summer 2021, while levels in the second half of 2021 were similar. However, both data sets suggest that levels of life satisfaction were low in April 2020 but were then increasing from soon after that through to autumn 2020 – although remaining below the pre-pandemic baseline. Figures suggest some decrease in average levels of life satisfaction from autumn 2020 to spring 2021, with a subsequent increase seen through summer 2021. Levels have been stable since summer 2021 although ONS data is beginning to suggest some reduction life satisfaction since the turn of the year (2021 into 2022).
Figure 4: life satisfaction, ONS “Coronavirus and the social impacts on Great Britain” survey
Circa 1,500 adults weighted to population (Overall, how satisfied are you with your life nowadays? 0 = “not at all” and 10 = “completely”). Data matched to closest calendar week. Note scale does not start at 0. Baseline is average 2019 score.
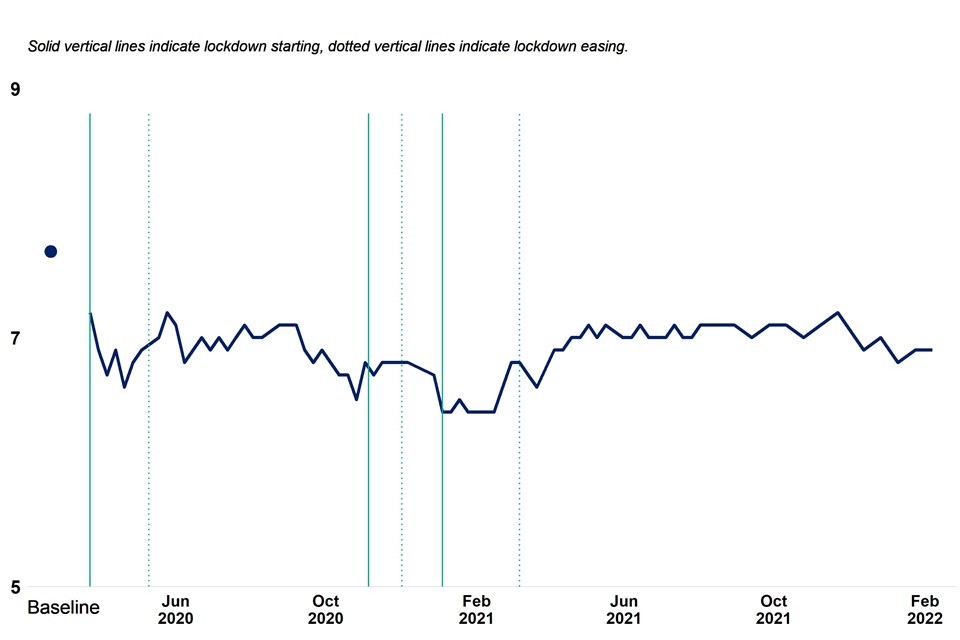
Figure 5: life satisfaction, UCL COVID-19 social study
Panel of 20,000 to 70,000 adults weighted to the national population (Overall, how satisfied are you with your life nowadays? 0 = “not at all” and 10 = “completely”). Data provided by UCL and used with permission. Baseline is average 2019 score from ONS survey. Note scale does not start at 0.

COVID-19 related literature supports a picture of an initial fall in life satisfaction early in the first national lockdown.
A longitudinal study with pre and post-March 2020 survey responses from 2 generations of people (aged around 30 and 60) residing or born in southwest England found evidence that more people were experiencing low wellbeing in April 2020 compared to before the pandemic. This study used a wellbeing measure that captured not only life satisfaction but elements of feeling good and functioning well related to mental wellbeing.
Data from a series of age-specific cohorts (19, 30, 50 and 62), surveyed in January and May 2020 suggest that there were increased rates of low life satisfaction in May across all age groups but that it was more common among younger adults than older adults.
Older people who were shielding or self-isolating (PDFD, 297KB) have also been shown to have lower life satisfaction during the pandemic.
Evidence from later in the pandemic suggests that there was a second major deterioration in life satisfaction between autumn 2020 and early 2021, followed by a period of recovery (PDF, 21MB). The study goes on to say that younger adults and women continue to have lower levels of life satisfaction, as do people living alone, those with a mental health condition, those with lower household incomes, people living in cities/towns, people with a long-term physical health condition, and people from ethnic minority backgrounds.
Loneliness
Two sources of data on reported loneliness are presented in the graphs below, the ONS data compares to a baseline. They are not wholly consistent. Data from the ONS sample suggests increasing loneliness during the first year of the pandemic through to early 2021, followed by improvement and then stable levels over the most recent months. Whereas, the UCL sample data suggests that there has been little change during the period of the pandemic, with perhaps a small but continuous improvement seen between February and November 2021.
Figure 6: loneliness, percentage reporting often/sometimes lonely – ONS “Coronavirus and the social impacts on Great Britain” survey
Circa 1,500 adults weighted to population. Data matched to closest calendar week. Baseline is average 2019 score from Community Life Survey.
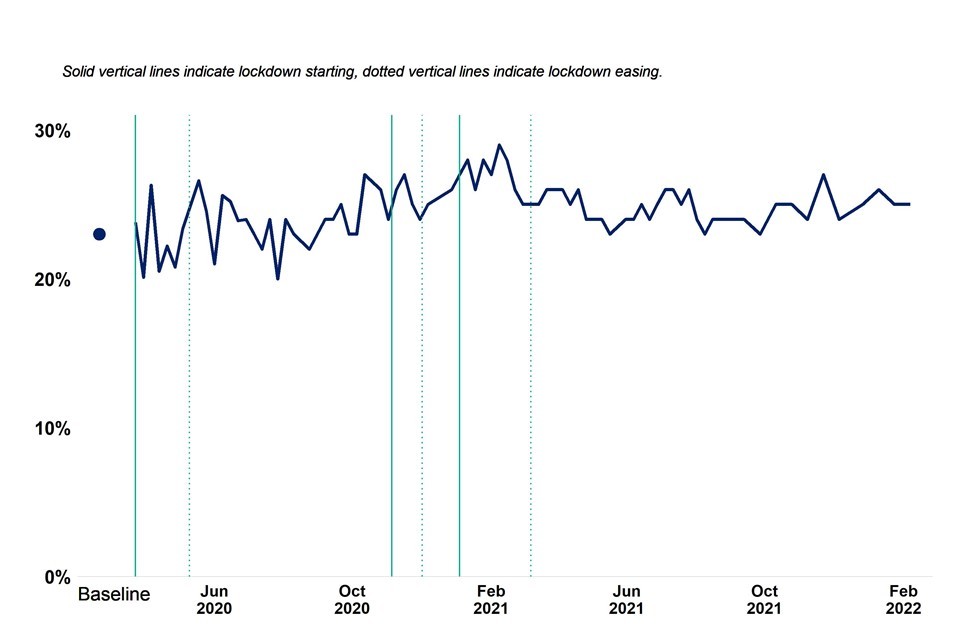
Figure 7: loneliness, UCL COVID-19 social study
Panel of 20,000 to 70,000 adults weighted to the national population. Data provided by UCL and used with permission (UCLA-3 loneliness scale).
COVID-19 related literature findings suggest differing patterns of loneliness for different groups.
One study (using data from the COVID-19 Social Study covering the first 6 weeks of the first national lockdown), found average self-reported levels of loneliness were relatively stable but the most lonely reported increases in loneliness, and the least lonely reported decreases. Another study (of over 3,000 adults representative of the UK population) found that over the same period levels of loneliness did not change.
Two studies found young adults, women, people with lower levels of educational attainment, people with low income, people who are economically inactive, people with an existing mental health condition, people living alone, and urban residents were more likely to report being lonely during the pandemic. The groups at increased risk were almost identical to those at increased risk pre-pandemic. However, they were more likely to experience increasing loneliness during the pandemic (references 17 to 18). Another study found that women reported more close friends than men before the pandemic, and increased loneliness after its onset.
A study looking at loneliness in young adults (18 to 25) using UKHLS data from between June and November 2020 reported initial decreasing then rapidly increasing levels of loneliness. There was a sharp rise in self-reported loneliness during the winter months under the national lockdown. Young adults with long-standing physical or mental health conditions, lower household incomes or who were unemployed or not in school reported higher levels of loneliness than their peers.
Two studies showed that older people with multiple health conditions, or who are shielding or self-isolating, were particularly affected by loneliness (references 16, 21). Another study using data from the beginning of the pandemic found that adults with a disability were more likely than adults without to report loneliness in April to May 2020.
The English Longitudinal Study of Aging (ELSA) data on adults aged 52 and over suggests some changing patterns (PDF, 341KB) over the 2 waves of the pandemic in 2020. Respondents with poor physical health were more likely to report feeling socially isolated during the first wave (June to July 2020), but this fell during the second wave (November to December 2020). Conversely, respondents in the poorest wealth quintile were more likely to feel socially isolated and lonely during the second wave than the first or before the pandemic. Men experienced a large decrease in social contact during the second wave.
Evidence from a longitudinal study from April and May 2020 suggests that where there was an increase in mental distress between those 2 months, much of it was associated with increased feelings of loneliness. Another study found that high levels of loneliness were associated with increased risk of depression among carers. One study found that certain social factors, such as living with others, having close friends, and having strong perceived social support were protective.
One study considering data from the first 2 months of the first national lockdown found that for adults, living in rural areas was protective against loneliness.
Weekly data and further available metrics
For the most up to date version of data presented in this chapter go to the Wider Impacts of COVID-19 on Health (WICH) tool.
References
-
Etheridge B, Spantig L. The Gender Gap in Mental Well-Being During the Covid-19 Outbreak: Evidence from the UK. :26
-
Zaninotto DP. The experience of older people with multimorbidity during the COVID-19 pandemic. :10 (PDFD, 326KB)