The Children’s People and Nature Survey for England: 2022 update
Updated 17 November 2023
Applies to England

© Crown copyright 2023
This publication is licensed under the terms of the Open Government Licence v3.0 except where otherwise stated. To view this licence, visit nationalarchives.gov.uk/doc/open-government-licence/version/3 or write to the Information Policy Team, The National Archives, Kew, London TW9 4DU, or email: psi@nationalarchives.gov.uk.
Where we have identified any third party copyright information you will need to obtain permission from the copyright holders concerned.
This publication is available at https://www.gov.uk/government/statistics/the-childrens-people-and-nature-survey-for-england-2022-update/the-childrens-people-and-nature-survey-for-england-2022-update
1. Summary
The ‘Children’s People and Nature Survey’ provides information on how children and young people experience and think about the natural environment. It is run twice each year, once in term time and once in holiday time. Here we present some key findings from Waves 3 and 4. We will report on two Waves each year alongside previous Waves, to build a picture of any trends over time. More detailed analysis of the data is due to be completed following this release.
Responses were collected from 2,000 children and young people aged 8-to-15 between the 12th and 26th August 2022 (during the school holidays) and 2,003 between the 21st September and 10th October 2022 (during term-time). Some headline findings from Waves 3 and 4 are summarised here.
-
When children are at school, most are spending some time outside. 85% of children and young people said they had spent time outside at school most or every day in the past week (2% said they never did this). When asked about how often they had done activities or lessons outside that were not PE, 23% said most or every day. This is a reduction from 2021 when 30% children said they had.
-
Children and young people are concerned about the environment and are taking actions to try and look after it. 83% of children and young people in this survey agreed both that looking after the environment was important to them and that they wanted to do more to look after the environment. Over half of children reported recycling (75%), turning off taps (65%) and lights (63%), and picking up litter (58%) to look after the environment.
-
Children tended to show high connection to and enjoyment of nature, although responses varied. From seven pictures which depicted different levels of closeness to nature, 47% of children and young people chose ones showing high connection to nature to describe themselves. 87% of children and young people agreed that being in nature made them very happy.
-
Although children and young people may not have increased overall time spent outdoors between 2021 and 2022, they are visiting a greater variety or range of places. Gardens (72%), parks/playing fields/playgrounds (64%) and grassy areas in the streets nearby (46%) were most often visited by children and young people in the last week.
-
New insights show how children and young people rate the quality of their local natural environments. Using questions co-developed with children and young people, this years survey shows children’s ratings of their local natural spaces based on: 1) the natural environment, 2) spaces to do the things they want, 3) the human/built environment, 4) how they feel in these spaces, and 5) how accessible they are.
2. Other Pages in this Release
The People and Nature Survey for England (PANS), led by Natural England, is one of the main sources of data and statistics on how people experience and think about the environment. It began collecting data via an online panel (adults aged 16 years and older) in April 2020, and runs continuously, in line with Government Statistical Service guidance on data collection during the COVID-19 pandemic.
The adult’s PANS includes questions about children in the household, asking adults about childrens’ time in and experiences of nature. To build on this and ensure the views of children and young people (CYP) themselves are represented, the ‘Children’s People and Nature Survey’ (C-PANS) was first completed as a pilot between 6th-18th August 2020 with children aged 8-to-15. This first pilot offered valuable insights which contributed to our understanding of experiences of nature during the COVID-19 pandemic.
Following this successful pilot, the survey has been adapted for use on an on-going basis, both in school holidays and term-time, to allow attitudes and behaviours to be looked at over time. The Wave 1 release provides a summary of the policy and research context for this survey.
The Official Statistics in this publication include all previously released C-PANS Waves, now with the addition of C-PANS responses for 2022, including the school holidays/Wave 3 (2,000 CYP, between the 12th and 26st August 2022 and the term-time/Wave 4 (2,003 CYP, between the 21st September and 10th October 2022).
Detailed analysis of the data for specific research questions was not within the scope of this data release. However, Natural England will be using the data going forward to complete more detailed data analysis, such as looking at differences between groups in access to and engagement with the outdoors, comparing engagement with nature in term-time and school holidays, and looking at the role of nature in children and young people’s well-being.
Alongside this publication, readers can access:
- The master list of questions and change log from all Waves, plus this years’ questionnaire (‘CS_QXX’ below the tables refer to question labels found here).
- The raw data (including instructions for weighting data when using).
- Data tables containing summary statistics, including a comparison of responses to each question based on: age, gender, ethnicity, level of disability, region, and income.
- The technical report for both PANS and C-PANS.
- The PANS mailing list – sign-up via the PANS Hub.
3. Time Spent Outdoors
In Waves 3 and 4 of the survey, children and young people (CYP) reported on which kind of green and natural places they had spent time in during the last week (Figure 1). Gardens were most commonly noted (72%) followed by the park/playing field/playground (64%).
Although these two places were also the most common green and natural places that CYP had spent time in 2021, just 59% of CYP said they had spent time in their garden and 54% in the park/playing field/playground in 2021. This is a pattern seen for a number of the green and natural spaces listed, such as grassy areas in the streets nearby which just 26% children in 2021 said they had spent time in compared to 46% in 2022. This reflects an increase in the number of different green and natural places children said they had spent time in, from an average of 2 types of places in 2021, to 3 in 2022.
Figure 1: Green and natural places CYP said they had visited in the last week (weighted percentage).
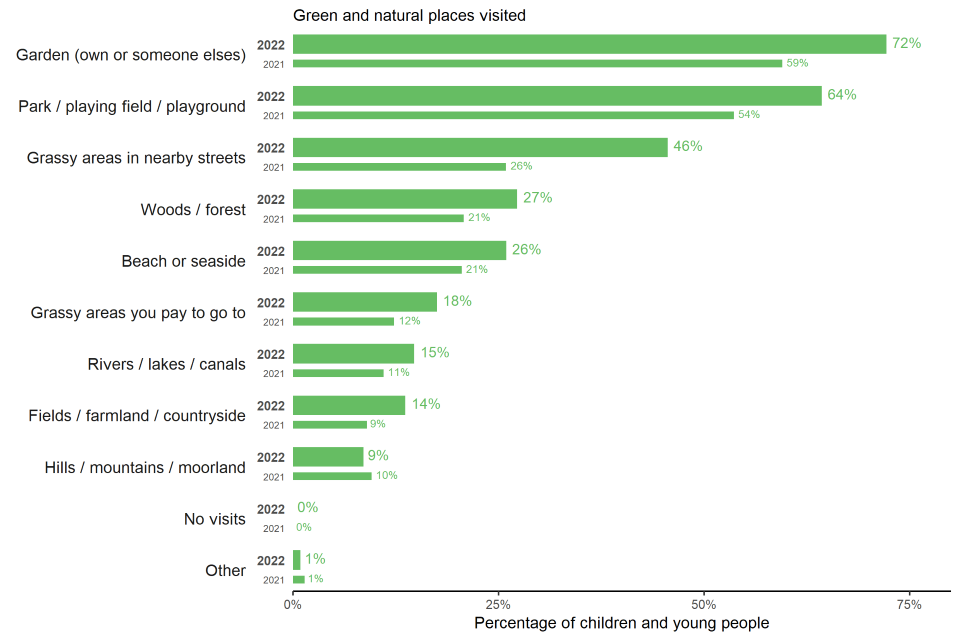
Percentage of children and young people who visited green and natural places
Figure notes:
Base: 2021: School holiday and term-time data combined [sample = 4099]; 2022: School holiday and term-time data combined [sample = 4003]
Source: [CS_Q3]
CYP also reported on how frequently they had spent time outside in their garden, time outside in places other than their garden (and outside of school), and in Wave 4, their time outside while at school (Figure 2). Across Waves 3 and 4, 60% of CYP said they had spent time outside in their garden most or every day in the past week (30% once or twice, and 6% never, 3% said they did not have one), and 50% said they had spent time outside in places other than their own garden most or every day (43% once or twice, and 6% never).
When at school, most CYP are spending some time outside, whether at break, lunch or as part of lessons. During term-time, 85% of CYP said they had spent time outside at school most or every day in the past week (12% once or twice, and 2% never). When asked about how often they had done activities or lessons outside that were not PE, 23% said most or every day (34% once or twice, and 39% never). This indicates a reduction from 2021 when 30% children said they had done activities or lessons outside that are not PE.
Taken together with findings around places visited, this suggests that although CYP may not have increased time spent outdoors between 2021 and 2022, they are reporting a greater variety or range of green and natural places they are visiting.
Figure 2: How often CYP said they spent time outside in the past week: 1) in the garden (for those that had one), 2) in places other than their own garden, 3) at school, and 4) during school activities/lessons that were not PE (weighted percentage).
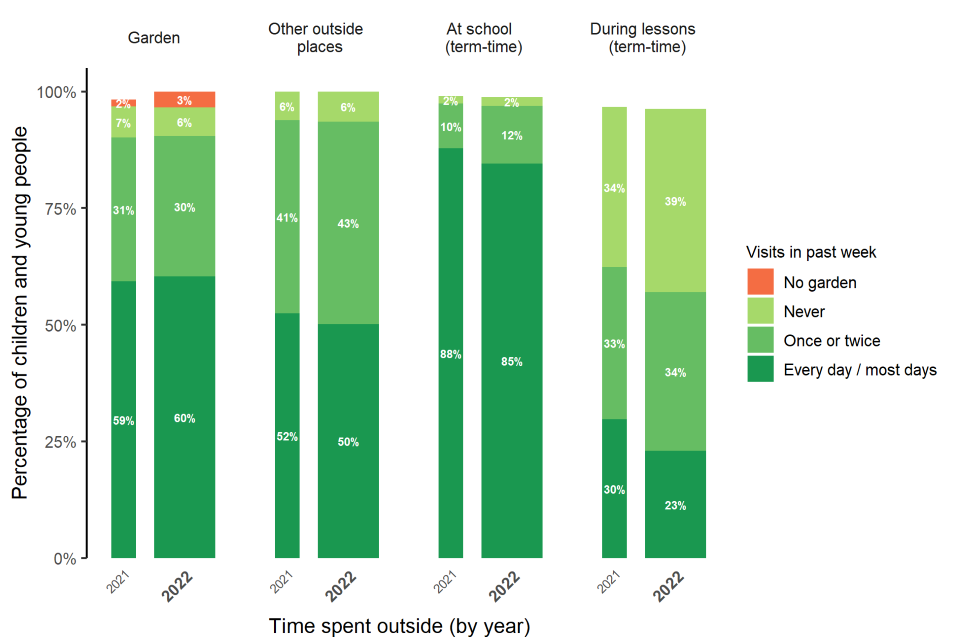
Percentage of children and young people who spent time outside (by year)
Figure notes:
Base: 2021: School holiday and term-time data combined [sample = 4099] for questions [CS_Q6A] and [CS_Q6B]; Term-time data used only [sample = 2051] for questions [CS_Q5A] and [CS_Q5B]. 2022: School holiday and term-time data combined [sample = 4003] for questions [CS_Q6A] and [CS_Q6B]; Term-time data used only [sample = 2003] for questions [CS_Q5A] and [CS_Q5B]
Source: [CS_Q6A], [CS_Q6B], [CS_Q5A] and [CS_Q5B]
Other related questions you may be interested in:
- Access to garden/outdoor space.
- Perceived access to wider green and natural spaces.
- Time spent noticing nature.
- See the questionnaire and summary tables for more information.
4. Environmental Concern and Action
Across Waves 3 and 4, 83% of children and young people (CYP) in this survey agreed that looking after the environment was important to them and 83% said they wanted to do more to look after the environment.
CYP said that they undertook a range of actions to look after the environment, summarised in Figure 3. Over half of children reported recycling (75%), turning off taps (65%) and lights (63%), and picking up litter (58%) to look after the environment.
Figure 3: Proportion of CYP reporting different behaviours and social actions to look after the environment (weighted percentage).
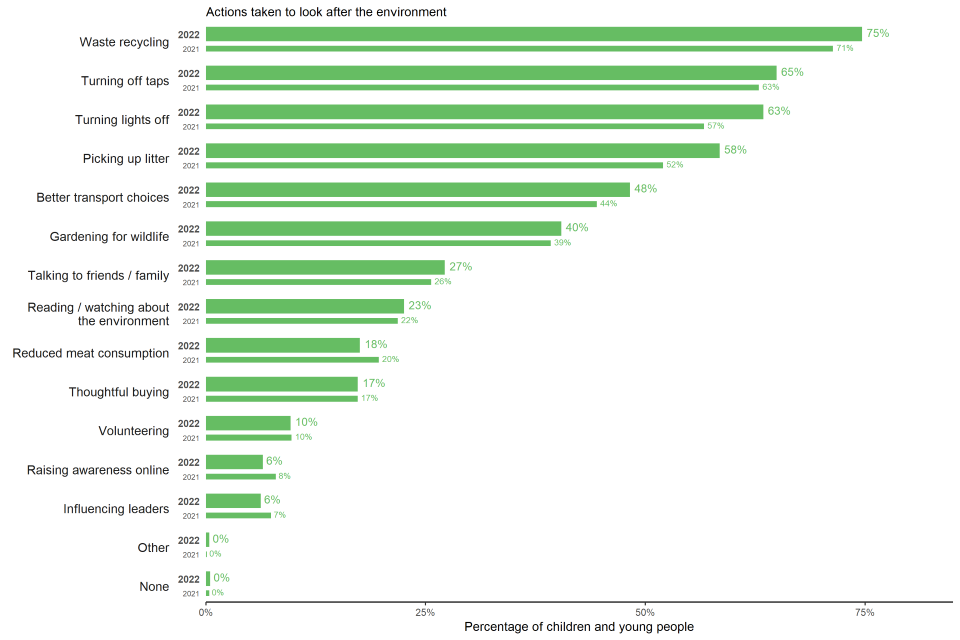
Percentage of children and young people who took actions to look after the environment
Figure notes:
Base: 2021: School holiday and term-time data combined [sample = 4099]; 2022: School holiday and term-time data combined [sample = 4003]
Source: [CS_Q10] (also in text, [CS_Q9] and [CS_Q12c])
Other related questions you may be interested in:
- Whether CYP think adults are doing enough to look after the environment.
- Whether CYP know what they can do to look after the environment.
- See the questionnaire and summary tables for more information.
5. Nature Connection and Enjoyment
In Waves 3 and 4, children and young people (CYP) were shown a range of images taken from the illustrated ‘Inclusion of Nature in Self Scale’. Seven diagrams were shown to CYP (Figure 4), each containing two circles, one with the outline of a person and saying ‘me’ and the other with a nature-filled scene. In each diagram, the closeness of the two circles increased, until they fully overlapped. CYP were asked to choose the diagram which best showed how connected they felt to nature.
Similar to 2021, using this method 47% of CYP felt highly connected, 26% felt moderately connected, and 27% felt low levels of connection to nature (Figure 4).
Figure 4: Percentage of CYP choosing images from the ‘Inclusion of Nature in Self’ scale indicating how connected they feel to nature, split as low, medium, and high (weighted percentage).
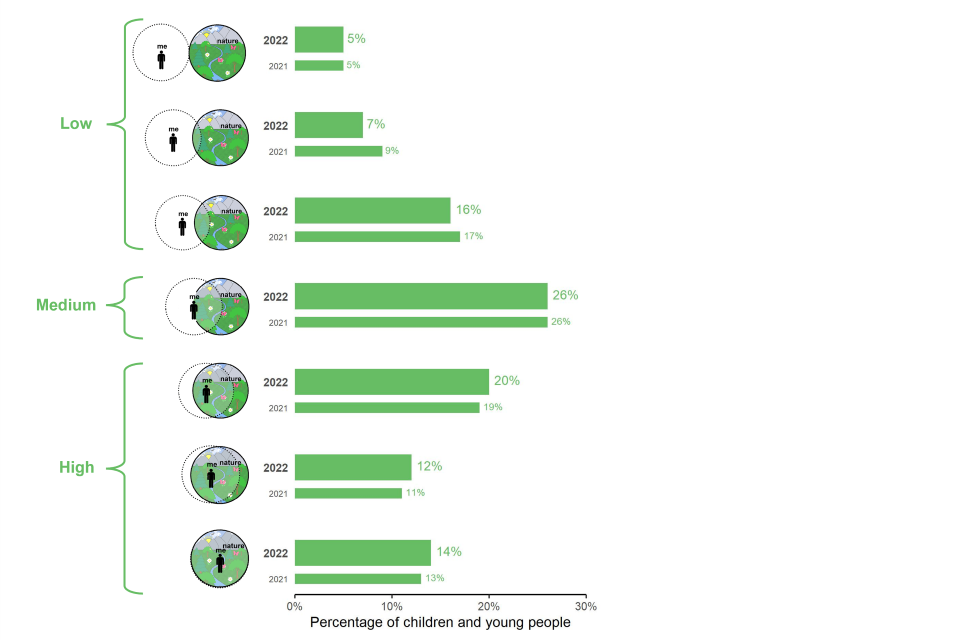
Percentage of children and young people involved with nature (by high, medium and low activity)
Figure notes:
Base: 2021: School holiday and term-time data combined [sample = 4099]; 2022: School holiday and term-time data combined [sample = 4003]
Source: [CS_Q11]
A total of 87% of CYP across Waves 3 and 4 agreed that being in nature made them very happy (2% disagreed and 10% neither agreed nor disagreed; Figure 5). This is similar to findings from 2021.
Figure 5: Percentage of CYP indicating that being in nature makes them very happy (weighted percentage).
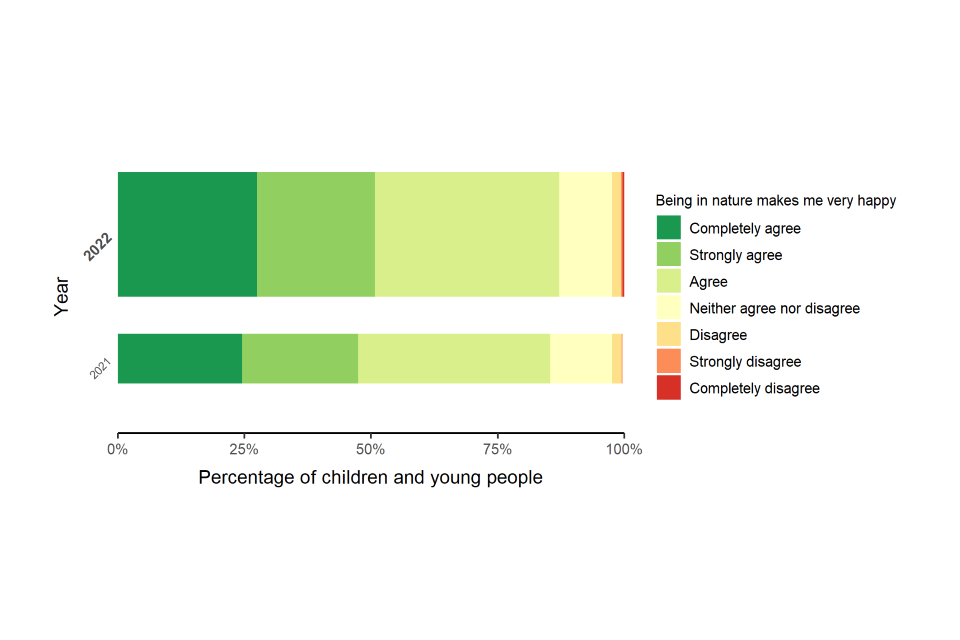
Percentage of young people and children by degrees of happiness with being in nature
Figure notes:
Base: 2021: School holiday and term-time data combined [sample = 4099]; 2022: School holiday and term-time data combined [sample = 4003]
Source: [CS_Q12a]
Other related questions you may be interested in:
- Items from the ‘Nature Connection Index’ which are another way of finding out how connected children feel to nature.
- Well-being (happiness, anxiety and loneliness were measured using ONS recommended measures).
- CYP favourite places to spend time outdoors.
- Barriers to spending more time outside.
- What CYP most like about spending time outdoors.
- See the questionnaire and summary tables for more information.
6. New questions: Quality of Local Natural Spaces
For the first time this year we asked children and young people (CYP) to rate the quality of the natural outdoor spaces near them. This was done by rating five different aspects of quality co-developed with CYP in a separate research project (Figure 6):
Figure 6: Description of the five aspects of quality of nature co-developed with CYP, including statements used to measure agreement with each aspect (shown in quotation marks)
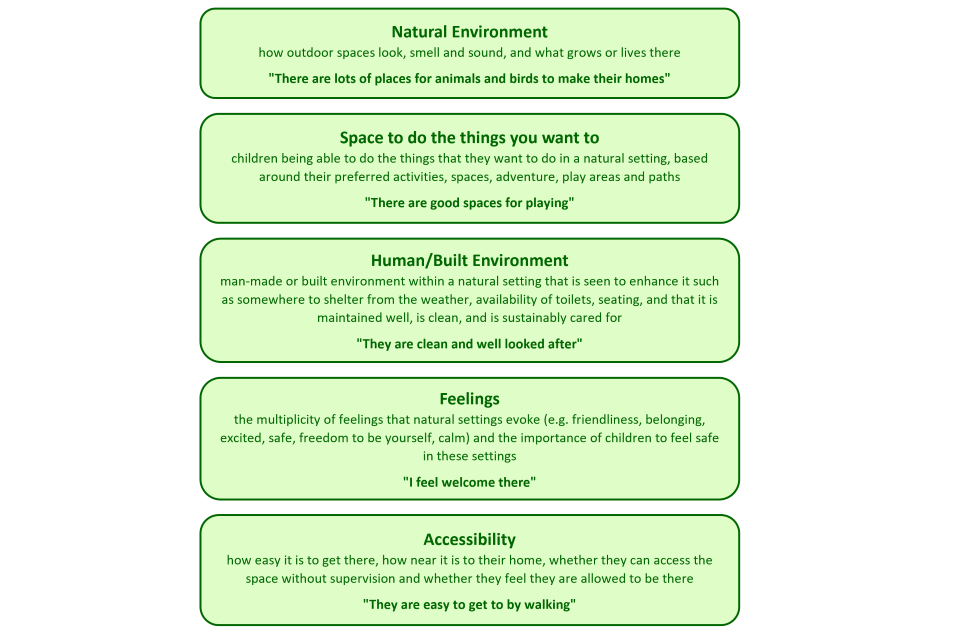
Attitudes to: Natural Environment; Space to do the things you want to; Human/Built Environment; Feelings; and Accessibility
More than 70% of CYP reflected positively (agreed with the positive statements) on the quality of the natural environment, having space to do the things they want, their feelings and the accessibility of their local natural outdoor spaces (Figure 7). A lower 55% reflected positively (agreed with the positive statement) on the quality of the human/built environment.
Figure 7: CYP’s rating of the five qualities of the natural outdoor spaces near them (weighted percentage).
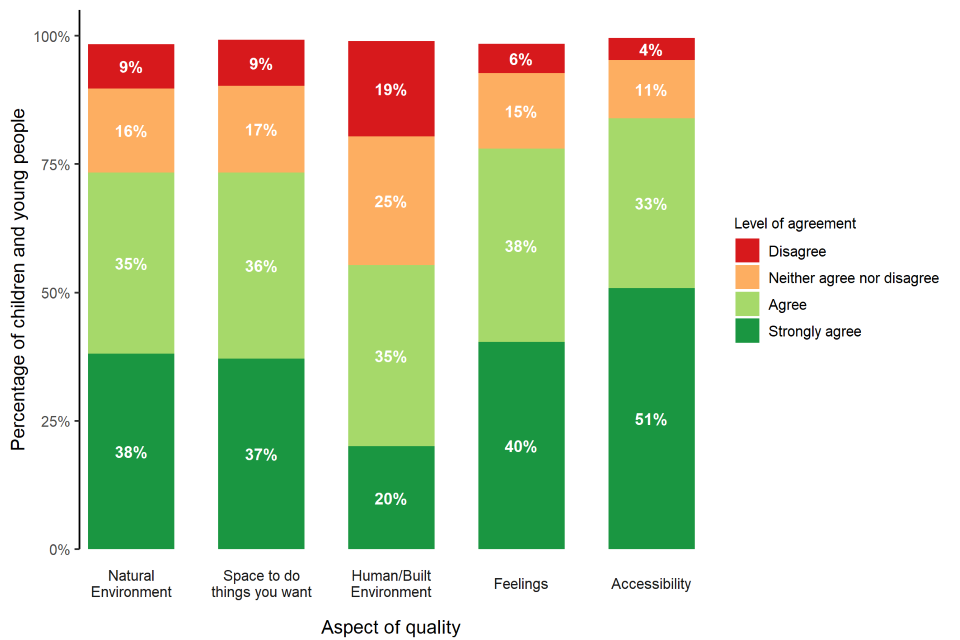
Levels of agreement of children and young people (by percentage) with aspects of quality
Figure notes:
Base: 2022: School holiday and term-time data combined [sample = 4003]
Source: [CS_Q13]
Statements:
- Natural environment: “There are lots of places for animals and birds to make their homes”
- Space to do things you want: “There are good spaces for playing”
- Human/Built Environment: “They are clean and well looked after”
- Feelings: “I feel welcome there”
- Accessibility: “They are easy to get to by walking”
Other related questions you may be interested in:
- CYP and the countryside code
- See the questionnaire and summary tables for more information.
7. Official Statistics
Initial releases from PANS and C-PANS (such as the interim monthly indicators and C-PANS pilot) were released as Experimental Statistics. This status highlighted to users at the time that these Official Statistics are in the National Statistics testing phase and that Natural England is still working on further developing the methodologies used in their production whilst ensuring adherence to the Code of Practice for Statistics (the Code).
Releases from PANS and C-PANS that use the specific weighting method (as opposed to the interim weighting method) are designated as Official Statistics. For justifications behind this designation, please see our brief statement and technical report. Natural England have developed the methodologies used in the production of these statistics whilst ensuring adherence to the Code of Practice for Statistics.
8. Methodological Note
This survey was conducted using an online panel. Consent for participation was obtained from both parent and child. Information about the survey’s methodology can be found on the methodology and technical details page, including links to the Technical Report, full details of weighting procedures, and further information about the strengths and limitations of an online panel survey.
All questions summarised in this report are detailed below:
[CS_Q3] Have you spent time in any of these places in the last week? You can include visits of any length of time (including short trips to the park, dog walking etc.). Please choose one or more options
Response options:
- Park / playing field / playground
- Grassy areas in the streets near me (e.g., by the roadside, a green or pathway)
- Garden (mine or someone else’s)
- Grassy areas you pay to go to (e.g., gardens of a big house, the zoo, or city farm)
- Beach or seaside
- Woods / forest
- Fields / farmland / countryside
- Rivers / lakes / canals
- Hills/ mountains/ moorland
- No visits in the last week
- Don’t know [EXCLUSIVE]
- Prefer not to say [EXCLUSIVE]
- Somewhere else outside…(please write in below)
[CS_Q5A] These questions are about what you have done at school in the last week. Thinking about the last week at school, how often have you spent time outside?
[CS_Q5B] These questions are about what you have done at school in the last week. Thinking about the last week at school, how often have you had activities or lessons outside that were not PE? (Do not count: PE lessons, breaks and lunch times, before and after school)
[CS_Q6A] Now thinking about when you were not at school in the last week, how often have you spent any time in your own garden if you have one)? This includes any garden that you share with your neighbours
[CS_Q6B] Now thinking about when you were not at school in the last week, how often have you spent time outside in places that are not your garden?
Response options:
- Every day
- Most days
- Once or twice
- Never
- I don’t have a garden (only show for CS_Q6A)
- Don’t know
- Prefer not to say
[CS_Q9] How important is looking after the environment to you?
Response options:
- 1 Not at all important
- 2
- 3
- 4
- 5 Very important
- Don’t know
- Prefer not to say
[CS_Q10] Which of the following things do you do to look after the environment? There are lots of options but they may not all apply to you or all make sense. Only pick the ones you understand and do yourself to look after the environment. Please choose one or more options
Response options:
- Recycle my waste
- Turn the tap off while I brush my teeth
- Turn lights off
- Pick up litter
- Walk, cycle or take public transport as much as I can
- Do things in the garden to help the wildlife (e.g. feed birds, grow plants that insects like, make homes for wildlife)
- Talk to friends and family about looking after the environment
- Read about (online or in books) or watch programmes about the environment
- Eat less meat (including vegetarian or vegan)
- Think about the environment when I buy things
- Volunteer my time (e.g. litter pick, planting, raising awareness)
- Raise awareness by posting/sharing information online
- Try and change what our leaders are doing (e.g. sign petitions, demonstrate, or write to them)
- None of the above [EXCLUSIVE]
- Don’t know [EXCLUSIVE]
- Prefer not to say [EXCLUSIVE]
- Something else …(please write in below)
[CS_Q11] How connected do you feel to nature? Please choose the picture that best describes your relationship to nature. [Response options: image A, B, C, D, E, F, or G]
[CS_Q12a] How much do you agree or disagree with the following - Being in nature makes me very happy. Please select one answer only
[CS_Q12c] How much do you agree or disagree with the following - I would like to do more to look after the environment
Response options:
- Completely agree
- Strongly agree
- Agree
- Neither agree nor disagree
- Disagree
- Strongly disagree
- Completely disagree
- Don’t know
- Prefer not to say
[CS_Q13] Thinking about the natural outdoor spaces near you. How much do you agree or disagree that…
A) There are lots of places for animals and birds to make their homes
B) There are good spaces for playing
C) They are clean and well looked after
D) I feel welcome there
E) They are easy to get to by walking
Response options:
- 0 – Disagree a lot
- 1
- 2
- 3
- 4
- 5
- 6
- 7
- 8
- 9
- 10 – Agree a lot
- Prefer not to say
- Don’t know
9. Glossary
Connection to nature has been described as an individual’s subjective sense of their relationship with the natural world, and among children and young people (CYP) this may be reflected in how they think and feel about nature (e.g. whether they see nature and humanity as one), and how they experience it (e.g. to what extent they enjoy spending time in nature and benefit from it).
Green and natural spaces are defined in this survey as green and blue spaces in towns and cities (e.g. parks, canals); the countryside (e.g. farmland, woodland, hills and rivers); the coast (e.g. beaches, cliffs) and activities in the open sea; visits of any duration (including short trips to the park, dog walking etc.). They do not include: gardens; outside spaces visited as part of someone’s employment; spaces outside the UK. Additional questions are asked about private gardens.
Weighting is used to ensure the sample is representative of the population. C-PANS uses a ‘Design weight’ to compensate for just one child per household being interviewed, and a ‘rim weighting’ to ensure the sample margins match the wider population margins for age, gender, region and ethnicity. More on this can be found in the technical report.
10. Contact
Natural England welcomes feedback on C-PANS. Please contact the team by email: people_and_nature@naturalengland.org.uk
If you would like to receive further information on the survey, including data releases, publications and survey changes, then visit our User Hub and sign-up to the mailing list at the bottom of the page (best viewed in Google Chrome). After signing up, if you do not receive a confirmation email please check your ‘Junk’ or ‘Spam’ folder.
11. Pre-release Access
Pre-release access was not sought for this release.
12. Related Links
People and Nature Survey information: Further information on the People and Nature Survey for England.
Monitor of Engagement with the Natural Environment: Further information on the Monitor of Engagement with the Natural Environment (MENE) Survey (predecessor to the People and Nature Survey).