Local government pension scheme funds for England and Wales: 2021 to 2022
Updated 3 July 2023
Applies to England and Wales

© Crown copyright 2023
This publication is licensed under the terms of the Open Government Licence v3.0 except where otherwise stated. To view this licence, visit nationalarchives.gov.uk/doc/open-government-licence/version/3 or write to the Information Policy Team, The National Archives, Kew, London TW9 4DU, or email: psi@nationalarchives.gov.uk.
Where we have identified any third party copyright information you will need to obtain permission from the copyright holders concerned.
This publication is available at https://www.gov.uk/government/statistics/local-government-pension-scheme-funds-for-england-and-wales-2021-to-2022/local-government-pension-scheme-funds-for-england-and-wales-2021-to-2022
This statistical release contains information on Local Government Pension Scheme Funds expenditure, income, and membership for the financial year 2021-22 in England and Wales. Data was submitted by all authorities, and 66 out of 85 authorities submitted data based on their provisional accounts. This release was revised on 26 April 2023 to cover changes from 5 authorities. There may be further revisions as a result of continuing audits of authorities’ accounts, but we do not expect any major change to the aggregate figures.
1. In this release:
- Total Local Government Pension Scheme (LGPS) expenditure in England and Wales in 2021-22 was £14.4 billion. This was an increase of £0.9 billion or 6.5% on 2020-21. This was driven in part by an increase in lump-sum retirement payments.
- Total LGPS income in England and Wales in 2021-22 was £15.9 billion. This was a decrease of £1.4 billion or 8.1%. This decrease is common after every third year where many employers make early payments for three years at a time, so the value for last year was higher than usual.
- Employers’ Contributions to the LGPS in 2021-22 in England and Wales amounted to £7.8 billion, a decrease of 24.4%. This decrease is common after every third year where many employers make early payments for three years at a time, so the value for last year was higher than usual. Employees’ contributions to the scheme were £2.6 billion, an increase of 4.8%.
- The market value of LGPS funds at end of March 2022 was £364.0 billion, an increase of £26.9 billion or 8.0%.
- There were 94,717 retirements from the LGPS in 2021-22, an increase of 11,781 or 14.2% compared with 2020-21. This may be due to people being unable or unwilling to retire during the coronavirus pandemic, and more people choosing to retire as the pandemic abated.
Release date: 26 October 2022
Date of next release: October 2023
Contact: 0303 444 2141 / sf3.statistics@levellingup.gov.uk (Responsible Statistician: Jo Coleman)
Media enquiries: 0303 444 1209 / NewsDesk@levellingup.gov.uk
2. Introduction
This release has been compiled by the Department for Levelling Up, Housing and Communities (DLUHC) and provides information on Local Government Pension Scheme (LGPS) funds in England and Wales that were collected on the SF3 (Pensions) 2021-22 form. Forms were expected from 85 Administering Authorities. This covers all members of the LGPS except for the Environment Agency which is not in scope of the DLUHC data collection. This release shows data for England and Wales combined. Tables 1-6 of this release will be available for England and Wales separately to aid continuity in these series.
The SF3 (Pension) form was issued in July 2022 to LGPS administering authorities in England and Wales and forms were submitted by all authorities during July to September.
Authorities were asked, where possible, to submit their data based on audited accounts. However, due to the extension of the audit timetable and the audit deadline being set to the 30 November, 66 authorities submitted their SF3 form based on their provisional accounts data for the original release. Authorities have been asked to submit revised figures based on their audited figures when available, if significantly different.
This release was revised on 26 April 2023 to cover changes from 5 authorities were there were changes as a result of audit. The changes to the aggregate figures are small.
The SF3 (Pensions) form collects information on Local Government Pension Scheme funds’ income, expenditure, membership, retirements, and other activities. It also shows other associated information for the financial year 2021-22 and changes over previous years.
When looking at the figures in this release it should be remembered that throughout the year there are always staff transferring their pensions into, and out of, the LGPS because they either commence work for an employer who is a member of the LGPS and bring their accrued pension with them, or they move to another employer and take their pension pot with them.
In addition, there will be occasions where staff transfer between LGPS schemes and so there will also be transfers between funds within the LGPS.
3. Special factors affecting the data
Since 2017-18 there have been two large transfers between funds and two mergers that have resulted in increases in the Transfer Values shown in both Table 1 and Table 2 below. In most cases, these have been significantly large and make direct comparisons with both previous and subsequent years inappropriate. Like-for-like comparisons have been made in previous statistical releases for the years affected by adjusting figures for Expenditure and Income to remove the effect of these factors. These have been marked in the tables. Changes to consider in the tables in this release are described below.
3.1 2017-18
During 2017-18, South Yorkshire Passenger Transport Authority and Greater Manchester Pensions Funds merged on 1 November 2017 and there was a large transfer from West Yorkshire to Greater Manchester. West Yorkshire reported the transfer (£450 million) completely within their expenditure figures in 2017-18, whereas Greater Manchester reported only part of the transfer (£147.3 million) in their income figures.
3.2 2018-19
There were no mergers in 2018-19. However Greater Manchester reported the remaining portion of the 2017-18 transfer in their income figures. We are aware that the sum of the Greater Manchester transfer income figure (£460.9 million) is greater than the West Yorkshire transfer expenditure figure. We have been unable to reconcile this with the two authorities and so have used the figures as reported.
3.3 2019-20
On the 1 April 2019, the West Midlands Integrated Transport Authority Pension Fund merged into the West Midlands Pension Fund, as per SI 2019 No. 1351. West Midlands Pension Fund reported this to account for £491.7 million of their transfer income figures.
3.4 2020-21
During 2020-21, the Pension Fund for Northumberland was merged into the Tyne & Wear Pension fund. The regulations (SI 2020 No. 502) came into force on the 3 June 2020 but backdated to 1 April 2020.
4. Expenditure: 2017-18 to 2021-22
Table 1 and Chart A provide figures of the expenditure of the Local Government Pension Scheme (LGPS) in England and Wales from 2017-18 to 2021-22.
- Total LGPS expenditure in 2021-22 was £14.4 billion. This was an increase of £0.9 billion or 6.5% on 2020-21.
- The expenditure on benefits in 2021-22 was £11.5 billion, an increase of £0.5 billion or 4.1% on 2020-21. Of this, expenditure on pensions and annuities was £9.5 billion, an increase of £0.3 billion or 2.8%, and expenditure on lump sums paid on retirement was £1.6 billion, an increase of £0.2 billion or 10.8%. This increase in retirement payments may be due to people being unable or unwilling to retire during the coronavirus pandemic, and more people choosing to retire as the pandemic abated.
- Disposal of Liabilities was £0.9 billion in 2021-22, an increase of £0.1 billion or 11.0% and costs charged to the funds were £2.0 billion, an increase of £0.3 billion or 20.3%.
- For England expenditure in 2021-22 was £13.6 billion, an increase of £0.8 billion or 6.6% on 2020-21.
- For Wales, expenditure in 2021-22 was £866 million, an increase of £42 million or 5.2% on 2020-21.
Table 1: Local Government Pension Scheme expenditure, 2017-18 to 2021-22, England and Wales (all figures £ million)
| 2017-18 | 2018-19 | 2019-20 | 2020-21 | 2021-22 | ||||||
|---|---|---|---|---|---|---|---|---|---|---|
| Total expenditure on benefits | 9,814 | 10,407 | 10,919 | 11,083 | 11,541 | |||||
| Of which pensions or annuities | 7,987 | 8,436 | 8,883 | 9,225 | 9,484 | |||||
| Of which lump sums paid on retirement | 1,474 | 1,573 | 1,616 | 1,440 | 1,595 | |||||
| Of which lump sums paid on death | 216 | 239 | 239 | 269 | 275 | |||||
| Of which optional lump sums | 134 | 150 | 172 | 142 | 179 | |||||
| Of which other benefits | 4 | 9 | 9 | 7 | 7 | |||||
| Disposal of liabilities | 1,659 | || | 928 | 952 | 768 | 853 | (R) | |||
| Of which transfer values(a) | 1,657 | || | 926 | 950 | 767 | 851 | (R) | |||
| Of which pensions act premiums | 3 | 2 | 1 | 1 | 2 | |||||
| Costs charged to the funds(b) | 1,189 | 1,317 | 1,487 | 1,681 | 2,023 | (R) | ||||
| Of which investment management expenses | 1,016 | 1,127 | 1,270 | 1,461 | 1,784 | (R) | ||||
| Of which administrative expenses | 121 | 132 | 142 | 148 | 169 | |||||
| Of which governance and oversight costs | 52 | 62 | 74 | 72 | 71 | |||||
| Other expenditure | 28 | 36 | 37 | 23 | 25 | (R) | ||||
| Total expenditure | 12,691 | || | 12,689 | 13,395 | 13,555 | 14,441 | (R) |
(R) Data are revised since the original publication of this release.
(a) Transfer values for 2017-18 include a £240.7m from South Yorkshire PTA for the merger with Greater Manchester and £450m from West Yorkshire to Greater Manchester for the transfer.
(b) The total Costs charged to the funds figures for 2018-19 and 2020-21 does not equal the sum of the component parts due to inconsistencies in reporting by one local authority in each year.
5. Income: 2017-18 to 2021-22
Table 2 and Chart A provide figures of the income to the LGPS in England and Wales and the market value of the scheme from 2017-18 to 2021-22.
- Total LGPS income in England and Wales in 2021-22 was £15.9 billion. This was a decrease of £1.4 billion or 8.1% on 2020-21.
- Employers’ Contributions to the LGPS in 2021-22 in England and Wales amounted to £7.8 billion, a decrease of 24.4%. This is common after every third year where many employers make early payments for three years at a time, so the value for last year was higher than usual. Employees’ contributions to the scheme were £2.6 billion, an increase of 4.8%.
- Investment income to the LGPS in 2021-22 in England and Wales amounted to £4.5 billion, an increase of 21.2%. This increase may be due to an improving investment market as the global economy recovered from the coronavirus pandemic.
- The market value of LGPS funds at end of March 2022 was £364.0 billion, an increase of £26.9 billion or 8.0%.
- For England, income in 2021-22 was £14.9 billion, a decrease of £1.4 billion or 8.8% on 2020-21.
- For Wales, income in 2021-22 was £1,045 million, an increase of £38 million or 3.8% on 2020-21.
Table 2: Local Government Pension Scheme income and market value of funds, 2017-18 to 2021-22, England and Wales (all figures £ million)
| 2017-18 | 2018-19 | 2019-20 | 2020-21 | 2021-22 | ||||||
|---|---|---|---|---|---|---|---|---|---|---|
| Contributions: Employees | 2,145 | 2,205 | 2,326 | 2,441 | 2,558 | (R) | ||||
| Contributions: Employers(a) | 9,472 | 7,131 | 7,680 | 10,312 | 7,792 | (R) | ||||
| Investment income (gross) | 4,403 | 4,433 | 4,404 | 3,711 | 4,499 | (R) | ||||
| Of which dividends receivable | 2,781 | 2,540 | 2,384 | 1,827 | 1,965 | (R) | ||||
| Of which interest receivable | 310 | 240 | 303 | 194 | 162 | (R) | ||||
| Of which income from property | 580 | 614 | 660 | 579 | 660 | (R) | ||||
| Of which other investment income | 733 | 1,039 | 1,056 | 1,112 | 1,712 | (R) | ||||
| Transfer value(b)(c)(d) | 1,341 | || | 1,127 | || | 1,507 | || | 816 | 1,019 | ||
| Other income | 53 | 192 | 60 | 43 | 51 | (R) | ||||
| Total income | 17,414 | || | 15,087 | || | 15,977 | || | 17,324 | 15,919 | (R) | |
| Market value of funds at end of year | 270,919 | 287,193 | 272,395 | 337,111 | 364,042 | (R) |
(R) Data are revised since the original publication of this release.
(a) Includes employers’ secondary contributions
(b) Transfer values for 2017-18 includes £240.7m from South Yorkshire PTA for the merger and £147.3m transfer from West Yorkshire both involving Greater Manchester. West Yorkshire has accounted for the transfer to Greater Manchester wholly within 2017-18 although Greater Manchester will account for most of it in 2018-19.
(c) Greater Manchester accounted for the remaining West Yorkshire transfer value in 2018-19 as a reported £313.6m transfer (see special factors).
(d) Transfer values for 2019-20 include a £491.7 million transfer from West Midlands Integrated Transport Authority Pension Fund for the merger of West Midlands Integrated Transport Authority Pension Fund and West Midlands Pension Fund. Please note that this £491.7mil transfer appears in the income data but not the expenditure data due to the timing of the merger.
Chart A: Local Government Pension Scheme income and expenditure in 2021-22: England and Wales
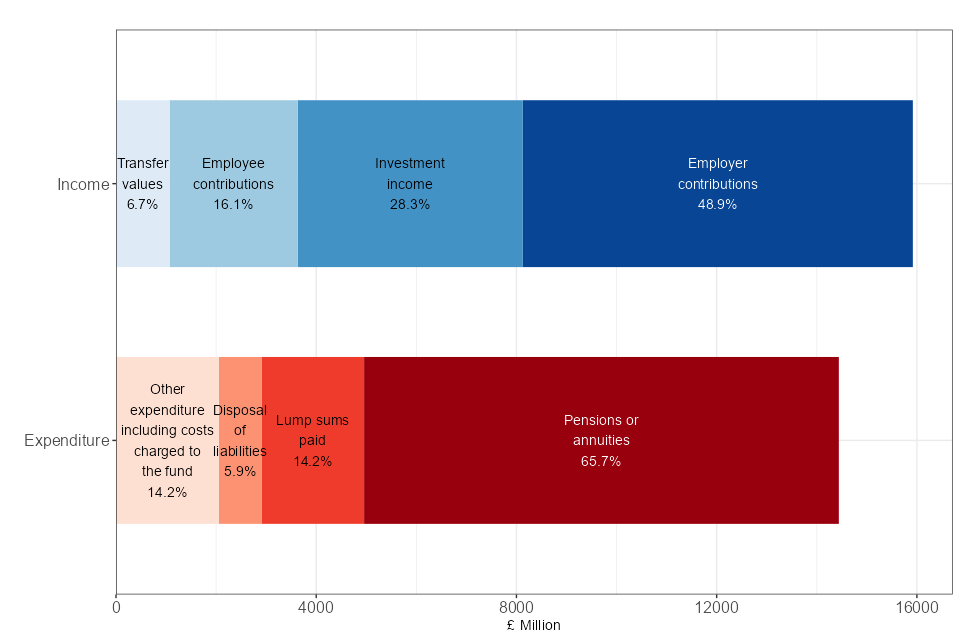
A bar chart which shows that the majority (66%) of expenditure was on pensions or annuities and just under half of income was from employer contributions, and investment income was a greater proportion than employee contributions
6. Income and Expenditure
Table 3 and Chart B provides a comparison of total LGPS expenditure and income in England and Wales from 2017-18 to 2021-22.
- In 2021-22, total expenditure was 90.7% of LGPS income, a higher percentage than seen in the past five years. This is in part due to the decrease in income in 2021-22 which is expected following the triennial revaluation of employers’ contributions, and in part due to an increase in expenditure driven in part by increased retirements.
Table 3: Local Government Pension Scheme total expenditures and income , 2017-18 to 2021-22, England and Wales (all figures £ million)
| 2017-18 | 2018-19 | 2019-20 | 2020-21 | 2021-22 | ||||||
|---|---|---|---|---|---|---|---|---|---|---|
| Total expenditure (from Table 1) | 12,691 | || | 12,689 | 13,395 | 13,555 | 14,441 | (R) | |||
| Total income (from Table 2) | 17,414 | || | 15,087 | || | 15,977 | || | 17,324 | 15,919 | (R) | |
| Expenditure as a % of income | 73% | 84% | 84% | 78% | 91% | (R) |
(R) Data are revised since the original publication of this release.
(a) In 2017-18 The South Yorkshire PTA and Greater Manchester Pensions Funds merged and there was a large transfer from West Yorkshire to Greater Manchester. This makes direct comparisons to 2017-18 inappropriate.
(b) In 2018-19 Greater Manchester Pensions Fund accounted for the remaining West Yorkshire transfer value. This makes direct comparisons to 2018-19 inappropriate.
(c) In 2019-20 West Midlands PTA and West Midlands Pension Fund merged. The transfer value was £491.7 million. This makes direct comparisons to 2018-19 inappropriate.
Chart B: Local Government Pension Scheme total expenditure and income 2012-13 to 2021-22, England and Wales

A line chart that shows income rising since 2015-16 with a greater increase in 2021-22, and expenditure falling this year from a regular peak every three years
7. Membership and Employers
7.1 Membership
Tables 4 and Chart C provide figures of the membership of the LGPS in England and Wales.
- At the end of March 2022, the total membership of the LGPS was 6.3 million people. Of this number, 2.0 million are employees who still contribute to the scheme, 1.9 million are pensioners and 2.3 million are former employees who are entitled to a pension at some time in the future.
Table 4: Number of Local Government Pension Scheme members at the end of each year , 2017-18 to 2021-22, England and Wales (all figures in thousands of members)
| 2017-18 | 2018-19 | 2019-20 | 2020-21 | 2021-22 | ||||||
|---|---|---|---|---|---|---|---|---|---|---|
| Employees | 2,001 | 1,980 | 2,000 | 1,998 | 2,025 | |||||
| Pensioners | 1,660 | 1,733 | 1,798 | 1,849 | 1,931 | |||||
| Former employees entitled to deferred benefits | 2,117 | 2,219 | 2,246 | 2,265 | 2,343 | |||||
| Flexible retirees(a) | 13 | 13 | 14 | 16 | 18 | |||||
| Total membership of LGPS | 5,792 | 5,946 | 6,059 | 6,129 | 6,318 |
(a) Flexible retirement defined in Regulation 30(6) to the 2013 LGPS Regulations
Chart C: Membership of the Local Government Pension Scheme 2012-13 to 2021-22, England and Wales

A line chart which shows that numbers of flexible retirees and pensioners have been rising since 2012-13, while numbers of employees have been stable since 2015-16
7.2 Employers
Data were collected on the type of employer involved in the LGPS. Employers were categorised into one of four groups:
- Local authorities and connected bodies – e.g. a county council, district council
- Centrally funded public sector bodies – e.g. an academy, further education corporation, sixth form college or higher education corporation
- Other public sector bodies – e.g. a National Park Authority
- Private sector, voluntary sector and other bodies – e.g. a passenger transport executive, an urban development corporation, (and private/voluntary sector organisations).
Table 5 shows the number of employers (which includes admitted bodies) in England and Wales in each of the four groups as reported by pension authorities. It also shows the number of employees, pensioners etc. that are part of the LGPS, by the type of employer.
- 73.4% of all the members of the LGPS are covered by local authorities and other connected bodies, even though local authorities and connected bodies represent only 17.1% of employers.
- Private sector, voluntary sector, and other bodies account for just under a third (32.8%) of all employers but are responsible for only 5.4% of LGPS members.
Table 5: Number of Local Government Pension Scheme members at the end of 2022 by type of employer, England and Wales (employer figures unrounded, employee figures in thousands of members)
| Local authorities and connected bodies | Centrally funded public sector bodies | Other public sector bodies | Private sector, voluntary sector and other bodies | Total | |
|---|---|---|---|---|---|
| Total covered by Local Government Pension Scheme (thousands) | 4,638 | 1,164 | 174 | 342 | 6,318 |
| Of which are employees | 1,313 | 557 | 64 | 91 | 2,025 |
| Of which are pensioners | 1,566 | 182 | 58 | 126 | 1,931 |
| Of which are former employees entitled to deferred benefits | 1,744 | 423 | 52 | 124 | 2,343 |
| Of which are flexible retirees(a) | 14 | 2 | 0 | 1 | 18 |
| Total number of employers (whole figures) | 3,392 | 8,882 | 1,053 | 6,507 | 19,834 |
(a) Flexible retirement defined in Regulation 30(6) to the 2013 LGPS Regulations
8. Retirements from the Local Government Pension Scheme
Table 6 and Chart D provide figures of the type of retirement from the LGPS in England and Wales from 2017-18 to 2021-22.
- There were 94,717 retirements from the LGPS in 2021-22, an increase of 11,781 or 14.2% compared with 2020-21. This increase in retirements may be due to people being unable or unwilling to retire during the coronavirus pandemic, and more people choosing to retire as the pandemic abated.
- The number of employees having their deferred benefits paid early was 54,139, an increase of 9.7% on 2020-21, and account for over half (57.2%) of the total employees retiring.
- The number of people leaving the LGPS in 2021-22 due to redundancy continues to fall, a decrease of 566 or 9.5% to 5,423.
- The number of people leaving the LGPS in 2021-22 due to normal retirement was 32,168, an increase of 7,308 or 29.4% on 2020-21.
Table 6: Type of retirements from the Local Government Pension Scheme, 2017-18 to 2021-22, England and Wales
| 2017-18 | 2018-19 | 2019-20 | 2020-21 | 2021-22 | ||||||
|---|---|---|---|---|---|---|---|---|---|---|
| Redundancy | 10,847 | 8,804 | 7,825 | 5,989 | 5,423 | |||||
| Tier 1, 2 & 3 ill health retirement awards under LGPS | 2,791 | 2,875 | 3,046 | 2,739 | 2,987 | (R) | ||||
| Early payment of deferred benefits | 36,435 | 45,469 | 52,112 | 49,348 | 54,139 | (R) | ||||
| Normal retirements | 25,881 | 26,360 | 26,023 | 24,860 | 32,168 | (R) | ||||
| Total retirements | 75,954 | 83,508 | 89,006 | 82,936 | 94,717 | (R) |
(R) Data are revised since the original publication of this release.
Chart D: Type of retirement from the Local Government Pension Scheme, 2012-13 to 2021-22, England and Wales

A line chart which shows redundancies reducing and ill-health retirements stable since 2016-17 and both normal retirements and early payment have risen compared to last year
9. Accompanying Tables and Open Data
9.1 Symbols used
… = not available
0 = zero or negligible
- = not relevant
|| = a discontinuity in data between years
(R) = Revised since the previous update of this data
9.2 Rounding
Where figures have been rounded, there may be a slight discrepancy between the total and the sum of constituent parts.
9.3 Tables
Accompanying tables are available to download alongside this release. These include Tables 1 to 6 for England and Wales separately, and data for individual pension administering authorities.
9.4 Open data
These statistics are available in fully open and linkable data formats.
9.5 Technical Notes
Please see the accompanying technical notes document for further details.
Information on Official Statistics is available via the UK Statistics Authority website.
Information about statistics at DLUHC is available via the Department’s website.