Vehicle licensing statistics: April to June 2026
Published 23 September 2026

© Crown copyright 2026
This publication is licensed under the terms of the Open Government Licence v3.0 except where otherwise stated. To view this licence, visit nationalarchives.gov.uk/doc/open-government-licence/version/3 or write to the Information Policy Team, The National Archives, Kew, London TW9 4DU, or email: psi@nationalarchives.gov.uk.
Where we have identified any third party copyright information you will need to obtain permission from the copyright holders concerned.
This publication is available at https://www.gov.uk/government/statistics/vehicle-licensing-statistics-april-to-june-2026/vehicle-licensing-statistics-april-to-june-2026
About this release
This release presents statistics on motor vehicles in the United Kingdom (UK) covering the period up to June 2026. They are based on administrative data held by the Driver and Vehicle Licensing Agency (DVLA). These statistics include:
- new vehicle registrations
- all licensed vehicles
- zero emission vehicles
A range of detailed data tables and large data files are available online. Also available is a full list of definitions used in this release.
These statistics cover the whole of the United Kingdom, which is Great Britain (England, Scotland, and Wales) and Northern Ireland. Data prior to July 2014 covers Great Britain only.
If you have any feedback on this release, please contact vehicles statistics.
Changes to ULEV classifications
The Department for Transport is committed to continuously improving the quality and transparency of its statistics, in line with the Code of Practice for Statistics. As set out in the notes and definitions, statistics on ultra low emission vehicles (ULEVs), and CO₂ emissions may be subject to revision as part of ongoing quality assurance and methodological improvements to how we process these data.
As part of this commitment, ULEV classifications have been revised across the published time series to improve the treatment of implausible CO₂ values and ensure zero emission vehicles are classified consistently as ULEVs. This removes some non-zero emission vehicles, mainly hybrids, that were previously classified as ULEVs because missing or unavailable CO₂ information had been recorded as zero, while adding a small number of battery electric vehicles.
As a result, ULEV stock figures are around 1.8% lower in recent quarters than previously published, reducing the proportion of licensed vehicles classified as ULEVs by around 0.1 percentage points. Further details are available in the relevant ULEV data tables and the notes and definitions.
Should you have questions regarding this revision, you may contact the vehicles statistics team who will be happy to address these.
What vehicles are included?
Licensed vehicles include vehicles that are licensed for use on UK roads, which typically requires paying Vehicle Excise Duty (VED). Vehicles that are not licensed should typically be given a Statutory Off Road Notification (SORN). The keeper can then re-license their vehicle at any time.
New registration vehicles refer to vehicles that are registered with the Driver and Vehicle Licensing Agency (DVLA) for the first time. This includes both new vehicles and vehicles imported into the UK at the point of first UK registration.
Road using vehicles are defined as vehicles expected to make significant use of public highways and to serve as a mode of transport. Introduced in 2021, this concept supports more accurate interpretation of vehicle statistics by excluding certain vehicle types, such as those that rarely utilise public roads. Approximately 98% of vehicles in the DVLA database meet this definition, with exceptions detailed in Table 2 of the notes and definitions. References to road using vehicles are explicitly labelled throughout this publication.
For further information, see vehicle licensing statistics: notes and definitions
These are accredited official statistics and were independently reviewed by the Office for Statistics Regulation in April 2012. For more information, see the About these statistics section.
Headline figures
In 2026 Quarter 2 (April to June), the number of new vehicle registrations in the UK showed an increase of 12.0%, when compared to 2025 Quarter 2 (April to June). At the end of June 2026, there were 2,313,000 licensed zero emission vehicles, representing 5.4% of all licensed vehicles, with 2,170,000 being road using.
Comparing 2026 Quarter 2 (April to June) with 2025 Quarter 2 (April to June), in the UK there were:
- 682,000 vehicles registered for the first time, an increase of 12.0% (VEH0150)
- 161,000 zero emission vehicles registered for the first time, an increase of 36.9% (VEH1153b), with 157,000 being road using (VEH1153a)
- 147,000 zero emission cars registered for the first time, an increase of 40.5% (VEH1153a)
At the end of June 2026, compared to June 2025, in the UK there were:
- 42.9 million licensed vehicles, an increase of 1.5% (VEH0101a)
- 2,313,000 licensed zero emission vehicles, an increase of 30.7% (VEH1103b), with 2,170,000 being road using (VEH1103a)
- 2,017,000 licensed zero emission cars, an increase of 34.0% (VEH1103a)
At the end of June 2026, zero emission vehicles accounted for 5.4% of all licensed vehicles, an increase of 1.2 percentage points compared to June 2025 (VEH1103b).
New registrations of vehicles: overview
There were 682,000 vehicles registered for the first time in the UK in 2026 Quarter 2 (April to June). This was an increase of 12.0% compared to 2025 Quarter 2 (April to June) (VEH0150).
Table 1: Vehicles registered for the first time in the year by body type, UK, 2026 Q2 (April to June) and 2025 Q2 (April to June) (VEH0150)
| Body type | 2026 Q2 (April to June): New registrations | 2025 Q2 (April to June): New registrations | New registrations (year on year % change) |
|---|---|---|---|
| Total | 682,375 | 609,500 | 12.0 |
| Cars | 538,867 | 472,763 | 14.0 |
| Light goods vehicles (LGVs) | 81,644 | 75,055 | 8.8 |
| Heavy goods vehicles (HGVs) | 10,682 | 12,091 | -11.7 |
| Motorcycles | 34,196 | 30,344 | 12.7 |
| Buses and coaches | 1,942 | 3,184 | -39.0 |
| Other vehicles | 15,044 | 16,063 | -6.3 |
Monthly seasonality
When DVLA issues a new registration plate series, there is usually a peak in new vehicle registrations. Since 1999, new plates have been issued twice a year, in March and September.
New registrations of zero emission vehicles
Zero emission vehicles (ZEVs) are vehicles that are reported to emit 0g of carbon dioxide (CO2) from the tailpipe for every kilometre travelled, currently only including:
- battery electric vehicles (BEVs)
- fuel cell electric vehicles (FCEVs, sometimes referred to as hydrogen powered)
There were 147,000 zero emission cars registered for the first time in April to June 2026, an increase of 40.5% from April to June 2025. Zero emission cars accounted for 27.3% of all new car registrations, compared to 22.2% in April to June 2025 (VEH1153a).
There were 9,000 road using zero emission light goods vehicles (LGVs) registered for the first time in April to June 2026, an increase of 34.6%, compared to April to June 2025. Road using zero emission LGVs accounted for 10.5% of all new LGV registrations, compared to 8.5% in April to June 2025 (VEH1153a).
Table 2: Zero emission road using vehicles registered for the first time by body type, with previous year and total new registrations comparison, UK, 2026 Q2 (April to June) and 2025 Q2 (April to June) (VEH1153a)
| Body type | 2026 Q2 (April to June): New registrations of road using zero emission vehicles | 2026 Q2 (April to June): Proportion (%) of all new road using vehicle registrations that are zero emission | 2025 Q2 (April to June): Proportion (%) of all new road using vehicle registrations that are zero emission |
|---|---|---|---|
| Total | 157,307 | 23.6 | 19.0 |
| Cars | 147,190 | 27.3 | 22.2 |
| Light goods vehicles | 8,552 | 10.5 | 8.5 |
| Heavy goods vehicles | 92 | 0.9 | 0.9 |
| Motorcycles | 838 | 2.5 | 3.0 |
| Buses and coaches | 525 | 27.0 | 18.8 |
| Other vehicles | 110 | 13.5 | 4.2 |
Heavy goods vehicles
Cars and light goods vehicles (up to and including 3.5 tonnes) can typically be driven by those with a category B driving licence. Since July 2018, people with this licence can also drive alternatively fuelled vehicles up to 4.25 tonnes (which are classified as Heavy Goods Vehicles, HGVs, those over 3.5 tonnes) with some additional training. The statistics presented here place these “heavy goods vehicles” into the light goods vehicle category to align with these policy changes.
Chart 1: Zero emission road using car and light goods vehicles (LGVs) registered for the first time as a percentage of all new registrations, UK, 2022 Q2 (April to June) to 2026 Q2 (April to June) (VEH1153a)
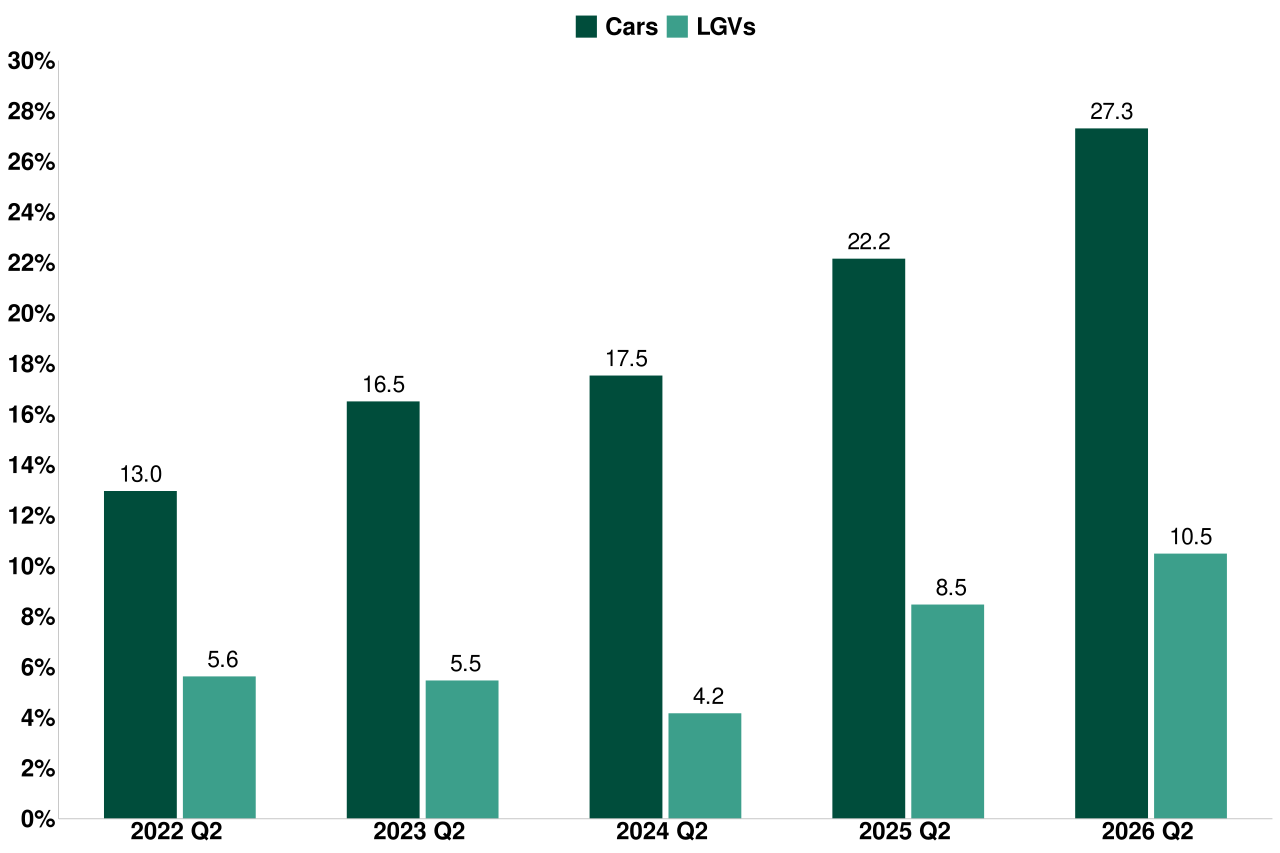
Chart 1 shows the new zero emission registrations of cars and road using light goods vehicles (LGVs) as a percentage of all new registrations since 2022 Q2 (April to June). In 2026 Q2 (April to June), zero emission cars accounted for 27.3% of new car registrations with road using zero emission LGVs accounting for 10.5%.
Licensed vehicles
The number of licensed vehicles grows more slowly than the total number of new registrations. This is a consequence of vehicles leaving the on-road stock through a variety of routes, such as:
- receiving a Statutory Off Road Notification (SORN)
- being written off or scrapped
- being exported from the UK
Table 3: Licensed road using vehicles and licensed road using zero emission vehicles by body type, UK, 2026 Q2 (April to June) (VEH1103a)
| Body type | 2026 Q2 (April to June): Licensed road using vehicles | 2026 Q2 (April to June): Licensed road using zero emission vehicles | 2026 Q2 (April to June): Proportion (%) of all licensed road using vehicles that are zero emission |
|---|---|---|---|
| Total | 42,063,529 | 2,169,589 | 5.2 |
| Cars | 34,888,140 | 2,017,093 | 5.8 |
| Light goods vehicles | 4,951,370 | 127,609 | 2.6 |
| Heavy goods vehicles | 521,099 | 1,636 | 0.3 |
| Motorcycles | 1,485,895 | 13,598 | 0.9 |
| Buses and coaches | 143,580 | 8,877 | 6.2 |
| Other vehicles | 73,445 | 776 | 1.1 |
What vehicles are included?
These figures only include vehicles that are licensed for use on UK roads, which typically requires paying Vehicle Excise Duty (VED).
Vehicles that are not licensed should typically be given a SORN. The keeper can then re-license their vehicle at any time. Detailed tables relating to vehicles with a SORN are available.
Background notes
About these figures
The statistics in the vehicle licensing statistics series are derived by Department for Transport statisticians from extracts of the Driver and Vehicle Licensing Agency (DVLA) vehicle database. The main purpose of the database is to administer vehicle registration and licensing records in the United Kingdom.
For further information about the data used in this release, please see our guidance page which contains:
- detailed notes and definitions
- a note on users and uses of these statistics
There is also a Statement of Administrative Sources for the DVLA vehicles database.
In this release, numbers may not add up to totals and percentages may not add up to 100% due to rounding.
Geographic coverage
In July 2014, vehicle and registration services for Northern Ireland were centralised at DVLA, where these services for Great Britain were already administered. This created a single vehicle register for the United Kingdom, in place of separate registers for Great Britain and Northern Ireland. From this time, statistics can be provided for both Great Britain and the United Kingdom.
Data quality
The databases used for these statistics can be regarded as being virtually complete in terms of the number of vehicles registered for the first time, licensed vehicles, and vehicles with a SORN (Statutory Off Road Notification). However, there may be some errors in some of the specific details of individual vehicles.
The Department for Transport has previously estimated that under 2% of the vehicle records have an inaccuracy in one of the variables used for the statistics published. Other factors to consider in interpreting these statistics include:
- changes in legislation
- seasonal variation which affects some vehicle types
- foreign registered vehicles may also use UK roads without being registered with DVLA
- Vehicle Excise Duty (VED) evasion
Most of these factors will only have a marginal effect for most uses of the data.
About these statistics
These official statistics were independently reviewed by the Office for Statistics Regulation in April 2012. They comply with the standards of trustworthiness, quality and value in the Code of Practice and should be labelled ‘accredited official statistics’.
Details of ministers and officials who receive pre-release access to these statistics up to 24 hours before release can be found in the pre-release access list.
Next release
Vehicle licensing statistics are published quarterly.
Dates of future releases will be advertised via the DfT statistical publications schedule.
To hear more about DfT statistics publications as they are released, please follow us on X.
Related sources of information
DfT also publishes ‘Cars and light goods vehicles registered for the first time by body type and fuel type’ as part of the monthly faster indicators of transport activity statistics series.
Data are sourced by a combination of vehicle registration data supplied by the DVLA, and the monthly published data from the Society of Motor Manufacturers and Traders (SMMT) to produce an early, provisional, estimate of the number of newly registered vehicles that DfT currently publishes as official statistics.
Further information and accompanying methodology notes are published on the department’s Developing faster indicators of transport activity page.
Although SMMT figures provide a very early indication of the vehicle market which broadly matches DfT official statistics, there are persistent differences between these figures as the SMMT data does not account for imported cars/LGVs or vehicle registrations from new manufacturers. The DfT faster indicators address these issues and so are closer to the final DfT estimates than SMMT data.
Comparison with the EU car market
The ACEA (European Automobile Manufacturers’ Association) produce new registration figures collected from trade bodies across Europe, covering the EU, the UK, and the EFTA (Iceland, Norway, Switzerland). UK data is provided by The Society of Motor Manufacturers and Traders (SMMT), which represents new car sales rather than new registrations with DVLA, so although the figures will be broadly comparable, they will not match.
Instructions for printing and saving
Depending on which browser you use and the type of device you use (such as a mobile or laptop) these instructions may vary.
You will find your print and save options in your browser’s menu. You may also have other options available on your device. Tablets and mobile device instructions will be specific to the make and model of the device.
How to search
Select Ctrl and F on a Windows laptop or Command and F on a Mac.
This will open a search box in the top right-hand corner of the page. Type the word you are looking for in the search bar and press enter.
Your browser will highlight the word, usually in yellow, wherever it appears on the page. Press enter to move to the next place it appears.
Contact details
Vehicles statistics