Sex ratios at birth in the UK: 2019 to 2023
Published 16 September 2026

© Crown copyright 2026
This publication is licensed under the terms of the Open Government Licence v3.0 except where otherwise stated. To view this licence, visit nationalarchives.gov.uk/doc/open-government-licence/version/3 or write to the Information Policy Team, The National Archives, Kew, London TW9 4DU, or email: psi@nationalarchives.gov.uk.
Where we have identified any third party copyright information you will need to obtain permission from the copyright holders concerned.
This publication is available at https://www.gov.uk/government/statistics/sex-ratios-at-birth-in-the-uk-2019-to-2023/sex-ratios-at-birth-in-the-uk-2019-to-2023
What’s new
Statistical disclosure control
In the accompanying data tables, all numbers are rounded to the nearest multiple of 5. The purpose of this is to protect sensitive information and to prevent individuals from being identified. Ratios and confidence intervals are calculated from the unrounded figures and are rounded to the nearest decimal place.
Confidence intervals
In the accompanying data tables, 95% confidence intervals have been published to provide greater transparency about the precision and uncertainty of each ratio. They should only be used for this purpose and not be used to identify statistically significant results in this publication.
Structure of data tables
The accompanying data tables have been published in a long format structure. This structure minimises the need for horizontal scrolling and enables users to filter the data more easily in Microsoft Excel and other software packages.
Introduction
This report provides statistics on the analysis of male to female birth sex ratios in the UK using the most recent data for 2019 to 2023. As part of this analysis, sex ratios at birth for mother’s country of birth, ethnicity of the child and birth order (first born, second born, third born or later, and unknown birth order) are compared against a threshold of 107 males per 100 females to assess whether they are higher than expected.
The Department of Health and Social Care (DHSC) made a commitment to carry out and publish analysis of sex ratios at birth annually. This is in line with Resolution 1829 on prenatal sex selection published by the Council of Europe Parliamentary Assembly. Resolution 1829 recommends that member states should:
collect the sex ratio at birth, monitor its development and take prompt action to tackle possible imbalances
and:
encourage research on sex ratios at birth among specific communities.
In most countries, the normal sex ratio at birth varies between 102 and 106 males per 100 females.[footnote 1][footnote 2] If more males than females are being born than expected, this could imply some pregnancies are being terminated with an abortion due to the sex of the foetus. This process is known as a sex selective abortion. However, a number of factors can influence the sex of a child, including but not limited to:
- maternal age
- paternal age
- coital rates
- sex selective abortions
- sex of previous children
- genetic factors
Main findings
The main findings for 2019 to 2023 are:
- there were 3.4 million births registered in the UK from 2019 to 2023
- the sex ratio at birth for the UK is 105.3 males born per 100 females
- the analysis finds evidence of a statistically significant imbalance in the male to female ratio for third-born children or later of Indian ethnicity in England and Wales
- the analysis also finds evidence of a statistically significant imbalance in the male to female ratio for third-born children or later of mothers who were born in India
Limitations of this analysis
Imbalanced sex ratios at birth have been linked to a number of other factors that have not been controlled for in this analysis. Examples of these include but are not limited to:
- maternal age
- paternal age
- coital rates
- sex of previous children
Sex is not itself a lawful ground for abortion in England, Wales and Scotland (under the Abortion Act 1967). It is not possible to accurately determine whether abortions are being carried out on the grounds of foetal sex in the UK. The sex of the foetus is not recorded on HSA4 abortion notification forms in England and Wales. Therefore, it is not possible to assess whether female foetuses are terminated more frequently than male foetuses.
Commentary
Coverage
This report presents statistics and analysis of male to female sex ratios at birth in the UK for the period 2019 to 2023.
Data on ethnicity of the child is not available for Scotland and Northern Ireland. Therefore, this component of the analysis covers England and Wales only.
Historical trends in sex ratios
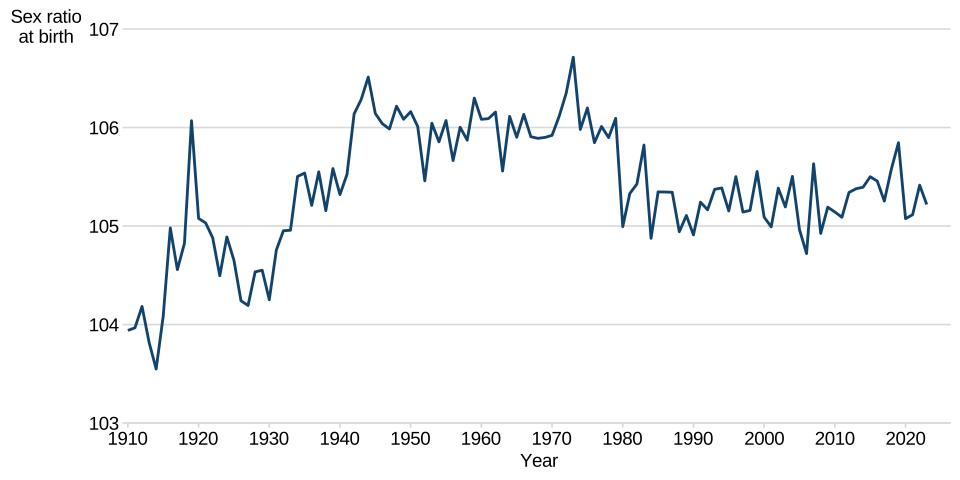
Within large populations, we can expect the sex ratio at birth to vary due to external factors including wars and economic crises. Figure 1 shows the fluctuation within the UK from 1910 to 2023. The sex ratio at birth for the UK has never been above 107 over that period. The minimum ratio was 103.5 in 1914 and the maximum ratio was 106.7 in 1973. Since 1980, the male to female sex ratio at birth has been consistently fluctuating between 104.7 and 105.8.
Figure 1: live male births per 100 live female births, UK, 1910 to 2023
Source: Office for National Statistics (ONS), National Records of Scotland and Northern Ireland Statistics and Research Agency
Mother’s country of birth
All births in the UK
In the period 2019 to 2023, there were 3.4 million live births in the UK and an overall ratio of males to females of 105.3. This is below the threshold of 107 males per 100 females.
The sex ratio at birth did not vary significantly across the different birth orders with a ratio between 105.2 and 106.8 males to 100 females (see table 1 below).
Table 1: sex ratios at birth, by birth order, UK, 2019 to 2023
| Birth order | Number of births | Sex ratio at birth |
|---|---|---|
| All births | 3,416,800 | 105.3 |
| First born | 1,491,235 | 105.5 |
| Second born | 1,172,025 | 105.2 |
| Third born or later | 734,285 | 105.3 |
| Unknown | 19,255 | 106.8 |
Source: ONS, National Records of Scotland, and Northern Ireland Statistics and Research Agency
Population size and sex ratio at birth
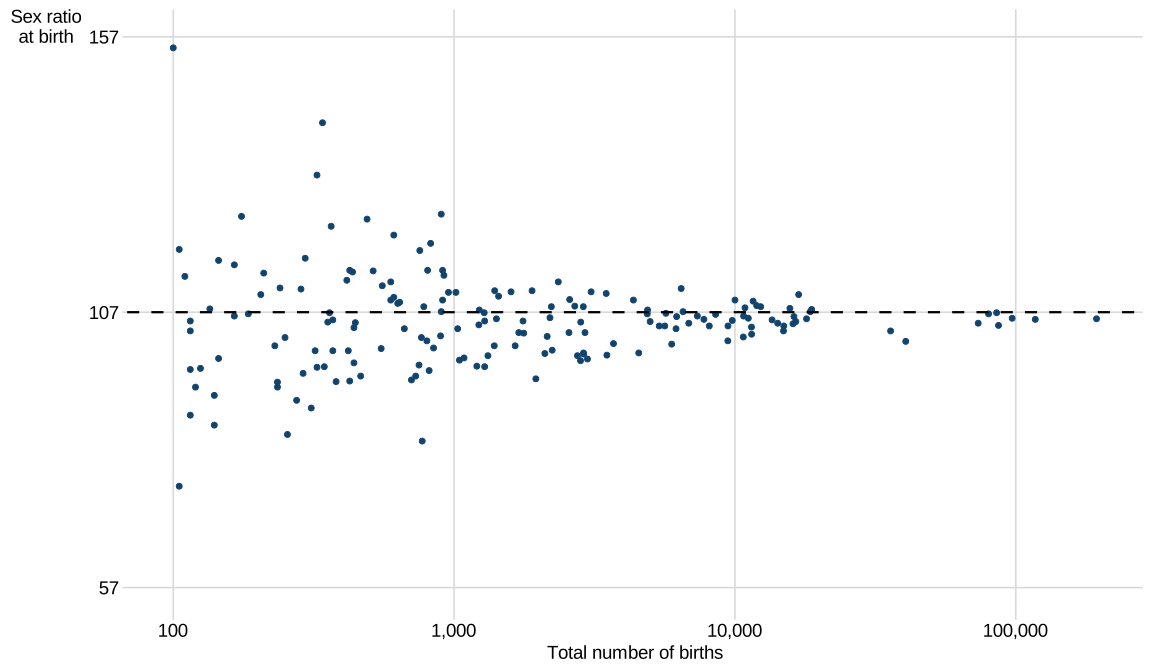
Of the 178 mothers’ countries of birth included in this analysis, 82 had fewer than 1,000 total births between 2019 and 2023. Figure 2 shows that there is a greater variation in sex ratios at birth among mothers’ countries of birth with smaller numbers of babies born. For mothers’ countries of birth with fewer than 1,000 births, the sex ratio ranges from 75.4 to 155.0 - a difference of 79.6.
Sex ratios at birth for mothers’ countries of birth with higher numbers of births were more closely clustered around the upper threshold of 107 male births per 100 female births. For mothers’ countries of birth with more than 1,000 births, the sex ratio ranges from 94.9 to 112.5 - a difference of 17.6.
Figure 2: scatterplot of sex ratios at birth by population size for all births, UK, 2019 to 2023
Birth order and mother’s country of birth
There were 3.4 million births included in the analysis of sex ratios at birth by mother’s country of birth and birth order for the UK. The majority of births in the UK were born to English-born mothers.
During the analysis of mother’s country of birth and birth order, the sex ratio at birth of third-born children or later born to Indian-born mothers was calculated at 117.6 males per 100 females. After extensive statistical testing and corrections for multiple comparisons, this ratio was identified as being significantly higher than the 107 threshold. No other statistically significant findings were identified in this analysis of sex ratios by mother’s country of birth and birth order.
If this ratio was 107, we would estimate seeing an additional 407 females born in this group, assuming the number of males remained the same. Imbalanced sex ratios at birth can be linked to many different factors, as noted above.
Figure 3: sex ratios at birth, India as mother’s country of birth, by birth order, UK, 2019 to 2023
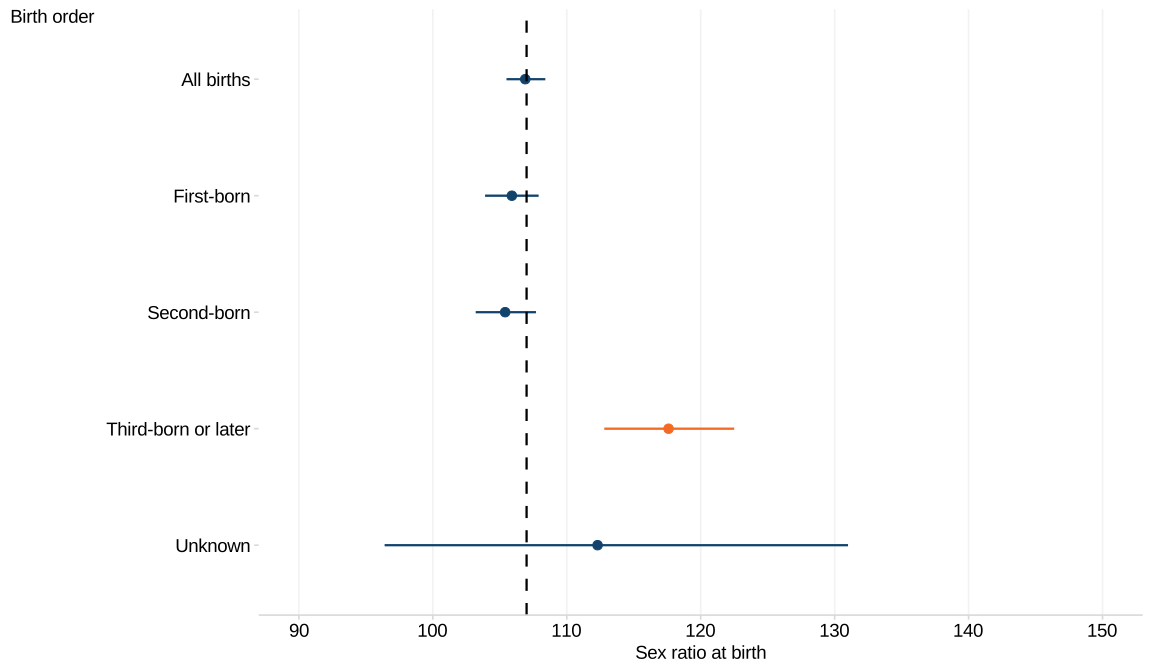
The forest plot in figure 3 shows sex ratios at birth in the UK for India as the mother’s country of birth, by birth order between 2019 and 2023, with 95% confidence intervals included. Sex ratios for all births, first child and second child are similar and close to the threshold of 107 males per 100 females. The sex ratio for third-born children or later is higher and was identified as statistically significant when tested.
Although the sex ratio for births with an unknown birth order was also higher than the 107 males per 100 females threshold, the confidence interval around this estimate was much wider, ranging from 96.4 to 131.0, as shown in figure 3. This was due to the smaller number of births in this category and indicates that the estimate is less precise and subject to greater random variation than those for other birth orders. Confidence intervals for all mothers’ countries of birth and birth orders are available in the accompanying data tables on the Sex ratios at birth in the UK: 2019 to 2023 page.
Ethnicity of the baby
All births in England and Wales
In the period 2019 to 2023, there were 3.1 million live births in England and Wales and an overall ratio of males to females of 105.3, which is below the upper limit of 107. The birth sex ratio did not vary significantly across the different birth orders with a ratio between 105.2 and 106.4 males to 100 females (see table 2 below).
Table 2: sex ratios at birth, by birth order, England and Wales, 2019 to 2023
| Birth order | Number of births | Sex ratio at birth |
|---|---|---|
| All births | 3,071,740 | 105.3 |
| First born | 1,338,860 | 105.4 |
| Second born | 1,052,670 | 105.2 |
| Third born or later | 661,165 | 105.2 |
| Unknown | 19,045 | 106.4 |
Source: ONS
Birth order and ethnicity
There were 3.1 million births included in the analysis of sex ratios at birth by ethnicity of the baby and birth order for England and Wales. The majority of births in England and Wales occurred within the White British ethnic group (58%).
An analysis of sex ratios at birth in England and Wales by the ethnicity of the baby and birth order found one significant result. The sex ratio at birth for third-born children or later of Indian ethnicity was 113.0 and found to be significantly higher than 107 (see table 2 in the accompanying statistical data spreadsheet).
Although some sex ratios at birth were higher than 107 males per 100 females, no other statistically significant findings were identified in this analysis of sex ratios by ethnicity of the baby and birth order.
Figure 4: sex ratios at birth by ethnicity of the baby for all births: England and Wales, 2019 to 2023
| Ethnicity of the baby | Sex ratio at birth |
|---|---|
| Any other ethnic group | 105.4 |
| Any other Asian Background | 106.5 |
| Any other Black background | 104.4 |
| Bangladeshi | 102.5 |
| Black African | 102.7 |
| Black Caribbean | 102.2 |
| Indian | 106.4 |
| Mixed or multiple ethnic groups | 105.7 |
| Not stated | 107.7 |
| Pakistani | 104.4 |
| White British | 105.2 |
| White other | 106.1 |
Figure 5: sex ratios at birth by ethnicity of the baby and birth order: England and Wales, 2019 to 2023
| Ethnicity of the baby | First born | Second born | Third born or later |
|---|---|---|---|
| Any other ethnic group | 106.7 | 105.9 | 103.7 |
| Any other Asian Background | 106.0 | 105.6 | 108.5 |
| Any other Black background | 103.7 | 106.9 | 103.7 |
| Bangladeshi | 103.4 | 101.4 | 102.6 |
| Black African | 102.9 | 101.6 | 103.2 |
| Black Caribbean | 100.4 | 103.2 | 103.0 |
| Indian | 105.4 | 105.3 | 113.0 |
| Mixed or multiple ethnic groups | 106.1 | 104.7 | 105.8 |
| Not stated | 106.2 | 107.4 | 111.1 |
| Pakistani | 104.6 | 104.4 | 104.4 |
| White British | 105.3 | 105.3 | 104.5 |
| White other | 106.0 | 105.6 | 107.6 |
During the analysis of ethnicity of the baby and birth order, the sex ratio at birth for third-born children or later in the Indian ethnic group was calculated at 113.0 males per 100 females. After extensive statistical testing and corrections for multiple comparisons, this ratio was identified as being significantly higher than the 107 threshold. No other statistically significant findings were identified in this analysis.
If this ratio was exactly 107, we would estimate seeing an additional 388 females born in this group, assuming the number of males remains the same. Imbalanced sex ratios at birth have been linked to many different factors, as noted above.
Although the sex ratio for births with an unknown birth order was also higher than the 107 threshold, the confidence interval around this estimate was very wide, as shown in figure 6. This is due to the smaller number of births in this category and indicates that the estimate is less precise and subject to greater random variation than those for other birth orders. Confidence intervals for all ethnic groups and birth orders are available in the accompanying data tables on the Sex ratios at birth in the UK: 2019 to 2023 page.
Figure 6: sex ratios at birth in the Indian ethnic group by birth order, England and Wales, 2019 to 2023
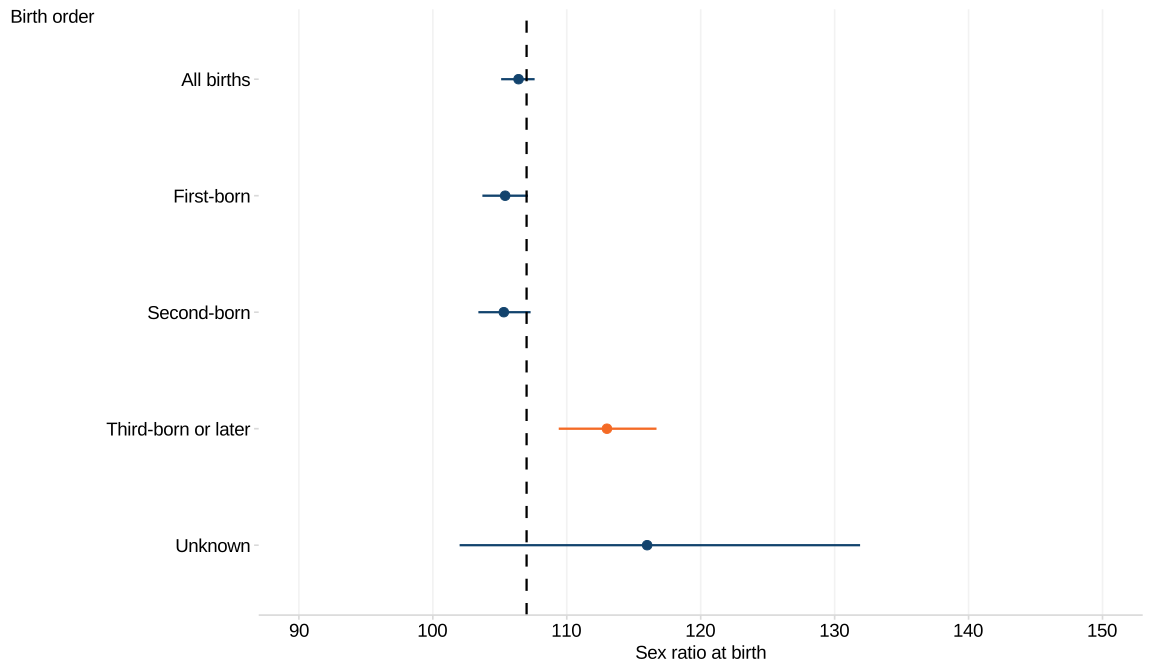
The forest plot in figure 6 shows sex ratios at birth in England and Wales for babies of Indian ethnicity by birth order between 2019 and 2023 with 95% confidence intervals included. Sex ratios for all births, first born and second born are similar and just below the threshold of 107 males per 100 females. The sex ratio for third-born children or later is higher and was identified as statistically significant when tested.
Conclusion
Following extensive statistical testing, this analysis of sex ratios at birth finds:
- a statistically significant imbalance in the male to female sex ratio at birth for third-born children or later born to Indian-born mothers in the UK between 2019 and 2023
- a statistically significant imbalance in the male to female sex ratio at birth for third-born children or later of Indian ethnicity in England and Wales between 2019 and 2023
Annex A: supplementary abortion analysis
This section provides additional analysis on abortions by gestational age and ethnicity from the Abortion statistics for England and Wales: 2023.
The country of birth of the patient undergoing the abortion and the biological sex of the foetus are not recorded on HSA4 abortion notification forms. Therefore, DHSC cannot provide any analyses on country of birth and whether more female foetuses are being terminated than male foetuses.
Ethnic group of the patient
For residents of England and Wales, ethnicity was recorded on 91% of the forms received for 2023. The majority of abortions were for patients from the White ethnic group.
Figure 7: proportion of abortions in England and Wales by ethnic group of the patient, residents of England and Wales, 2023
| Ethnic group | Total number of abortions and percentage |
|---|---|
| White | 187,870 (67.6%) |
| Not known | 25,710 (9.2%) |
| Asian | 27,620 (9.9%) |
| Black | 23,065 (8.3%) |
| Mixed | 13,710 (4.9%) |
Source: Abortion Notification System (ANS)
Repeat abortions and ethnic group
In 2023, 42% were for patients who have had at least one previous abortion. Among these patients, there was variation across ethnic groups. For example, 47% of patients of Mixed ethnicity who underwent an abortion in 2023 had received at least one previous abortion, compared with 30% of Asian ethnicity.
Table 3: proportion of abortions in England and Wales by the number of previous abortions and ethnic group of the patient, residents of England and Wales, 2023
| Ethnic group of the patient | No previous abortions | 1 previous abortion | 2 previous abortions | 3 or more previous abortions |
|---|---|---|---|---|
| Asian | 70% | 23% | 5% | 2% |
| Black | 54% | 32% | 10% | 4% |
| Mixed | 53% | 31% | 11% | 5% |
| White | 56% | 31% | 9% | 3% |
| Not known or not stated | 65% | 25% | 7% | 3% |
Source: ANS
Note: percentages have been rounded so may not add up to 100.
Gestation and ethnic group
Across all ethnic groups, there was little variation in the pattern of abortions carried out across gestational age. Approximately 65% to 91% of abortions were carried out in the 2 to 9 weeks’ gestation window across all ethnic groups. As gestational age increases, the proportion of abortions carried out tended to decrease across all ethnic groups, with the lowest proportion of abortions occurring at 20 weeks’ gestation or more.
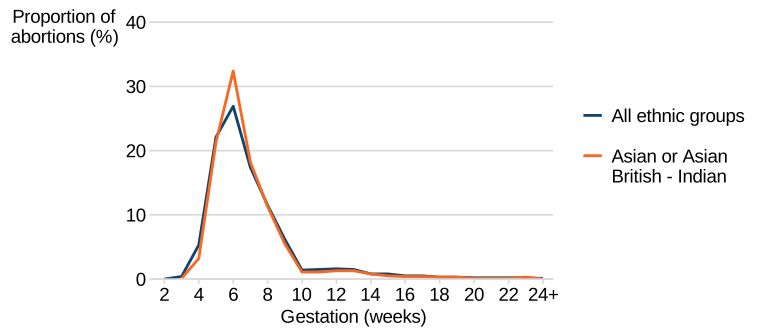
In the analysis of sex ratios at birth by the ethnicity of the baby in England and Wales, a significant finding was identified for third-born children of Indian ethnicity. Figure 8 shows the proportion of abortions being carried out across gestational age for the Indian ethnic group and all ethnic groups after 2 or more previous live or stillbirths. If sex selective abortions were occurring at scale in this group, we would expect to see a spike in the proportion of abortions occurring in the 6 to 10 weeks’ gestation window, which is typically when private clinics begin offering tests for identifying the sex of the foetus.
For residents of England and Wales after 2 or more previous live or stillbirths, the proportion of abortions increased from 2 weeks’ gestation and peaked at 6 weeks, when 27% of abortions were carried out. The proportion then fell from 27% at 6 weeks’ gestation to 1% at 10 weeks’ gestation and remained. In the Indian ethnic group, a similar pattern occurred, with the proportion of abortions peaking at 6 weeks’ gestation where 32% of abortions were carried out.
Although there is a peak in the proportion of abortions for the Indian ethnic group after 2 or more previous live or stillbirths at 6 weeks’ gestation, this increase is also seen when all ethnic groups are considered, so is not distinct for the Indian ethnic group after 2 or more previous live or stillbirths. The proportion of abortions being carried out across gestations is similar across the Indian ethnic group and all ethnic groups.
Figure 8: proportion of abortions in England and Wales by gestation (weeks) after 2 or more previous live or stillbirths, Indian ethnic group, residents of England and Wales, 2023
Source: ANS
Table 4: proportion of abortions in England and Wales by ethnic group and gestation group (weeks), residents of England and Wales, 2023
| Ethnic group of the patient | 2 to 9 weeks’ gestation | 10 to 12 weeks’ gestation | 13 to 19 weeks’ gestation | 20 plus weeks’ gestation |
|---|---|---|---|---|
| Any other ethnic group | 86% | 6% | 7% | 1% |
| Asian or Asian British - any other | 89% | 4% | 6% | 2% |
| Asian or Asian British - Bangladeshi | 89% | 5% | 6% | 1% |
| Asian or Asian British - Chinese | 88% | 5% | 6% | 1% |
| Asian or Asian British - Indian | 90% | 3% | 5% | 1% |
| Asian or Asian British - Pakistani | 89% | 4% | 5% | 2% |
| Black, Black British, Caribbean or African - African | 89% | 4% | 6% | 1% |
| Black, Black British, Caribbean or African - any other | 88% | 5% | 6% | 2% |
| Black, Black British, Caribbean or African - Caribbean | 89% | 5% | 6% | 1% |
| Mixed - any other | 87% | 5% | 7% | 1% |
| Mixed - White and Asian | 91% | 4% | 5% | 1% |
| Mixed - White and Black African | 88% | 5% | 6% | 1% |
| Mixed - White and Black Caribbean | 88% | 5% | 6% | 1% |
| Not known or not stated | 89% | 5% | 5% | 1% |
| White - any other | 88% | 5% | 6% | 2% |
| White - British | 90% | 4% | 5% | 1% |
| White - Gypsy or Irish Traveller | 0% | 0% | 0% | 0% |
| White - Irish | 89% | 4% | 6% | 1% |
| White - Roma | 65% | 18% | 18% | 0% |
Source: ANS
Note: percentages have been rounded so may not add up to 100.
Annex B: legal context
Concern has been raised in some countries about the occurrence of sex selective abortions.[footnote 3][footnote 4]
Sex is not itself a lawful ground for abortion in England, Wales and Scotland (Abortion Act 1967). DHSC guidance, in May 2014, states that abortion on the grounds of sex alone is illegal (see point 25 in the Guidance for doctors on compliance with the Abortion Act).
However, under the Abortion Act, it is lawful to abort a foetus where 2 registered medical practitioners (that is, doctors) are of the opinion, formed in good faith:
that there is a substantial risk that if the child were born it would suffer from such physical or mental abnormalities as to be seriously handicapped.
This would be classed as a ground E abortion. There are some serious conditions that are known to be related to a person’s sex.
From 31 March 2020, a new framework for access to abortion services for Northern Ireland came into force. As with England, Wales and Scotland, sex is not itself a lawful ground for abortions in Northern Ireland.
In early 2015, the Serious Crime Act 2015 contained a requirement that the Secretary of State should arrange for an assessment to be made of the evidence for sex-related abortions occurring. A report was subsequently laid before Parliament in August 2015, which contained the assessment of evidence of abortions being undertaken on the grounds of the sex of the foetus and a statement and explanation of why the Secretary of State for Health considered that a formal plan under subsection (3)(a) of the clause was not required.
Annex C: identifying the sex of a foetus
Antenatal sexing of the foetus is not a routine part of antenatal care. Scans are undertaken to support the clinical care of the woman and foetus for purposes such as:
- ascertaining the number of foetuses
- ascertaining the age of the foetus
- undertaking screening for foetal anomalies
It is usually only possible to identify the sex of a foetus at the second ultrasound scan, which typically takes place in NHS settings at around 18 to 21 weeks’ gestation. Disclosing the sex of a foetus is a local decision, adhering to local policies, and should be based on clinical judgment about the certainty of the assessment and the individual circumstances of each case.
The introduction of new and emerging technologies (such as non-invasive prenatal testing (NIPT) which can identify sex of the foetus) provide further context from which the monitoring of sex ratios at birth needs to be considered. NIPT testing is typically offered in private clinics from 6 to 10 weeks’ gestation. NIPT testing is also available on the NHS depending on eligibility criteria but does not include assessment of the sex of the foetus.[footnote 5]
It is acknowledged that some people may seek information on identifying the sex of a foetus using other methods, such as tests available on the internet or in private clinics. However, data is not available on the extent to which other methods of sex determination may be being used.
Glossary
Terms relating to the source data, such as ethnicity and mother’s country of birth, are defined in the technical appendices.
Confidence interval
In the accompanying data tables, confidence intervals have been published to provide greater transparency about the precision and uncertainty of each ratio. A 95% confidence interval is the most commonly used and gives a range of values within which the true population value is likely to lie. The narrower the interval, the more precise the estimate. The wider the interval, the greater the uncertainty. In this publication, they should only be used for this purpose and not be used to identify statistically significant results.
Random variation
Random variation is the natural fluctuation that occurs in data. Smaller population groups are more affected by random variation and may therefore show unusually high or low results even when there is no underlying difference.
Sex ratio at birth
The sex ratio at birth is a term used to refer to the ratio of male to female births. In this publication, the sex ratio at birth is expressed as the number of males per 100 females. A ratio of 107 males per 100 females is used as the upper threshold for an expected sex ratio.
Statistical significance
Statistical significance is a way of assessing whether an observed difference is likely to be genuine or whether it could have occurred by chance. The commonly accepted threshold for statistical significance is 5%. Results that are statistically significant are considered unlikely to have arisen through random variation alone.
Variation
Variation is a measure of how spread out a set of data values is. Data values with low variation tend to be similar to one another, while data values with high variation are more widely spread. One way to measure variation is by calculating the range, which is the difference between the highest and lowest values.
Contact
As part of the ongoing development of this publication, we are reviewing its content and methodology. We would like to hear from our users about how you use our products, how well these products meet your needs and any feedback on how they could be improved.
Contact us at birthratios@dhsc.gov.uk.
-
Source: NationMaster, People - sex ratio - at birth: countries compared (accessed 10 September 2026). ↩
-
World Health Organization (WHO) (2012) Preventing gender-biased sex selection: an interagency statement. Office of the United Nations High Commissioner for Human Rights (OHCHR), United Nations Population Fund (UNFPA), United Nations Children’s Fund (UNICEF), UN Women and WHO joint interagency statement (accessed 10 September 2026). ↩
-
Hesketh T and Xing ZW. Abnormal sex ratios in human populations: causes and consequences. Proceedings of the National Academy of Sciences 2006: volume 103, issue 36, pages 13,271 to 13,275. ↩
-
Chahnazarian A. Determinants of the sex ratio at birth: review of recent literature. Social Biology 1988: volume 35, issues 3 and 4, pages 214 to 235. ↩
-
In this test, a small blood sample is taken from the mother’s arm. The UK National Screening Committee made a recommendation to use NIPT - a contingent test in the NHS Fetal Anomaly Screening Programme - only for trisomies 13, 18 and 21 and not for any other genetic marker, including sex. (A trisomy is a disorder characterised by an additional chromosome.) ↩