Port Freight Quarterly Statistics (April to June 2026)
Published 10 September 2026

© Crown copyright 2026
This publication is licensed under the terms of the Open Government Licence v3.0 except where otherwise stated. To view this licence, visit nationalarchives.gov.uk/doc/open-government-licence/version/3 or write to the Information Policy Team, The National Archives, Kew, London TW9 4DU, or email: psi@nationalarchives.gov.uk.
Where we have identified any third party copyright information you will need to obtain permission from the copyright holders concerned.
This publication is available at https://www.gov.uk/government/statistics/port-freight-quarterly-statistics-april-to-june-2026/port-freight-quarterly-statistics-april-to-june-2026
Overview of Quarterly Port Freight Statistics
When comparing April to June 2026 with April to June 2025 through UK major ports (PORT0502):
-
total freight tonnage decreased by 5% to 101.4 million tonnes
-
inward tonnage decreased by 4% to 68.6 million tonnes
-
outward tonnage decreased by 6% to 32.8 million tonnes
-
total volume of unitised traffic showed little change, decreasing by less than 1% to 5.5 million units
-
inward units showed little change, increasing by less than 1% to 3.0 million units
-
outward units decreased by 1% to 2.5 million units
When comparing the rolling year to June 2026 with June 2025 through UK major ports (PORT0502):
-
total tonnage decreased by 3% to 411.9 million tonnes
-
total volume of unitised traffic showed little change, decreasing by less than 1% to 21.3 million units
As with all the quarterly figures, these estimates are provisional until finalised with the annual publication in the following calendar year, for example 2026 estimates will be finalised in July 2027. Please also note that percentage changes mentioned in this release are calculated prior to rounding.
Method and coverage
The following commentary is based on statistics in (PORT0503), these estimates are based on total tonnage and units provided by the port which are validated to a high standard and published as provisional national statistics in (PORT0502). These totals are then split by cargo groups based on data provided by shipping agents. If no shipping agent data is received for a port, then no estimates can be created. Since mid-2022, where large amounts of data from a shipping agent are missing in the current quarter, a value has been imputed from the equivalent quarter in the previous year to allow for more accurate national trend analysis. Any feedback from users on this method is welcome at Maritime.Stats@dft.gov.uk.
The agents and ports data might not always match due to missing agent data, or differences in how ports and agents categorise certain shipments. During the annual validations process the department carries out extensive matching between these two data sources and queries the data providers to finalise the annual dataset. During quarterly validations, only high-level matching is conducted. Therefore, (PORT0502) should always be used for accurate trend analysis.
Port Freight trends by cargo type estimates
Chart 1: UK major port freight tonnage traffic by cargo group since 2022 (PORT0503)
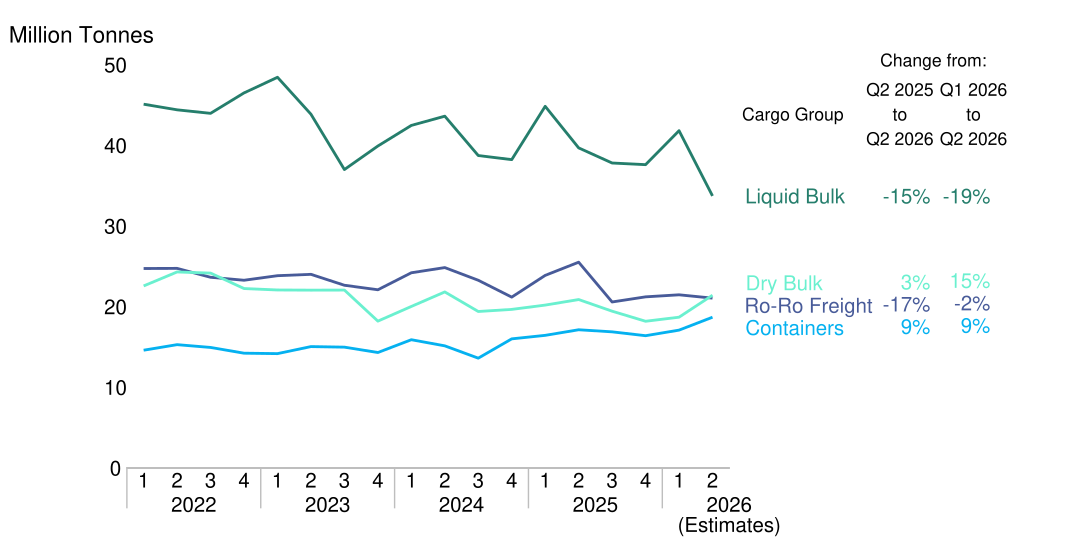
The figures in this chart are timelier estimates, for higher quality trend analysis of cargo groups, please use our 2026 port freight annual statistics when published in July 2027
Chart 1 shows UK quarterly major port tonnage from Q1 2022 (January to March) to Q2 (April to June) 2026 with different lines for the different cargo group estimates.
Liquid bulk remains the largest category, accounting for 33% of all major port tonnage in Q2 2026. However, liquid bulk decreased by 15% in Q2 2026 compared to Q2 2025, largely driven by the closure of Lindsey oil refinery at Grimsby and Immingham and a shutdown period for maintenance at Tetney oil terminal at Rivers Hull and Humber.
Liquid bulk tonnage also fell by 8.1 million tonnes (down 19%) from Q1 2026 to Q2 2026, reaching its lowest total on record since current quarterly records began. This drop was primarily due to seasonal change in energy demand (in line with previous years). Milford Haven reported the largest decline in this period (down 5.6 million tonnes) - the port reported this was partly due to geopolitical disruptions to major energy shipping routes in the Middle East region. DESNZ similarly reported a decrease in liquid bulk imports from the Middle East region over the same period (DESNZ Energy Trends).
Over the past two years, container traffic has rapidly increased, rising to 18.7 million tonnes in Q2 2026, driven largely by the opening of London Gateway’s fourth Berth.
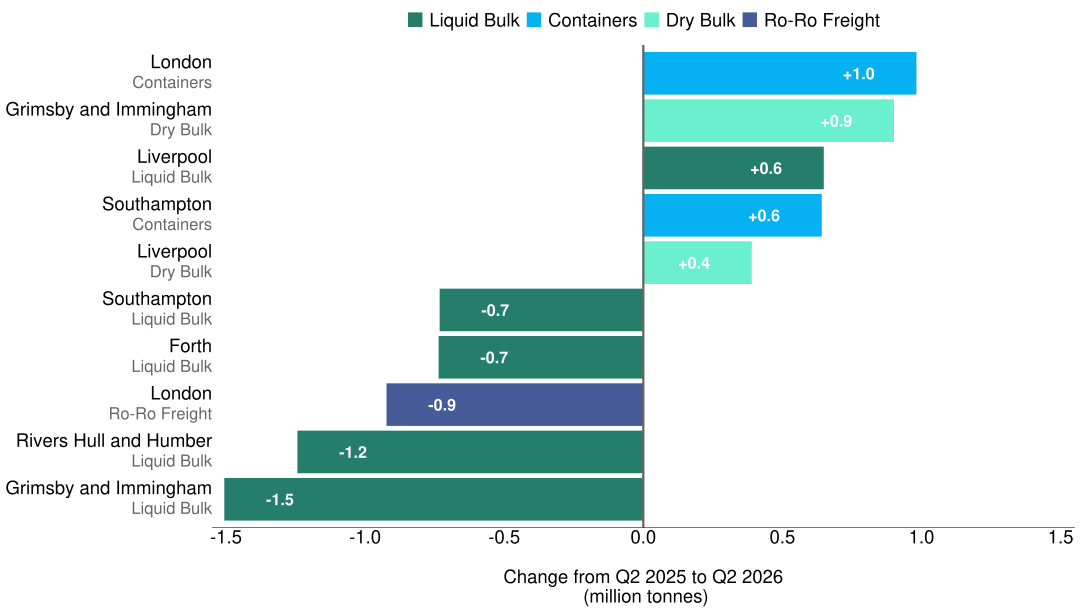
While Chart 1 shows national trends by cargo group, Chart 2 highlights notable port-level changes between Q2 2025 and Q2 2026 by cargo group, showing increases and decreases in tonnage handled by UK major ports.
Many of the largest changes between Q2 2025 and Q2 2026 were in liquid bulk, with four ports recording decreases greater than 0.5 million tonnes, resulting in an overall reduction of 6.0 million tonnes. In contrast, the largest increases were in container traffic and dry bulk.
Chart 2: Notable changes in port freight tonnage between Q2 2025 and Q2 2026, by cargo group (PORT0503)
Liquid Bulk
Liquid bulk tonnage through UK major ports decreased by 15% to 33.7 million tonnes in Q2 2026 compared to Q2 2025.
Chart 2 shows that the overall decline was largely driven by reductions at Grimsby and Immingham, where tonnage fell by 1.5 million tonnes (down 39%), and Rivers Hull and Humber, where tonnage decreased by 1.2 million tonnes (down 42%). The closure of Lindsey oil refinery contributed to the decline at Grimsby and Immingham, while a maintenance shutdown at Tetney oil terminal contributed to the reduction in tonnage at Rivers Hull and Humber. The closure of the Grangemouth oil refinery also resulted in a drop at Forth this quarter (down 21%).
Dry Bulk
Dry bulk tonnage rose by 3% to 21.4 million tonnes in Q2 2026 compared to Q2 2025. The increase was largely driven by Grimsby and Immingham which saw a 0.9 million tonnes increase (up 31%). Despite this increase, larger declines in liquid bulk resulted in an overall reduction in total tonnage handled at the port.
Containers
Container tonnage increased by 9% to 18.7 million tonnes in Q2 2026 compared to Q2 2025. This growth was largely driven by London, where container tonnage rose by 1.0 million tonnes (up 19%) to a record high of 6.0 million tonnes (since current quarterly records began). London has continued to record higher tonnage following the opening of the fourth berth at London Gateway.
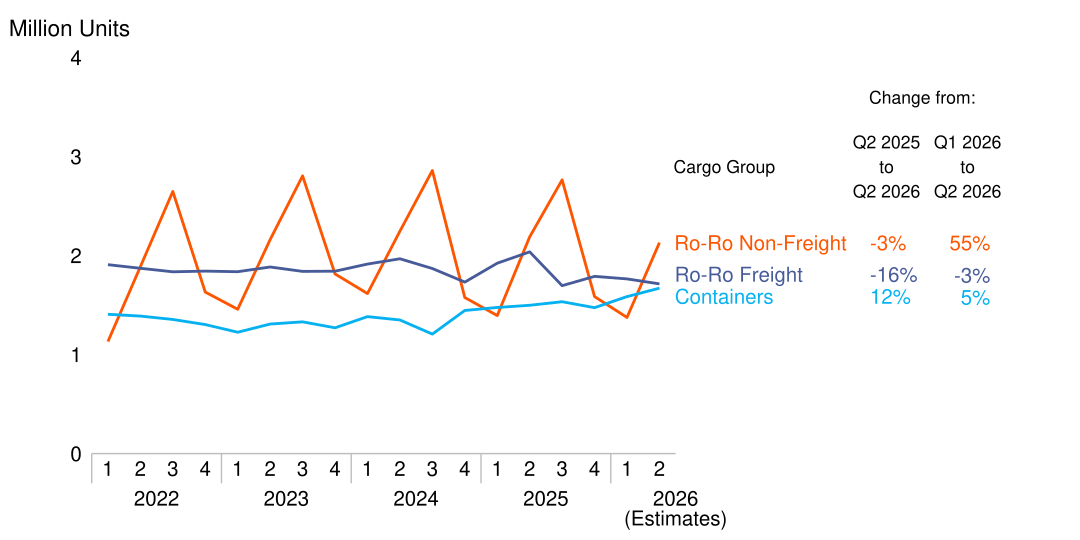
Chart 3 shows UK quarterly major port unitised traffic by cargo group from 2022 to Q2 2026 with different lines for the different cargo group estimates.
When measured in units, container traffic increased by 12% to 1.7 million units in Q2 2026 compared to Q2 2025. Continuing upward trends across recent quarters, London’s container traffic increased by 97,000 units (up 24%) in Q2 2026 compared to Q2 2025. Southampton also saw an increase of 49,000 units over this period.
Chart 3: UK major port freight unitised traffic by cargo group since 2022 (PORT0503)
Ro-Ro Freight
When comparing the rolling year to Q2 2026, Ro-Ro Freight tonnage decreased by 10% to 84.4 million tonnes. London recorded the largest decline, with tonnage falling by 2.2 million tonnes (23%).
Ro-Ro Freight unitised traffic also fell over the same period, decreasing by 8% to 1.7 million units. As with tonnage, London experienced the largest reduction, with 192,000 fewer units handled (down 25%).
Ro-Ro Non-Freight
In Q2 2026, Ro-Ro non-freight units decreased by 3% compared with Q2 2025, falling to 2.0 million units. This was largely driven by Southampton, which recorded the largest decline of any UK major port, with traffic falling by 40,000 units (down 42%).
Since Q1 2026, Ro-Ro non-freight unitised traffic saw an increase of 55% which can be attributed to seasonal variation as shown in Chart 3.
Definitions
Unitised goods: Goods which are lifted on or off the vessel in large (20 foot or longer) shipping containers or rolled on or off in 1 of a variety of self-propelled or towed units are said to be unitised cargoes. For these cargo types, the number of units as well as the weight of goods is recorded. The exception is passenger cars, which don’t carry cargo and therefore we collect only the number of units.
Tonnage: Gross weight in tonnes, including crates and other packaging. The tare weights of containers, road goods vehicles, trailers and other items of transport equipment (the unloaded weight of the vehicle or equipment itself) are excluded.
Liquid bulk: Consists of any liquid or liquified gas carried in the main cargo hold of bulk carrier vessels.
Liquified natural gas (LNG): Natural gas which has been cooled to approximately -160°C, changing its state from gas to liquid. This enables transportation of gas by ship, as the volume is significantly reduced compared to the gaseous state. Following import, LNG is regasified at a terminal and then transported through the gas pipeline network.
Dry bulk: Carried in the main cargo hold of bulk carrier vessels, for example coal, ores, scrap metal and wood pellets.
Containers (also referred to as Lo-Lo): Measured in both tonnes and units, where 1 unit is 1 container, and tonnage measures the weight of the cargo being carried, excluding the weight of the container itself, so an empty container has a weight of 0.
Roll-on/Roll-off (Ro-Ro): Cargo that can be moved on to, or off, a vessel either by their own propulsion (such as a passenger car) or with assistance (such as an unaccompanied trailer). Detailed information is available in this category flowchart.
Ro-Ro freight traffic: All Ro-Ro units that carry cargo, both accompanied and unaccompanied, it is measured in both tonnes and units, where 1 unit is 1 vehicle or trailer, and tonnage measures the weight of the cargo being carried, excluding the weight of the vehicle itself, so an empty unit has a weight of 0.
Ro-Ro non-freight traffic: All other Roll-on/Roll-off traffic that does not carry cargo, such as passenger vehicles, import/export vehicles and unaccompanied caravans. Passenger vehicles are counted in units but do not have a tonnage as they are carrying no cargo, therefore Ro-Ro non-freight tonnage is mostly import/export vehicles.
Accompanied: Road goods vehicles carrying freight accompanied by the driver on the sea crossing.
Unaccompanied: Road goods vehicles without the accompanied cab, rolled on and off the vessel by port operations and collected by a new driver at the destination port.
Background information
The tables give further detail of the key results presented in this statistical release. They are available from port and domestic waterborne freight statistics.
These notes provide further information such as definitions and a list of UK ports is available in the accompanying port list.
The background quality report provides further information on how the data is collected, quality assured and comparisons with relevant data sources.
Details of Ministers and officials who receive pre-release access to these statistics up to 24 hours before release can be found on the pre-release access list.
About these statistics
These statistics are labelled as official statistics in development. Official statistics in development (previously Experimental Statistics) are official statistics that are undergoing a development; they may be new or existing statistics, and will be tested with users, in line with the standards of trustworthiness, quality, and value in the Code of Practice for Statistics.
Instructions for printing and saving
Depending on which browser you use and the type of device you use (such as a mobile or laptop) these instructions may vary.
You will find your print and save options in your browser’s menu. You may also have other options available on your device. Tablets and mobile device instructions will be specific to the make and model of the device.
How to search
Select Ctrl and F on a Windows laptop or Command and F on a Mac
This will open a search box in the top right-hand corner of the page. Type the word you are looking for in the search bar and press enter.
Your browser will highlight the word, usually in yellow, wherever it appears on the page. Press enter to move to the next place it appears.
Contact us
Maritime and shipping statistics
Email maritime.stats@dft.gov.uk
Media enquiries 0300 7777 878
To hear more about DfT statistical publications as they are released, follow us on X at DfTstats.