Nutritional Supply of Agriculture in the UK 2025
Published 15 October 2026

© Crown copyright 2026
This publication is licensed under the terms of the Open Government Licence v3.0 except where otherwise stated. To view this licence, visit nationalarchives.gov.uk/doc/open-government-licence/version/3 or write to the Information Policy Team, The National Archives, Kew, London TW9 4DU, or email: psi@nationalarchives.gov.uk.
Where we have identified any third party copyright information you will need to obtain permission from the copyright holders concerned.
This publication is available at https://www.gov.uk/government/statistics/nutritional-supply-of-agriculture-in-the-uk-2025/nutritional-supply-of-agriculture-in-the-uk-2025
1. Key messages
-
Based on what UK farmers currently grow and produce, the statistics show that the estimated nutritional value of that food, before any food processing or food waste, is broadly equivalent to the nutritional needs of the population.
-
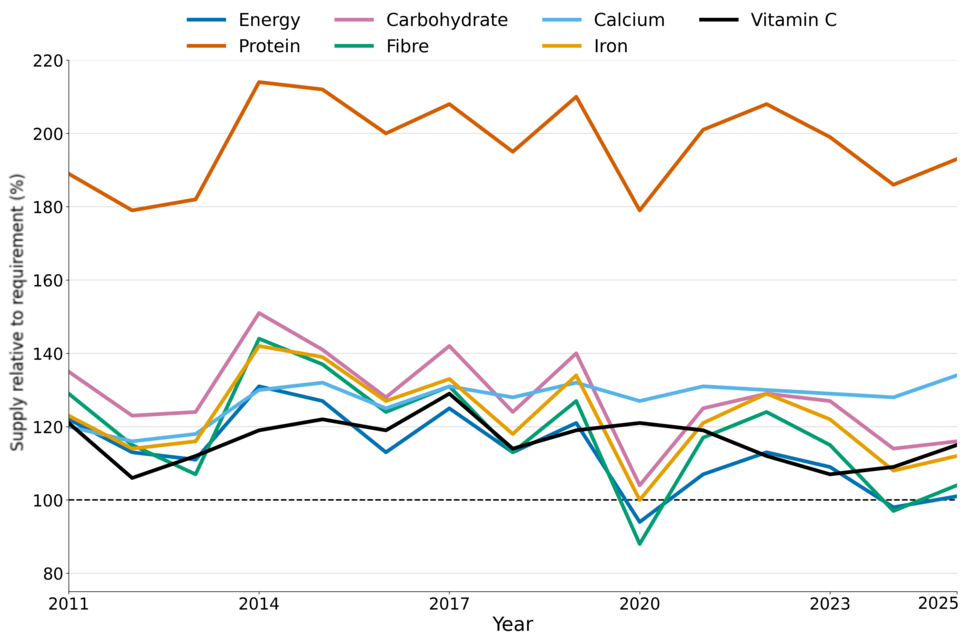
Of the nutrients assessed, energy (reported here in kilocalories) had the smallest margin above the estimated population requirement, with UK production in 2025 equivalent to 101% of energy need.
-
For many key nutrients, UK production is estimated at greater than the nutritional requirements of the population. For example, the UK produces 194% of the protein the population needs.
-
UK agricultural production provided the equivalent of 105% of estimated dietary energy requirements (reported in kilocalories) on average over the latest five-year period, and 112% on average over the latest ten-year period. Across the full 15-year time series, this proportion ranged from a low of 94% in 2020 to a high of 131% in 2014
-
The information in this release gives information on the available nutritional content of agricultural output assuming minimum processing and no food waste. Further processing in the food and drink sector may change the nutritional composition of produce. Some other sectors, primarily fisheries, provide additional sources of energy and nutrients not captured here.
-
The ability of the population to achieve UK dietary recommendations, as reflected by the UK food model the Eatwell Guide, has not been assessed.
2. Official status
This is an official statistic in development, meaning it is newly developed and undergoing evaluation. This publication is created to allow users and stakeholders to feed back on the suitability and quality of the statistic in the development stage.
Further information on types of official statistic can be found on the UK Statistics Authority website.
3. Background
The United Kingdom produced a total agricultural output of £33.6bn (combined crop and livestock output, Total Income From Farming 2025). across 16.8 million hectares of land in 2025 (Agricultural Land Use in the United Kingdom 2025). Presented here is a new statistic in development which estimates nutritional supply derived from agricultural output across the United Kingdom, covering a broad range of macro- and micronutrients and how that meets dietary requirements of the population in 2025. This is not an assessment of the overall food security or self sufficiency of the United Kingdom. There are significant changes in the nutritional content that occur after harvest in agricultural products. Dietary choices are not based on what is grown in the UK but can include imported food that cannot be grown here. It also does not assess the ability of the population to achieve UK dietary recommendations, as reflected by the UK food model the Eatwell Guide as dietary requirements differ from dietary reccomendations. This statistic should be taken as just one of many indicators of food security. For more information on food security please see the United Kingdom Food Security Report and Food Security Digest. UK government recommendations for energy and nutrient intakes are summarised in Government Dietary Recommendations.
4. Detailed results
For energy and each nutrient, total supply from UK agriculture is compared with the population average requirement. This has been calculated as a weighted average by age and sex using the age/sex specific requirements set out in the Government Dietary Recommendations
4.1 Energy
Energy is reported here in kilocalories (kcal). Of the major nutritional needs of the population, energy has the lowest estimated total level of supply relative to population needs. Across the population people need on average 2119 kcal per day, in 2025 agriculture produced the equivalent of 2150kcal per person per day supporting 101% of calorific requirements.
Table 1: Total energy produced by UK agriculture (kcal) and equivalent population sustained, 2025
| Products | Total energy (billion kcal) | Energy Supply (people/year) | Energy (% population supported) |
|---|---|---|---|
| Cereals | 29,085 | 37,606,416 | 54 |
| Vegetables | 8,459 | 10,936,893 | 16 |
| Fruit | 202 | 260,873 | 0.3 |
| Livestock Products | 16,666 | 21,547,810 | 31 |
| Total | 54,412 | 70,351,992 | 101 |
Source: Nutritional Supply of Agriculture in the United Kingdom
4.2 Protein
The estimated daily protein requirement of the UK population was approximately 3,200 tonnes, based on an average requirement of 46 grams per person per day. Estimated UK agricultural production provided the equivalent of around 6,200 tonnes of protein per day, representing 195% of the estimated population requirement.
Table 2: Total protein produced by UK agriculture (tonnes) and equivalent population sustained, 2025
| Products | Total protein (tonnes) | Protein supply (people/year) | Protein (% population supported) |
|---|---|---|---|
| Cereals | 893,238 | 52,834,132 | 76 |
| Vegetables | 103,199 | 6,104,124 | 9 |
| Fruit | 2,774 | 164,099 | 0.2 |
| Livestock Products | 12,64,319 | 74,783,226 | 108 |
| Total | 2,263,531 | 133,885,581 | 193 |
Source: Nutritional Supply of Agriculture in the United Kingdom
4.3 Carbohydrates
Based on an average daily carbohydrate requirement of 280 grams per person, the UK population required approximately 19,500 tonnes of carbohydrate per day. Estimated UK agricultural production provided the equivalent of around 23,000 tonnes of carbohydrate per day, sufficient to meet 118% of estimated population requirements.
Table 3: Total carbohydrates produced by UK agriculture (tonnes) and equivalent population sustained, 2025
| Products | Total carbohydrates (tonnes) | Carbohydrate supply (people/year) | Carbohydrate (% population supported) |
|---|---|---|---|
| Cereals | 5,364,999 | 52,258,025 | 75 |
| Vegetables | 2,118,647 | 20,636,784 | 30 |
| Fruit | 46735 | 455,228 | 1 |
| Livestock Products | 746,282 | 7,269,199 | 10 |
| Total | 8,276,664 | 80,619,235 | 116 |
Source: Nutritional Supply of Agriculture in the United Kingdom
4.4 Fibre
Based on an average daily fibre requirement of 28 grams per person, the UK population required approximately 1,950 tonnes of fibre per day. Estimated UK agricultural production provided the equivalent of around 2,040 tonnes of fibre per day, sufficient to meet 105% of estimated population requirements.
Table 4: Total fibre produced by UK agriculture (tonnes) and equivalent population sustained, 2025
| Products | Total fibre (tonnes) | Fibre supply (people/year) | Fibre (% population supported) |
|---|---|---|---|
| Cereals | 600,887 | 58,526,021 | 84 |
| Vegetables | 131,962 | 12,853,007 | 18 |
| Fruit | 9,573 | 932,387 | 1 |
| Livestock Products | 0 | 0 | 0 |
| Total | 742,421 | 72,311,415 | 104 |
Source: Nutritional Supply of Agriculture in the United Kingdom
4.5 Fats and Sugars
Fats and sugars are found in a wide range of foods. Dietary guidance recommends maximum daily intakes for total fat, saturated fat and free sugars rather than population requirements for these nutrients. Consequently, no population requirement has been estimated.
4.6 Micronutrients
A healthy diet requires a wide range of micronutrients, including vitamins and minerals. This release presents estimates for selected micronutrients ( calcium, iron and vitamin C) which are presented here as an example of supply. Estimates for a broader range of micronutrients are available in the accompanying dataset.
Table 5: Total Calcium produced by UK agriculture (kilograms) and equivalent population sustained, 2025
| Products | Total Calcium (kilograms) | Calcium Supply (people/year) | Calcium (% population supported) |
|---|---|---|---|
| Cereals | 2,318,356 | 9,215,642 | 13 |
| Vegetables | 1,046,052 | 4,158,136 | 6 |
| Fruit | 51,961 | 20,6551 | 0 |
| Livestock Products | 20,056,348 | 79,725,513 | 115 |
| Total | 23,472,717 | 93,305,842 | 134 |
Source: Nutritional Supply of Agriculture in the United Kingdom
Table 6: Total Iron produced by UK agriculture (kilograms) and equivalent population sustained, 2025
| Products | Total Iron (kilograms) | Iron Supply (people/year) | Iron (% population supported) |
|---|---|---|---|
| Cereals | 215,624 | 58,114,318 | 83 |
| Vegetables | 22,505 | 6,065,382 | 9 |
| Fruit | 1,025 | 276,153 | 0 |
| Livestock Products | 49,457 | 13,329,426 | 19 |
| Total | 28,8610 | 77,785,279 | 112 |
Source: Nutritional Supply of Agriculture in the United Kingdom
Table 7: Total Vitamin C produced by UK agriculture (grams) and equivalent population sustained, 2025
| Products | Total Vitamin C (kilograms) | Vitamin C Supply (people/year) | Vitamin C (% population supported) |
|---|---|---|---|
| Cereals | 544,875 | 3,314,229 | 5 |
| Vegetables | 831,131 | 59,039,507 | 85 |
| Fruit | 107,587 | 7,642,453 | 11 |
| Livestock Products | 324,471 | 2,304,8841 | 33 |
| Total | 1,808,064 | 93,045,029 | 134 |
Source: Nutritional Supply of Agriculture in the United Kingdom
5. Time series
The estimated energy supply from UK agricultural production met 105% of the UK’s 2025 calorific requirements on average over the most recent five-year period, and 112% over the most recent ten-year period. Annual estimates ranged from 94% of requirements in 2020 to 131% in 2014. 2020 was the only year in the time series where energy needs of the population were not met. For all other major macro- and micronutrients, estimated supply met or exceeded population requirements in each year of the 15-year time series.
Figure 1: UK population nutritional requirements provided by UK agriculture, 2010 to 2025, percent
Source: Nutritional Supply of Agriculture in the United Kingdom
6. Methodology
6.1 Food output from agriculture
To calculate this statistic, we used publicly available government data to estimate how much food is produced by UK agricultural output, measured by weight. The rationale for using agricultural output without factoring in processing of food and food waste is due to the limited availability and complexity of further data. We aim to improve this in future years.
We estimated production based on the amount of land used for arable and horticultural crops and crop yields or slaughter number and carcasse weights and then validated these as far as possible against direct production data. Direct production data was not used in all cases due to inconsistencies in reporting data between nations. The data for crop areas are primarily taken from the June Surveys of Agriculture for each constituent nation, England, Northern Ireland, Scotland, Wales. The area and yield of horticultural products such as fruit and vegetables comes from Horticulture Statistics. Cereal crop yields come from Cereals and Oilseed Rape Production. Beef, sheep and pork production data comes from UK Slaughter of Livestock statistics. Poultry data comes from latest poultry and poultry meat statistics. Egg production data comes from Latest Egg Statistics and Milk comes from Latest statistics on milk utilisation by dairies.
These sources are based on surveys, as such they are subject to a degree of sampling error and do not take into account other sources of survey errors, such as non-response bias or administrative data errors. All production totals in this statistic and the following nutritional supply information are therefore also an estimate.
The method of converting output to food product used varies by product type, and we made a number of assumptions where complete data are not available. In particular, we accounted for arable crops that are used as animal feed rather than for human consumption. The proportion of arable crops fed to livestock comes from UK averages in Agricultural Land Use in the United Kingdom, for Scotland we are able to derive specific values of crops fed to livestock from Total Income From Farming in Scotland. For Northern Ireland we have used DAERA Cereal Balance Data, currently unpublished. The remaining nations proportion fed to livestock has been apportioned to add up to UK total splits. Apart from crops used for livestock feed, we assumed that all remaining food produced is available for human consumption. This will lead to an overestimation of nutrition as the food sector uses produce for diverse products and there are significant amounts of food waste both in the supply chain and in homes.
Where sufficient data are available in crops, we present production figures for individual UK countries. Where data are limited, figures are reported at UK level only. All livestock data has been summarised at the UK level due to aggregation of slaughter data. Country level nutritional supply estimations cannot be derived from this data due to the incomplete data around horticulture products and livestock.
Cereals
Table 8: Cereal production and yield from UK agriculture, by country, 2025
| Country | Product | Area (ha) | Percentage Not Fed to Livestock | Crop Yield (t/ha) | Total Crop Yield (thousand tonnes) | Food Commodity Yield from crop (%) | Food Yield (thousand tonnes) |
|---|---|---|---|---|---|---|---|
| England | Wheat | 1,525,137 | 47 | 7 | 5,046.64 | 100 | 5,046.64 |
| England | Winter Barley | 302,144 | 24 | 6.6 | 487.24 | 100 | 487.24 |
| England | Spring Barley | 439,384 | 24 | 5 | 537.49 | 100 | 537.49 |
| England | Oilseed Rape | 217,066 | 97 | 3.6 | 745.17 | 45 | 335.33 |
| England | Oats | 162,476 | 57 | 4.6 | 426.56 | 100 | 426.56 |
| England | Maize | 241,276 | 45 | 7.5 | 821.36 | 100 | 821.36 |
| England | Other Cereals | 26,758 | 43 | 6.5 | 74.67 | 100 | 74.67 |
| Northern Ireland | Wheat | 8,761 | 10 | 8.4 | 7.33 | 100 | 7.33 |
| Northern Ireland | Winter Barley | 7,417 | 10 | 7.9 | 5.85 | 100 | 5.85 |
| Northern Ireland | Spring Barley | 12,064 | 10 | 5.8 | 6.97 | 100 | 6.97 |
| Northern Ireland | Oats | 1,814 | 50 | 6.6 | 5.98 | 100 | 5.98 |
| Northern Ireland | Other Cereals | 114 | 23 | 6.5 | 0.17 | 100 | 0.34 |
| Northern Ireland | Maize | 3,540 | 45 | 7.5 | 12.05 | 100 | 12.05 |
| Scotland | Wheat | 108,256 | 45 | 9.5 | 463.37 | 100 | 483.17 |
| Scotland | Winter Barley | 43,431 | 45 | 8.4 | 163.48 | 100 | 163.48 |
| Scotland | Spring Barley | 251,892 | 45 | 6.2 | 704.68 | 100 | 704.68 |
| Scotland | Oilseed Rape | 32,665 | 1 | 4.7 | 153.02 | 45 | 66.85 |
| Scotland | Oats | 29,444 | 91 | 6.3 | 115.03 | 100 | 115.03 |
| Scotland | Maize | 25,83 | 45 | 7 | 8.72 | 100 | 8.72 |
| Wales | Wheat | 27,980 | 47 | 6.4 | 84.15 | 100 | 84.15 |
| Wales | Winter Barley | 9,887 | 24 | 6.2 | 14.91 | 100 | 14.91 |
| Wales | Spring Barley | 13,680 | 24 | 4.7 | 15.87 | 100 | 15.87 |
| Wales | Oilseed Rape | 43,33 | 97 | 3.5 | 14.68 | 45 | 6.6 |
| Wales | Oats | 4,327 | 0.57 | 4.48 | 11.08 | 100 | 11.08 |
| Wales | Maize | 26,707 | 43 | 7.5 | 90.92 | 100 | 90.92 |
| Wales | Other Cereals | 2,104 | 62 | 6.5 | 5.87 | 100 | 5.87 |
Source: Nutritional Supply of Agriculture in the United Kingdom
Note: Where a food product has a different yield from the raw crop we have applied a correction labelled “Food Commodity Yield From Crop”. For Oilseed rape we assume a food commodity yield from the crop of 45%, this is the yield of rapeseed oil that comes from the oilseed rape itself. This estimate comes from AHDB
Vegetables
Table 9: Vegetable production and yield from UK agriculture, by country, 2025
| Country | Product | Area (ha) | Percentage Not Fed to Livestock | Crop Yield (t/ha) | Total Crop Yield (thousand tonnes) | Food Commodity Yield from crop (%) | Food Yield (thousand tonnes) |
|---|---|---|---|---|---|---|---|
| England | Beans | 137,689 | 60 | 3.5 | 289.15 | 100 | 289.15 |
| England | Potatoes | 89,780 | 100 | 47.6 | 4271.8 | 100 | 4271.8 |
| England | Sugar Beet | 92,501 | 100 | 77.6 | 7179.7 | 16 | 1148.75 |
| Northern Ireland | Potatoes | 3,187 | 100 | 47.6 | 151.64 | 100 | 151.64 |
| Scotland | Beans | 3,020 | 60 | 3.5 | 6.34 | 100 | 6.34 |
| Scotland | Potatoes | 17,003 | 100 | 47.6 | 809.02 | 100 | 809.02 |
| Wales | Potatoes | 3,637 | 100 | 47.6 | 173.05 | 100 | 173.05 |
| UK | Asparagus | 1,731 | 100 | 2.7 | 4.61 | 100 | 4.61 |
| UK | Baby Leaf | 2,600 | 100 | 8.5 | 22.08 | 100 | 22.08 |
| UK | Runner Beans | 3,590 | 100 | 7.8 | 28.14 | 100 | 28.14 |
| UK | Broccoli | 6,992 | 100 | 9.9 | 68.91 | 100 | 68.91 |
| UK | Brussel Sprouts | 2,548 | 100 | 16.9 | 43.17 | 100 | 43.17 |
| UK | Spring Cabbage | 1,344 | 100 | 15.3 | 20.5 | 100 | 20.5 |
| UK | Summer and Autumn Cabbage | 588 | 100 | 37.3 | 21.92 | 100 | 21.92 |
| UK | Winter Cabbage | 1,830 | 100 | 52.2 | 95.58 | 100 | 95.58 |
| UK | Carrots | 11,007 | 100 | 82.9 | 912.06 | 100 | 912.06 |
| UK | Cauliflower | 8,459 | 100 | 10.7 | 90.91 | 100 | 90.91 |
| UK | Celery | 804 | 100 | 73.7 | 59.29 | 100 | 59.29 |
| UK | Courgettes | 662 | 100 | 32.8 | 21.72 | 100 | 21.72 |
| UK | Leeks | 2,048 | 100 | 24.3 | 49.85 | 100 | 49.85 |
| UK | Lettuce | 3,898 | 100 | 26 | 101.5 | 100 | 101.5 |
| UK | Onions | 7,715 | 100 | 51.7 | 398.99 | 100 | 398.99 |
| UK | Spring Onions | 1,413 | 100 | 11.3 | 16.02 | 100 | 16.02 |
| UK | Parsnips | 2,234 | 100 | 32.3 | 72.19 | 100 | 72.19 |
| UK | Green Peas | 34,037 | 100 | 3.4 | 115.62 | 100 | 115.62 |
| UK | Rhubarb | 572 | 100 | 29.4 | 16.84 | 100 | 16.84 |
| UK | Turnips | 2,226 | 100 | 35.2 | 78.41 | 100 | 78.41 |
| UK | Watercress | 51 | 100 | 47.6 | 2.44 | 100 | 2.44 |
| UK | Other Veg | 6,693 | 100 | 21.7 | 145.55 | 100 | 145.55 |
Note: Where a food product has a different yield from the raw crop we have applied a correction labelled “Food Commodity Yield From Crop”. For sugar beet we assume a food commodity yield from the crop of 16%, this is the yield of processed sugar that comes from sugar beet. This estimate comes from the Sugar Association.
Source: Nutritional Supply of Agriculture in the United Kingdom
Fruits
Table 10: Fruit production and yield from UK agriculture, by country, 2025
| Country | Product | Area (ha) | Proportion Not Fed to Livestock | Crop Yield (t/ha) | Total Crop Yield (thousand tonnes) | Food Commodity Yield from crop (%) | Food Yield (thousand tonnes) |
|---|---|---|---|---|---|---|---|
| UK | Blackcurrants | 2,937 | 100 | 4.8 | 14.1 | 100 | 14.1 |
| UK | Blueberries | 410 | 100 | 8.6 | 3.53 | 100 | 3.53 |
| UK | Cherries | 710 | 100 | 9 | 6.39 | 100 | 6.39 |
| UK | Plums | 300 | 100 | 11 | 3.3 | 100 | 3.3 |
| UK | Other Stone Fruit | 3,376 | 100 | 20 | 67.52 | 100 | 67.52 |
| UK | Cider Apples and Pears | 5,800 | 100 | 26 | 150.8 | 100 | 150.8 |
| UK | Cooking Apples | 2,048 | 100 | 24.9 | 51.08 | 100 | 51.08 |
| UK | Desert Apples | 5,618 | 100 | 36.6 | 205.79 | 100 | 205.79 |
| UK | Desert Pears | 1,390 | 100 | 16 | 22.24 | 100 | 22.24 |
| UK | Raspberries | 1,314 | 100 | 13.3 | 17.41 | 100 | 17.41 |
| UK | Strawberries | 4,427 | 100 | 21 | 92.9 | 100 | 92.9 |
| UK | Soft Fruit (Other) | 1,079 | 100 | 5.2 | 5.57 | 100 | 5.57 |
Source: Nutritional Supply of Agriculture in the United Kingdom
Beef
Table 11: Beef production and yield from UK agriculture, 2025
| Livestock | Slaughtered Heads (thousand heads) | Meat Yield [kg/head] | Total Meat Yield (tonnes) | Percentage to Foodstuffs | Foodstuff Yield (tonnes) |
|---|---|---|---|---|---|
| Adult Bulls | 21 | 473.1 | 9,946 | 75 | 7,506 |
| Calves | 74.4 | 93.8 | 6,980 | 75 | 5,267.99 |
| Cows | 594.4 | 304.6 | 18,1061 | 75 | 136,650 |
| Heifers | 829.8 | 326 | 27,0562 | 75 | 204,198 |
| Steers | 996.3 | 361.1 | 35,9761 | 75 | 271,518 |
| Young Bulls | 185 | 358.1 | 66,237 | 75 | 49,990 |
Note: Proportion to foodstuffs is based off of AHDB Beef Yield Guide. The guide notes (page 3) dressed carcase weight as 53% of liveweight. It also notes that edible meat constitutes 40% of liveweight. Using these proportions, edible meat is estimated to be 75% of dressed carcase weight.
Source: Nutritional Supply of Agriculture in the United Kingdom
Lamb and Sheep
Table 12: Lamb and sheep production and yield from UK agriculture, 2025
| Livestock | Slaughtered Heads (thousand heads) | Meat Yield (kg/head) | Total Meat Yield (tonnes) | Percentage to Foodstuffs | Foodstuff Yield (tonnes) |
|---|---|---|---|---|---|
| Sheep and Lambs | 11,496 | 20.5 | 236,109 | 74 | 17,5338 |
| Ewes and Rams | 1,360 | 26.5 | 36,119 | 74 | 26,822 |
Note: Proportion to foodstuffs is based off of AHDB Lamb Yield Guide. The guide notes (page 3) dressed carcase weight as 70% of liveweight. It also notes that edible meat constitutes 63% of liveweight. Using these proportions, edible meat is estimated to be 89% of dressed carcase weight.
Source: Nutritional Supply of Agriculture in the United Kingdom
Pork
Table 13: Pork production and yield from UK agriculture, 2025
| Livestock | Slaughtered Heads (thousand heads) | Meat Yield (kg/head) | Total Meat Yield (tonnes) | Percentage to Foodstuffs | Foodstuff Yield (tonnes) |
|---|---|---|---|---|---|
| Clean Pigs | 10,426 | 91 | 94,7304 | 89 | 84,6240 |
| Sows and Boars | 197 | 155 | 30,761 | 89 | 27,480 |
Note: Proportion to foodstuffs is based off of AHDB Pork Yield Guide. The guide notes (page 3) dressed carcase weight as 47% of liveweight. It also notes that edible meat constitutes 35% of liveweight. Using these proportions, edible meat is estimated to be 74% of dressed carcase weight.
Source: Nutritional Supply of Agriculture in the United Kingdom
Poultry
Table 14: Poultry production and yield from UK agriculture, 2025
| Livestock | Slaughtered Heads (thousand heads) | Meat Yield (kg/head) | Total Meat Yield (tonnes) | Proportion to Foodstuffs (percent) | Foodstuff Yield (tonnes) |
|---|---|---|---|---|---|
| Broilers | 1,129,820 | 1.65 | 1,860,368 | 100 | 1,860,368 |
| Boiling Fowl | 29,895 | 1.23 | 36,712 | 100 | 36,712 |
| Turkey | 7,191 | 10.42 | 74,951 | 100 | 74,951 |
Source: Nutritional Supply of Agriculture in the United Kingdom
Note: Poultry nutritional information is reported as a kg of whole bird, so correction is not needed.
Milk and Eggs
Table 15: Milk and egg production and yield from UK agriculture, 2025
| Livestock | Milking Herd/Laying Flock (thousand head) | Milk/Eggs output (million litres / million eggs) | Proportion to Foodstuffs (percent) | Foodstuff Yield (tonnes) |
|---|---|---|---|---|
| Dairy Cows | 1,849 | 15,751 | 103 | 16,223,530 |
| Laying Hens | 42,703 | 12,739 | 0.06 | 828,086 |
Note: Assumed weight of eggs is 65g per egg based on the British Lion Egg guide assuming a mid point of all egg sizes. The density of milk is slightly higher than water so 1 litre of milk weighs 1.03kg. Further information can be found here.
Source: Nutritional Supply of Agriculture in the United Kingdom
6.2 Nutritional makeup of agricultural products
We calculated the total nutritional supply by multiplying the amount of each agricultural product by its nutritional value per kilogram.
To estimate the nutritional content of foods, we used data from McCance and Widdowson’s Composition of Foods Integrated Dataset 2021. For each product, we assumed it underwent only minimal processing before consumption. For example, we assumed that wheat is processed into wholemeal flour. The full list of products that each crop is processed into is available in the ODS as well as more complete micro-nutrients for each product.
Cereals
Table 16: Nutritional content per kilogram of cereals produced by UK Agriculture, 2025
| Product | Energy (kcal/kg) | Protein (g/kg) | Carbohydrate (g/kg) | Fibre (g/kg) | Calcium (mg/kg) | Iron (mg/kg) | Vitamin C (ug/kg) |
|---|---|---|---|---|---|---|---|
| Wheat | 3,270 | 127.5 | 684.9 | 100.6 | 320 | 27.4 | 0 |
| Winter Barley | 2,520 | 55.3 | 585.2 | 0 | 140 | 21 | 0 |
| Spring Barley | 2,520 | 55.3 | 585.2 | 0 | 140 | 21 | 0 |
| Oilseed Rape | 8,990 | 0 | 0 | 0 | 0 | 1 | 0 |
| Oats | 2,667 | 76.3 | 494.9 | 54.6 | 350 | 25.5 | 0 |
| Maize | 360 | 20 | 48 | 0 | 20 | 4.1 | 50 |
| Other Cereals | 2,817.5 | 82.5 | 592.1 | 51.9 | 270.8 | 23.7 | 0 |
Source: Nutritional Supply of Agriculture in the United Kingdom
Note: Fibre values were not estimated for many produce in McCance and Widdowson’s ‘composition of foods integrated dataset’, as such 0 values for fibre here should be treated as missing values rather than 0 values.
Vegetables
Table 17: Nutritional content per kilogram of vegetables produced by UK Agriculture, 2025
| Product | Energy (kcal/kg) | Protein (g/kg) | Carbohydrate (g/kg) | Fibre (g/kg) | Calcium (mg/kg) | Iron (mg/kg) | Vitamin C (ug/kg) |
|---|---|---|---|---|---|---|---|
| Beans | 135.7 | 13.11 | 16.56 | 0 | 52.9 | 2.1 | 73.6 |
| Potatoes | 612 | 14.28 | 146.16 | 15.04 | 52.4 | 2.3 | 100.8 |
| Sugar Beet | 3,940 | 0 | 1,050 | 0 | 100 | 2 | 0 |
| Asparagus | 187.5 | 21.75 | 15 | 0 | 202.5 | 5.3 | 90 |
| Baby Leaf | 160 | 26 | 2 | 10 | 1,190 | 18.9 | 290 |
| Runner Beans | 189.2 | 13.76 | 27.52 | 0 | 283.8 | 10.3 | 154.8 |
| Broccoli | 190.4 | 24.08 | 17.92 | 22.4 | 268.8 | 5.9 | 442.4 |
| Brussel Sprouts | 289.8 | 24.15 | 28.29 | 0 | 179.4 | 4.8 | 793.5 |
| Spring Cabbage | 234.9 | 20.88 | 35.67 | 35.67 | 487.2 | 4.5 | 417.6 |
| Summer and Autumn Cabbage | 191.1 | 10.01 | 33.67 | 26.39 | 546 | 3.6 | 500.5 |
| Winter Cabbage | 191.1 | 10.01 | 33.67 | 26.39 | 546 | 3.6 | 500.5 |
| Carrots | 241.4 | 3.55 | 54.67 | 27.69 | 184.6 | 1.6 | 14.2 |
| Cauliflower | 159 | 13.25 | 23.32 | 9.54 | 90.1 | 2.2 | 296.8 |
| Celery | 21.6 | 1.2 | 3.36 | 3.6 | 98.4 | 0.144 | 2.4 |
| Courgettes | 147.2 | 11.96 | 21.16 | 4.6 | 248.4 | 3.9 | 46 |
| Leeks | 151.8 | 9.9 | 27.06 | 18.48 | 343.2 | 2.8 | 20.5 |
| Lettuce | 90.2 | 9.84 | 11.5 | 12.3 | 196.8 | 1.07 | 8.2 |
| Onions | 350 | 10 | 80 | 22 | 300 | 3 | 30 |
| Spring Onions | 158.7 | 13.8 | 20.7 | 0 | 269.1 | 13.1 | 179.4 |
| Parsnips | 460.8 | 13 | 90 | 33.8 | 295.2 | 4.3 | 122.4 |
| Green Peas | 251.6 | 19.61 | 39.59 | 19.61 | 133.2 | 6.5 | 81.4 |
| Rhubarb | 60.9 | 7.83 | 6.96 | 0 | 809.1 | 2.6 | 52.2 |
| Turnips | 173.9 | 5.9 | 35.9 | 0 | 373.45 | 1.12 | 176.9 |
| Watercress | 720 | 40 | 52 | 66 | 1,620 | 12.1 | 650 |
| Other Veg | 310.7 | 16.4 | 54.5 | 19.3 | 441.4 | 5.7 | 198.4 |
Source: Nutritional Supply of Agriculture in the United Kingdom
Note: Fibre values were not estimated for many produce in McCance and Widdowson’s ‘composition of foods integrated dataset’, as such 0 values for fibre here should be treated as missing values rather than 0 values.
Fruits
Table 18: Nutritional content per kilogram of fruit produced by UK Agriculture, 2025
| Product | Energy (kcal/kg) | Protein (g/kg) | Carbohydrate (g/kg) | Fibre (g/kg) | Calcium (mg/kg) | Iron (mg/kg) | Vitamin C (ug/kg) |
|---|---|---|---|---|---|---|---|
| Blackcurrants | 274.4 | 8.82 | 64.68 | 0 | 588 | 12.74 | 1,960 |
| Blueberry | 400 | 9 | 91 | 15 | 100 | 5.5 | 60 |
| Cherries | 533.6 | 10.12 | 123.28 | 15.64 | 101.2 | 2.116 | 27.6 |
| Cider Apples & Pears | 255.8 | 2.01 | 62.83 | 14.15 | 36.45 | 0.77 | 49.25 |
| Cooking Apples | 197.1 | 1.46 | 47.45 | 8.76 | 21.9 | 0.51 | 73 |
| Dessert Apples | 374.1 | 4.35 | 87 | 8.7 | 43.5 | 0.67 | 43.5 |
| Dessert Pears | 314.5 | 2.55 | 78.2 | 19.55 | 51 | 1.02 | 25.5 |
| Other Stone Fruit | 404.55 | 7.44 | 94.42 | 7.82 | 98.1 | 2.53 | 28.05 |
| Other Soft Fruit | 301.6 | 7.87 | 66.01 | 21.93 | 251.95 | 6.17 | 686.45 |
| Plums | 275.5 | 4.75 | 65.55 | 0 | 95 | 2.95 | 28.5 |
| Raspberries | 250 | 8 | 51 | 37 | 160 | 4.1 | 190 |
| Strawberries | 282 | 5.64 | 57.34 | 35.72 | 159.8 | 2.35 | 535.8 |
Source: Nutritional Supply of Agriculture in the United Kingdom
Note: Fibre values were not estimated for many produce in McCance and Widdowson’s ‘composition of foods integrated dataset’, as such 0 values for fibre here should be treated as missing values rather than 0 values.
Livestock Products
Table 19: Nutritional content per kilogram of livestock products produced by UK Agriculture, 2025
| Product category | Product | Energy (kcal/kg) | Protein (g/kg) | Carbohydrate (g/kg) | Fibre (g/kg) | Calcium (mg/kg) | Iron (mg/kg) | Vitamin C (mg/kg) |
| — | — | — | — | — | — | — | — | — |
| Beef | Calves | 1,770 | 211 | 0 | 0 | 70 | 20.5 | 0 |
| Beef | Heifers | 1,770 | 211 | 0 | 0 | 70 | 20.5 | 0 |
| Beef | Steers | 1,770 | 211 | 0 | 0 | 70 | 20.5 | 0 |
| Beef | Young Bulls | 1,770 | 211 | 0 | 0 | 70 | 20.5 | 0 |
| Beef | Cows | 1,770 | 211 | 0 | 0 | 70 | 20.5 | 0 |
| Beef | Adult Bulls | 1,125 | 98.5 | 0 | 0 | 45 | 7 | 0 |
| Lamb | Sheep and Lambs | 1,915 | 190.5 | 0 | 0 | 120 | 15 | 0 |
| Lamb | Ewes and Rams | 1,915 | 190.5 | 0 | 0 | 120 | 15 | 0 |
| Pork | Clean Pigs | 1,400 | 207 | 0 | 0 | 65 | 8.25 | 0 |
| Pork | Sows and Boars | 1,400 | 207 | 0 | 0 | 65 | 8.25 | 0 |
| Poultry | Broilers | 1,310 | 124 | 0 | 0 | 40 | 4 | 0 |
| Poultry | Boiling Fowl | 1,310 | 124 | 0 | 0 | 40 | 4 | 0 |
| Poultry | Turkey | 930 | 151 | 0 | 0 | 40 | 4 | 0 |
| Milk | Dairy Cows | 630 | 34 | 46 | 0 | 1200 | 0.2 | 20 |
| Eggs | Laying Hens | 1,310 | 126 | 0 | 0 | 460 | 17.2 | 0 |
Source: Nutritional Supply of Agriculture in the United Kingdom
6.3 Nutritional requirements of population
We compared the total nutritional supply with the estimated nutritional needs of the population to assess whether available food production could meet demand nutritional demand. Nutritional requirements were based on guidance from Public Health England’s Government Dietary Recommendations. These requirements were applied to the population using ONS population estimates [link] and demographic breakdowns [link]. We are using a population estimate of 69,483,939 people based on the mid 2025 data.
Nutritional needs vary by age, sex and activity level. For this analysis, we accounted for differences in age and assumed a 50:50 sex ratio and a standard activity level across the population. We are making no assumptions about dietary requirements due to allergies or dietary preferences here. Actual personal dietary need is likely to be significantly different from the below, we have where possible adjusted need for age and gender and then averaged over the population in accordance with their representation in demographics. We have not assessed UK agricultural output against the ability to meet dietary recommendations of a healthy and sustainable diet, only whether it can meet the raw nutritional needs of the population. A diet made only of current agricultural output may fall short of dietary recommendations.
Table 20 shows the nutritional requirements used for each age group and their relative share of the population. A full breakdown of all nutrients is found in the ODS.
Table 20: Nutritional requirements of UK population by age group, 2025
| Age Group | No. of people | Energy (kcal/day) | Protein (g/day) | Carbohydrate (g/day) | Fibre (g/day) | Iron (mg/day) | Calcium (mg/day) | Vitamin C (mg/day) |
| — | — | — | — | — | — | — | — | — |
| 0 to 4 | 3,492,750 | 1065.75 | 15.8 | 117.5 | 11.25 | 6.7 | 375 | 30 |
| 5 to 9 | 3,871,615 | 1,628 | 24.86 | 217.1 | 20 | 7.66 | 510 | 30 |
| 10 to 14 | 4,130,441 | 2,127.5 | 38.31 | 283.6 | 23.75 | 11.9 | 812.5 | 34 |
| 15 to 19 | 4,109,107 | 2,250 | 50.13 | 300 | 30 | 12.79 | 860 | 40 |
| 20 to 24 | 4,163,826 | 2,250 | 50.25 | 300 | 30 | 11.75 | 700 | 40 |
| 25 to 29 | 4,528,876 | 2,250 | 50.25 | 300 | 30 | 11.75 | 700 | 40 |
| 30 to 34 | 4,755,440 | 2,250 | 50.25 | 300 | 30 | 11.75 | 700 | 40 |
| 35 to 39 | 4,834,534 | 2,250 | 50.25 | 300 | 30 | 11.75 | 700 | 40 |
| 40 to 44 | 4,586,953 | 2,250 | 50.25 | 300 | 30 | 11.75 | 700 | 40 |
| 45 to 49 | 4,194,817 | 2,250 | 50.25 | 300 | 30 | 11.75 | 700 | 40 |
| 50 to 54 | 4,344,690 | 2,250 | 50.25 | 300 | 30 | 8.7 | 700 | 40 |
| 55 to 59 | 4,598,784 | 2,250 | 50.25 | 300 | 30 | 8.7 | 700 | 40 |
| 60 to 64 | 4,411,402 | 2,250 | 50.25 | 300 | 30 | 8.7 | 700 | 40 |
| 65 to 69 | 3,694,329 | 2,127 | 49.9 | 283.5 | 30 | 8.7 | 700 | 40 |
| 70 to 74 | 3,104,334 | 2,127 | 49.9 | 283.5 | 30 | 8.7 | 700 | 40 |
| 75 to 79 | 2,952,058 | 2,067 | 49.9 | 275.5 | 30 | 8.7 | 700 | 40 |
| 80 to 84 | 1,919,116 | 2,067 | 49.9 | 275.5 | 30 | 8.7 | 700 | 40 |
| 85 to 89 | 1,145,524 | 2,067 | 49.9 | 275.5 | 30 | 8.7 | 700 | 40 |
| 90 and over | 645,343 | 2,067 | 49.9 | 275.5 | 30 | 8.7 | 700 | 40 |
Source: Nutritional Supply of Agriculture in the United Kingdom
To estimate the average amount of nutrients available per person each day, we divided the total nutritional supply in the country by the population and then by 365 days. We then compared these daily per-person values with the recommended nutritional requirements shown in Table 21.
Table 21: Nutritional requirements of UK population per capita, 2025
| Energy (kcal/day) | Protein (g/day) | Carbohydrate (g/day) | Fibre (g/day) | Iron (mg/day) | Calcium (mg/day) | Vitamin C (mg/day) |
|---|---|---|---|---|---|---|
| 2,119 | 46.3 | 281.3 | 28.1 | 10.2 | 689.2 | 38.6 |
Source: Nutritional Supply of Agriculture in the United Kingdom
7. Caveats and Limitations
-
Data analysis has undergone thorough quality assurance and checks but significant uncertainty remains due to complexities in the data. Availability of output or product data across the UK is limited, and there is complexity arising from different reporting methodologies. Some data is only available at aggregate UK level meaning cross border movement of output further increases complexity and risks of double counting. We account for this as best as possible but further improvements are required.
-
This nutritional supply does not represent the dietary choices of the population of the United Kingdom, only available nutrition at the point of supply with minimal processing.
-
The United Kingdom imports a significant amount of produce to feed livestock. This is difficult to estimate, but if this were not available it would reduce the overall nutrient availability.
-
This assumes current farming practices and inputs. A large amount of fertiliser and other inputs are imported.
-
The food and drink sector processes food and drink beyond the raw or minimal agricultural product which often results in the loss of nutrients. For example, processing (especially involving heat) of fruit and vegetables can reduce the content of some vitamins, and conversion to alcohol (e.g. of barley) can also change the nutrient content. This does not represent a food security issue but is reflective of current market demand.
-
Even the minimal processing assumed here will cause the loss of nutrients. For example, there are additional nutrients in a carcase for which our current methodology cannot account (even with minimal processing). This nutrition often ends up in other products for example in pet food.
-
These estimates are based on current agricultural production patterns. Changes in farming practices, market demand, weather conditions and other factors may affect the nutritional supply produced by UK agriculture in future years.
-
Bioavailability of nutrients is extremely variable, dependent on dietary and physiological factors. It has not been possible to adjust for bioavailability as the source data cannot do this for many nutrients as such there is a possible over estimation when it comes to overall nutrient supply.
8. Future Improvements
As a statistic in development, we plan to improve the analysis over time. The major improvements we plan to undertake are:
-
Better country level estimations of the allocation of produce. This will allow us to attribute more nutrients to individual nations within the UK and potentially enable country specific estimations. We will attempt to further develop livestock estimations to account for cross border movements of livestock for slaughter and other complexities.
-
Imported feed nutrients and allocation through livestock. We will attempt to estimate the impact of imported feed on our nutritional supply by improving estimates of nutrients that are being imported through livestock feed, and what needs to be provided to livestock from domestic crops if this was unavailable.
-
Addition of nutrients lost through the supply chain. We will continue reporting on nutrients available from agriculture but add in further details on what then gets lost through further processing, including, where data is available: more complete end food products, processes involving heat such as canning (rather than freezing), malting and conversion to alcohol (e.g. of barley), and processing of livestock carcasses.
-
We will investigate how the outputs of UK agriculture can meet the recommendations for a healthy and sustainable diet as set out in the Eatwell guide by apportioning produce to food groups and assessing overall output in accordance with those recommendations.