Local authority revenue expenditure and financing England: 2025 to 2026 – first release
Published 17 September 2026
Applies to England

© Crown copyright 2026
This publication is licensed under the terms of the Open Government Licence v3.0 except where otherwise stated. To view this licence, visit nationalarchives.gov.uk/doc/open-government-licence/version/3 or write to the Information Policy Team, The National Archives, Kew, London TW9 4DU, or email: psi@nationalarchives.gov.uk.
Where we have identified any third party copyright information you will need to obtain permission from the copyright holders concerned.
This publication is available at https://www.gov.uk/government/statistics/local-authority-revenue-expenditure-and-financing-england-2025-to-2026-first-release/local-authority-revenue-expenditure-and-financing-england-2025-to-2026-first-release
1. Key statistics
Net current expenditure on services
-
Local authorities’ total net current service expenditure was £144.4 billion in 2025-26. In real terms, this was £5.6 billion (4.0%) higher than in 2024-25.
-
Total Service Expenditure excluding education totalled £95.0 billion in 2025-26. This was £2.1 billion (2.2%) higher in real terms compared to 2024-25.
-
The categories of services with the largest changes in net current expenditure compared to 2024-25 were:
- Education services: increased by £3.5 billion (+7.6%) in real terms to £49.4 billion.
- Adult Social Care: increased by £1.3 billion (+4.9%) in real terms to £27.4 billion.
- Children’s Social Care: increased by £759 million (+4.7%) in real terms to £16.9 billion.
- Housing services (excluding Housing Revenue Account): increased by £208 million (+6.3%) in real terms to £3.5 billion.
Revenue Expenditure
- The broader measure of local authority Revenue Expenditure totalled £144.1 billion across all local authorities in England in 2025-26. In real terms, this is 3.0% higher than in 2024-25.
Revenue Account Reserves
- Revenue Account non-ringfenced reserves are estimated to have totalled £31.1 billion at 31 March 2026. This is higher than £30.2 billion at 1 April 2025.
Release date: 17 September 2026
Date of next release: December 2026
Responsible Statistician: Tom Crowther
Contact: lgf1.revenue@communities.gov.uk
Media enquiries: NewsDesk@communities.gov.uk
2. Introduction
Local authorities are responsible for delivering a wide range of public services, with local government expenditure accounting for just under a fifth of all government spending. The majority of this is shown in local authorities’ revenue accounts.
This statistical release, and all its associated tables, present the first release of the outturn data on the Revenue Expenditure of local authorities in England for the financial year 2025-26. These are based on data from 377 (91.3%) of 413 local authorities in England in 2025-26 and use estimation to provide totals for England and for classes of local authority.
All the data in the release are compiled from the Revenue Outturn (RO) returns submitted by local authorities in England to the Ministry of Housing, Communities and Local Government. Definitions of terms used in this release can be found in the accompanying technical notes document. The forms and guidance notes for this data collection can be found in the forms section of our website.
This year we have made several changes to this release, including the addition of new sections, the removal of tables (available still as downloadable files) and the addition of charts. Please share any feedback with us at: lgf1.revenue@communities.gov.uk
Key contextual information
Functions and responsibilities of local government can change from year to year, so comparisons between financial years may potentially not be wholly valid. Where major changes occur, these are noted.
Figures in this report, and the associated tables and reports, are shown as net current expenditure. So, for example, a decrease may be driven by a decrease in expenditure or by an increase in fees or other income relating to that category of services, and conversely.
Imputation for missing returns
As at the cut-off for inclusion in this publication, 36 of 413 eligible local authorities had not yet provided valid data. England totals have been estimated by also drawing: i) on grant allocation data, where this was known, and ii) for other data items, on their proportions within the most recent previous outturn data.
The full data submitted by local authorities, including financing and reserves items, can be found by following the link to the ‘2025 to 2026 individual local authority - outturn’ data tables.
New data items in 2025-26
This year a new column was added to the data collection, to better record the costs of management and support services distributed to frontline services. Management and support services are defined as the administrative and operational functions that support the delivery of the various services provided by each local authority. They enable, govern, coordinate, or assure the delivery of services, rather than directly delivering service outcomes themselves. A number of authorities have changed their approach following this change.
A memorandum item has been added to record non management and support service recharges. For further details on this change please see the technical note for this publication.
The following changes were also made:
- RO3 substance misuse lines were consolidated into individual categories for prevention and treatment.
- RO3 lines were added to break down other income received from the NHS for provision of Adult Social Care.
- RO4 Housing Revenue Account (HRA) depreciation was split from other debt repayment or non-interest charges to the HRA.
- RSM debt cost table introduced in 2024-25 was made mandatory for 2025-26.
- The list of named grants in the RG tab has been updated.
3. Local authority expenditure
Most local authority expenditure is on the provision of services. The Revenue Outturn data records current expenditure across 13 service categories, which make up Total Service Expenditure. A full breakdown can be found in the RSX, Revenue Expenditure Summary Table of the accompanying tables.
Revenue Expenditure also accounts for any costs, notably those which do not fall wholly within the financial year, but which are charged to the year’s account. Most of these costs relate to repayment and management of debt, financing capital and grants that authorities receive on behalf of a third party.
Net service expenditure figures presented are calculated after taking account of income from sales, fees and charges, reimbursements, and income from other organisations, excluding grants received from government departments, agencies and non-departmental public bodies (NDPBs).
Figure 1: Revenue expenditure and total service expenditure including and excluding education, 2021-22 to 2025-26 (real terms)
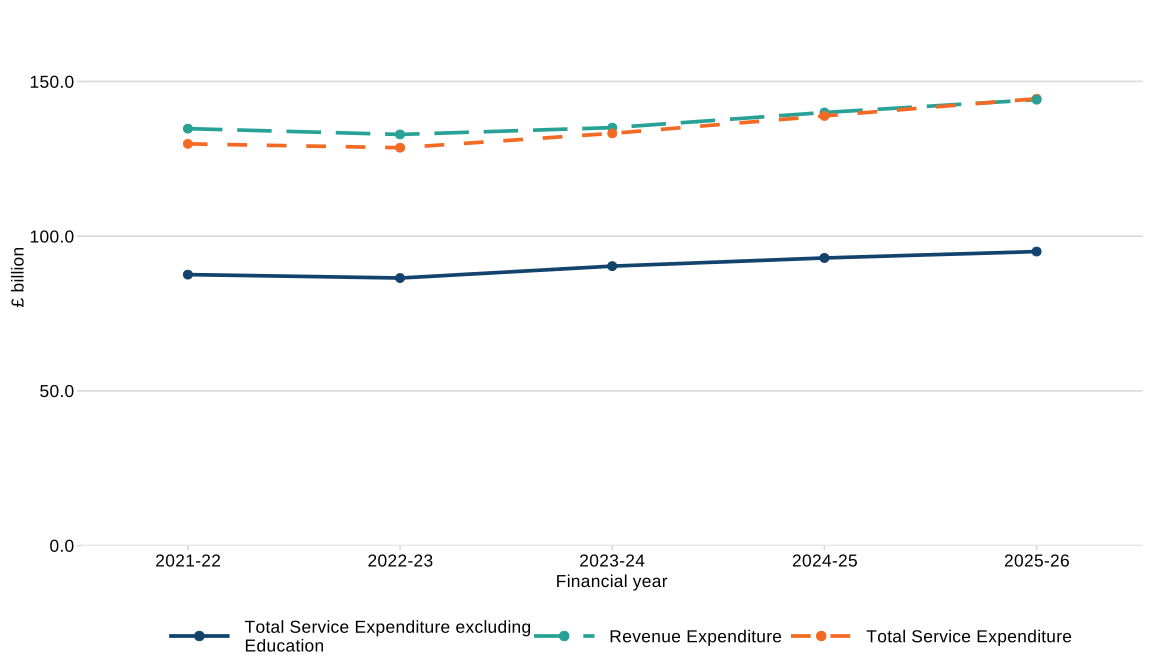
Figure 1 shows the change in total service expenditure, including and excluding education[footnote 1] and Revenue Expenditure between 2021-22 and 2025-26, figures are in real terms. The data used in this chart can be found in Table 1 of the accompanying tables.
In 2025-26, total service expenditure increased to £144.4 billion, reflecting an increase of £5.6 billion (4.0%) and total service expenditure excluding education increased to £95.0 billion, an increase of £2.1 billion (2.2%).
Revenue expenditure increased to £144.1 billion, reflecting an increase of £4.1 billion (3.0%) in 2025-26.
Figure 2: Net service expenditure of largest components by service category, 2024-25 and 2025-26 (real terms)
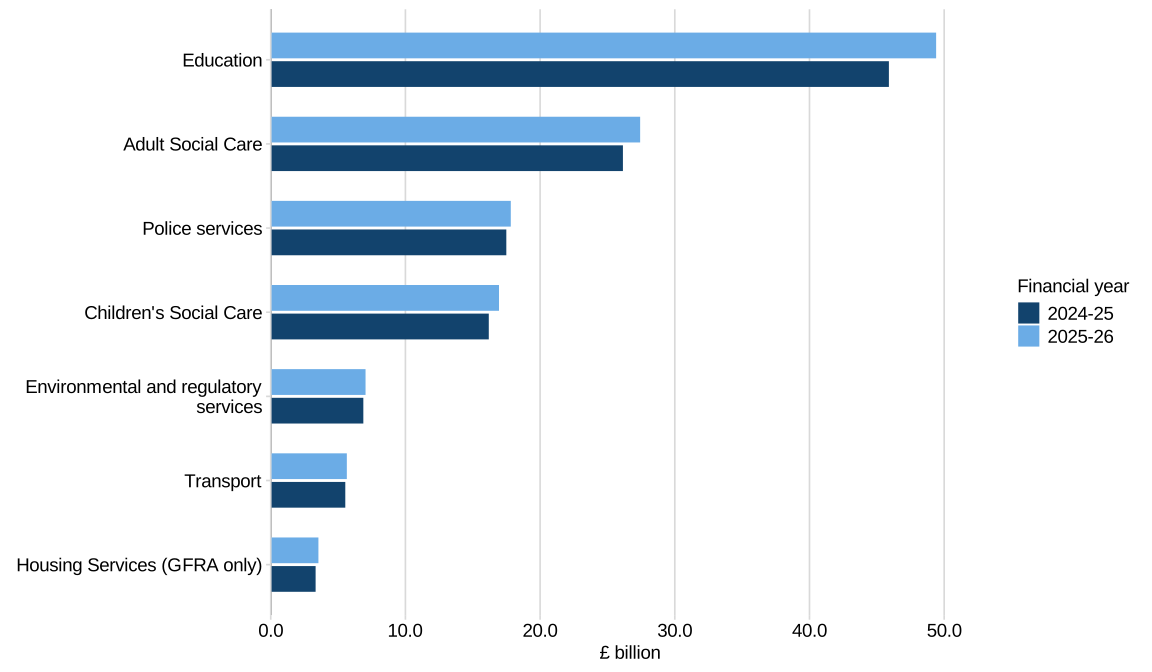
Figure 2 shows the net service expenditure of the largest components by service category. The 2024-25 data used in this chart can be found in the RSX, Revenue Expenditure Summary Table of the 2024-25 publication’s accompanying tables. Similarly, the data for 2025-26 can be found in the respective RSX, Revenue Expenditure Summary Table in the accompanying tables.
Compared with 2024-25:
- Education expenditure increased by £3.5 billion (7.6%) to £49.4 billion.
- Adult Social Care expenditure increased by £1.3 billion (4.9%) to £27.4 billion.
- Police services increased by £332 million (1.9%) to £17.8 billion.
- Children’s Social Care increased by £759 million (4.7%) to £16.9 billion.
- Environmental and regulatory services increased by £165 million (2.4%) to £7.0 billion.
- Transport services increased by £115 million (2.1%) to £5.7 billion.
- Housing services (general fund only) increased by £208 million (6.3%) to £3.5 billion.
3.1 Gross expenditure
Gross expenditure is the total amount spent by local authorities on providing services before taking account of any income received from sales, fees, charges or other income such as that from public bodies or other local authorities. The following section looks at how gross expenditure and income was distributed across different service areas in 2025-26.
Figure 3: Expenditure and income breakdown by service area, 2025-26
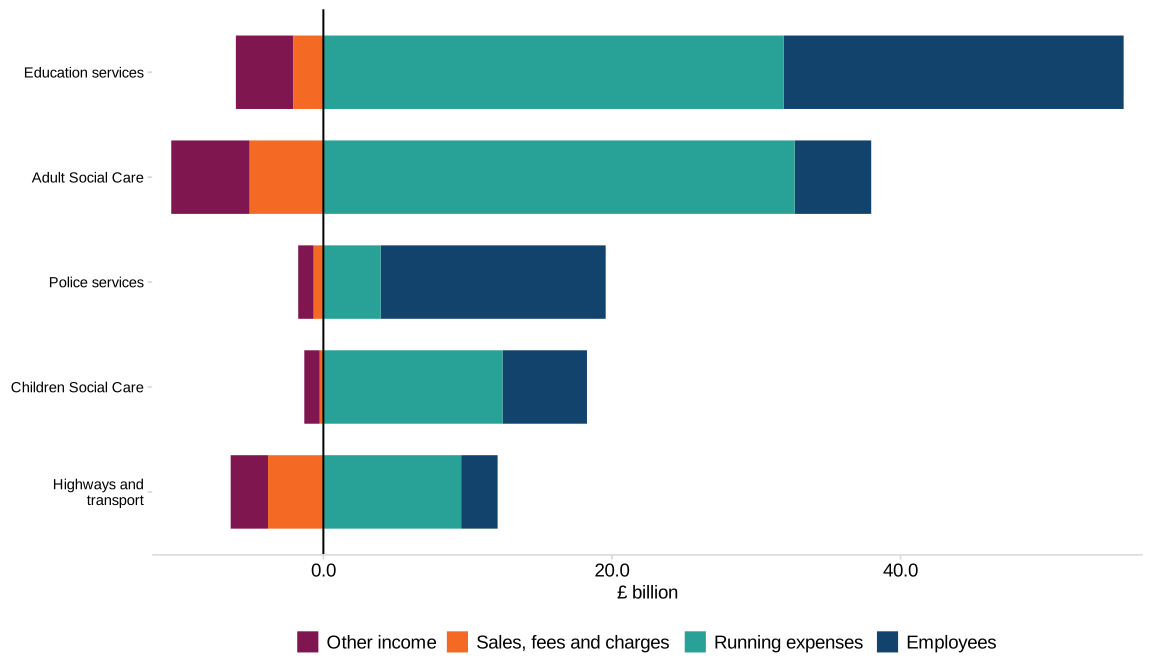
Figure 3 shows the expenditure and income breakdown for five of the largest frontline service areas by net current expenditure. The data used in this chart can be found in RSX, Revenue Expenditure Summary Table of the accompanying tables.
Running expenses accounted for the majority of expenditure in Adult Social Care, representing 86.0% (£32.7 billion) of Adult Social Care total expenditure, while employee costs accounted for the largest share of expenditure in Police Services, making up 79.7% (£15.6 billion) of Police Service total expenditure.
The figures in this document (except for in this section) are net of sales, fees and charges, and net of other service-specific income (but not net of grants from Central Government). Other Income includes, for example, significant funding for Adult Social Care from the NHS such as via Better Care Fund pooled budgets.
To reflect the full extent of public expenditure on Adult Social Care, it is necessary to consider funding from the NHS in addition to net current expenditure by local authorities.
DHSC’s Adult Social Care Finance Report, published later this year, shows net current expenditure as reported in its Adult Social Care Financial Returns from local authority social service departments, as well as planned Better Care Fund (BCF) expenditure on adult social care for 2025-26. This should be added to local authorities’ net current expenditure on adult social care to give the best estimate of total government net current expenditure on adult social care. The majority of these funds are transferred to local authorities. Correspondingly, these are recorded as ‘other income’ in the returns to MHCLG. They are therefore reflected within total (i.e. gross) expenditure, but not within net current expenditure. The remainder of the Better Care Fund planned expenditure is for social care activities delivered by other providers.
3.2 Education
Education covers services that support children and young people, including early years provision, special schools and alternative provision, school improvement, and other education-related services provided by local authorities.
In 2025-26, net current expenditure on Education was £49.4 billion, an increase of 7.6% from 2024-25, and accounted for 34.2% of total local authority service expenditure in England.
Figure 4: Change in net education expenditure by service area, 2024-25 to 2025-26 (real terms)
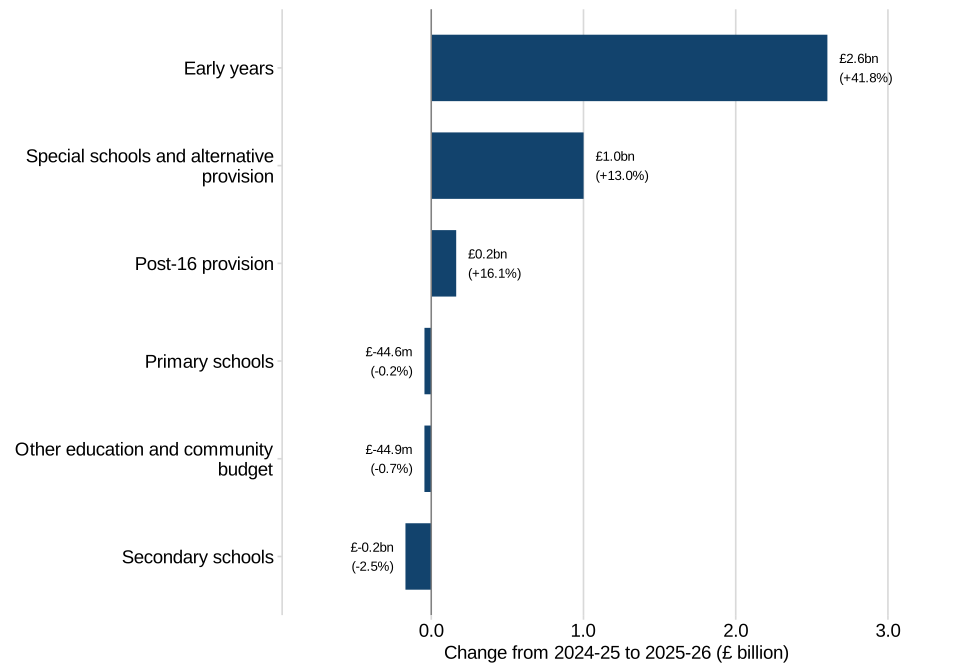
Figure 4 shows the change in net education expenditure between 2024-25 and 2025-26. The 2024-25 data used in this chart can be found in RO1, Education Services of the accompanying tables. Similarly, the data for 2025-26 can be found in the respective RO1, Education Services in the accompanying tables.
The increase in education expenditure is primarily driven by early years (+£2.6 billion, 41.8%) as a result of the continued roll out of free childcare provision. The increase in special schools and alternative provision (+£1.0 billion, 13.0%) reflects increasing pressures from special educational needs and disability (SEND) provision.
3.2 Adult Social Care
Adult Social Care[footnote 2] covers services that support adults (aged 18 to 64) and older people (aged 65 and over) who have care and support needs. This includes physical support services that help people live independently, mental health support and learning disability support.
In 2025-26, net current expenditure on Adult Social Care was £27.4 billion. This was an increase of £1.3 billion (4.9%) from 2024-25, and accounted for 19.0% of total local authority service expenditure in England. The increase was driven by higher spending on learning disability support for adults aged 18 to 64 and physical support for people aged 65 and over.
Figure 5: Change in net Adult Social Care expenditure by service areas with largest change, 2024-25 to 2025-26 (real terms)
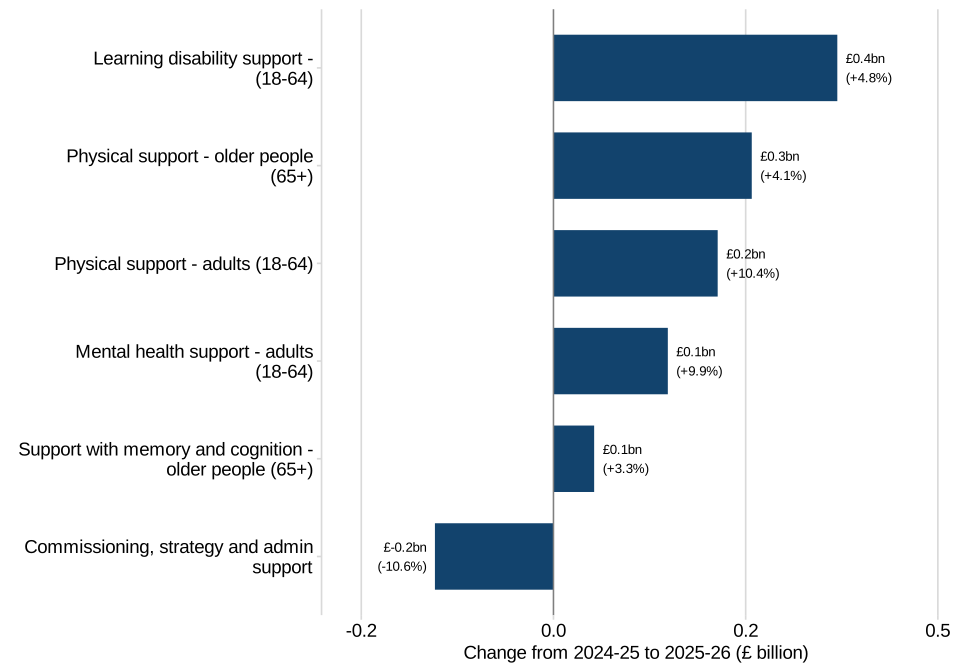
Figure 5 shows the largest changes in net current expenditure on the largest Adult Social Care service areas by expenditure in 2025-26. The data used in this chart can be found in RO3, Social Care and Public Health of the accompanying tables. Similarly, the data for 2024-25 can be found in the respective RO3, Social Care and Public Health in the accompanying tables.
3.3 Children’s Social Care
Children’s Social Care covers services that support vulnerable children and young people, including looked after children, safeguarding, family support and services for care leavers.
In 2025-26, net current expenditure on Children’s Social Care increased by £759 million (4.7%) from 2024-25 and accounts for 11.7% of total local authority service expenditure in England.
In 2025-26, children looked after represented the largest area of Children’s Social Care expenditure, accounting for £9.5 billion (56.2%) of total net current expenditure. Safeguarding children and young people’s services was the second largest area of expenditure, accounting for a £3.6 billion (21.1%) of the total.
Figure 6: Change in net Children’s Social Care expenditure by service areas with largest change, 2024-25 and 2025-26 (real terms)
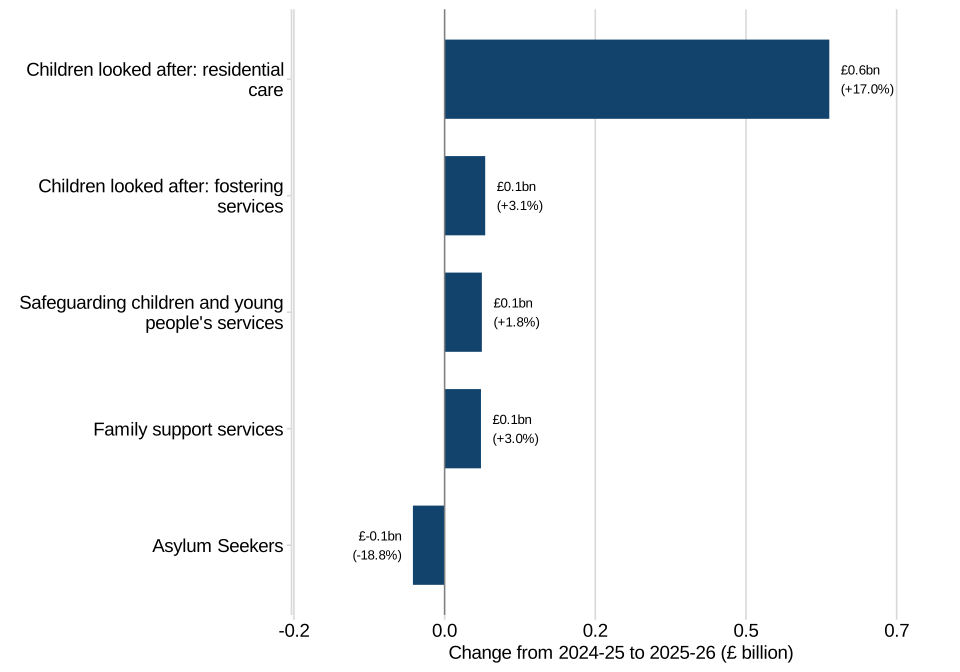
Figure 6 shows the change in net current expenditure on the largest Children’s Social Care service areas by expenditure in 2024-25 to 2025-26. Figures are in real terms. The 2025-26 data used in this chart can be found in RO3, Social Care and Public Health of the accompanying tables. Similarly, the data for 2024-25 can be found in the respective RO3, Social Care and Public Health in the accompanying tables.
The largest change in Children’s Social Care was for children looked after: residential services, (+£638 million, 17.0%). This is in line with an increase in the number of residential places in the sector.
3.4 Housing and homelessness
Housing Services cover a range of activities that help people access and maintain suitable accommodation. This includes support for people who are homeless or at risk of homelessness, the provision of temporary accommodation and administration services provided by local authorities.
In 2025-26, net current expenditure on Housing Services (excluding the Housing Revenue Account) was £3.5 billion. This was an increase of £208 million compared with 2024-25 and accounted for 2.5% of total local authority service expenditure in England.
In 2025-26, homelessness represented the largest area of Housing Services, accounting for £2.3 billion (66.2% of total housing net expenditure). Gross expenditure on homelessness (i.e. before income such as housing benefit and other contributions are accounted for) was £4.0 billion (69% of total housing gross expenditure).
Figure 7: Net current expenditure on homelessness by top five largest service areas, 2024-25 and 2025-26 (real terms)
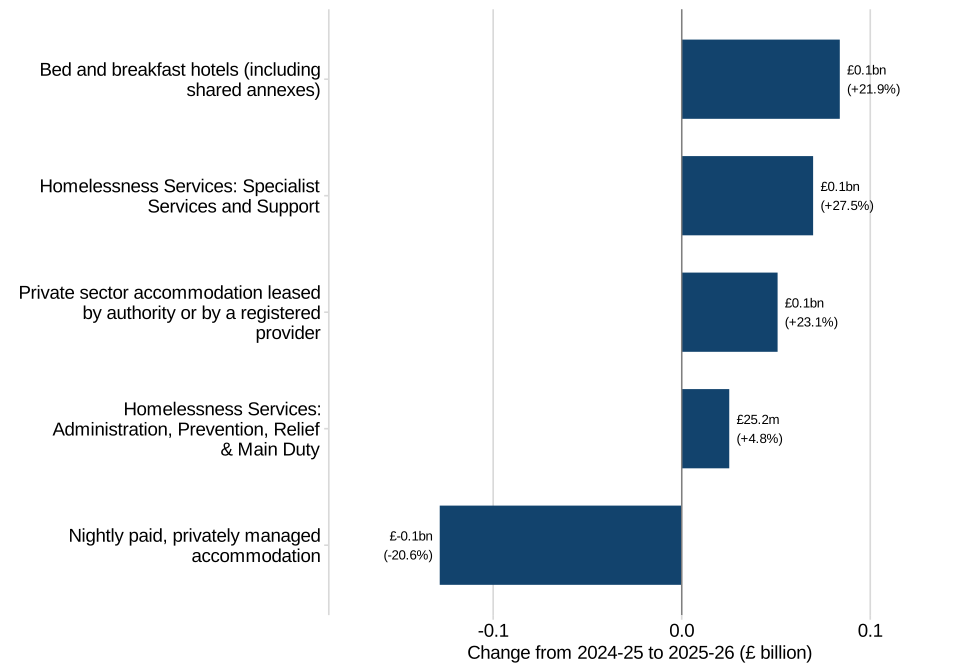
Figure 7 shows the change in net current expenditure on Housing Services in 2024-25 and 2025-26 in real terms by largest expenditure. The 2025-26 data used in this chart can be found in RO4, Housing Services of the accompanying tables. Similarly, the data for 2024-25 can be found in the respective RO4, Housing Services in the accompanying tables.
There have been large changes within the sub-categories of temporary accommodation expenditure. This reflects changes in local authority reporting [footnote 3].
4. Financing and reserves
This section outlines the main sources of funding available to local authorities to finance their expenditure. The net current expenditure figures presented earlier in this release already take account of income from sales, fees and charges, reimbursements, and income from other organisations, excluding grants received from government departments, agencies and non-departmental public bodies (NDPBs).
The remaining expenditure is financed predominantly through a combination of government grants, locally retained business rates, Council Tax, and the use of reserves.
4.1 Financing
Figure 8: Financing of Revenue Expenditure, 2021-22 to 2025-26
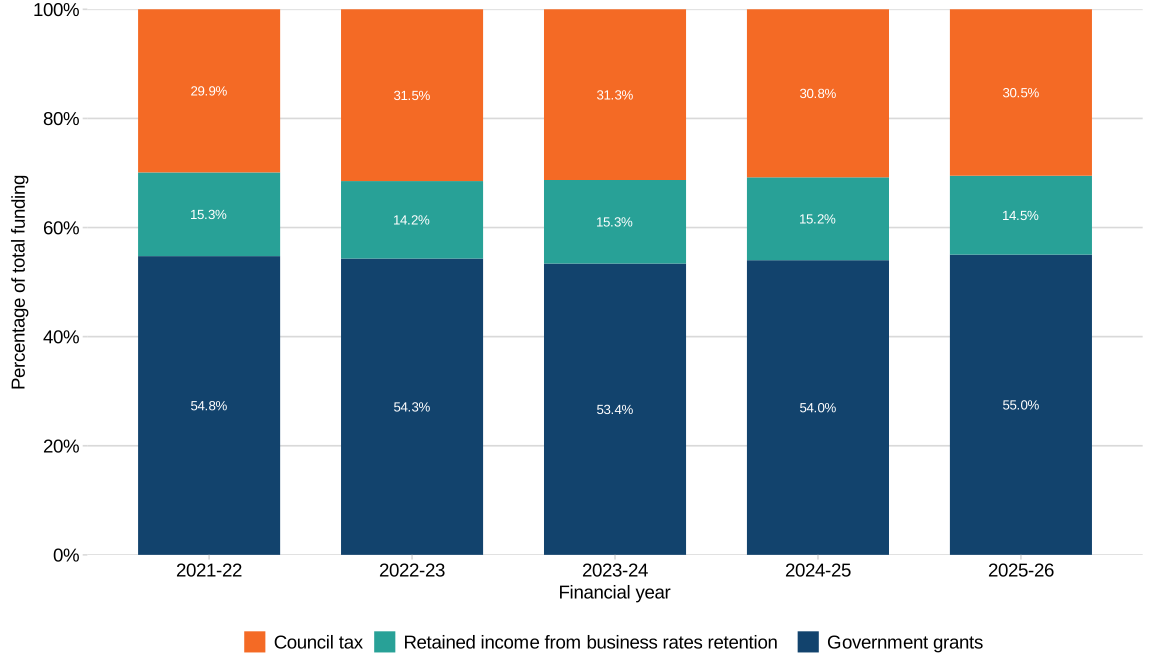
Figure 8 shows the main sources of Revenue Expenditure financing from 2021-22 to 2025-26 excluding use of reserves and council tax collection fund surplus and other items. The data used in this chart can be found in Table 5 of the accompanying tables.
Figure 9: Change in main sources of financing, 2024-25 to 2025-26, (real terms)
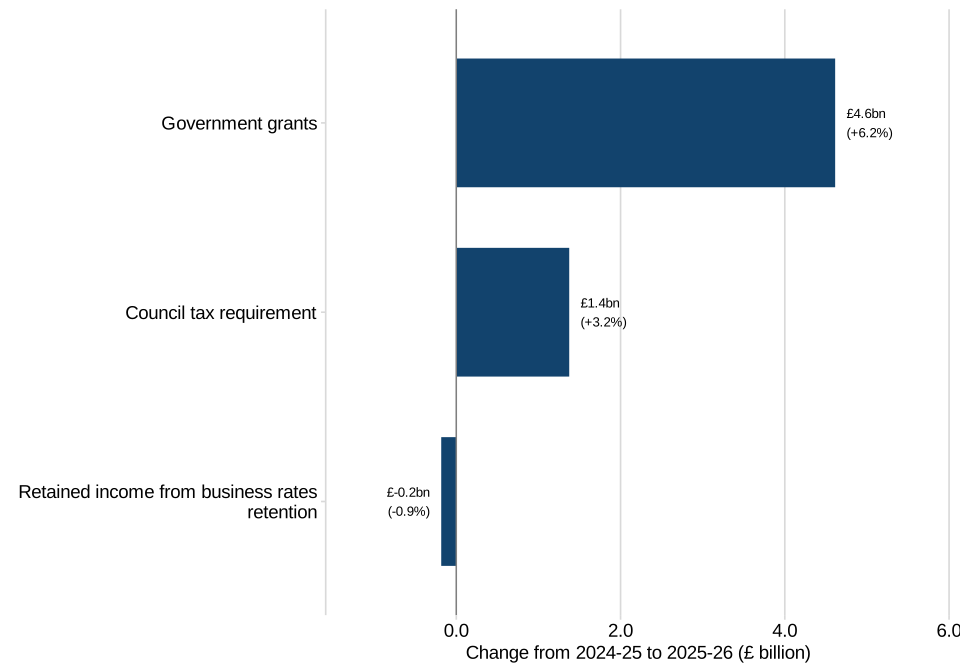
Figure 9 shows the change in some of the main sources of Revenue Expenditure financing in 2024-25 to 2025-26, other sources of local authority funding include use of reserves and other grants. The data used in this chart can be found in Table 4 of the accompanying tables.
4.2 Reserves
Figure 10: Appropriations to (+)/from (-) revenue reserves, 2024-25 and 2025-26 (real terms)
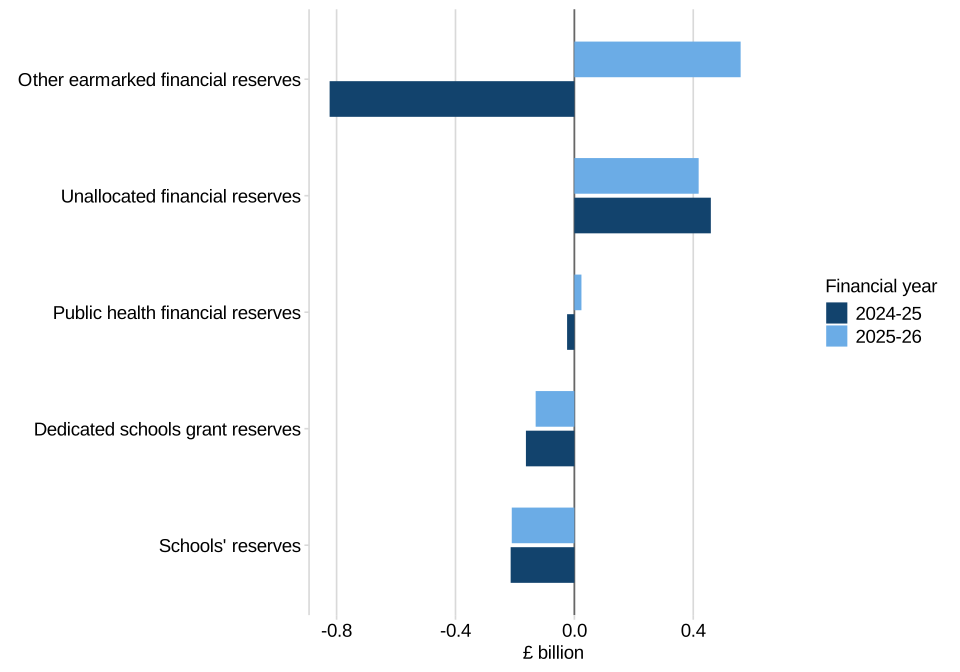
Figure 10 shows the net use of appropriations to/from revenue reserves and the breakdown of the specific reserves as a source of authority funding in 2024-25 and 2025-26 in real terms. The data used in this chart can be found in Table 4 of the accompanying tables.
Local authorities made a net contribution of £660.4 million into revenue reserves in 2025-26 compared to a net use of £766.3 million from reserves in 2024-25. This is driven by contributions to other earmarked reserves for ‘planned future revenue and capital spending’ and ‘specific risks’.
Reserves are funds that local authorities have built up over time and can draw on to support services, manage financial risks or fund future spending commitments. Earmarked reserves are reserves that can be held for specific purposes and unallocated reserves are reserves that can be used as general funding to help manage unexpected costs or financial pressures.
Figure 11: Breakdown of reserves at 31 March 2026
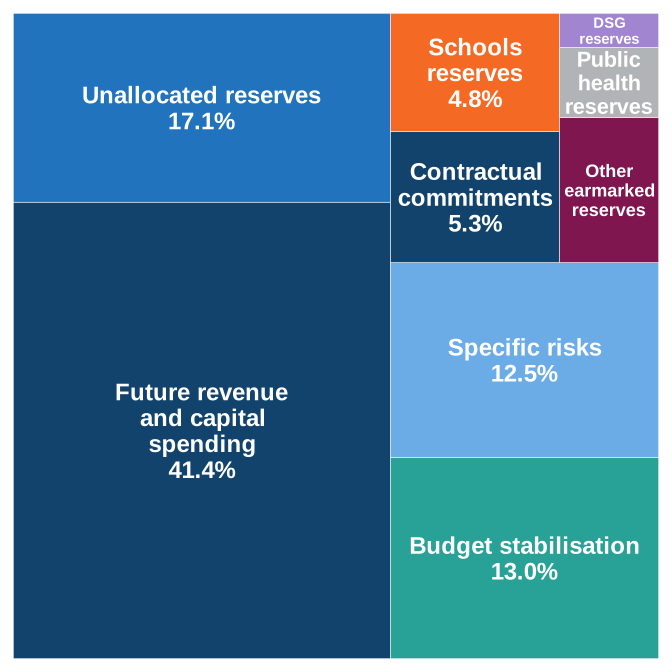
Figure 11 shows the breakdown of reserves at 31 March 2026. The data used in this chart can be found in RS, Revenue Summary Table of the accompanying tables.
Other earmarked reserves represent 3.45% of total reserves. The Public Health reserves account for 1.66% and the Dedicated Schools Grant (DSG) reserves account for 0.81%.
5. Accounting adjustments
5.1 Dedicated Schools Grant Adjustment Account
The Dedicated Schools Grant[footnote 4] (DSG) provides funding for education and children’s services. The DSG Adjustment Account records deficits accrued as result of the statutory override and is kept separate from other council finances.
Figure 12: Appropriations from the dedicated schools grant adjustment account, 2021-22 to 2025-26, (real terms)
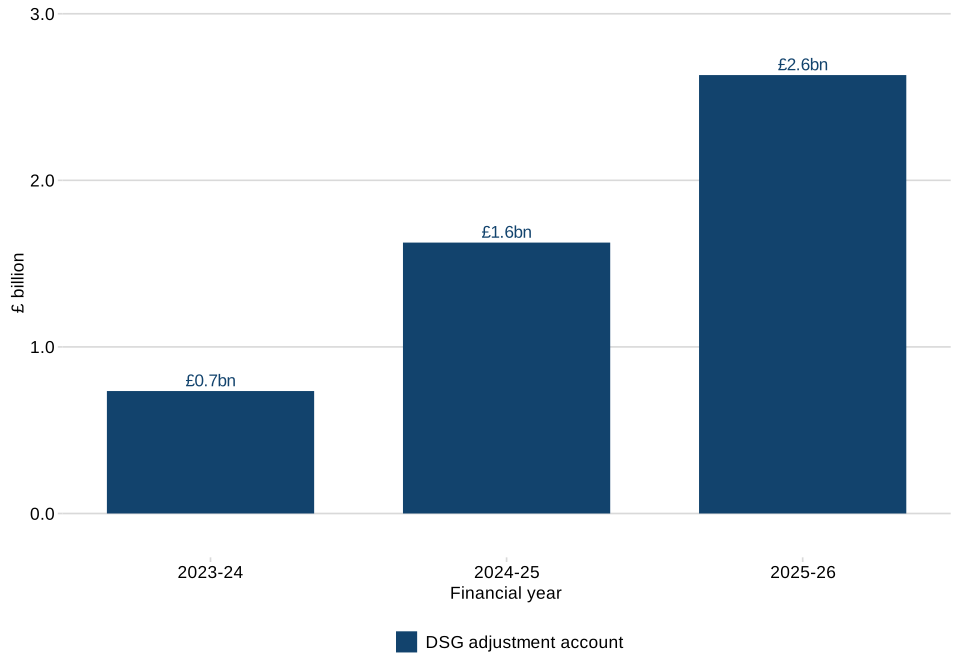
Figure 12 shows appropriations from the dedicated schools adjustment account from 2021-22 to 2025-26 in real terms. The outturn data used in this chart can be found in Multi-year Revenue Outturn dataset from the local authority Revenue Expenditure and financing collection.
The value from appropriations on the DSG Adjustment Account increased in 2025-26, by £1.0 billion (65.0%). This reflects continued spending pressures within special educational needs and disabilities (SEND) services. To support local authorities with DSG deficits, the government has announced a High Needs Stability Grant for 2026-27 covering 90% of the deficit accrued up to the end of 2025-26.
5.2 Exceptional Financial Support (EFS)
Exceptional Financial Support (EFS) provides temporary financial flexibility to local authorities experiencing significant financial pressures. A total of 29 Local Authorities were granted EFS in 2025-26. Authorities receiving EFS may use capital resources or borrowing to support their revenue budget position, helping them to manage short-term funding challenges. EFS does not provide additional funding, but instead offers an alternative mechanism for authorities to manage financial pressures while working towards a sustainable financial position.
EFS is recorded in the Revenue Outturn Summary (RS) table as netting off other expenditure capitalised by a direction under Section 16(2)(b). In 2025-26, this figure was £775.7 million.
6. Revenue outturn comparison to budget
In addition to the Revenue Outturn publication published annually, data is collected on budgeted Revenue Expenditure for local authorities in England.
Figure 13: Budgeted and outturn total service expenditure, 2017-18 to 2025-26 (real terms)
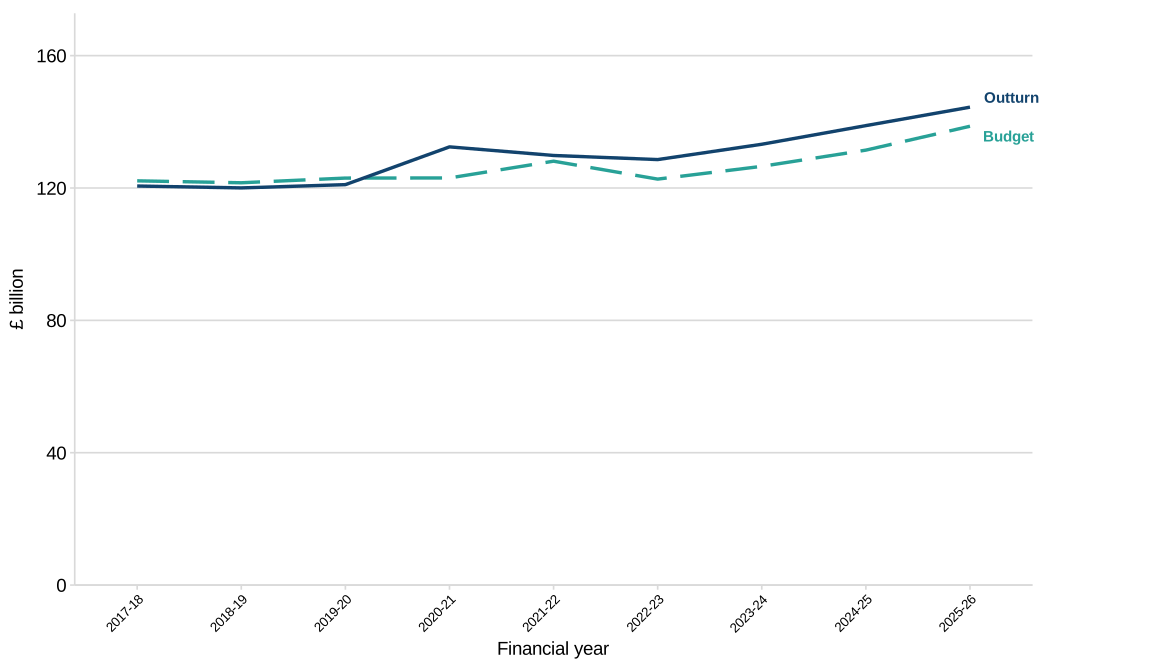
Figure 13 shows the total service expenditure budget and outturn for local authorities in England in real terms. The outturn data used in this chart can be found in Table 1 of the accompanying tables. To find the relevant budget data, the figures can be found in Table 1 of the corresponding year budget publication’s accompanying tables.
Since 2020-21, outturn total service expenditure has remained above the budgeted level. In 2025-26, total service outturn expenditure was £144.4 billion, compared with a budgeted figure of £138.7 billion, a difference of £5.8 billion (4.2%). The difference between budget and outturn has decreased since last year, from £7.4 billion (5.8%) in 2024-25.
7. Housing Revenue Account
Housing revenue accounts (HRAs) are ring-fenced accounts held by local authorities to record income and expenditure related to council housing stock which they own. As the account is ring-fenced, income from council housing must be used for housing-related purposes, and any surplus or deficit within the account must be added to or drawn from a ring-fenced HRA reserve.
Figure 14: HRA income and expenditure on the 31 March of each financial year, 2021-22 to 2025-26 (real terms)
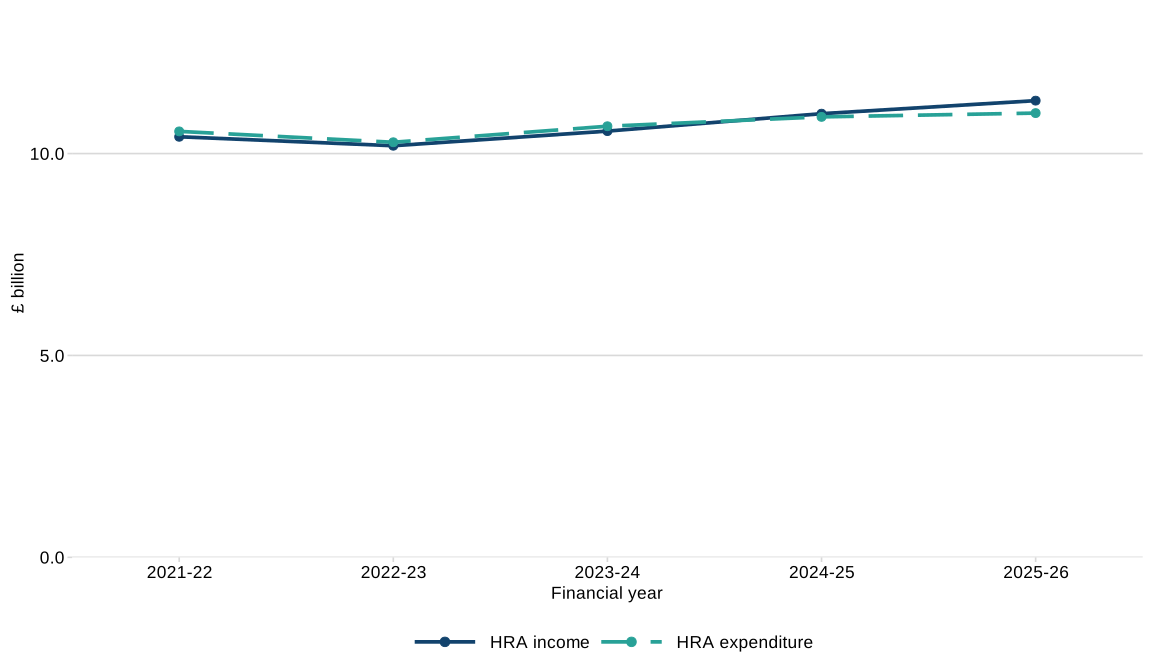
Figure 14 shows the HRA income and expenditure from 2021-22 to 2025-26 on the 31 March of each respective financial year in real terms. The data used in this chart can be found in the Multi-year Revenue Outturn dataset from the local authority Revenue Expenditure and financing collection.
In 2025-26, local authorities with HRAs recorded £11.0 billion in expenditure and £11.3 billion in income. This is an increase in expenditure of £94 million (0.9%) from 2024-25 and an increase in income of £323 million (2.9%).
Figure 15: HRA reserves, 2021-22 to 2025-26 (real terms)
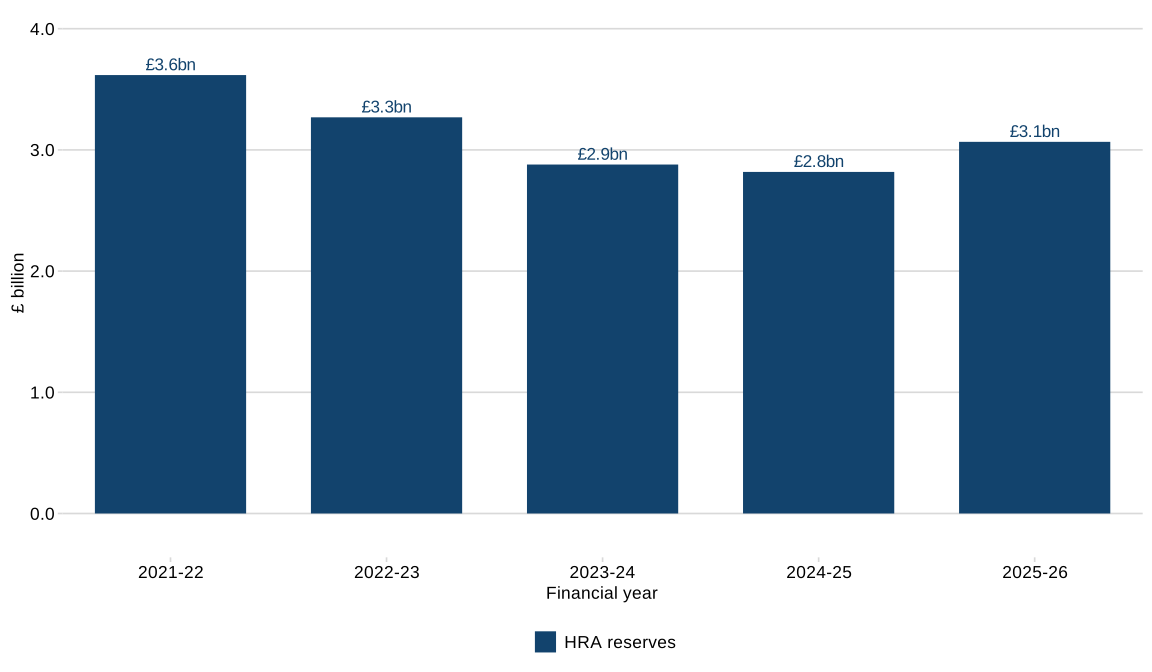
Figure 15 shows the HRA reserves from 2021-22 to 2025-26 in real terms. The data used in this chart can be found in the Multi-year Revenue Outturn dataset from the local authority Revenue Expenditure and financing collection.
8. Local authority debt costs
Local authorities incur interest and other financing costs on their external borrowing. Borrowing is undertaken principally to finance capital expenditure and to manage or refinance existing debt. Interest expense, Minimum Revenue Provision (MRP), finance costs associated with leases, other credit arrangements and cash repayments of principal are distinct measures of debt costs.
The Revenue Outturn return contains information on these costs within the General Fund and Housing Revenue Account (HRA).
Figure 16: General fund interest costs on external borrowing, 2021-22-2025-26 (real terms)
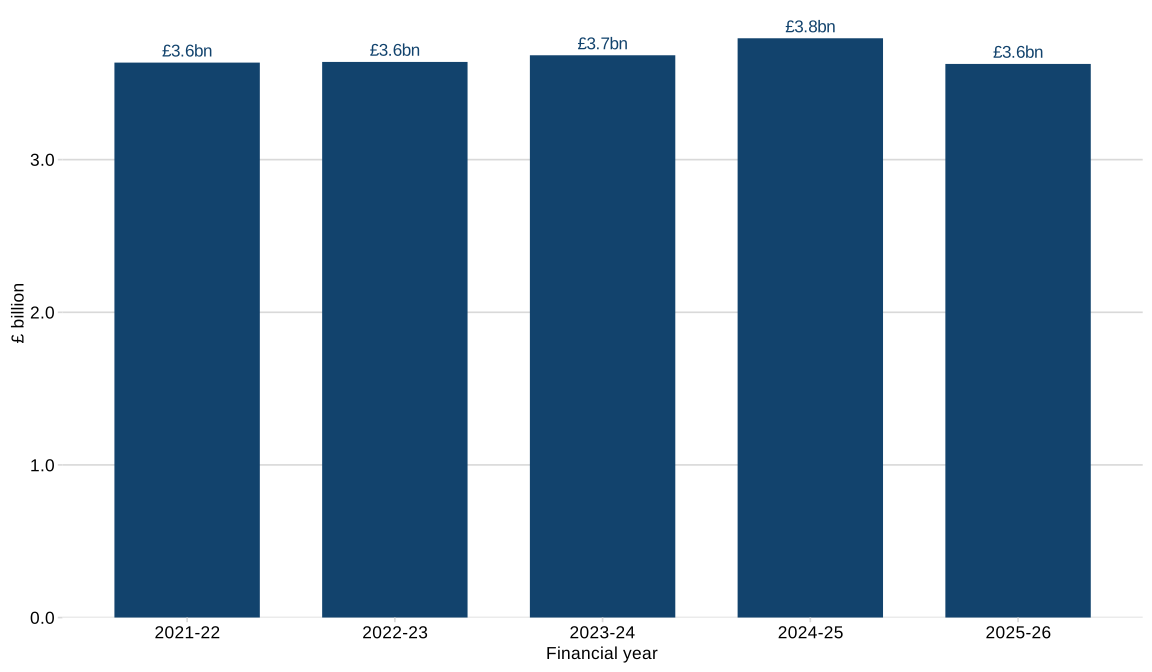
Figure 16 shows an accounting-based estimate of General fund interest costs from 2021-22 to 2025-26 in real terms. The data used in this chart can be found in the Multi-year Revenue Outturn dataset from the local authority Revenue Expenditure and financing collection. The measure calculated in this section is calculated by combining Interest: Interest payable and similar charges (RS line 781), Appropriations to/from the financial instruments adjustment account (RS line 789) and subtracting Interest: HRA item 8 payments and receipts (RS line 783). Together, this provides an estimate of General Fund interest cost after the applicable statutory financial-instrument adjustments and excluding the net HRA interest element. The measure excludes separately reported MRP and finance costs relating to leases, PFI arrangements and other credit arrangements.
Local authorities reported an estimated £3.6 billion of General Fund interest costs in 2025-26, this was a decrease of £168.2 million compared to 2024-25.
Further debt related costs on the HRA and General Fund can be found in the memorandum section of Revenue Outturn Summary table
Rounding
Where figures have been rounded, there may be a slight discrepancy between the total and the sum of constituent parts.
9. Technical notes
Please see the accompanying technical notes document for further details.
Information on Official Statistics is available via the UK Statistics Authority website.
Information about statistics at MHCLG is available via the Statistics at MHCLG page.
10. Tell us what you think
We are always interested to hear from our users about how our statistics are used, and how they can be improved.
Contact the Local Government Finance Revenue team: lgf1.revenue@communities.gov.uk
-
Trends in education over time should be interpreted with caution as increasing numbers of schools have converted to academy status which are funded directly by central government rather than local authorities. ↩
-
Figures presented in this publication exclude some Adult Social Care expenditure funded by the NHS and therefore do not represent total government spending on Adult Social Care. Further aggregates of Adult Social Care Expenditure can be found in DHSC’s Adult Social Care Finance Report. ↩
-
The London boroughs of Lambeth, Newham and Westminster all made changes to their reporting across these sub-categories that in combination explain the movements between sub-categories. ↩
-
The reserves levels category ‘Dedicated Schools Grant Adjustment Account’ was introduced for outturn 2022-23. Authorities should report deficits in this category, and surpluses in ‘Dedicated Schools Grant Reserves’, as per accounting regulations. Previously many authorities reported both in the latter category. ↩