Light rail and tram statistics, England: year ending March 2026
Published 29 September 2026
Applies to England

© Crown copyright 2026
This publication is licensed under the terms of the Open Government Licence v3.0 except where otherwise stated. To view this licence, visit nationalarchives.gov.uk/doc/open-government-licence/version/3 or write to the Information Policy Team, The National Archives, Kew, London TW9 4DU, or email: psi@nationalarchives.gov.uk.
Where we have identified any third party copyright information you will need to obtain permission from the copyright holders concerned.
This publication is available at https://www.gov.uk/government/statistics/light-rail-and-tram-statistics-england-year-ending-march-2026/light-rail-and-tram-statistics-england-year-ending-march-2026
About this release
This release presents the latest annual information on light rail and tram systems in England during the year ending March 2026. The release covers light rail and tram use, vehicle mileage, infrastructure, revenue and workforce.
This publication covers 8 urban systems that are predominantly surface-running (see Table 1 for a list of systems covered). Smaller systems (for example, heritage railway and airport transit systems) are not included. London Underground, Glasgow Subway and Edinburgh Trams are also excluded from this report, but statistics for these systems are included in the associated tables.
This publication includes accredited official statistics and official statistics in development. For more information, see the Official statistics section.
Headline figures
In England, comparing the year ending March 2026 with the year ending March 2025:
-
there were 226.1 million passenger journeys, which was a decrease of 2%
-
there were 28.8 million concessionary passenger journeys, which was a decrease of 2%
-
vehicles covered 22.0 million miles, which was a decrease of 1%
-
passenger revenue totalled £386.4 million, which was a decrease of 3% (adjusting for inflation)
-
concessionary revenue totalled of £33.6 million, which was a decrease of 4% (adjusting for inflation)
-
there were 483 vehicles covering 418 stops, with a total route length of 221.2 miles
The decrease in passenger journeys in England in the year ending March 2026 was mainly due to a reduction in passenger journeys on the Docklands Light Railway.
Details of factors impacting on annual figures including engineering works, technical equipment failures, planned closures (regional and national) and other factors can be found in the quality report.
Rounding
Figures presented in the statistical release may be rounded for ease of interpretation. For example, values expressed in millions may be rounded and percentage changes may be calculated using unrounded figures before being rounded for presentation.
From the year ending March 2026 onwards, the accompanying data tables are published unrounded. This change reduces the impact of rounding and helps users reproduce published calculations, such as percentage changes and year-on-year comparisons, more accurately from the underlying tables.
As a result, users may observe small differences between rounded figures presented in the statistical release and the more precise values published in the accompanying data tables.
Summary
Table 1: Summary of the latest annual light rail and tram figures (year ending March 2026) compared with the previous year (year ending March 2025) (LRT0101, LRT0104, LRT0106)
| System | Passenger journeys (millions) | Percentage change from 2025 - journeys | Vehicle miles (millions) | Percentage change from 2025 - miles | Passenger revenue (£ millions) | Percentage change from 2025 - revenue |
|---|---|---|---|---|---|---|
| England | 226.1 | -2% | 22.0 | -1% | 386.4 | -3% |
| London | 110.2 | -4% | 5.1 | -8% | 162.5 | -8% |
| Docklands Light Railway | 90.8 | -7% | 3.3 | -11% | 146.2 | -8% |
| London Trams | 19.3 | +12% | 1.8 | -3% | 16.2 | +1% |
| England outside of London | 116.0 | ~0% | 16.9 | +1% | 224.0 | ~0% |
| Nottingham Express Transit | 15.6 | -1% | 1.8 | -3% | 26.1 | +3% |
| West Midlands Metro | 9.0 | +3% | 1.3 | +3% | 14.9 | +3% |
| Sheffield Supertram | 8.5 | -6% | 1.2 | -6% | 17.0 | -7% |
| Tyne and Wear Metro | 31.5 | -2% | 3.1 | +2% | 71.9 | +1% |
| Manchester Metrolink | 46.6 | +1% | 8.7 | ~0% | 85.8 | -2% |
| Blackpool Tramway | 4.7 | +8% | 0.7 | +34% | 8.3 | -4% |
Table 1 summarises the annual figures for passenger journeys, vehicle miles and passenger revenue, including comparisons to year ending March 2025.
Percentage changes presented as “0%” indicate no change, while changes presented as “~0%” are non-zero changes that round to 0%.
Passenger journeys
Chart 1: Light rail and tram passenger journeys (millions): England, annually from year ending March 1984 to the year ending March 2026 - (LRT0101)
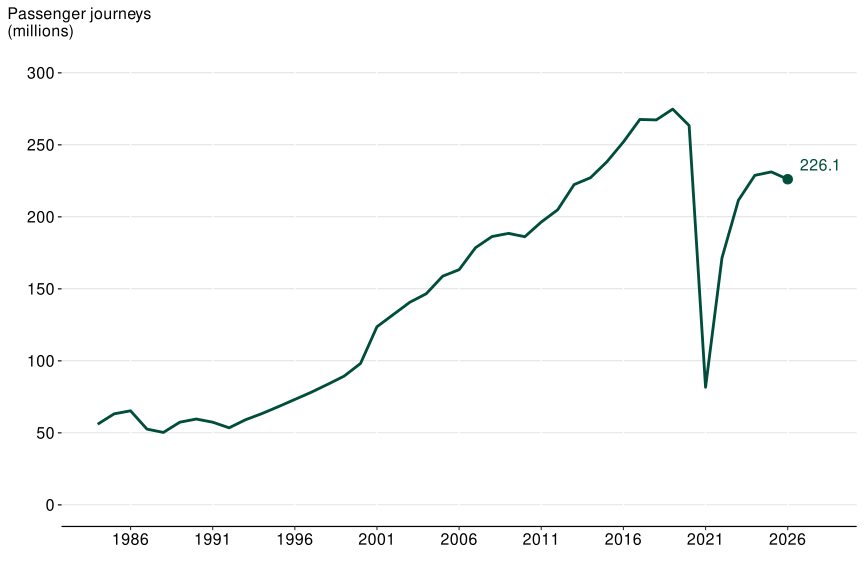
Chart 1 is a line chart showing that in England, in the year ending March 2026, passenger journeys on light rail and tram systems decreased to 226.1 million, a decrease of 2% compared with the previous year (where there were 231.2 million passenger journeys).
The number of passenger journeys taken on light rail and tram systems increased steadily between around 1992 and 2019 when it reached a peak of 274.8 million. The number of journeys dipped during the COVID-19 pandemic and have not returned to pre-pandemic levels, as of 2026.
In the year ending March 2026, when compared to 2025, there were:
-
226.1 million passenger journeys in England, which was a decrease of 2%
-
110.2 million passenger journeys in London, which was a decrease of 4%
-
116.0 million passenger journeys in England outside of London, which was roughly the same
Chart 2: Light rail and tram passenger journeys (millions) by system: England, year ending March 2026 (LRT0101)
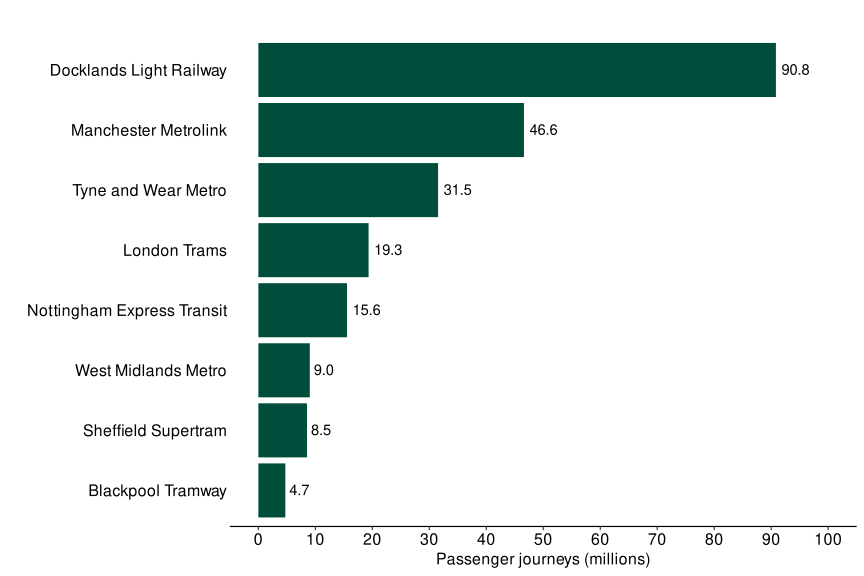
Chart 2 is a bar chart that shows passenger journeys on all systems in England in the year ending March 2026. It shows that:
-
the highest number of journeys was seen on the Docklands Light Railway, with 90.8 million passenger journeys
-
Blackpool Tramway had the fewest journeys, with 4.7 million
The 6.9 million fewer passenger journeys, compared with the year ending March 2025, on the Docklands Light Railway accounted for the majority of the decrease in passenger journeys in England.
Comparing the figures for the year ending 2026 to the year ending March 2019, the last full year before the COVID-19 pandemic:
-
West Midlands Metro has seen the largest percentage increase in passenger journeys, increasing by 9%, from 8.3 to 9.0 million
-
London Trams has seen the largest percentage decrease in passenger journeys, decreasing by 33%, from 28.7 to 19.3 million
Chart 3: Light rail and tram passenger journeys per person: England, London and England outside of London, annually from year ending March 2005 (LRT0109)
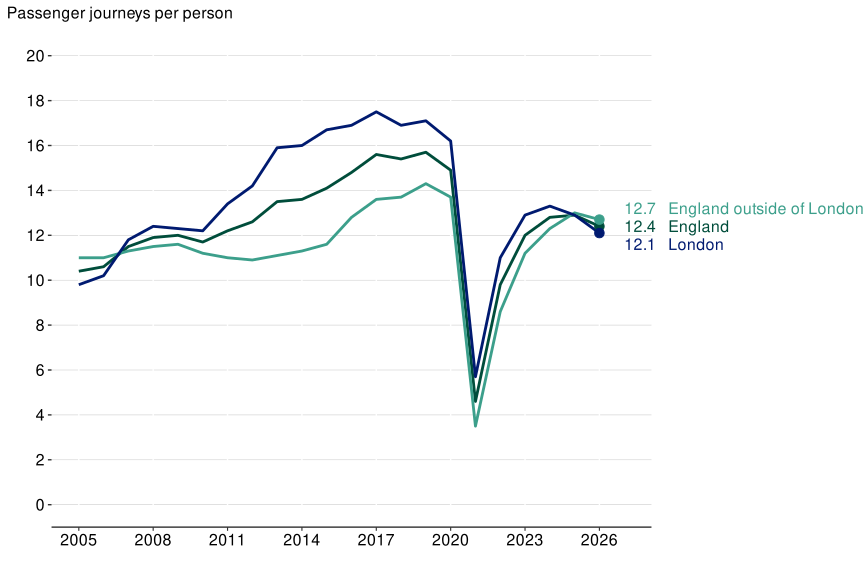
Chart 3 is a line chart showing that in the year ending March 2026, in England:
-
the average number of light rail and tram journeys per person was 12.4, a decrease of 4% compared with 12.9 journeys per person in the year ending March 2025
-
the average number of journeys per person remains below pre-pandemic levels (15.7 in the year ending March 2019)
Concessionary journeys
Definition: Concessionary journeys are those carried out by holders of a concessionary travel pass. For more information see the quality report.
In England, in the year ending March 2026, there were 28.8 million concessionary journeys on light rail and tram systems, a decrease of 2% compared to the 29.3 million concessionary journeys in the year ending March 2025.
Chart 4: Light rail and tram concessionary journeys (millions) by system: England, year ending March 2026 (LRT0102)
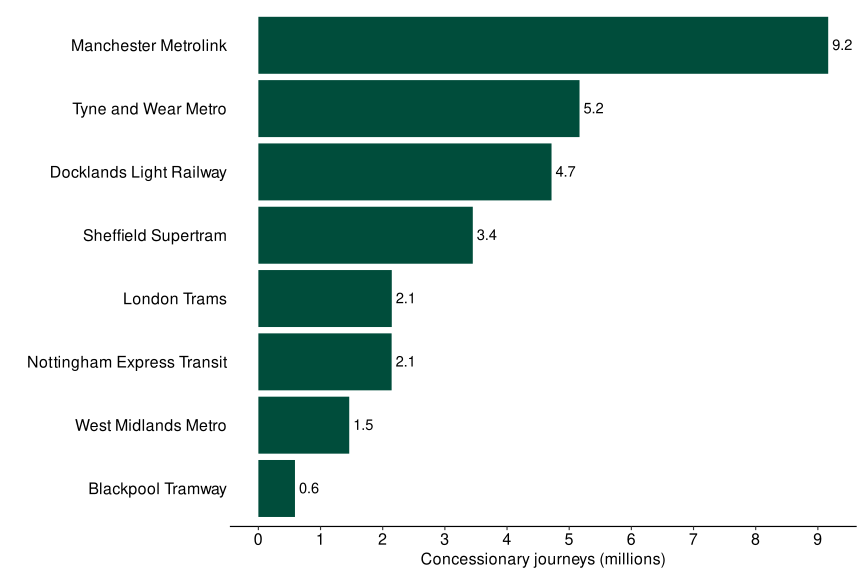
Chart 4 is a bar chart that shows that, in the year ending March 2026:
-
Manchester Metrolink had the most concessionary passenger journeys, with 9.2 million.
-
Blackpool Tramway had the fewest concessionary passenger journeys, with 0.6 million.
The West Midlands Metro and the Blackpool Tramway systems saw the biggest relative increase in concessionary passenger journeys, increasing by 19% and 15%, respectively. London Trams saw the largest relative decrease, with 21% fewer concessionary passenger journeys.
As with total passenger journeys, concessionary passenger journeys across England are still below the numbers seen in the year ending March 2019. When comparing the year ending March 2026 with the year ending March 2019:
-
West Midlands Metro, Tyne and Wear Metro, and Manchester Metrolink had more concessionary passenger journeys (increasing by 33%, 10%, and 5% respectively)
-
Blackpool Tramway saw approximately the same number of concessionary passenger journeys
-
all other systems recorded fewer concessionary passenger journeys
In England, 13% of all light rail and tram passenger journeys were concessionary in the year ending March 2026, which was similar to the previous year. This varied by system from 5% on the Docklands Light Railway to 40% on Sheffield Supertram. The proportion of journeys made by concessionary passengers for each system remained broadly similar to the previous year.
Concessionary travel on light rail and trams represents a relatively small proportion of passenger journeys when compared with concessionary travel on local bus passenger services in England. In the year ending March 2025, total concessionary journeys (elderly or disabled, and youth concessions) made up 28% of all local bus passenger journeys in England, amounting to 1.0 billion concessionary passenger journeys.
Vehicle mileage
Vehicle mileage can be used as an indicator of the level of service provision by operators.
Chart 5: Light rail and tram passenger journeys and vehicle miles: England, annually from year ending March 2012 (LRT0101 and LRT0106)
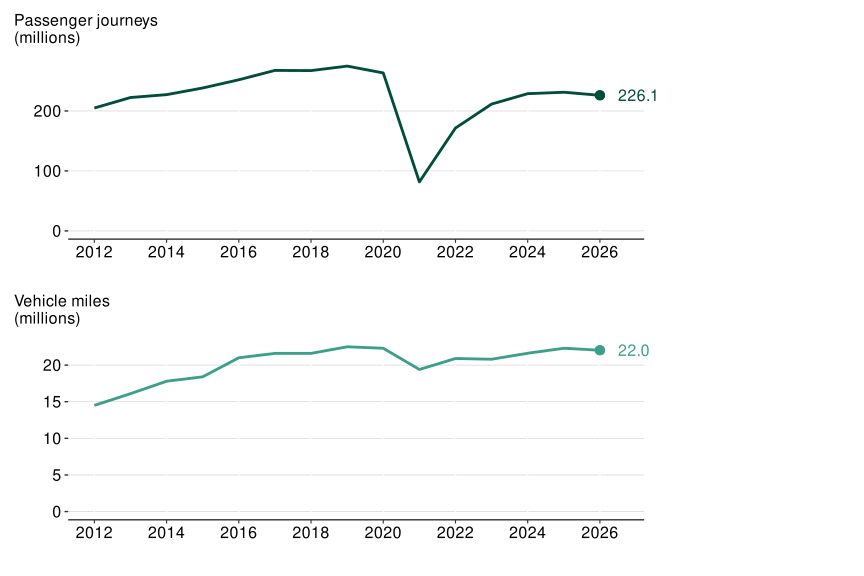
Chart 5 is made up of two line charts that show how passenger journeys and vehicle mileage have varied since 2012. The dip in vehicle mileage during the COVID-19 pandemic was relatively small compared to the dip in passenger journeys. Vehicle mileage in 2026 (22.0 million miles) is at a similar level to the high of 22.5 million miles seen in 2019.
In the year ending March 2026, compared to 2025, vehicle mileage was:
-
22.0 million miles in England, which was a decrease of 1%
-
5.1 million miles in London, which was a decrease of 8%
-
16.9 million miles in England outside of London, which was roughly the same
The most significant contribution to the overall decrease in vehicle mileage in England in the year ending March 2026 can be attributed to the Docklands Light Railway, which recorded 3.3 million miles, compared with 3.7 million miles in the year ending March 2025.
Between 2012 and 2019, both passenger journeys and vehicle miles saw a similar upward trend. During the COVID-19 pandemic, vehicle mileage decreased by less than passenger journeys as the government provided funding support to the sector to ensure the continued running of services. This was initially to provide sufficient service provision for National Health Service (NHS) staff and key workers, and subsequently to ensure that service levels were maintained while passenger numbers remained lower due to social distancing and home working requirements. This support ended during the year ending March 2023.
Chart 6: Light rail and tram vehicle mileage (millions) by system: England, year ending March 2026 (LRT0106)
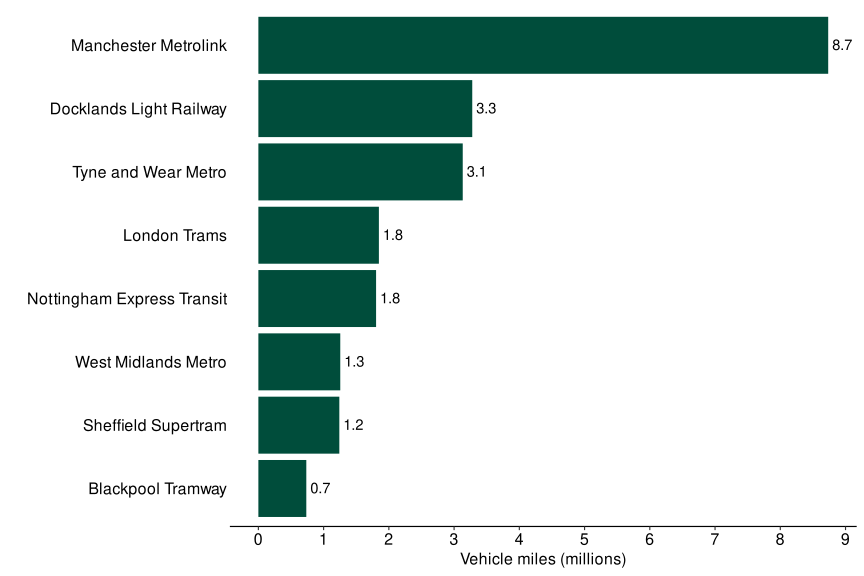
Chart 6 is a bar chart that shows that in the year ending March 2026, Manchester Metrolink had the highest vehicle mileage of all systems, at 8.7 million miles. Manchester Metrolink is also the largest system, operating 64.0 miles of track. Blackpool Tramway had the lowest vehicle mileage at 0.7 million miles, and also has the smallest track network, covering 11.8 miles.
Manchester Metrolink counts vehicle mileage in a different way to other systems. When two tram sets are joined together to form one train, vehicle miles are counted twice (once for each tram set). Figures for Manchester are therefore not directly comparable to those for other systems. It is thought that the use of these double tram sets has increased in recent years, and now accounts for approximately half of all services run in Manchester.
Comparing the number of vehicle miles taken in the year ending March 2026 compared to the year ending March 2025:
-
the Blackpool Tramway saw the largest increase, with a rise of 34%
-
the Docklands Light Railway saw the largest decrease, with a fall of 11%
Infrastructure
Between 31 March 2025 and 31 March 2026, while the number of stops remained unchanged in all systems in England, the length of all systems also stayed the same with the exception of the Blackpool Tramway.
Tyne and Wear Metro have also transitioned to a new fleet reporting a decrease of 43% compared with the previous year in the number of vehicles. This reflects an ongoing transition from a previous fleet configuration where each train comprised two units whereas the new fleets operate as a single unit. This reduction in the number of vehicles does not represent an equivalent reduction in operational capacity. Caution should therefore be exercised when comparing vehicle numbers for Tyne and Wear Metro over time.
The Docklands Light Railway are currently introducing new trains to their service and retiring older trains that have reached end of life.
Table 2: System summary: year ending March 2026 (LRT0201, LRT0202, LRT0204)
| Length of system (miles) | Percentage change from 2025 - length of system | Number of stops | Percentage change from 2025 - stops | Number of vehicles | Percentage change from 2025 - vehicles | |
|---|---|---|---|---|---|---|
| England | 221.2 | ~0% | 418 | 0% | 483 | -10% |
| London | 41.0 | 0% | 84 | 0% | 161 | -11% |
| Docklands Light Railway | 23.6 | 0% | 45 | 0% | 127 | -13% |
| London Trams | 17.4 | 0% | 39 | 0% | 34 | -3% |
| England outside of London | 180.2 | ~0% | 334 | 0% | 322 | -10% |
| Nottingham Express Transit | 19.9 | 0% | 50 | 0% | 37 | 0% |
| West Midlands Metro | 14.9 | 0% | 33 | 0% | 42 | 0% |
| Sheffield Supertram | 21.1 | 0% | 50 | 0% | 32 | 0% |
| Tyne and Wear Metro | 48.5 | 0% | 60 | 0% | 46 | -43% |
| Manchester Metrolink | 64.0 | 0% | 99 | 0% | 147 | 0% |
| Blackpool Tramway | 11.8 | +3% | 42 | 0% | 18 | 0% |
Table 2 summarises the length of system, number of stops and number of vehicles for all the systems in England, including comparison to the previous year.
Route length for Blackpool Tramway increased from 18.5 km to 19.0 km between the year ending March 2025 and the year ending March 2026. No route extension has been identified. The small increase may reflect rounding in the operator’s return rather than a change to the network.
Revenue
Chart 7: Light rail and tram total and concessionary passenger revenue: England, annually from year ending March 2012, in 2026 prices (LRT0301 and LRT0302)
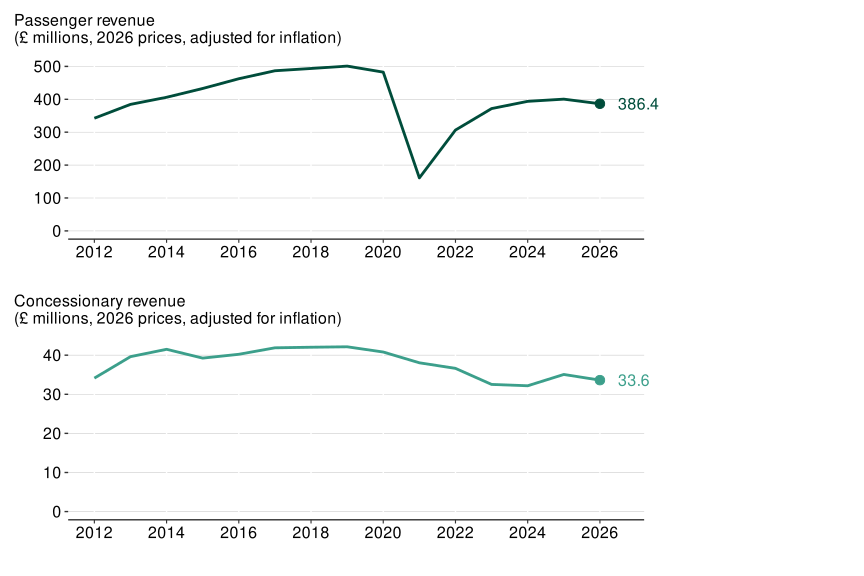
Chart 7 is made up of two line charts, showing light rail and tram passenger revenue since 2012, shown in 2026 prices (adjusted for inflation). In the year ending March 2026, the total revenue of £386.4 million decreased by 3% compared to the year ending March 2025 value, which was £400.4 million (in 2026 prices, adjusted for inflation). This was comparable to the number of passenger journeys which fell 2%.
For the year ending March 2026, the passenger revenue was:
-
£386.4 million in England, showing a decrease of 3% when compared to 2025 (adjusting for inflation)
-
£162.5 million in London, showing a decrease of 8% when compared to 2025 (adjusting for inflation)
-
£224.0 million in England outside of London, showing roughly the same when compared to 2025 (adjusting for inflation)
Total passenger revenue across England remains below pre-pandemic levels, after adjusting for inflation.
Transport for London provided estimated data for 2024/25 due to a cyber-attack that disrupted their usual data systems. Revised revenue data have since been incorporated into this publication. As a result, some revenue figures differ from those published previously.
For the year ending March 2026, when compared to 2025, the concessionary passenger revenue was:
-
£8.2 million in London, showing a decrease of 10% (adjusting for inflation)
-
£33.6 million in England, showing a decrease of 4% (adjusting for inflation)
Unlike commercial revenue, which decreased significantly during the pandemic, most local authorities chose to maintain concessionary reimbursement at pre-pandemic levels in the year ending March 2021, with several maintaining these into the year ending March 2022. These payments, in conjunction with funding support from DfT, worked together to help ensure the continued operation of light rail services across the country.
Several local authorities changed their concessionary funding back to normal (pre-pandemic) arrangements in the year ending March 2023, so that it was based on concessionary passenger numbers.
Concessionary revenue has now exceeded or remained similar to pre-pandemic levels for all systems outside of London. Like passenger revenue, once adjusted for inflation, revenue remains below pre-pandemic levels, suggesting that the recovery is still ongoing.
Workforce
About these Official Statistics in Development: These statistics are Official Statistics in Development, reflecting the fact that they are new, innovative statistics that are still undergoing development, with an intention to develop them further in future years. We would welcome feedback on these statistics and how they might be developed further in future to meet user needs. There are some known limitations of these statistics, and these should be considered when reviewing the data.
The figures show the number of full-time-equivalent (FTE) staff employed by light rail and tram systems, including those contracted externally where possible. Where figures are not whole numbers, this is to take into account those working part-time.
As at 31 March 2026, compared to 2025, there were:
-
1,249.5 light rail or tram drivers, an increase of 4%
-
624 other on-board staff (such as conductors or ticket inspectors), a decrease of 4%
-
1,059 maintenance staff, a decrease of 1%
-
510 admin staff, an increase of 6%
Chart 8: Number of full time equivalent (FTE) staff on light rail and tram systems: England, as at 31 March 2026 (LRT0501)
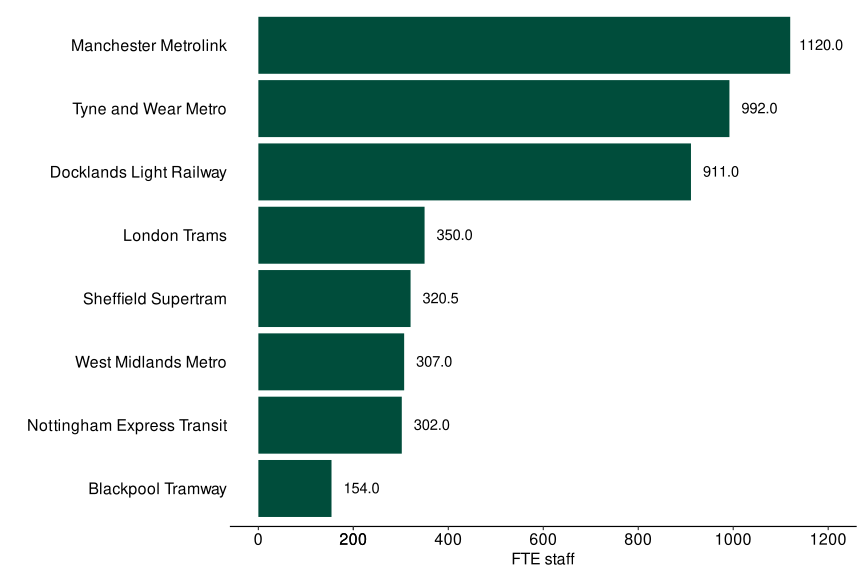
Chart 8 is a bar chart showing that the biggest employers were Manchester Metrolink, Tyne and Wear Metro and Docklands Light Railway with 1,120, 992, and 911 full time equivalent employees respectively. However, the Docklands Light Railway and West Midlands Metro figures do not include cleaning staff, whereas figures for the other systems do. Those figures are therefore not directly comparable to those for other systems.
There are variations in the types of staff employed by each system depending on the nature of the system. For example, the Docklands Light Railway does not employ any drivers as the trains are driverless, whereas London Trams does not employ any on-board staff other than the drivers.
Light rail and tram safety
The Office of Rail and Road publishes information on passenger injuries on trams, metros and other non-Network Rail networks (such as heritage railways) in Great Britain. In the year ending March 2025 (the latest available data), there were no passenger fatalities on the non-mainline network, a decrease from 1 in the previous year.
There were 58 severe injuries that required hospitalisation, an increase from 40 in the previous year. This was the highest number of severe injuries since the year ending March 2018.
Further information can be found on the Office of Rail and Road website and their published data tables.
About these statistics
Uses and users of these statistics
These statistics are collected to provide information on light rail and tram systems within England to monitor trends in passenger journeys, service provision and revenue. They help to provide a comprehensive picture of public transport use in Great Britain. Within DfT, they are used as background information in the development of light rail and tram policy, for ministerial briefing and to answer public enquiries. Outside DfT, known users include researchers, academics and Parliamentary groups. These groups appear to primarily use the statistics as context for reports related to light rail.
Strengths and weaknesses of the data
The survey first ran in its current format in 2010 and has been running on an annual basis since with a consistent 100% response rate, although some data are available back to the 1980s. The data captured has remained largely unchanged, meaning that long-term trends can be monitored.
As the figures are provided by different operators, there are some differences in the methods used to count journeys or to estimate passenger or vehicle kilometres, which may affect comparisons between different systems. However, we have attempted to ensure comparability as far as possible.
Transport for London have provided estimated data for 2024/25 due to a cyber-attack that disrupted their usual data systems. This impacts the statistics provided for Docklands Light Railway and London Trams. As these form the comparison year for annual percentage changes presented in this release, changes for DLR and London Trams should be interpreted with caution. These may be subject to revision in future.
More information about strengths and limitations can be found in the quality report.
Official statistics
These statistics were designated as accredited official statistics in February 2013.
Further information on data quality, including the methods used to compile these statistics, users and background information about the systems covered can be found in the quality report.
This publication is a compendium of accredited official statistics, and statistics in development. The type of statistics presented is detailed in Table 3 below.
Table 3: Categories of statistics presented in this publication
| Name of category of statistics | Label | Description |
|---|---|---|
| Light Rail and Tram survey | Accredited official statistics | These official statistics were independently reviewed by the Office for Statistics Regulation in February 2013. They comply with the standards of trustworthiness, quality and value in the Code of Practice for Statistics and should be labelled ‘accredited official statistics’. |
| Office of Rail and Road – Rail safety statistics | Accredited official statistics | These official statistics were independently reviewed by the Office for Statistics Regulation in December 2022. They comply with the standards of trustworthiness, quality and value in the Code of Practice for Statistics and should be labelled ‘accredited official statistics’. |
| Light Rail and Tram survey (workforce questions) | Official statistics in development | These statistics are released under the ‘official statistics in development’ label – formerly called experimental statistics. Official statistics in development are official statistics that are temporarily undergoing development and are being tested with users, in line with the standards of trustworthiness, quality, and value in the Code of Practice for Statistics. |
Instructions for printing and saving
Depending on which browser you use and the type of device you use (such as a mobile or laptop) these instructions may vary.
You will find your print and save options in your browser’s menu. You may also have other options available on your device. Tablets and mobile device instructions will be specific to the make and model of the device.
How to search
Select Ctrl and F on a Windows laptop or Command and F on a Mac
This will open a search box in the top right-hand corner of the page. Type the word you are looking for in the search bar and press enter.
Your browser will highlight the word, usually in yellow, wherever it appears on the page. Press enter to move to the next place it appears.
Further information
To hear more about DfT statistical publications as they are released, follow us on X DfTstats account.
Contact details
Light rail and tram statistics
Email localtransport.statistics@dft.gov.uk
Media enquiries 0300 7777 878