Income-related benefits: estimates of take-up: financial year ending 2025
Updated 28 October 2026
Applies to England, Scotland and Wales

© Crown copyright 2026
This publication is licensed under the terms of the Open Government Licence v3.0 except where otherwise stated. To view this licence, visit nationalarchives.gov.uk/doc/open-government-licence/version/3 or write to the Information Policy Team, The National Archives, Kew, London TW9 4DU, or email: psi@nationalarchives.gov.uk.
Where we have identified any third party copyright information you will need to obtain permission from the copyright holders concerned.
This publication is available at https://www.gov.uk/government/statistics/income-related-benefits-estimates-of-take-up-financial-year-ending-2025/income-related-benefits-estimates-of-take-up-financial-year-ending-2025
The Income-related benefits: estimates of take-up report provides estimates of take-up for income-related benefits.
The pension age benefits covered are:
- Pension Credit (PC)
- Housing Benefit (HB) for pensioners
These are Official Statistics and include the latest Financial Year Ending (FYE) 2025 estimates.
The working age benefits included in the new composite measure UC (or equivalent benefits) are:
- Universal Credit (UC)
- Income-based Jobseeker’s Allowance (JSA (IB))
- Income-related Employment and Support Allowance (ESA (IR))
- Income Support (IS)
- Working Tax Credit (WTC)
- Child Tax Credit (CTC)
- Housing Benefit (HB) for working age claimants
These are Official Statistics in Development. This release reports on FYE 2024 and FYE 2025 estimates and reinstates reporting on the working age population (last published in full on 14 September 2017 for FYE 2016 - Income-related benefits: estimates of take-up: financial year 2015/16
Take-up refers to the receipt of benefits someone is entitled to, and we estimate take-up in 2 ways:
- by the number of people who claim these benefits (‘caseload’)
- by the amount these people claim (‘expenditure’)
Integration of administrative data into the Family Resources Survey
Administrative data linking to the Family Resources Survey (FRS) has always been used to allow for more accurate classification of the benefit units as Entitled Non-Recipients (ENRs) to take-up estimates. The approach has evolved over time and in March 2026, the first integrated Family Resources Survey based on linked benefits data was published, relating to FYE 2025 data. This has no impact on the take-up estimates as the FYE 2024 results were based on the same linking approach, but in effect means one less step in producing the publication as the administrative data linking is already incorporated in the source FRS data. For further details, please access this technical paper and quality assessment report.
1. Estimates of take-up by caseload and expenditure
Pension age benefits
Pension Credit
The estimates show that:
- caseload: 6 out of 10 of pensioner families entitled to PC claimed the benefit in FYE 2025
- 62% of pensioner families entitled to Pension Credit claimed the benefit in FYE 2025, the same as in FYE 2024, when 62% of those entitled to Pension Credit claimed the benefit
-
there were 1.3 million pensioner families in receipt of PC in FYE 2025, excluding non-private households
- expenditure: in FYE 2025, 74% of the total amount of PC that could have been claimed was claimed, which was an increase from FYE 2024, when 71% was claimed
- the total amount of PC claimed in FYE 2025 was £5.8 billion, excluding amounts to non-private households
Figure 1: Overall PC caseload and expenditure figures for FYE 2025
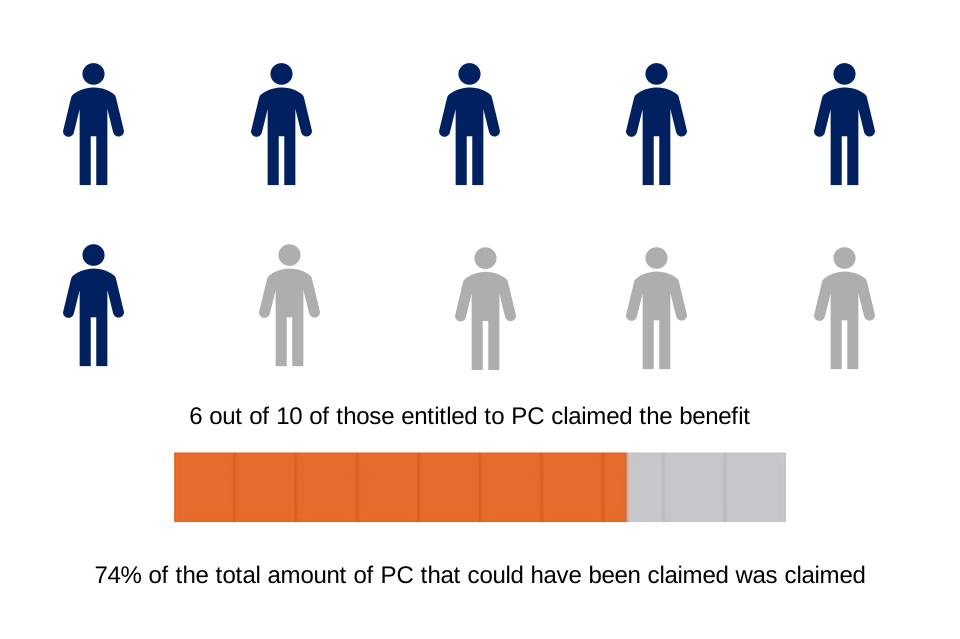
The image is a pictogram that shows 6 out of 10 of those entitled to PC claimed the benefit. It also shows 74% of the total amount of PC that could have been claimed was claimed.
Housing Benefit (for pensioners)
The estimates show that:
- caseload: 8 out of 10 of pensioner families entitled to HB claimed the benefit in FYE 2025
- 83% of pensioner families entitled to HB claimed the benefit in FYE 2025, which was a decrease from FYE 2024, when 85% claimed the benefit
- there were 1.1 million pensioner families in receipt of HB in FYE 2025, excluding non-private households
- expenditure: 86% of the total amount of HB (for pensioners) that could have been claimed was claimed in FYE 2025, which was a decrease from FYE 2024, when 87% was claimed
- the total amount of HB claimed by pensioner families in FYE 2025 was £6.7 billion, excluding amounts to non-private households
Figure 2: Overall HB (for pensioners) caseload and expenditure figures for FYE 2025
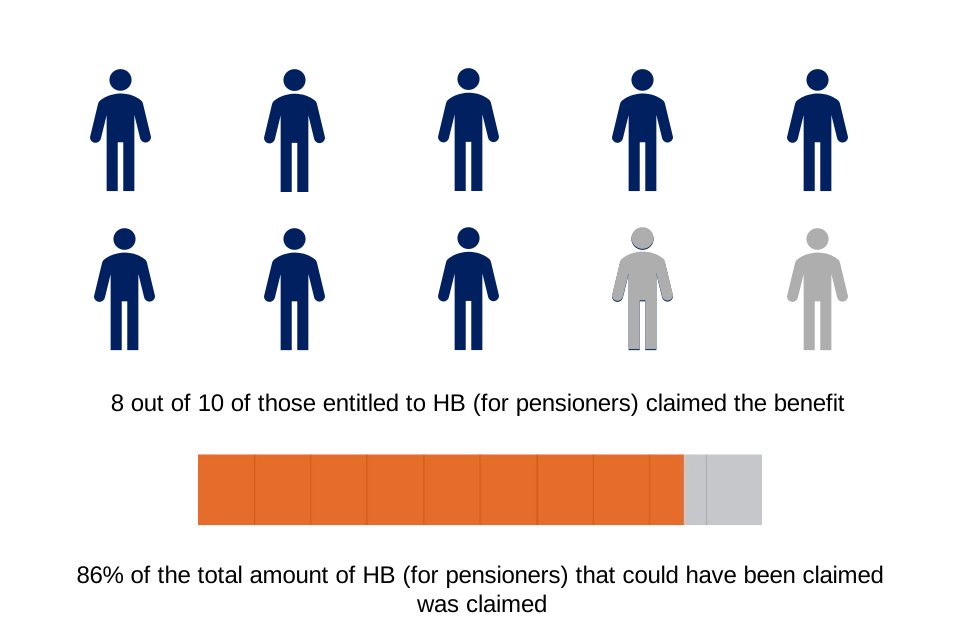
The image is a pictogram that shows 8 out of 10 of those entitled to HB (for pensioners) claimed the benefit. It also shows 86% of the total amount of HB (for pensioners) that could have been claimed was claimed.
Working age benefits
UC (or equivalent benefits)
The estimates show that:
- caseload: 7 out of 10 of families entitled to UC (or equivalent benefits) claimed the benefit in FYE 2025
- 72% of families entitled to UC (or equivalent benefits) claimed the benefit in FYE 2025
-
there were 6.1 million families in receipt of UC (or equivalent benefits) in FYE 2025, excluding non-private households and any legacy benefit/ tax credits recipients who are not eligible for UC. Therefore this figure, which is not UC only, is not comparable with the caseload figures in the Benefit expenditure and caseload tables 2026
- expenditure: 87% of the total amount of UC (or equivalent benefits) that could have been claimed, was claimed in FYE 2025
- the total amount of UC (or equivalent benefits) claimed in FYE 2025 was £74.6 billion, excluding amounts to non-private households and any legacy benefit/ tax credits recipients who are not eligible for UC
Due to the phased approach to managed migration from legacy benefits to UC, in which claimants of different legacy benefits were invited to claim UC at different times, the composition of the eligible group changes each year and so FYE 2024 and FYE 2025 estimates are not directly comparable. These estimates use a composite measure which draws from multiple data sources to capture take-up across the legacy benefits, tax credits and Universal Credit. This allows the Department for Work and Pensions (DWP) to understand working age income-related benefit take-up as a whole.
Figure 3: Overall UC (or equivalent benefits) caseload and expenditure figures for FYE 2025
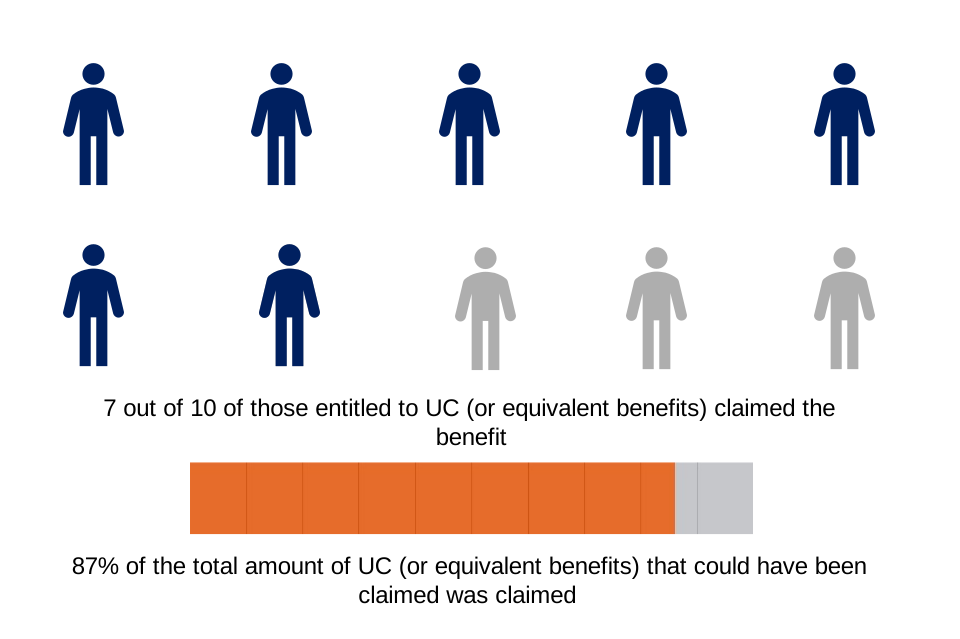
The image is a pictogram that shows 7 out of 10 of those entitled to UC (or equivalent benefits) claimed the benefit. It also shows 87% of the total amount of UC (or equivalent benefits) that could have been claimed was claimed.
2. Estimates of non-take-up
Expenditure amounts are in nominal terms.
Pension Credit
The estimates show that:
- caseload: up to 900,000 pensioner families who were entitled to receive PC did not claim the benefit in FYE 2025, a slight decrease from FYE 2024 when there were up to 910,000 families who were entitled and did not claim the benefit, excluding non-private households
- expenditure: up to £2.4 billion of available PC went unclaimed in FYE 2025, a decrease from the estimate of up to £2.5 billion unclaimed in FYE 2024, excluding amounts to non-private households
- on average, this amounted to around £2,500 per year (a decrease from £2,600 in FYE 2024) for each family entitled to receive PC who did not claim the benefit
Housing Benefit (for pensioners)
The estimates show that:
-
caseload: up to 270,000 pensioner families who were entitled to receive HB did not claim the benefit in FYE 2025, an increase from FYE 2024 when there were up to 230,000 families who were entitled and did not claim the benefit, excluding non-private households
-
expenditure: up to £1.3 billion of available HB (for pensioners) went unclaimed in FYE 2025, an increase from the estimate of up to £1.1 billion unclaimed in FYE 2024, excluding amounts to non-private households
-
on average, this amounted to around £4,700 per year (the same value of £4,700 as in FYE 2024) for each family entitled to receive HB (for pensioners) who did not claim the benefit
UC (or equivalent benefits)
The estimates show that:
-
caseload: up to 2.6 million families who were entitled to receive UC (or equivalent benefits) did not claim in FYE 2025, excluding non-private households and any legacy benefit/ tax credits recipients who are not eligible for UC
- expenditure: up to £12.7 billion of available UC (or equivalent benefits) expenditure went unclaimed in FYE 2025, excluding amounts to non-private households and any legacy benefit/ tax credits recipients who are not eligible for UC
- on average, this amounted to around £4,700 per year for each family entitled to receive UC (or equivalent benefits) who did not claim the benefit
Due to the phased approach to managed migration from legacy benefits to UC, in which claimants of different legacy benefits were invited to claim UC at different times, the composition of the eligible group changes each year and so FYE 2024 and FYE 2025 estimates are not directly comparable.
3. What you need to know
Introduction
This report provides estimates of the take-up of benefits in Great Britain (GB) for FYE 2025, for income-related benefits.
The pension age benefits covered are:
- Pension Credit (PC)
- Housing Benefit (HB) for pensioners
The working age benefits included in the new composite measure UC (or equivalent benefits) are:
- Universal Credit
- Income-based Jobseeker’s Allowance (JSA (IB))
- Income-related Employment and Support Allowance (ESA (IR))
- Income Support (IS)
- Working Tax Credit (WTC)
- Child Tax Credit (CTC)
- Housing Benefit (HB) for working age claimants
This publication includes estimates of the take-up of UC (or equivalent benefits) composite measure (‘composite’ meaning UC or equivalent legacy benefits/ tax credits) which are Official Statistics in Development. For further information see: guide to official statistics in development - Office for National Statistics. The pension age estimates remain as Official Statistics, with no changes methodologically in FYE 2025.
Take-up refers to the receipt of benefits someone is entitled to. There are some people who are entitled to benefits but have not claimed them. An income-related benefit is a benefit where a claimant’s income and capital are considered when deciding whether they are entitled to the benefit. Income can include earnings or other benefits and capital can include savings.
Take-up of benefits can be affected by multiple factors. Trying to explain the reasons for non-take-up is difficult and we do not have data in our modelling to do this. Eurofound 2015 has stated “non-take-up can largely be explained by a varying mix of the following reasons:
• lack of awareness or misperceptions about entitlement or application procedures
• complexity of the application procedure or lack of resources such as time and capabilities to navigate the system
• stigma, perceived lack of need, pride and lack of trust in institutions”
Take-up statistics are not available at a lower level of geography than GB. This is because the survey sample sizes for (ENRs) are too small to calculate take-up rates in smaller geographical areas. HB take-up statistics are only available as totals. This is also because the survey sample sizes for ENRs are too small to be able to calculate take-up rates for sub-groups.
Methodological refinements were applied to the data from FYE 2017. Therefore, comparisons to previous years should be treated with caution. This is indicated in the data tables and charts using a dashed grey line.
Administrative data linking to the FRS has always been used to allow for more accurate classification of the benefit units as ENRs to take-up estimates. The approach has evolved over time and in March 2026, the first integrated Family Resources Survey based on linked benefits data was published, relating to FYE 2025 data. This has no impact on the take-up estimates as the FYE 2024 results were based on the same linking approach, but in effect means one less step in producing the publication as the administrative data linking is already incorporated in the source FRS data. For further details, please access this technical paper and quality assessment report.
All estimates are for private households only. Therefore, those in nursing homes, student halls of residence, military barracks, prison or temporarily living in bed and breakfast accommodation, will not be included.
From May 2019, both partners in a couple were required to have reached State Pension age (SPa) to make a successful claim for income-related pension age benefits. The SPa for FYE 2024 and FYE 2025 is 66 for both males and females.
With the abolition of Savings Credit (SC) for new pensioners from April 2016, and the reducing number of SC only cases in the entitled population, we are no longer able to estimate SC breakdowns with a sufficient level of confidence. Therefore, from FYE 2022 onwards, SC breakdowns are no longer included in the data tables. Historic SC breakdowns can be found in previous releases.
See Section 11 - Improvements and Refinements section in the background information and methodology for more details.
Content of the report
Take-up is estimated in 2 ways:
1. Caseload
Over a 1 year period, the average number of benefit recipients who received each benefit compared to the number if everyone entitled to the benefit had claimed it, excluding non-private households and any recipients who are not eligible for the benefit.
2. Expenditure
Over a 1 year period, the average amount of a benefit claimed multiplied by the total number of people claiming it, compared to the total amount if everyone entitled to the benefit had claimed it, excluding amounts to non-private households and any recipients who are not eligible for the benefit.
Note that the caseload figures are rounded to the nearest 10 thousand and percentages are rounded to the nearest percentage point. For expenditure figures, the amounts claimed and unclaimed are rounded to the nearest £10 million and percentages are rounded to the nearest percentage point. This is consistent with the DWP Guidance on the rounding policy.
Expenditure amounts are in nominal terms.
The charts presented here are based on these rounded estimates, rather than unrounded. Percentage point differences stated in this publication have been calculated on unrounded percentages.
The average numbers of ENRs, and the average amounts unclaimed are estimated, along with 95% confidence intervals to reflect uncertainty. These estimates are combined with the receipt estimates to produce the lower bound, central, and upper bound take-up estimates. The lower bound and upper bound estimates are presented as a range around the central estimate on all charts.
In reporting average annual amounts unclaimed we have used mean weekly amounts to be consistent with the estimated total amount unclaimed. Information on median weekly amounts unclaimed is available in the data tables.
Throughout this report a ‘family’ refers to either a single adult or a married or cohabiting couple, and any dependent children.
Statistically significant differences in this publication are clearly stated. For more information on statistical significance see section 8.
This report contains data from FYE 2013 to FYE 2025 for pension age (data for FYE 2010 can also be found in the data tables), and from FYE 2024 to FYE 2025 for working age.
Further information
A set of data tables which breaks down the headline results presented in this publication, along with a quick guide on how to use them, are available Income-related benefits: estimates of take-up: financial year ending 2025. Data from the tables are referenced throughout this report.
4. Pension Credit
62% of those entitled to Pension Credit received the benefit
Figure 4: Take-up range (caseload) of PC, FYE 2013 to FYE 2025, GB
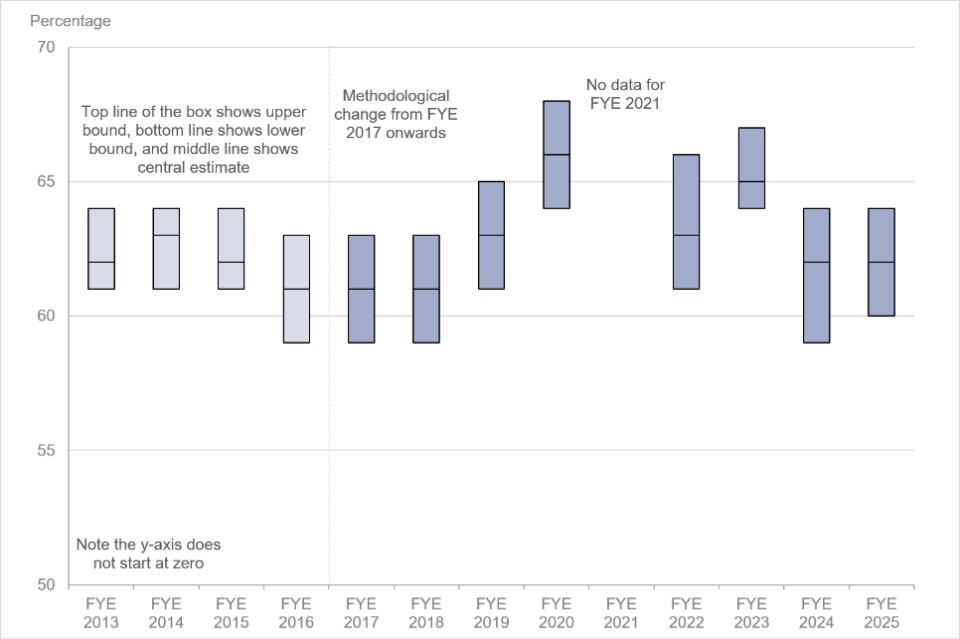
Chart shows caseload take-up with range, of PC, for each year between FYE 2013 and FYE 2025.
62% of those entitled to Pension Credit received the benefit in FYE 2025. This was the same caseload take-up rate as in FYE 2024.
From April 2022, DWP launched an ongoing campaign which consists of increased advertising to make people more aware of the possibility that they could be entitled to PC.
Eligibility for Winter Fuel Payments (WFP) changed in FYE 2025. Prior to this change, WFP was a near-universal benefit for pensioners living in the UK, provided they met the residence and other eligibility conditions.
On 29 July 2024, the Government announced that they would implement a targeted approach to Winter Fuel Payment eligibility in England and Wales from Winter 2024/2025. Eligibility was restricted to pensioner households in England and Wales with someone receiving Pension Credit or certain other income-related benefits.
In Scotland, winter heating assistance is a devolved policy area. For Winter 2024/2025, the Scottish Government brought forward new legislation in the Scottish Parliament for a Pension Age Winter Heating Payment that replaced the Winter Fuel Payment in Scotland – which was linked to Pension Credit and other qualifying benefits in the same way as in England & Wales.
See Table PC1 for full data.
Caseload take-up of Guarantee Credit (GC) was higher than Savings Credit only
Figure 5: Take-up range (caseload) of GC and SC only, FYE 2013 to FYE 2025, GB
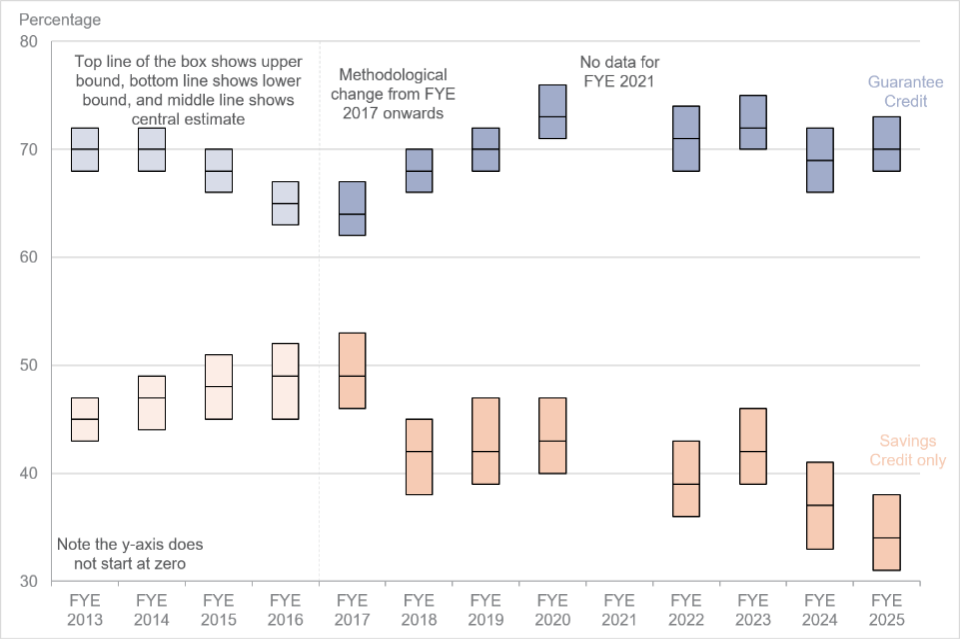
Chart shows caseload take-up with range, of GC and SC only, for each year between FYE 2013 and FYE 2025.
In FYE 2025, the take-up rate of GC was 70% compared to FYE 2024 when it was 69%.
In FYE 2025, the take-up rate of SC only was 34% compared to FYE 2024 when it was 37%.
In FYE 2025, the take-up rate for Guarantee Credit (70%) continued to be higher than the take-up rate for Savings Credit only (34%). This difference is statistically significant.
See Table PC1 for full data.
Caseload take-up of Pension Credit was highest for single females
Figure 6: Take-up range (caseload) of PC by family type, FYE 2013 to FYE 2025, GB
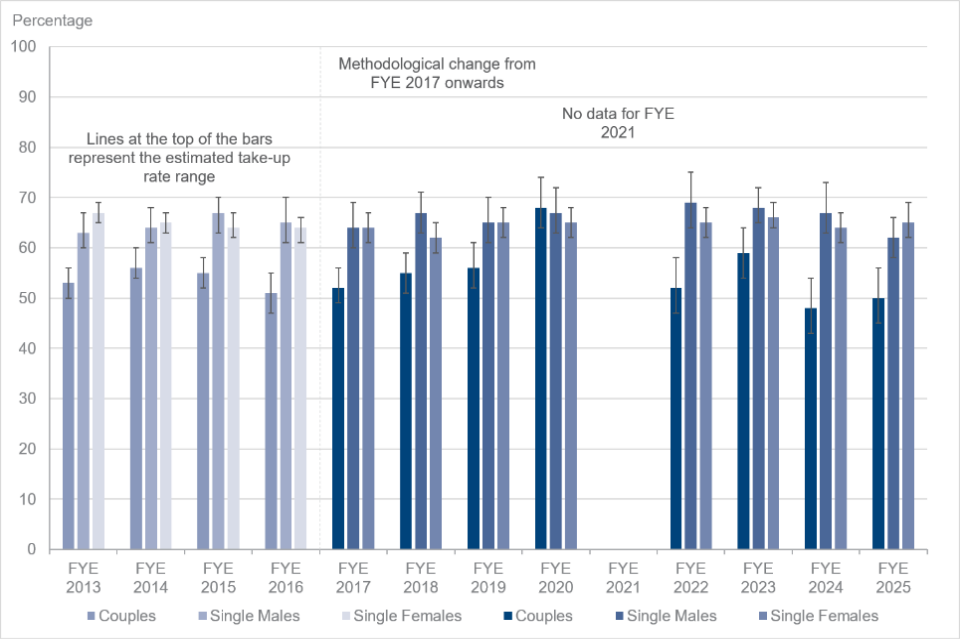
Chart shows caseload take-up with range, of PC by family type, for each year between FYE 2013 and FYE 2025.
For FYE 2025, the caseload take-up rate of PC was higher for single females (65%) than for single males (62%). Both continue to have a higher caseload take-up rate than couples (50%).
In FYE 2025, the difference between the caseload take-up rates for single females and couples is statistically significant.
See Table PC3 for full data.
The caseload take-up of Pension Credit by those aged 75 or over was the same as those aged under 75
Figure 7: Take-up range (caseload) of PC, by age, FYE 2013 to FYE 2025, GB
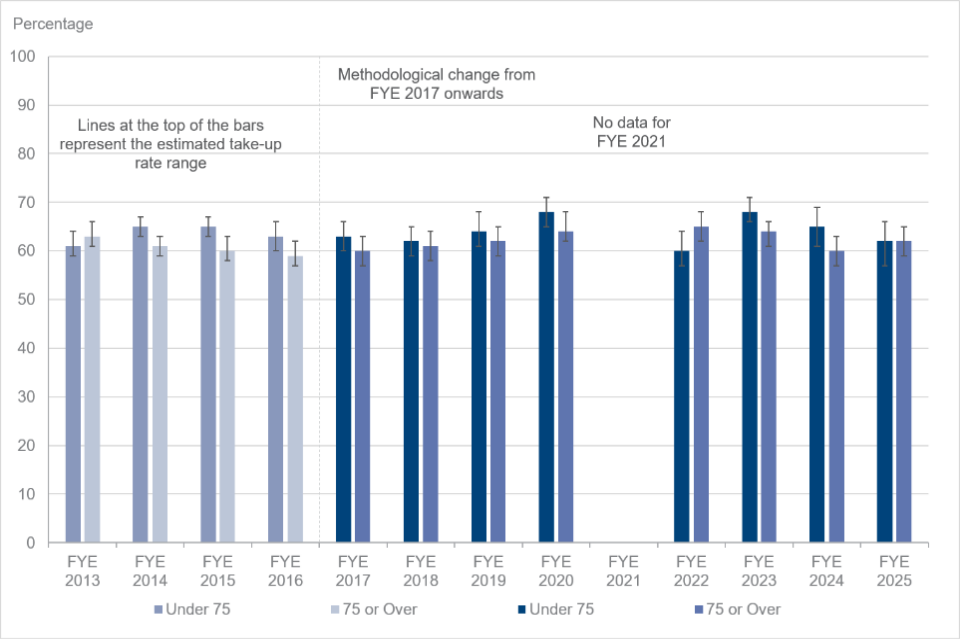
Chart shows caseload take-up with range, of PC by age group, for each year between FYE 2013 and FYE 2025.
The caseload take-up rate of PC for those aged under 75, was 65% in FYE 2024 and has decreased by 3 percentage points in FYE 2025 to 62%.
The caseload take-up rate of PC for those aged 75 or over was 60% in FYE 2024 and has increased by 2 percentage points in FYE 2025 to 62%.
See Table PC7 for full data.
74% of the total amount of Pension Credit that could have been claimed was claimed
Figure 8: Take-up range (expenditure) of PC, FYE 2013 to FYE 2025, GB
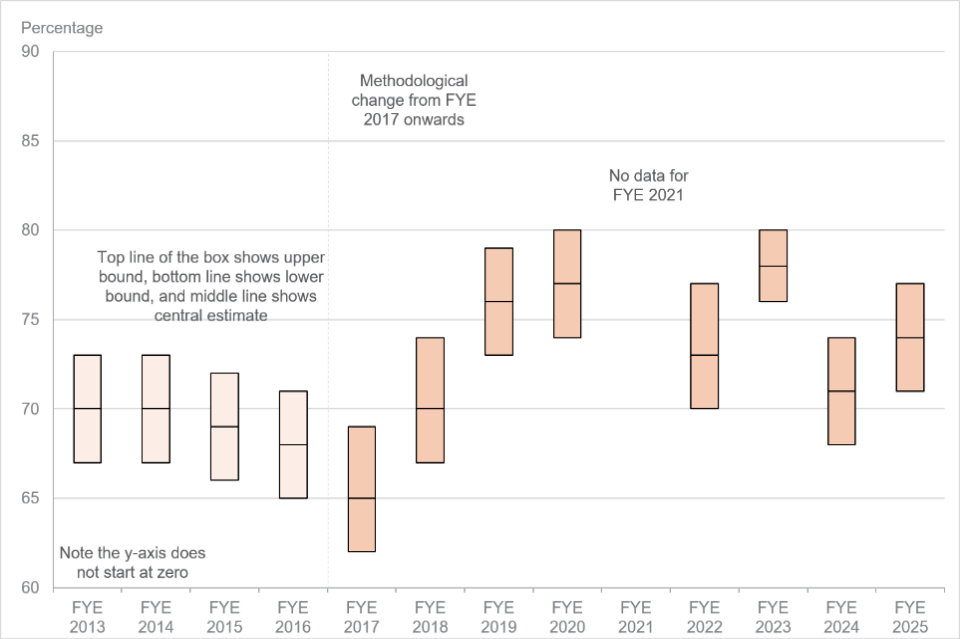
Chart shows expenditure take-up with range, of PC, for each year between FYE 2013 and FYE 2025.
In FYE 2025, an estimated 74% of the total amount of PC that could have been claimed was claimed. This was 3 percentage points higher than FYE 2024 (71%).
See Table PC2 for full data.
Expenditure take-up of Guarantee Credit was higher than Savings Credit only
Figure 9: Take-up range (expenditure) of GC and SC only, FYE 2013 to FYE 2025, GB
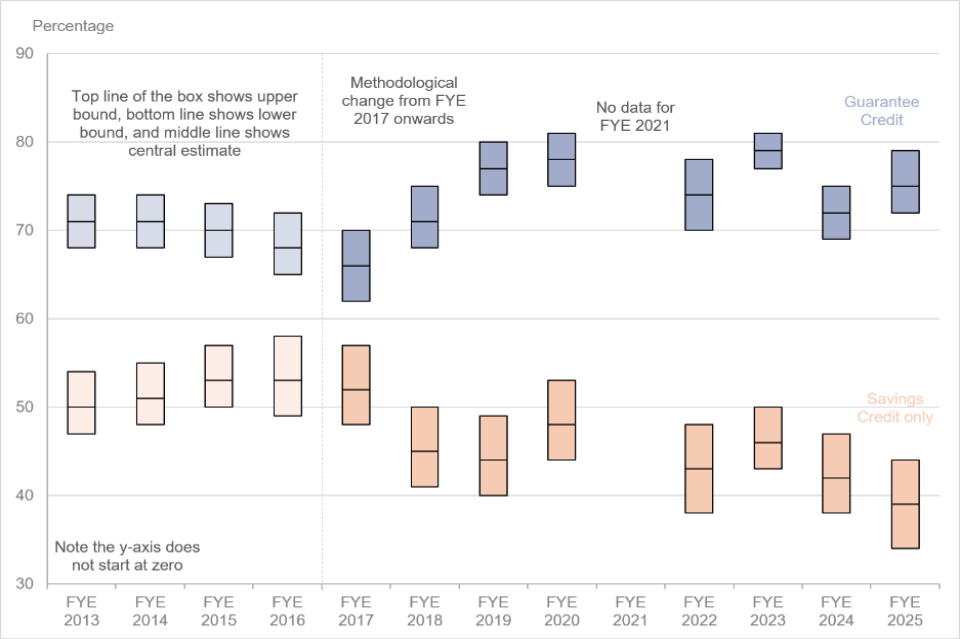
Chart shows expenditure take-up with range, of GC and SC only, for each year between FYE 2013 and FYE 2025.
In FYE 2025, an estimated 75% of the total amount of GC that could have been claimed was claimed. In FYE 2024 it was 72%.
In FYE 2025, an estimated 39% of the total amount of SC only that could have been claimed was claimed. In FYE 2024 it was 42%.
In FYE 2025, the expenditure take-up of GC (75%) continued to be higher than expenditure take-up of SC only (39%). This difference is statistically significant.
See Table PC2 for full data.
Expenditure take-up of Pension Credit was highest for single females
Figure 10: Take-up range (expenditure) of PC by family type, FYE 2013 to FYE 2025, GB
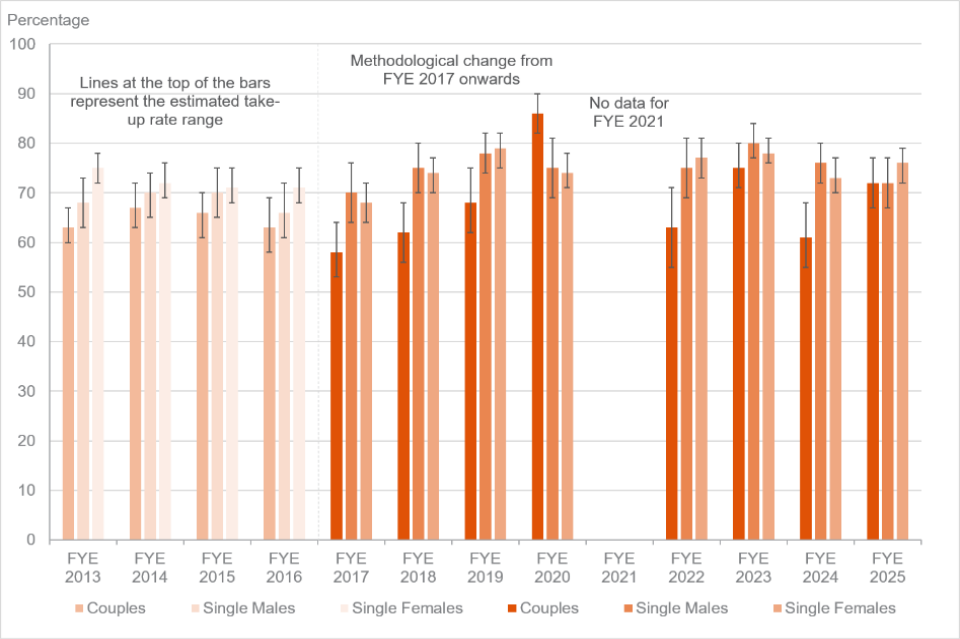
Chart shows expenditure take-up with range, of PC by family type, for each year between FYE 2013 and FYE 2025.
In FYE 2025, an estimated 76% of the total amount of PC that could have been claimed by single females was claimed. In FYE 2024, it was 73%.
In FYE 2025, an estimated 72% of the total amount of PC that could have been claimed by single males was claimed. In FYE 2024, it was 76%.
In FYE 2025, an estimated 72% of the total amount of PC that could have been claimed by couples was claimed. In FYE 2024, it was 61%.
See Table PC4 for full data.
Expenditure take-up of Pension Credit by those aged 75 or over was higher than those aged under 75
Figure 11: Take-up range (expenditure) of PC, by age, FYE 2013 to FYE 2025, GB
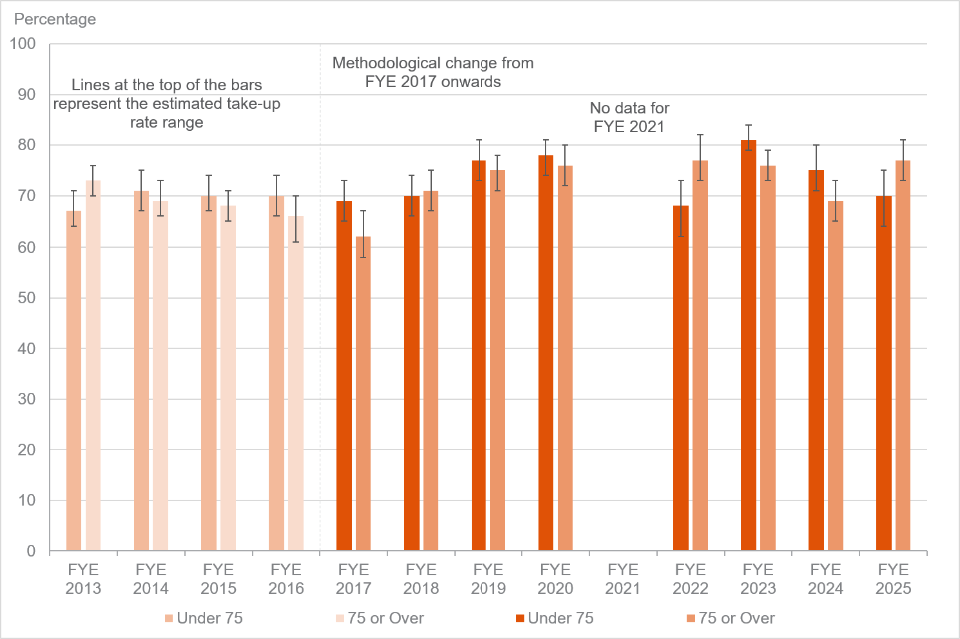
Chart shows expenditure take-up with range, of PC by age group, for each year between FYE 2013 and FYE 2025.
The expenditure take-up rate of PC by those aged under 75, decreased by 5 percentage points from 75% in FYE 2024 to 70% in FYE 2025
The expenditure take-up rate of PC by those aged 75 or over, increased by 8 percentage points from 69% in FYE 2024 to 77% in FYE 2025. This increase is statistically significant. This reflects a 2 percentage point increase in caseload take-up for this age group, as well as a reduction in the mean weekly amount unclaimed estimate, from £50 in FYE 2024 to £39 in FYE 2025.
See Table PC8 for full data.
5. Housing Benefit (for pensioners)
83% of those entitled to Housing Benefit (for pensioners) received the benefit
Figure 12: Take-up range (caseload) of HB (for pensioners), FYE 2013 to FYE 2025, GB
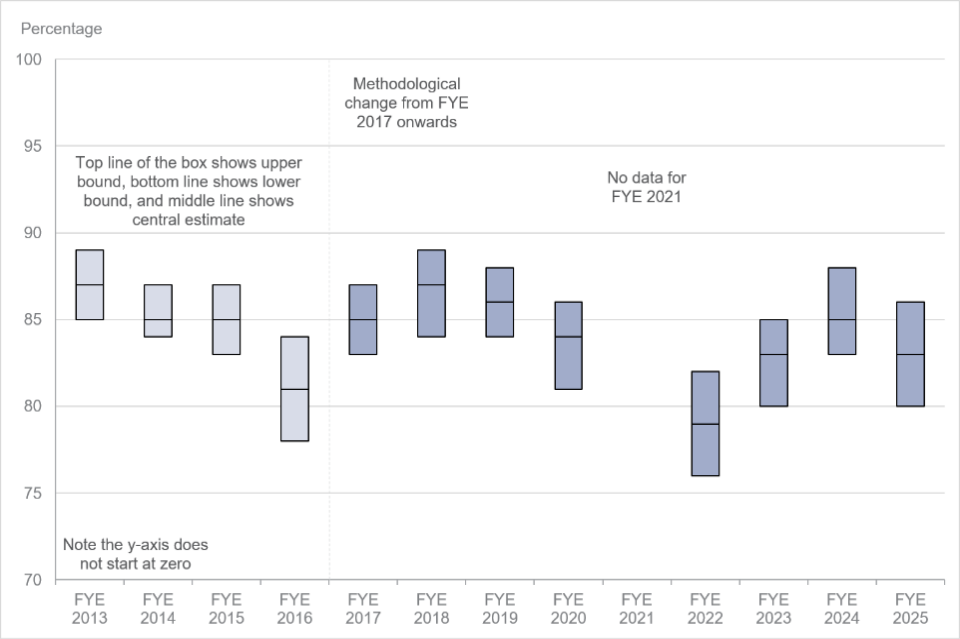
Chart shows caseload take-up with range, of HB (for pensioners), for each year between FYE 2013 and FYE 2025.
In FYE 2025, an estimated 83% of pensioners who were entitled to HB, received the benefit. This was 2 percentage points lower than in FYE 2024 (85%).
See Table HB1 for full data.
86% of the total amount of Housing Benefit (for pensioners) that could have been claimed was claimed
Figure 13: Take-up range (expenditure) of HB (for pensioners), FYE 2013 to FYE 2025, GB
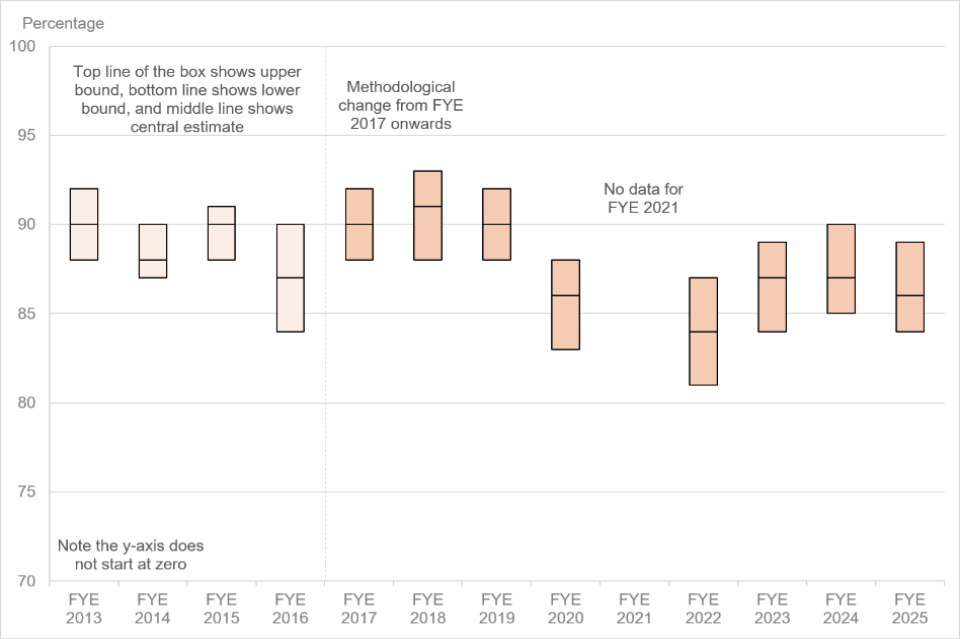
Chart shows expenditure take-up with range, of HB (for pensioners), for each year between FYE 2013 and FYE 2025.
In FYE 2025, an estimated 86% of the total amount of HB (for pensioners) that could have been claimed was claimed. This was 1 percentage point lower than in FYE 2024 (87%).
See Table HB2 for full data.
6. Universal Credit (or equivalent benefits)
These estimates are a composite measure for the take-up of UC (or equivalent benefits) while the transition from legacy benefits and tax credits takes place.
The statistics on take-up of working age benefits (UC or equivalent) are currently labelled as Official Statistics in Development.
UC (or equivalent benefits) refers to families receiving Universal Credit, legacy income-related benefits or tax credits, during the transition to UC. While there are still people in receipt of legacy benefits and tax credits a UC-only take-up rate would not provide the full picture of what is happening for the entitled working age population. A composite measure is therefore required to allow an understanding of working age income-related benefit take-up overall.
Note that we are estimating those entitled to UC-only, as legacy benefits were closed to new applications. There were still families in receipt, hence needing to include equivalent legacy benefits/ tax credits in the receipt estimates.
In this way we account for the Move to UC, as we include those in receipt of either UC or an equivalent legacy benefit/ tax credit. Therefore we are capturing them in our estimates whether they have moved to UC or not, and this gives an estimate for working age income-related take-up overall for the given year. Our definition of eligibility remains the same across the 2 years reported on, that they are eligible for UC. Any family who is in receipt of a legacy benefit and not eligible for UC is excluded.
Due to the phased approach to managed migration from legacy benefits to UC, in which claimants of different legacy benefits were invited to claim UC at different times, the composition of the eligible group changes each year and so FYE 2024 and FYE 2025 estimates are not directly comparable.
These estimates are also not comparable to previous publications including take-up estimates for each working age benefit.
Table summarising the Move to UC timeline
| Date | Event |
|---|---|
| Apr-2013 | Universal Credit introduced |
| End of 2018 | Universal Credit rolled out to all Jobcentre Plus offices for new claims. New claims were for UC only from this point with some exceptions. |
| Apr-2023 | Tax Credit households notified to move to UC at scale |
| Apr-2024 | Income Support (IS) households notified to move to UC at scale |
| July-October 2024 | JSA, ESA and HB households notified to move to UC at scale |
| Apr-2025 | Tax Credits closure |
| Mar-2026 | Completed move to UC for all IS, JSA, ESA and HB working age households, with some exceptions for ESA and HB. |
Completing the move to Universal Credit
In short, UC is a single monthly payment for individuals/families who are unemployed, have caring responsibilities, are in work and have a low income, or are unable to work because of ill health. Claimants must live in the UK, be aged 18 or over (special exceptions if 16-17), be under SPa, and have £16,000 or less in money, savings and investments.
Claimants must fulfil their claimant commitment, which is a personalised agreement made between the claimant and DWP, outlining what they must do to receive UC. The estimates assume that those who are otherwise eligible and either, unemployed and looking for work or employed on low income, would agree to the claimant commitment and therefore be an eligible non-recipient for UC.
UC has numerous components. It is calculated using a standard allowance, plus extra ‘elements’ depending on claimant circumstances. These include the child element, housing costs element, Limited Capability for Work element, and carer’s element. Payments to families can change each month if there has been a change in their circumstances. This differs from the previous legacy benefits/ tax credits system, where there were multiple benefits and claims reviewed with differing regularity. In the current system, working age claimants only need to apply for UC to receive income-related benefits.
The following families are included in our working age take-up estimates:
- single claimants, must be of working age
- couples, must contain at least 1 claimant who is of working age
If both partners are of pension age they are included in the pensioner take-up estimates.
72% of those entitled to Universal Credit (or equivalent benefits) received the benefit
Figure 14: Take-up range (caseload) of UC (or equivalent benefits), FYE 2024 to FYE 2025, GB
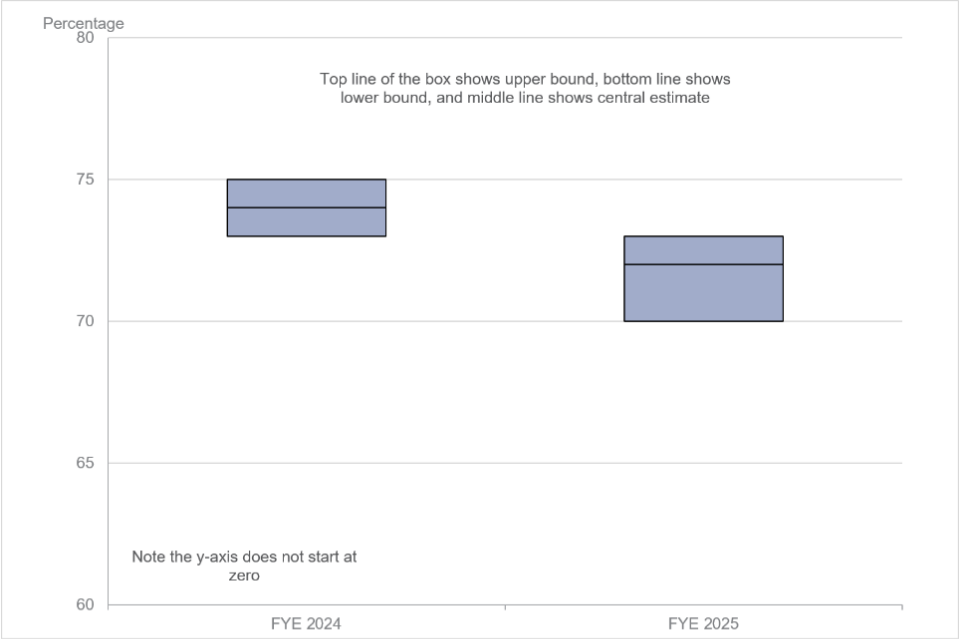
Chart shows caseload take-up with range, of UC (or equivalent benefits), for years FYE 2024 and FYE 2025.
72% of those entitled to UC (or equivalent benefits) received the benefit in FYE 2025 while 74% received the benefit in FYE 2024. The results are not directly comparable as the composition of the eligible group has been changing during the phased move to UC. The results will reflect changes during the move to UC as well as changing economic circumstances and other factors.
See Table UC1 for full data.
The caseload take-up rate of families entitled to Universal Credit (or equivalent benefits), was higher for those with children
Figure 15: Take-up range (caseload) of UC (or equivalent benefits) by if they have children, FYE 2024 to FYE 2025, GB
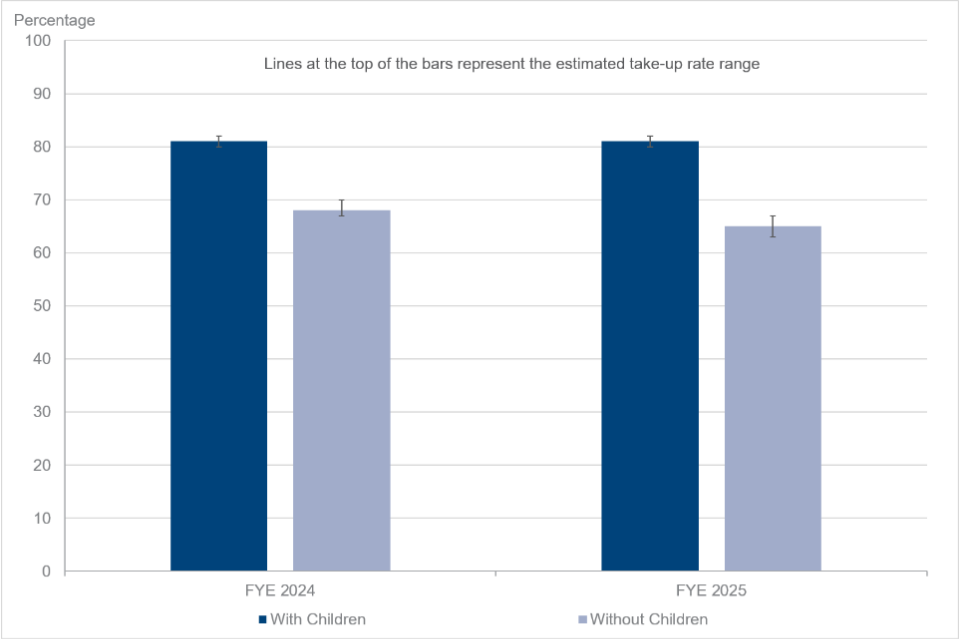
Chart shows caseload take-up with range, of UC (or equivalent benefits) by if they have children, for years FYE 2024 and FYE 2025.
In FYE 2025, the caseload take-up rate of UC (or equivalent benefits) was 81% for families with children and 65% for families without children.
The difference in caseload take-up rates between families with or without children was statistically significant in both FYE 2025 and FYE 2024.
Our estimates show the mean weekly amount claimed is higher for families with children compared to those without. In an evaluation of those invited to move to UC from tax credits, it was found that there were higher UC claim rates (through managed migration of tax credits claimants) amongst those with children.
As reported in Eurofound research, “where benefits decrease gradually as income rises… the amount of benefit is so low they [people who are eligible] decide not to claim it.”
See Table UC3 for full data
The caseload take-up rate of families entitled to Universal Credit (or equivalent benefits), was highest for singles with children
Figure 16: Take-up range (caseload) of UC (or equivalent benefits) by family type and if they have children, FYE 2024 to FYE 2025, GB
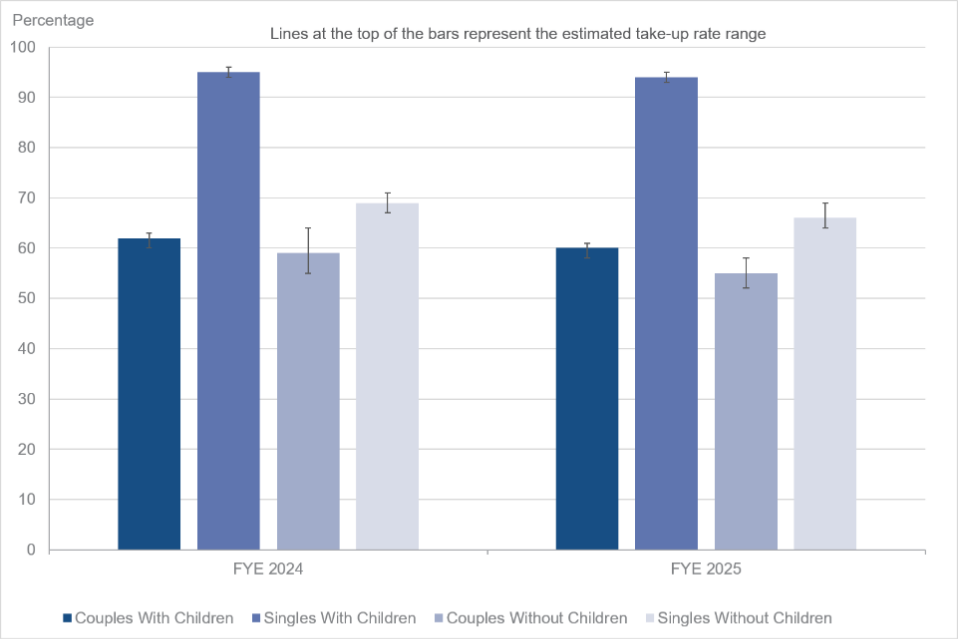
Chart shows caseload take-up with range, of UC (or equivalent benefits) by family type, for years FYE 2024 and FYE 2025.
For FYE 2025 the caseload take-up rate of UC (or equivalent benefits) was 60% for couples with children and 55% for couples without children. For singles with children it was 94%, and 66% for singles without children.
In both FYE 2024 and FYE 2025, the difference in the take-up rate between singles with children and all other family types is statistically significant.
See Table UC3 for full data
87% of the total amount of Universal Credit (or equivalent benefits) that could have been claimed was claimed
Figure 17: Take-up range (expenditure) of Universal Credit (or equivalent benefits), FYE 2024 to FYE 2025, GB
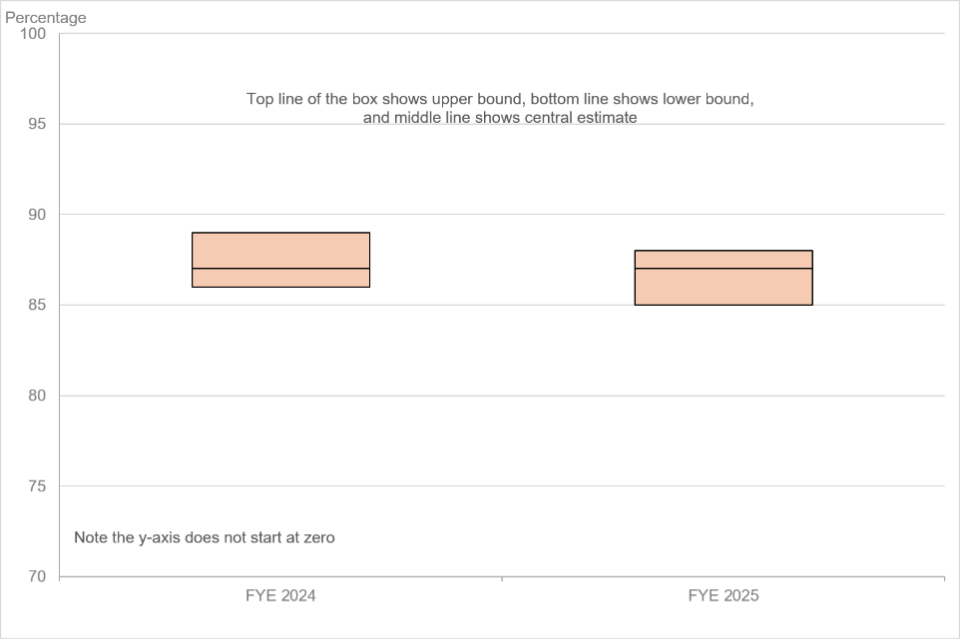
Chart shows expenditure take-up with range, of UC (or equivalent benefits), for years FYE 2024 and FYE 2025.
In FYE 2025, an estimated 87% of the total amount of Universal Credit (or equivalent benefits) that could have been claimed was claimed. This was the same expenditure take-up rate (87%) as was claimed in FYE 2024.
See Table UC2 for full data
Expenditure take-up rate of families entitled to Universal Credit (or equivalent benefits), was higher for those with children
Figure 18: Take-up range (expenditure) of UC (or equivalent benefits) by if they have children, FYE 2024 to FYE 2025, GB
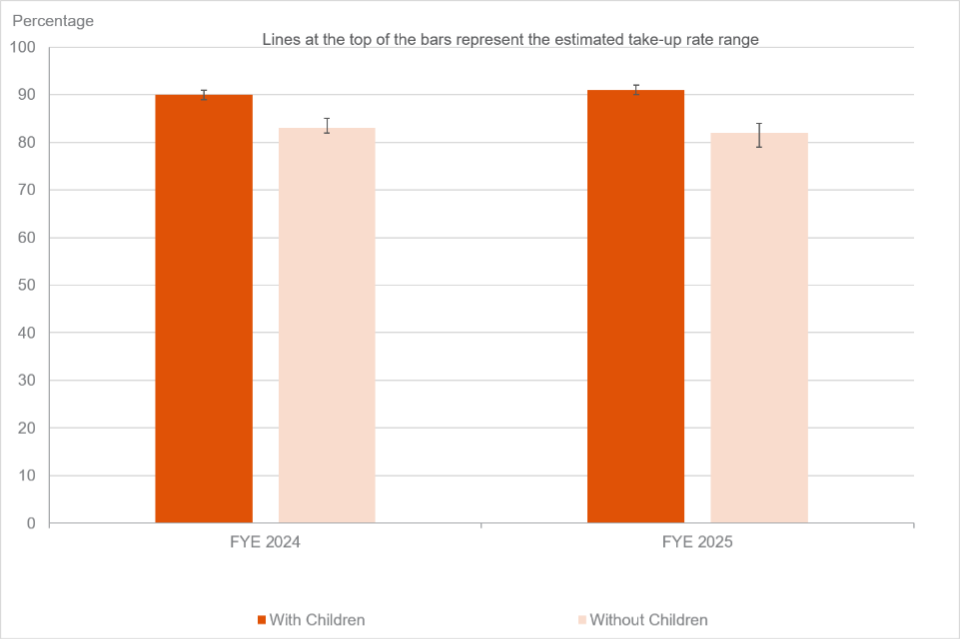
Chart shows expenditure take-up with range, of UC (or equivalent benefits) by if they have children, for years FYE 2024 and FYE 2025.
In FYE 2025, an estimated 91% of the total amount of UC (or equivalent benefits), that could have been claimed by families with children was claimed. For families without children it was 82%.
The difference in expenditure take-up rate between families with or without children is statistically significant in both financial years.
See table UC4 for full data.
Expenditure take-up rate of families entitled to Universal Credit (or equivalent benefits), was highest for singles with children
Figure 19: Take-up range (expenditure) of UC (or equivalent benefits) by family type and if they have children, FYE 2024 to FYE 2025, GB
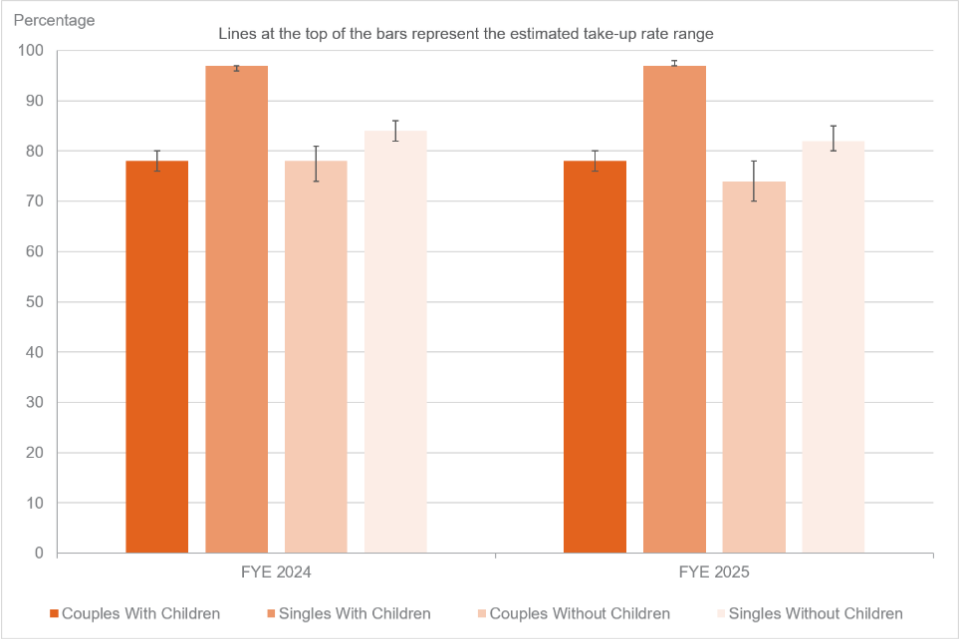
Chart shows expenditure take-up with range, of UC (or equivalent benefits) by family type, for years FYE 2024 and FYE 2025.
In FYE 2025, an estimated 97% of the total amount of UC (or equivalent benefits), that could have been claimed by singles with children was claimed. For singles without children it was 82%.
In FYE 2025, an estimated 78% of the total amount of UC (or equivalent benefits), that could have been claimed by couples with children was claimed. For couples without children it was 74%.
For both financial years, singles with children had the highest expenditure take-up rate of UC (or equivalent benefits) of the 4 family types. In both FYE 2024 and FYE 2025, the difference in expenditure take-up rate for singles with children and all other family types is statistically significant.
See table UC4 for full data.
7. Overview of methodology
The methodology for deriving the estimates of take-up is complex. Figures in this report are based on DWP administrative data, local authority administrative data, and data from the FRS. The Policy Simulation Model (PSM) is a static microsimulation model of the tax and benefit system of the UK. The source data for the model comes from the integrated FRS dataset published in March 2026. The PSM models benefit and tax credits entitlement and tax or National Insurance liability for each FRS family.
To produce the take-up estimates, information can be taken from DWP administrative data sources to look at the average number of those in receipt of the benefit along with the average amount claimed. However, because administrative benefit entitlement datasets do not exist, survey-based estimates of the population and unclaimed amounts for those who are entitled but not receiving are needed. These survey-based estimates come from the adjusted PSM dataset.
The estimates for the (ENRs) are calculated with confidence intervals which provide a lower and upper bound for the average number of ENRs and the average amount claimed. These estimates, along with the central estimates, are incorporated into the take-up formulae. Caseload and expenditure take-up rates are estimated. A point estimate is calculated. The lower and upper bound estimates of those not in receipt are used to estimate lower and upper take-up bounds. Statistical tests are performed on the point estimates to identify statistically significant differences between the take-up rates between years and between groups.
The take-up rates are based on the following definition:
(In Receipt) ÷ (In Receipt + Entitled Not in Receipt)
Where the take-up rate is defined as the proportion receiving the benefit of all those entitled (that is those receiving the benefit they are entitled to and those who are entitled to but not receiving the benefit).
This is the same formula used for the take-up rates of Pension Credit, Housing Benefit (for Pensioners) and UC (or equivalent benefits) and so we have maintained the same approach for all benefits being measured.
There are limitations to this methodology, but it aims to produce the best take-up estimates based on the evidence available.
See the background information and methodology for more on limitations and strengths, available here: background information and methodology.
Figure 20: Flow chart of how take-up estimates are calculated FYE 2025
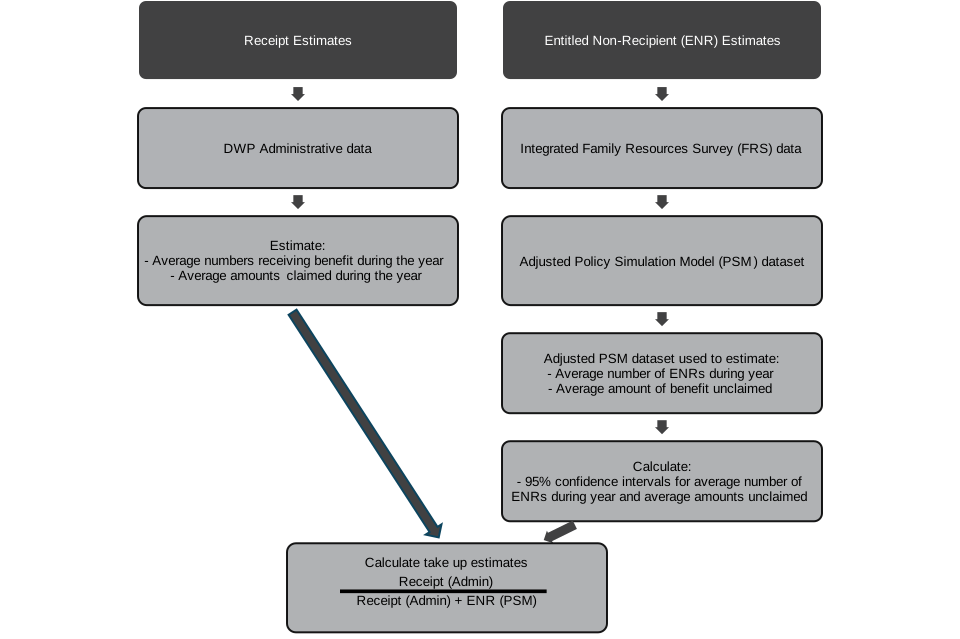
Figure composes of a flow chart that demonstrates the process to create the receipt and ENR estimates, which feed into the take-up formula. The receipt estimates come from administrative data giving an estimate for both the average numbers receiving the benefit and the average amounts claimed during the year.
The Entitled Non-Recipients (ENR) estimates come from the integrated Family Resources Survey data, which is used in the adjusted Policy Simulation Model. This estimates the average number of ENRs and the average amount of benefit unclaimed, and we calculate 95% confidence intervals.
The bottom of the flowchart shows the take-up estimates are calculated using the receipt estimates as the numerator, and the receipt and ENR estimates as the denominator.
8. About these statistics
Official statistics
The statistics covering pension age benefits (Housing Benefit for pensioners and Pension Credit) are Official Statistics.
The statistics on take-up of working age benefits (UC or equivalent) are currently labelled as Official Statistics in Development.
They have undergone thorough quality assurance in line with the Code of Practice for Statistics. All types of Official Statistics should comply with the Code of Practice for Statistics which makes sure official statistics are trustworthy, have public value, and are of high quality. The strengths and limitations of these statistics are explained in the background information and methodology document.
We will continue to refine our methodology to meet user needs and reflect changes in the benefit landscape. With the phased move to UC timetable, we expect transition into UC-only working age take-up estimates in FYE 2027. This publication is expected to be released in Autumn 2028. We will review if the estimates can be labelled as Official Statistics, and will continue to develop breakdowns provided based on user feedback.
These statistics are being published now to engage with current and potential users in the developments and make improvements that meet user needs. You can send your comments by email to: irb.takeup@dwp.gov.uk.
Our statistical practice is regulated by the Office for Statistics Regulation (OSR). OSR sets the standards of trustworthiness, quality, and value in the Code of Practice for Statistics that all producers of official statistics should adhere to.
You are welcome to contact us directly with any comments about how we meet these standards by email to: IRB.TAKEUP@DWP.GOV.UK.
Alternatively, you can contact OSR by emailing regulation@statistics.gov.uk or via the Office for Statistics Regulation website.
Other key updates within this release:
Introduction of take-up statistics for Universal Credit (or equivalent benefits) for FYE 2024 and FYE 2025 as Official Statistics in Development, in the FYE 2025 release. This publication includes new tables and also an updated background information and methodology document.
In March 2026 the first integrated Family Resources Survey based on linked benefits data was published, relating to FYE 2025 data. This has no impact on the take-up estimates as the FYE 2024 results were based on the same linking approach, but in effect means one less step in producing the publication as the administrative data linking is already incorporated in the source FRS data. For further details, please access this technical paper and quality assessment report.
We have made a methodological improvement in earlier years to account for leap years. This affects the conversion from weekly to annual expenditure estimates, but changes are small. This has been implemented within this FYE 2025 release and therefore previous data should not be used.
See the background information and methodology for more information, available here: background information and methodology.
Where to find out more
Further outputs and reference tables from take-up analysis, alongside our background information and methodology, which provides additional detail on how we estimate the measures reported here, and release strategy, are available on the income-related benefits collections page.
Take-up of benefits can be affected by several factors. Trying to explain the reasons for non-take-up is difficult and we do not have the data in our modelling to do this. The background information and methodology also includes information on issues relating to the take-up of benefits which were reviewed in a paper by Eurofound.
Read more information on reasons for non-take-up:
DWP released an ad hoc publication, “Analysis of households potentially eligible for Pension Credit, and eligible households in receipt of Pension Credit – 2023/24”, in October 2025. This publication provided analysis of the characteristics of households potentially eligible for, but not claiming, Pension Credit with, a focus on local area estimates.
For further information please see the ad hoc publication .
DWP release a publication to go alongside the annual Fraud and Error in the Benefit system publication. This is called “Unfulfilled eligibility in the benefit system Financial Year Ending (FYE) 2025”.
This publication estimates how much extra money benefit claimants could be getting if they told DWP accurately about their circumstances. These people are already getting some money on a certain benefit but may not be getting all the money they could be eligible for on this benefit – this is called unfulfilled eligibility. This complements the Income-related benefits: estimates of take-up publication which focuses on ENRs.
For further information please contact Fraud and Error Measurement Analysis (FEMA) at enquiries.fema@dwp.gov.uk.
DWP statistics on benefit receipt and expenditure:
Information on entitlement and how to claim a benefit.
Other Official statistics
DWP official statistics are published on GOV.UK.
In accordance with the Code of Practice for Statistics, DWP official statistics are announced on the GOV.UK statistics release calendar.
Using the take-up estimates for analysis
Survey data
The ENR estimates in this publication are based on modelled survey data, and it is therefore subject to sampling variation and other forms of error associated with a sample survey.
To improve the accuracy of identifying the number of ENRs, data linking allows recorded benefit amounts in DWP administrative data to replace reported FRS amounts. In March 2026 the first integrated Family Resources Survey based on linked benefits data was published, relating to FYE 2025 data. This has no impact on the take-up estimates as the FYE 2024 results were based on the same linking approach, but in effect means one less step in producing the publication as the administrative data linking is already incorporated in the source FRS data.
For further details, please access this technical paper and quality assessment report.. The FRS survey data used in the production of take-up statistics is not designed specifically to measure entitlement criteria to the same extent as an application for a specific benefit. It is a multi-purpose household survey.
Private Households
Due to the restrictions in modelling and available data, certain populations are excluded from our analysis. The figures presented in this publication and accompanying reference tables only include those living in private households in GB. As a result of the exclusions noted, recipient totals and expenditure estimates in this report may differ from those in other published sources.
Sampling error
Results from surveys are estimates and not precise figures. In general terms the smaller the sample size, the larger the uncertainty.
Policy Simulation Model
As a model, the PSM is subject to a range of assumptions, beyond that of a typical survey. Of particular importance to take-up statistics are the methodologies for estimating entitlement and specific assumptions for making population estimates from the sample (known as grossing). These are described in more depth in the background information and methodology.
Statistical significance
This is a technical concept that says whether a reported change is likely to have arisen only by chance due to variations in the sampling. We calculate 95% confidence intervals around estimates in take-up which sets a standard that, where any change is reported as statistically significant, there is less than a 1 in 20 chance that the reported difference is due to sampling variation and there is no real underlying change.
Statistically significant differences in this publication are clearly stated and so if not stated, this means that the difference is not statistically significant.
Interpretation
Care should be taken when interpreting take-up statistics. For instance, if the upper limit of a caseload take-up range is 90%, this does not mean that at least 10% of the entitled population never take up their entitlement. This is because some of the shortfall in take-up may represent a delay in claiming or processing benefit that is eventually received. The confidence intervals are therefore used to represent the range in which we estimate the overall true rate of take-up, averaged over the whole year, lies.
We present 95% confidence intervals alongside our estimates, as a measure of sampling error. As with any analysis using survey data there will be sample variation which can impact estimates year on year.
Our modelled ENR estimates are based on certain assumptions for eligibility to benefits and the amount that would be received. So, there is also uncertainty in the estimates depending on the assumptions used. There are limitations to how much variation we can account for. The amount of UC that a family receives from one assessment period to the next can vary, as does the amount by family, due to the different elements of UC. For the working age estimates there is the assumption of no change to the amount being claimed by a family throughout the year which does lead to uncertainty in the results as by design, the amounts received by families can change during the year, and our estimates cannot reflect that variability. Whereas PC has less within-year variability than UC and so there is little additional uncertainty in our estimates, as the assumption of no change throughout the year generally reflects what happens in practice.
Enquiries and feedback
DWP would like to hear your views on our statistical publications. If you use any of our statistics publications, we would be interested in hearing what you use them for and how well they meet your requirements. Please send your comments by email to: IRB.TAKEUP@DWP.GOV.UK.
Feedback on the content, relevance, accessibility and timeliness of these statistics and any non-media enquiries should be directed by email to: IRB.TAKEUP@DWP.GOV.UK
For media enquiries on these statistics, please contact the DWP press office
Lead Statistician: Kate Martin, Julia Jagelman
Producers of this release: John Bilverstone, Tommi Kelha, Priti Sunuwar, Danny Kiddier
ISBN: 978-1-78659-971-1
Next edition: Between September and October 2027