Economic labour market status of individuals aged 50 and over, trends over time: September 2026
Published 24 September 2026

© Crown copyright 2026
This publication is licensed under the terms of the Open Government Licence v3.0 except where otherwise stated. To view this licence, visit nationalarchives.gov.uk/doc/open-government-licence/version/3 or write to the Information Policy Team, The National Archives, Kew, London TW9 4DU, or email: psi@nationalarchives.gov.uk.
Where we have identified any third party copyright information you will need to obtain permission from the copyright holders concerned.
This publication is available at https://www.gov.uk/government/statistics/economic-labour-market-status-of-individuals-aged-50-and-over-trends-over-time-september-2026/economic-labour-market-status-of-individuals-aged-50-and-over-trends-over-time-september-2026
1. Introduction
The UK has an ageing population and workforce; therefore, it is of growing importance to understand the economic labour market status of individuals approaching, at, and above State Pension age (SPa) and how trends are changing over time.
This publication details the trends over time, and comparisons with 35 to 49-year-olds, in the economic labour market status of individuals aged 50 and over.
Analysis is provided on the 3 headline measures used to monitor progress:
- Employment rate of people aged 50 years and over, by five-year age bands and gender
- Average age of exit from the labour market, by gender
- Employment rate gap between people aged 50 to 64 and people aged 35 to 49 years, broken down by five-year age band and gender
In addition to the measures outlined above, analysis is provided on wider characteristics of those aged 50 and over such as data on economic inactivity rates, reasons for inactivity, employment by industrial sector and region, employment by ethnicity and education as well as working patterns.
This is an annual release, and the next release will be in September 2027.
2. Main stories
The main stories are:
- from 2019 (pre-pandemic) to 2022 the employment rate of people aged 50 to 64 years decreased each year from a record high in 2019 of 72.6% to 70.4% in 2022, from where it has increased each year since. Over the past year, the employment rate of people aged 50 to 64 years has increased by 0.6 percentage points to 72.2%, this change is not statistically significant
- the employment rate gap between people aged 35 to 49 years and 50 to 64 years in 2026 is 12.9 percentage points, which is a reduction from the 2025 figure of 14.1 percentage points. This continues the trend of a statistically significant decrease in the employment rate gap from 2023, when the gap was 14.5 percentage points. This is due to a small increase in the employment rate of people aged 50 to 64 years
- of the countries in the UK, Wales has the lowest employment rate among those aged 50 to 64 years at 65.9%, and England has the highest employment rate at 73%. Wales has seen an increase in the employment rate of those aged 50 to 64 years from 2025 to 2026 by 2.4 percentage points, though this increase is not statistically significant
- the employment rate gap between individuals with no qualifications and those holding any type of qualification was larger than any employment rate gap observed between the levels of qualification obtained. For example, the employment rate gap between individuals aged 50 to 64 years with no qualifications and those with ‘GCSE grades A* to C or equivalent’ was 22.2 percentage points in 2026. This is statistically significantly larger than the employment rate gap between those with ‘GCSE grades A* to C or equivalent’ and degree level qualifications, with the gap standing at 12.3 percentage points in 2026
- the average age of exit from the labour market has increased for women over the past year, once again reaching the highest recorded level on ONS data since annual reporting began in 1984. The 2025 average age of exit for women was 64.7 years and has increased by 0.4 years to 65.1 years in 2026. The 2025 average age of exit for men was 65.8 and is the same value in 2026
- the inactivity rate in 2026 for those aged 50 to 64 continues to remain slightly higher than the pre-pandemic rate which was 25.5% in 2019. However, the rate has decreased by 0.4 percentage points in the last year, from 26.1% in 2025 to 25.7% in 2026, this change is not statistically significant
- the economic inactivity rate for women aged 50 to 64 remains statistically significantly higher, at 29% in 2026, when compared to men of the same age (22.2%)
- being sick, injured or disabled continues to be the main reason why people aged 50 to 64 years are economically inactive in the labour market, with 43.8% of inactive individuals giving this as the main reason
- of economically inactive people aged 50 to 64 years, women (16.5%) were twice as likely as men (7.4%) to report ‘looking after home or family’ as the main reason for not looking for work, a statistically significant difference. Meanwhile, the proportion of men giving the main reason as ‘retired’ (35.1%) was statistically significantly higher than women (28.2%)
- the State Pension age has a statistically significant impact on employment and inactivity rates of older adults. From age 65 to 66 the employment rate decreases by 13.5 percentage points and the inactivity rate increases by a similar proportion (13.8 percentage points)
- the unemployment rate for those aged 50 to 64 has decreased by 0.2 percentage points from 3.1% in 2025 to 2.9% in 2026, this change is not statistically significant. The unemployment rate for this age group has been fluctuating, though generally on a downward trend, over the past ten years, with a low of 2.4% in 2024
- over the past year, of those who are unemployed, the gap between those aged 50 to 64 and aged 35 to 49 who are long-term unemployed has statistically significantly decreased from 1.6 percentage points to 0.7 percentage points
- around 866,000 individuals aged 50 to 64 are either actively seeking work, or are inactive but are willing or would like to work
3. What you need to know
This is the tenth annual publication on the economic labour market status of individuals aged 50 and over in the UK. It provides more detailed breakdowns of the labour market outcomes of older workers over time than those routinely published by the Office for National Statistics (ONS) in their monthly Labour Market Statistics. Read previous versions of this publication.
This release uses data from the Labour Force Survey (LFS) which is produced by the ONS. This covers the period up to April to June 2026. It should be noted that on 15 September 2026, the ONS released their latest labour market statistics which cover a later period from May to July 2026. We use quarter 2 (April to June) of the LFS to produce the most consistent analysis over the full time period from 1984 to 2026, read more about this in the background and methodology document accompanying this release. Therefore headline rates and levels will not match the latest labour market statistics release, but are covered by the previous labour market statistics release.
Recent increased volatility of Labour Force Survey (LFS) estimates, resulting from smaller achieved sample sizes, means that the quality of quarterly changes should be treated with caution. The ONS recommends using these statistics as part of a suite of labour market indicators, alongside Workforce Jobs, Claimant Count data and Pay As You Earn (PAYE) Real Time Information (RTI) estimates.
Due to this, caution is also advised when interpreting short-term changes in headline rates and it is advised to make longer term comparisons that offer more stability.
When interpreting results, particularly comparing time periods, users should be aware of the potential effect of COVID-19 from 2020.
Latest overall labour market statistics
For the period covered by this release, April to June 2026, the ONS labour market statistics (not seasonally adjusted figures) show the UK employment rate (for people aged 16 to 64) was estimated at 75.0%, below estimates of a year ago, with no change from the previous quarter. It still remains lower than the pre-COVID-19 pandemic rate.
The overall unemployment rate increased from the COVID-19 pandemic until the end of 2020, before dropping close to a 50 year low in June to August 2022. It has subsequently largely been increasing. The unemployment rate (for people aged 16 to 64, not seasonally adjusted) for April to June 2026 decreased by 0.2 percentage points on the quarter to 4.9% and is above estimates of a year ago.
The economic inactivity rate (for people aged 16 to 64, not seasonally adjusted) increased during the COVID-19 pandemic and has since fluctuated around this increased rate. The economic inactivity rate for April to June 2026 is 21.1% and has increased by 0.1 percentage points on the quarter. The largest reason for inactivity is due to long-term sickness, which has remained the biggest reason since June to September 2021.
The ONS publish Official Statistics from HM Revenue and Customs’ (HMRC) PAYE RTI system on the number of payrolled employees. Unlike the LFS, which is the data source for this publication, payrolled data does not cover the number of people who are self-employed. The most recent estimate of payrolled employees for July 2026 shows the number of payrolled employees fell by 0.3% compared to a year ago, a fall of 94,000. The number of payrolled employees who are aged 50 plus also fell compared to a year ago and now stands at 9.4 million employees.
Between July 2025 and July 2026, the number of payrolled employees aged 50 to 64 decreased by 81,000 (1.0%) to 8.06 million, whilst the number of employees aged 65 and over increased by 68,000 (5.0%) to 1.3 million. During the same period, payrolled employees aged 35 to 49 increased by 54,000 (0.5%) to 10.2 million.
Changes to State Pension age (SPa)
Recent trends in employment should also be considered in the context of changes to State Pension age (SPa). Since 2010, women’s SPa gradually increased from 60 years, rising to 65 years by November 2018, at which point it became the same as men’s SPa. In October 2020, SPa for both men and women increased to 66 years. A transition toward 67 is legislated to take place gradually between 2026 and 2028. Under Section 27 of the Pensions Act 2014 the Secretary of State has a statutory duty to periodically review whether the existing rules about State Pension age are appropriate. To date, there have been two statutory Government reviews of State Pension age, with a third review in progress.
Working age is recognised internationally as people aged 16 to 64 years, whereby the State Pension age in the UK was formerly the upper limit of the working age definition. To understand trends over time, this release will continue to report on the 50 to 64 age group. However, data on people aged 50 to 65 years can be viewed in the tables accompanying this release.
Economic Labour Market Status
Employment and other labour market concepts used in this release are defined in the same way as National Statistics published by the ONS in their Labour Market statistics. The ONS definitions can be found on the ONS website. In this report, everybody aged 16 or over is defined as either employed, unemployed or economically inactive.
Employed is defined as being in work, including those working part-time and those who are self-employed.
Economic inactivity is defined as not working, have not been looking for work within the last four weeks or who are unable to start work within the next two weeks. Examples of economically inactive people include: people not looking for work because they are students; looking after the family or home; because of illness or disability or because they have retired.
Unemployment is defined as not working, have been looking for work within the last four weeks and are able to start work within the next two weeks. A common misconception is that the unemployment statistics are a count of people on benefits; this is not the case as they include unemployed people not claiming benefits.
Statistical significance
Comparisons made in the narrative of this release have only been tested for statistical significance at the 95% level when stated that the comparison “is statistically significant” or “is not statistically significant”. Not all comparisons within the narrative have been tested for statistical significance. Within the commentary of our statistical bulletins, we will avoid using the term “significant” to describe trends in our statistics and will always use “statistically significant” to avoid any confusion for our users.
Read further details on statistical significance in the background information and methodology accompanying this release.
4. Average age of exit from the labour market
In the context of an ageing population, and increases in life expectancy, it is increasingly important to understand whether people are continuing to work or spending more time in retirement or other forms of economic inactivity. The average age of exit from the labour market is broken down for men and women due to the historic difference of state pension age for men and women. See What you need to know for further details.
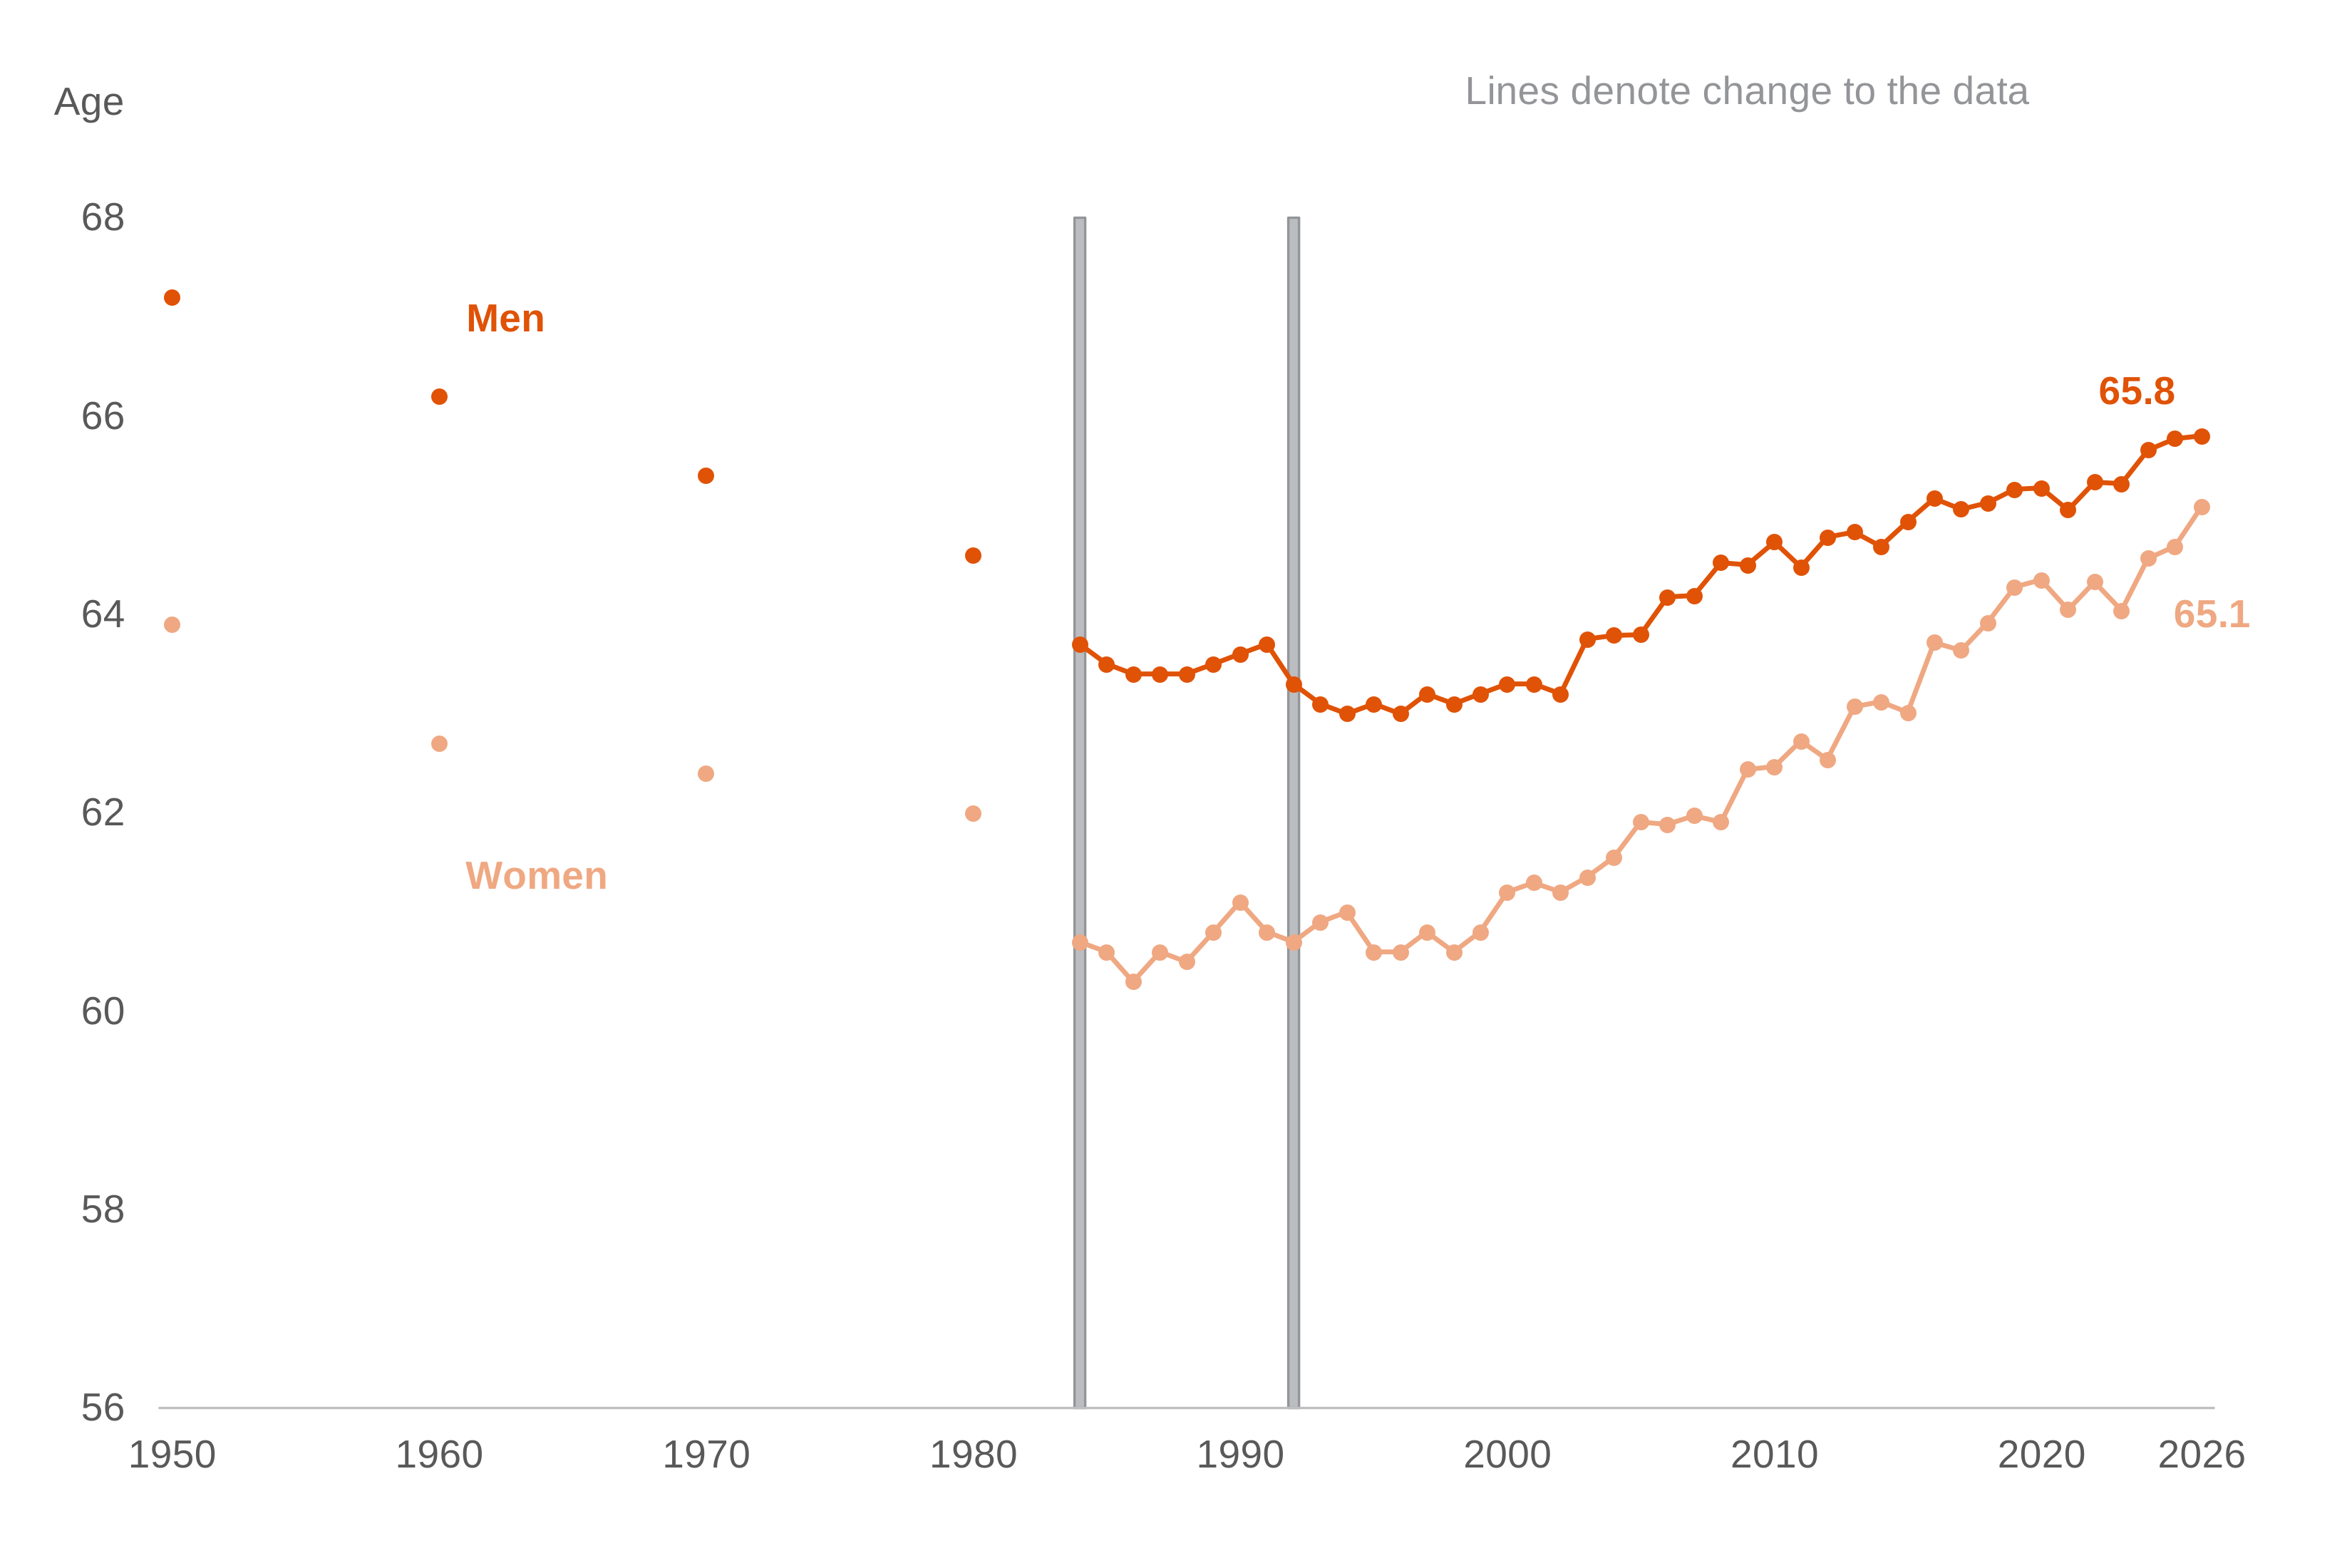
In 1950, the average age of exit for men was aged 67.2 years. The average age of exit for men fell until 1980, when there was a change to the data source. Details of the change can be found in the background information and methodology. Since this point, the average age of exit for men has been steadily increasing.
The average age of exit for men has increased by 2.8 years since 1996 when it reached its lowest point of aged 63 years. The average age of exit has since fluctuated but shown a gradual upward trend. During this time, the State Pension age for men and women increased from 65 to 66 years by October 2020.
In 2026, the average age of exit for men from the labour market reached the highest recorded level using ONS data, at age 65.8 years, which is no change from 2025 figure.
The average age of exit for women in 1950 was 63.9 years. The average age of exit fell, reaching its lowest point of 60.3 years in 1986. Since then, the average age of exit for women has increased by 4.8 years to 65.1 years in 2026, the highest recorded level using ONS data.
Between 2009 (before the change to SPa for women) and 2018, the period in which SPa for women incrementally increased from age 60 to 65 years to equal the SPa for men, the average age of exit for women increased by 1.5 years, from 62.4 to 63.9 years. The average age of exit of women continued to increase by 0.4 years to 64.3 years in 2020, when SPa for men and women increased to 66 years.
Since 2021 the average age of exit for women has followed a similar upward trend to men, rising from 64.1 in 2021 to 65.1 in 2026. This includes an increase of 0.4 years over the past year from 64.7 years in 2025 to 65.1 years in 2026.
Average age of men and women exiting from the labour market, 1950 to 2026, UK
Source: Table 1 Economic Labour Market Status of individuals aged 50 and over statistics.
5. Employment
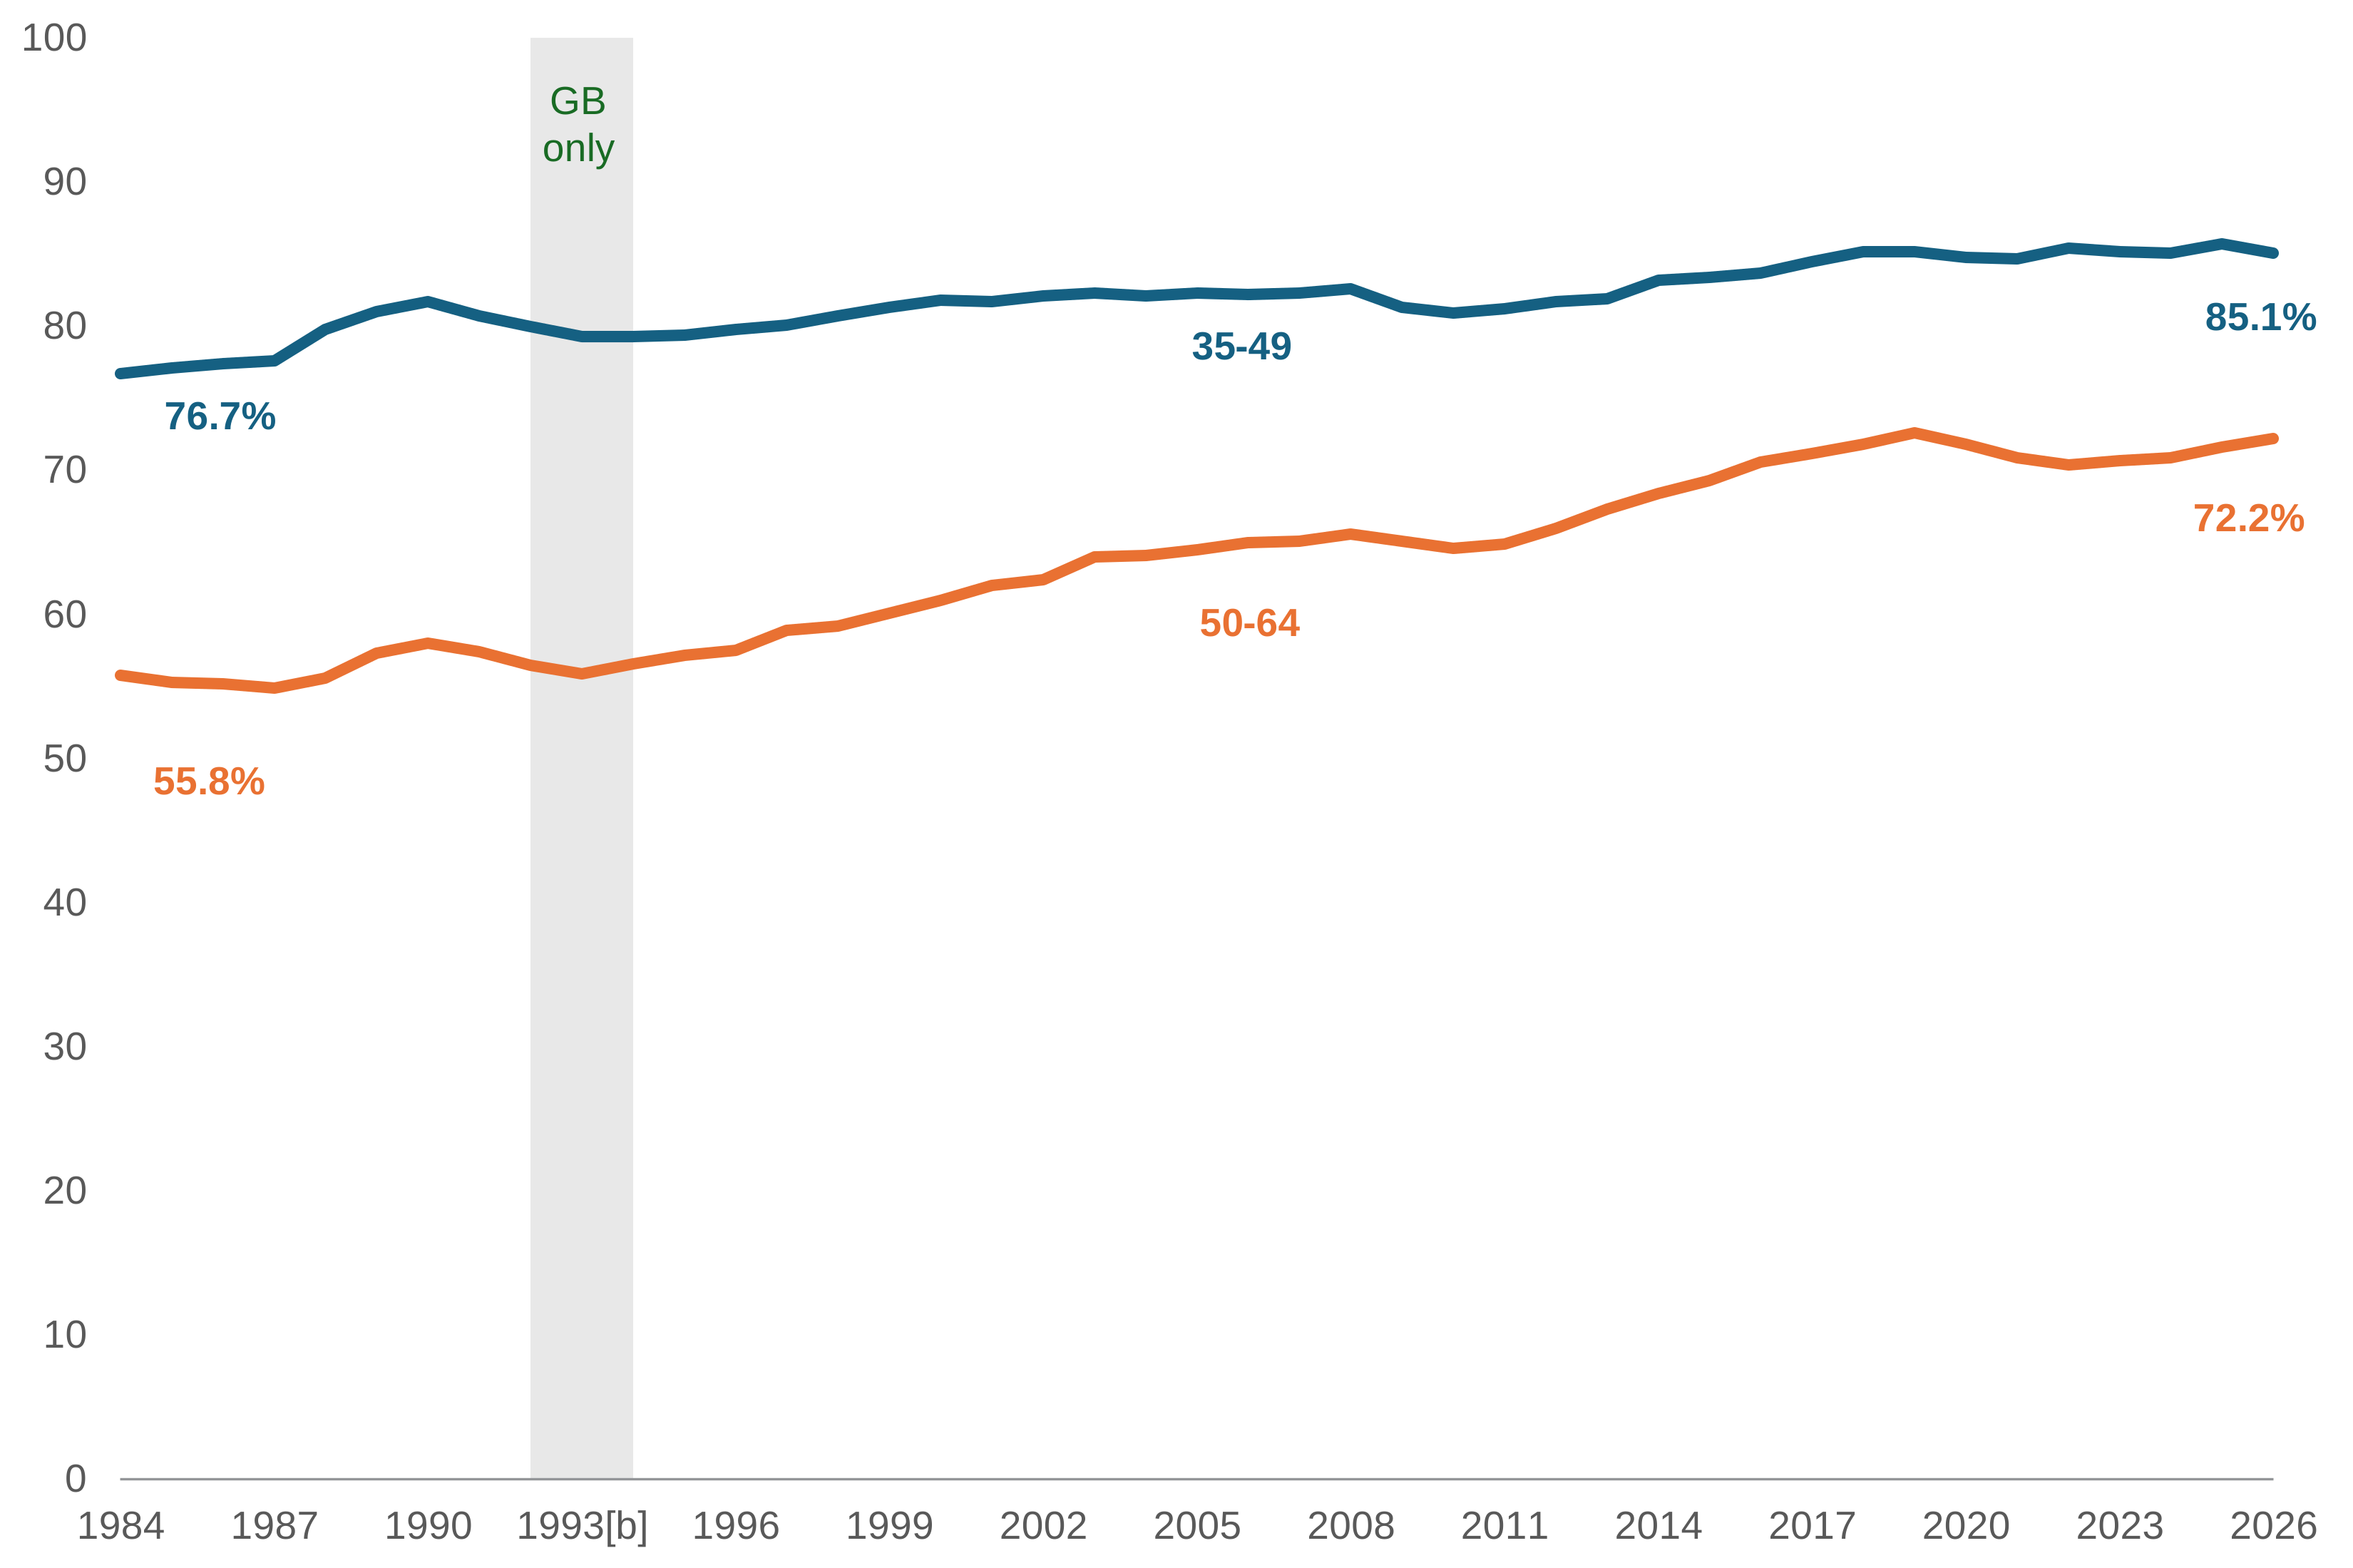
The employment rate for people aged 50 to 64 years was 72.2% in 2026. This rate has been increasing steadily since the mid-1990s when it stood at 57.2% in 1995. The employment rate for this age group was at its highest at 72.6% in 2019 and then it declined each year to 70.4% in 2022. In the past year, the employment rate has increased by 0.6 percentage points to 72.2%, this increase is not statistically significant.
The employment rate gap between those aged 35 to 49 years and those aged 50 to 64 years stood at its lowest point in 2019 at 12.6 percentage points. Since then, it steadily increased to 15.0 percentage points in 2022 but has statistically significantly decreased over the past two years, reaching 12.9 percentage points in 2026.
Over the past year, the employment rate gap has decreased for men by 0.2 percentage points and has decreased for women by 2.1 percentage points, although this is not statistically significant in both cases.
Employment rates of people aged 35 to 49 years and people aged 50 to 64 years, UK
Source: Table 2 Economic Labour Market Status of individuals aged 50 and over statistics.
Over the past ten years, the employment rate for those aged 50 to 54 and 55 to 59 has been relatively flat, with fluctuations across this period. In comparison, those aged 60 to 64 and 65 to 69 have shown gradual upward trends. For both men and women 65 to 69 years, the increase over the past ten years was statistically significant. Within the 60-64 age group women have seen a statistically significant change in employment rate of 12.7 percentage points over the last ten years. By comparison, the employment rate for men aged 60 to 64 increased by 1.0 percentage points over the last ten years, which was not statistically significant. Over the past year, the employment rates for all the above five-year age bands (but not the 35-49 age band) have increased with the largest increases for those aged 60 to 64 and 65 to 69, increasing by 1.3 percentage points each to 59.2% and 29.7% respectively, though this change is not statistically significant.
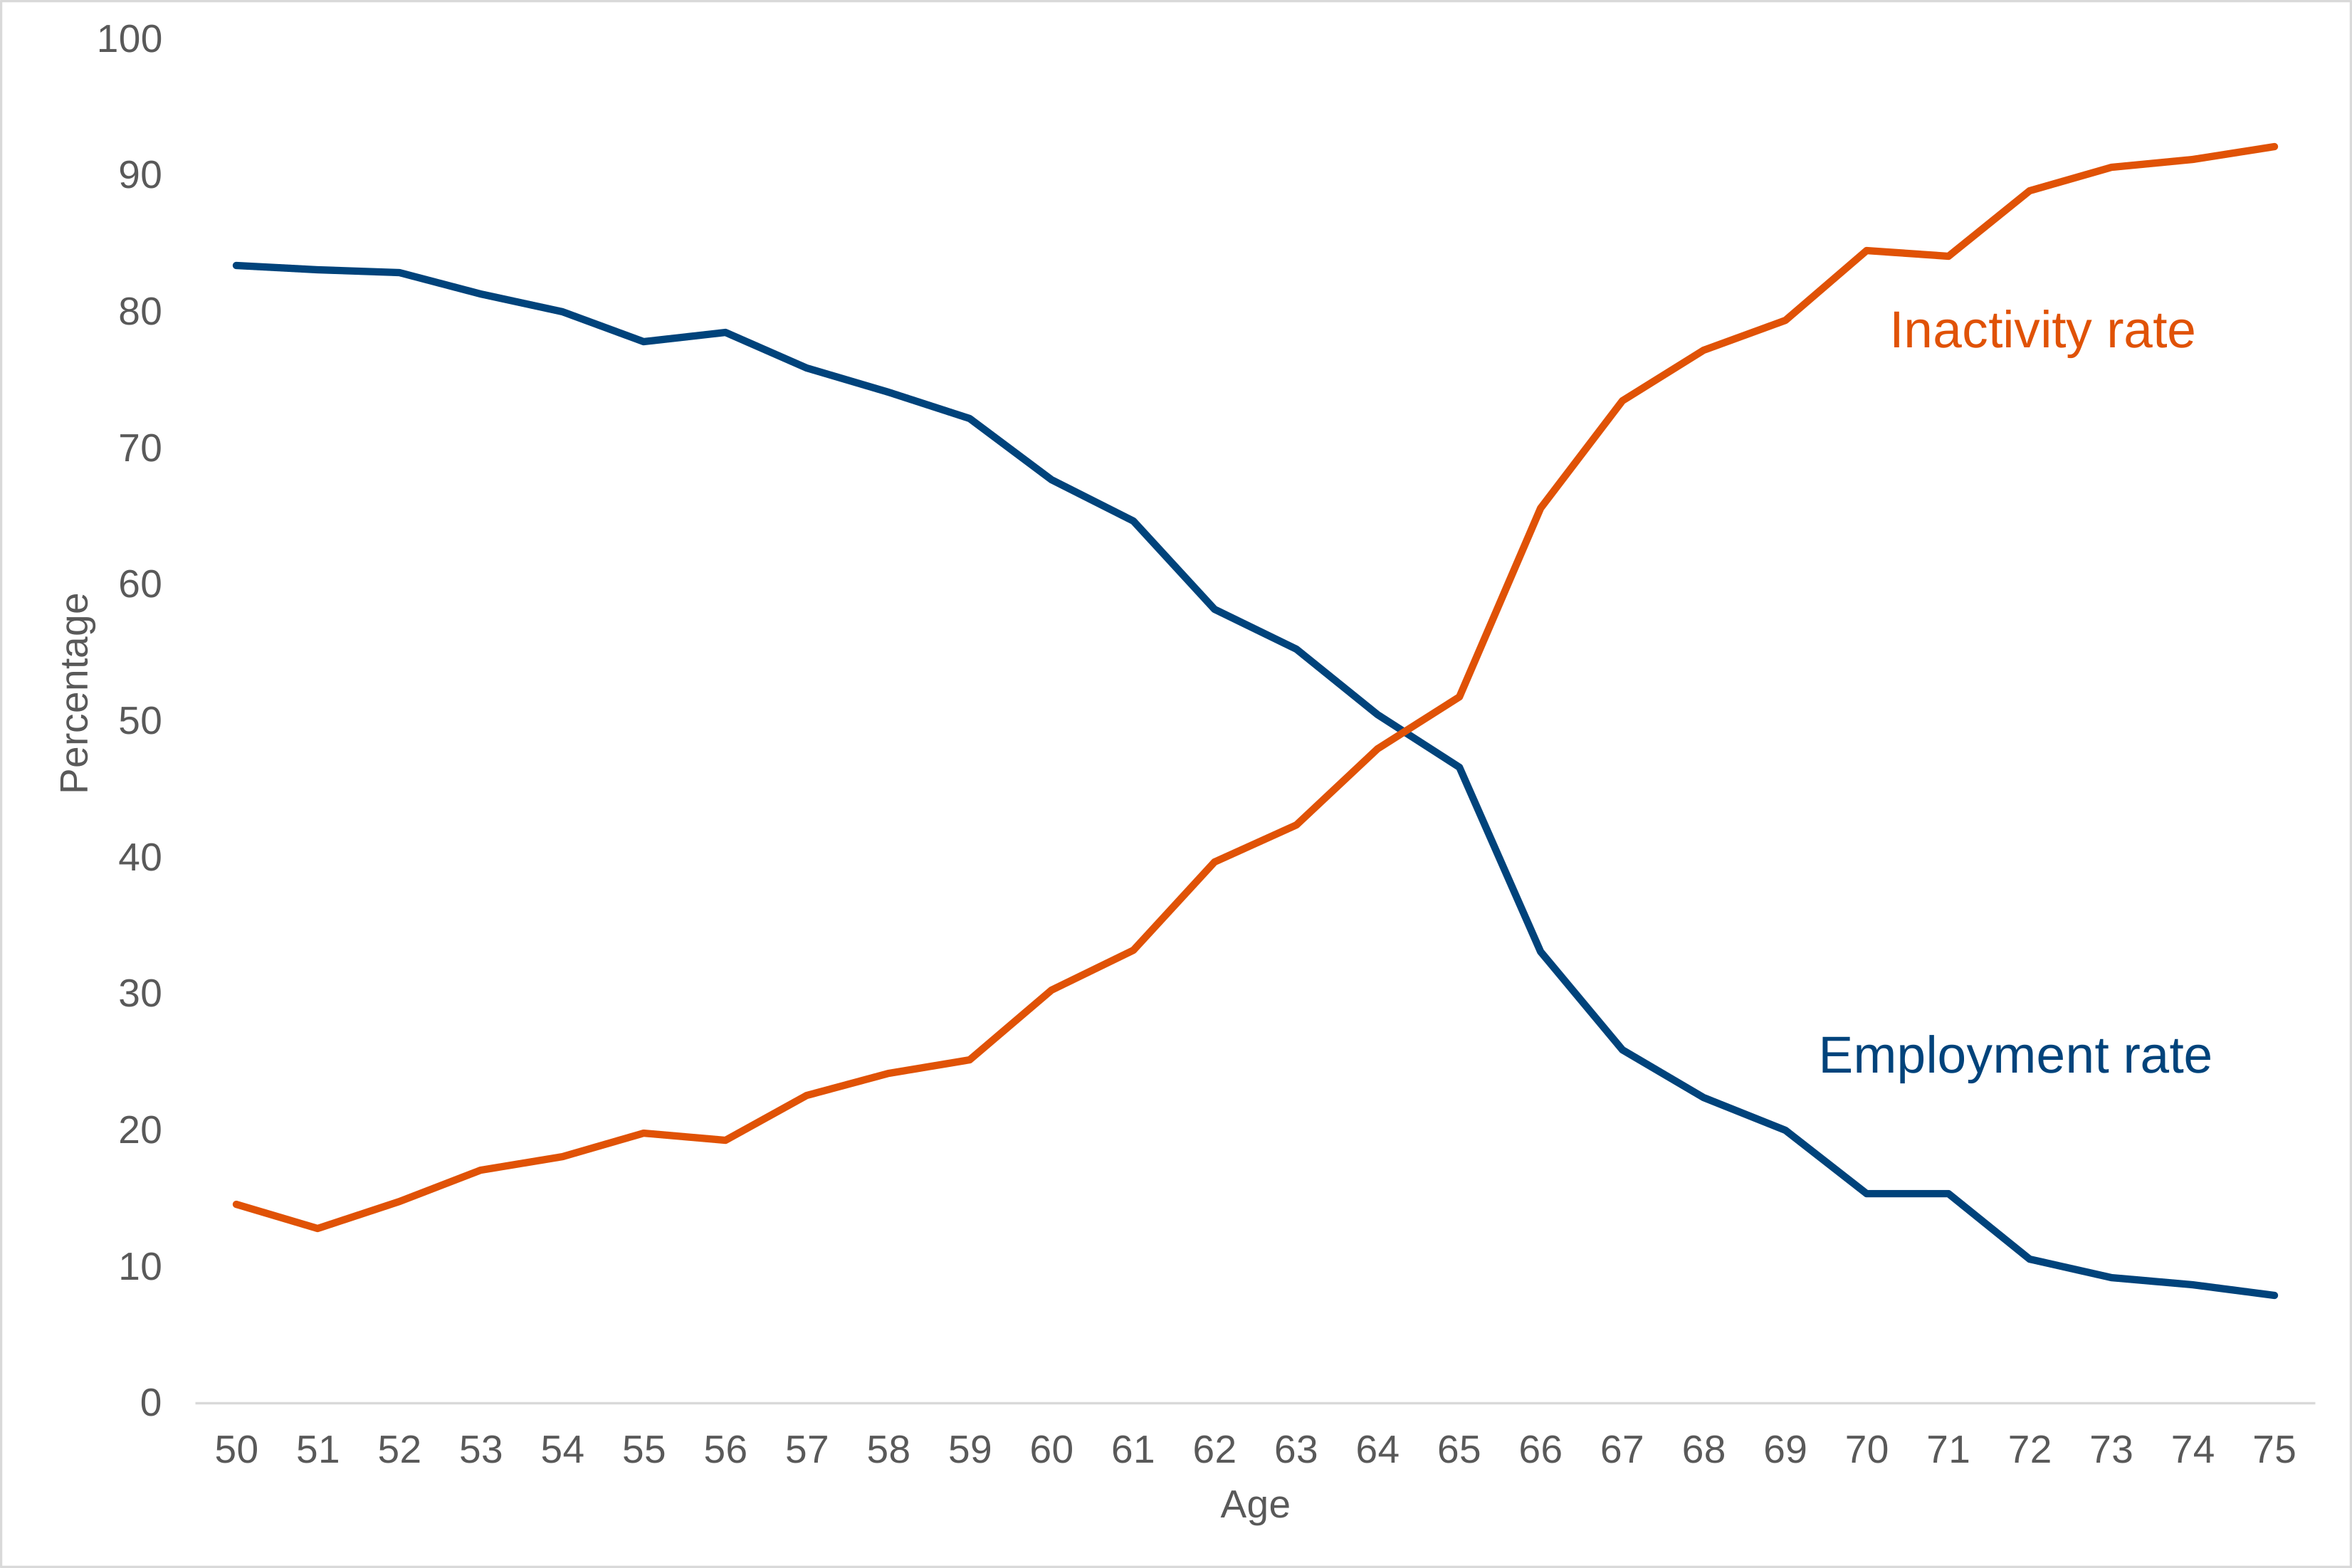
As people approach SPa, the rate of employment statistically significantly declines, and the inactivity rate statistically significantly increases as people leave the labour market “early”. A year before SPa, at age 65, over half (51.8%) of men and women are inactive. In 2026, at age 65 years, the employment rate was 46.6%, which then decreased at age 66 years to 33.1%.
However, the employment rate of adults at age 65 has been increasing over time and has seen one of the largest increases in employment rates compared to other individual age bands from age 50 to 75 over the last 10 years. In 2016 the employment rate of 65-year-olds was 28.2%, it statistically significantly increased to 39.2% in 2021 and further increased to 46.6% in 2026, this change is also statistically significant. This increase is likely to be largely driven by changes to SPa over this period.
Employment and Inactivity rates by individual age, 2026, UK
Source: Table 19 Economic Labour Market Status of individuals aged 50 and over statistics.
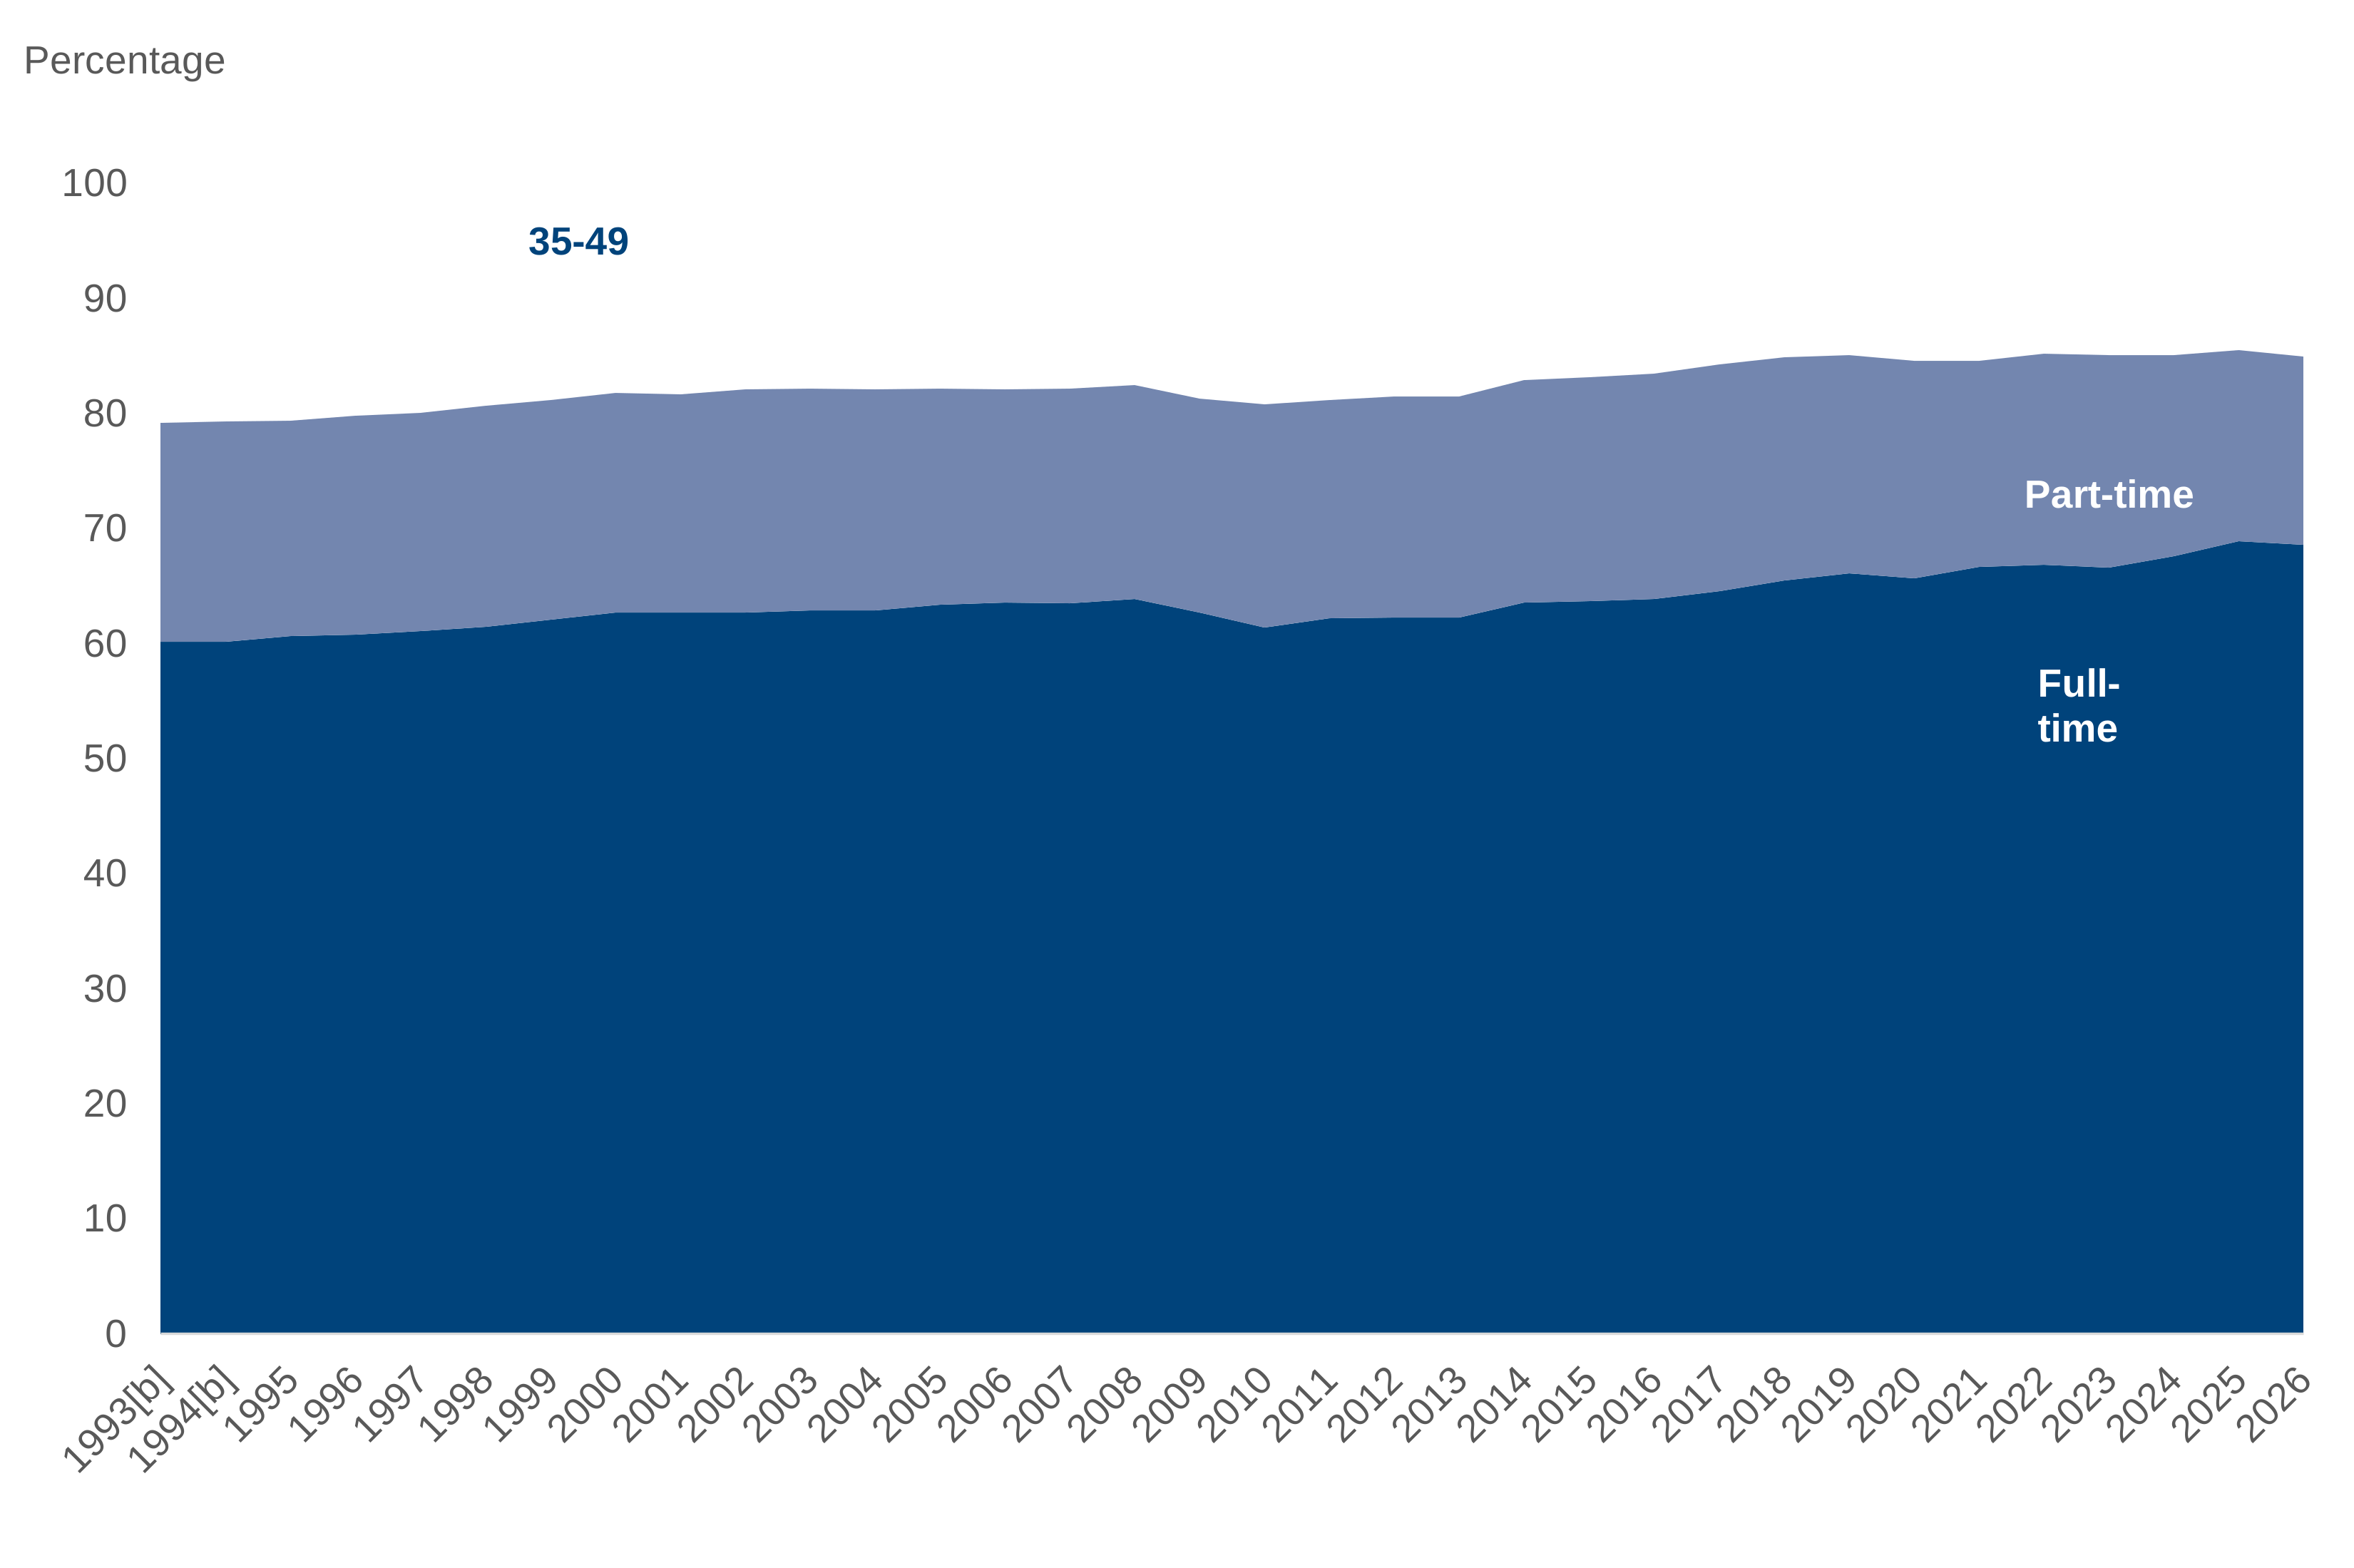
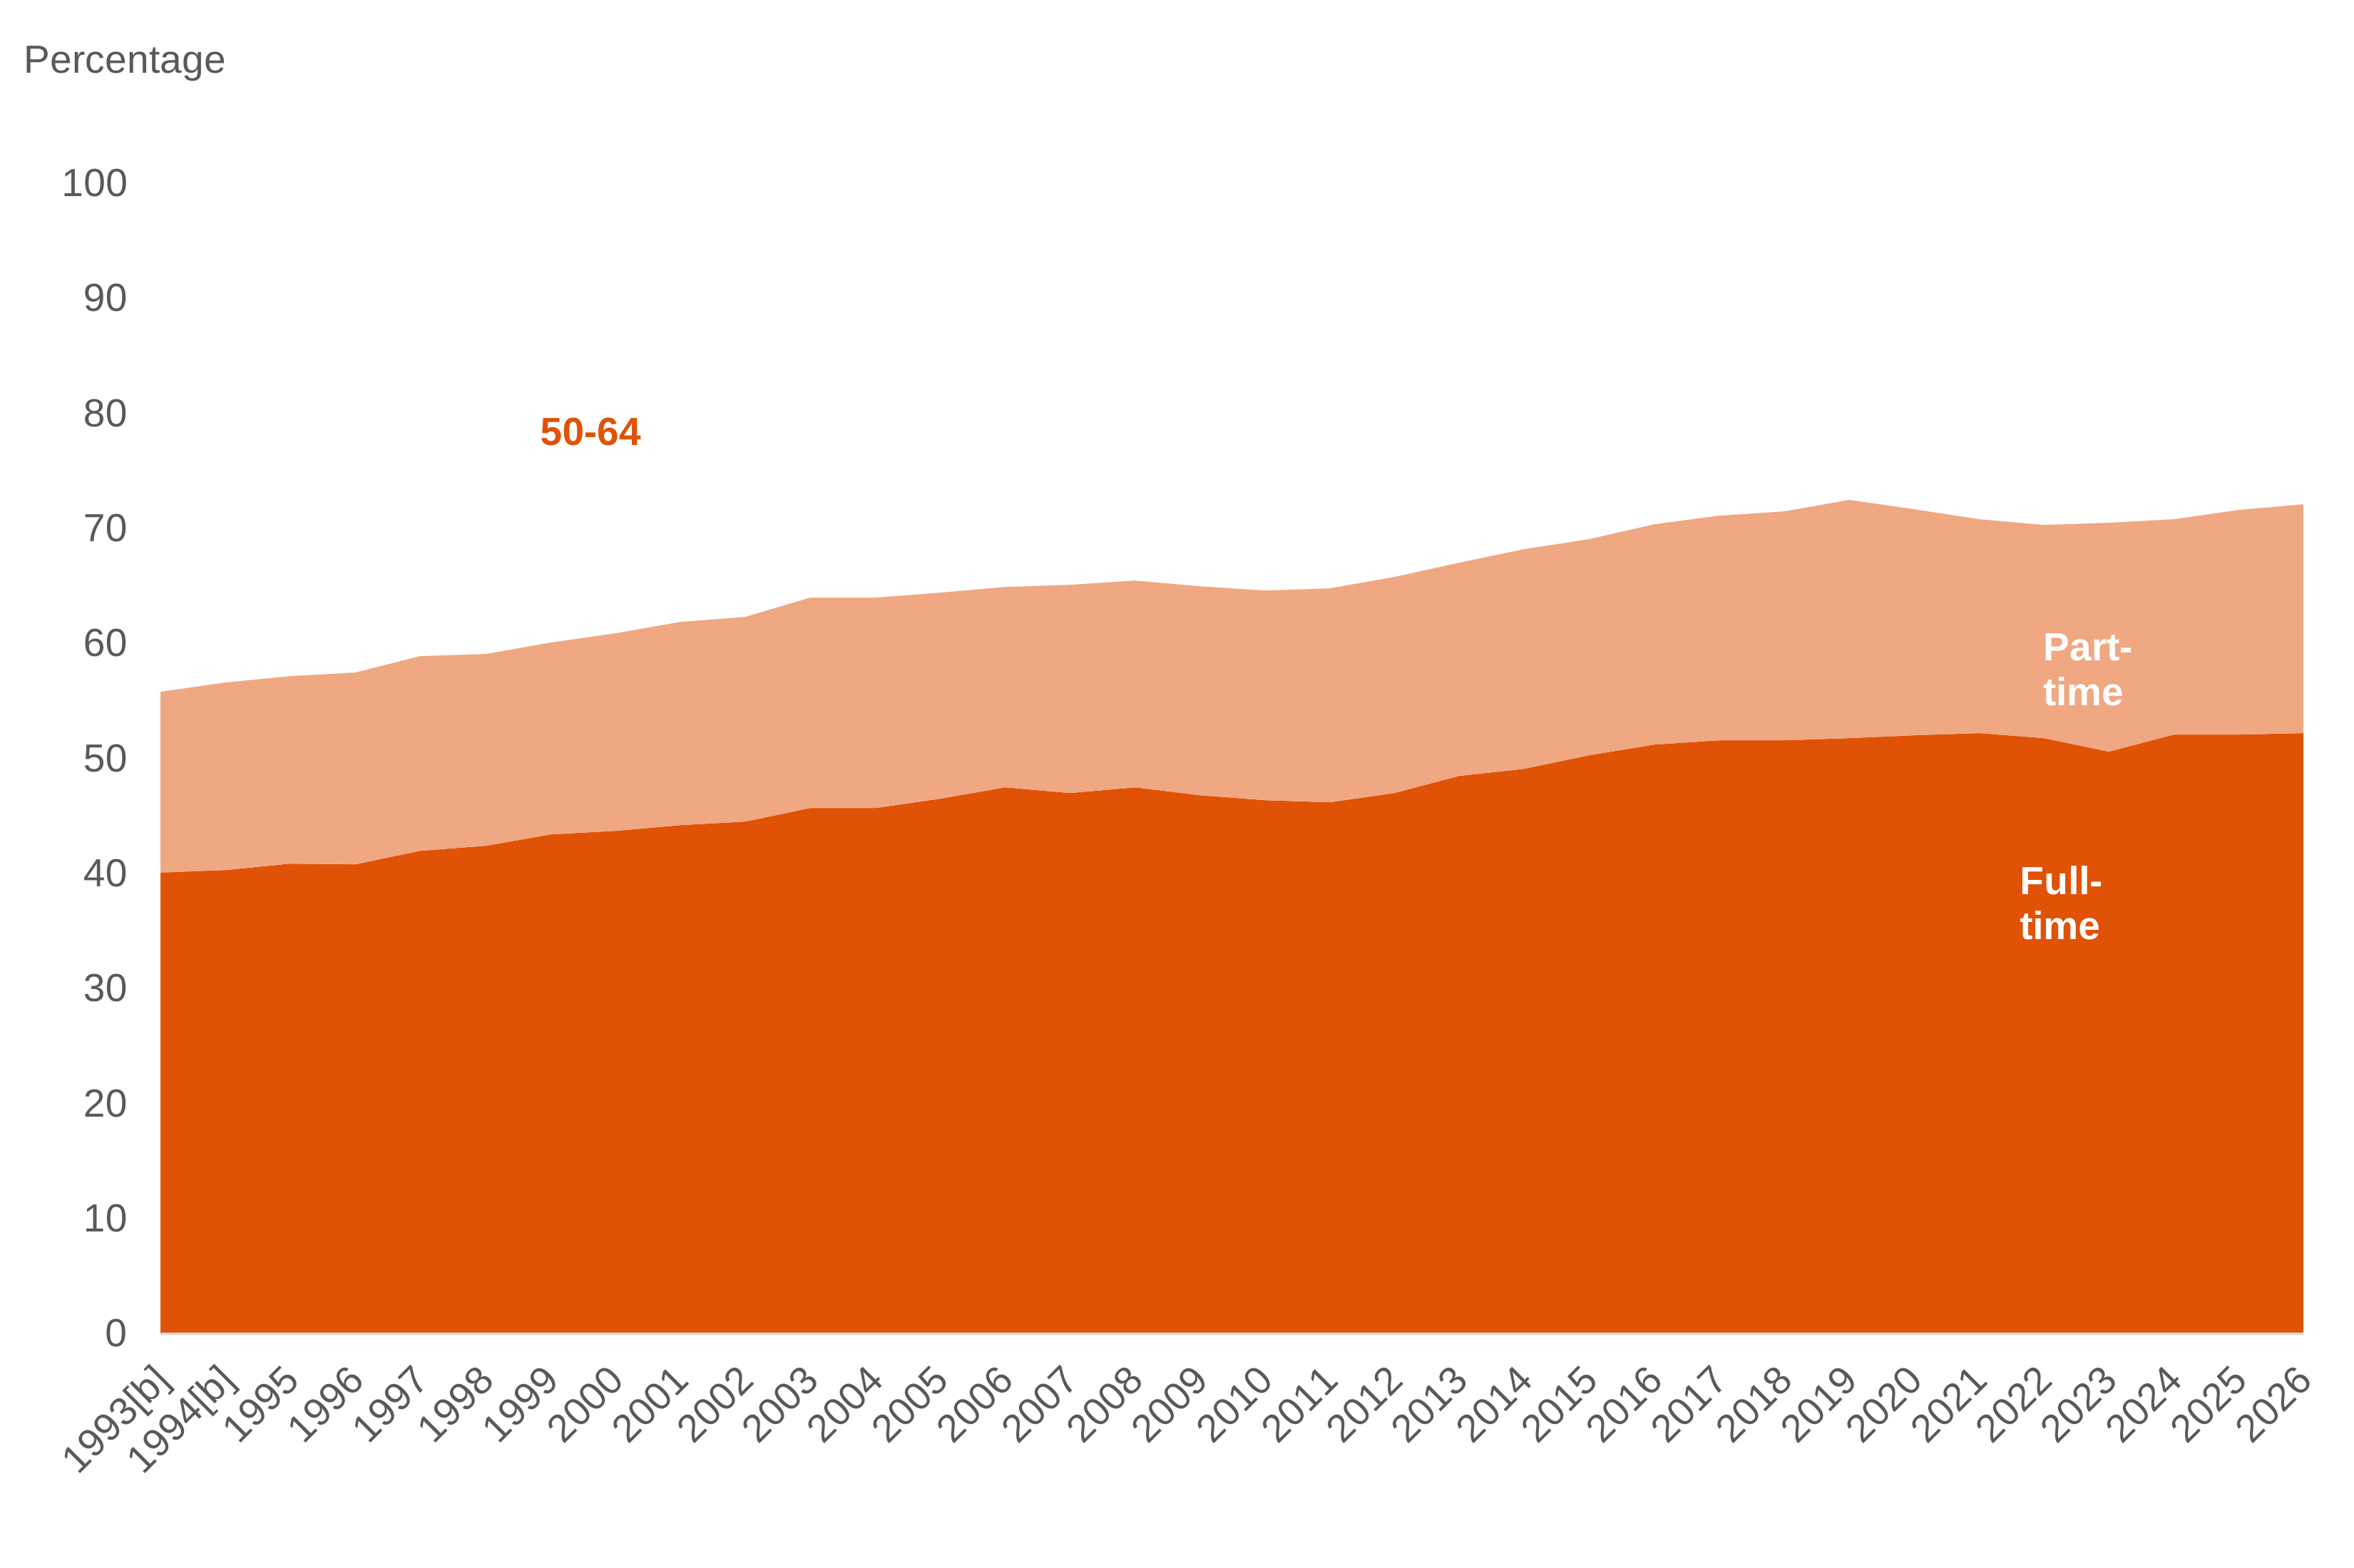
The upward trend of the employment rate for people aged 50 to 64 years over the past 25 years has been driven by increases in both full-time and part-time employment. This upward trend is primarily driven by an increase in full-time employment, notably women in full-time employment, with the employment rate for women working full-time increasing by 14.6 percentage points since 2001. Whereas the upward trend of the employment rate for people aged 35 to 49 has been driven by increases in full-time employment only, with part-time employment at a lower level in 2026 than 2001.
Compared with five years ago, in 2026 there was an increase in the proportion of workers aged 50 to 64 in part-time employment (1.3 percentage point increase) and no change in the proportion in full-time employment. The change in part-time employment rates is statistically significant.
Compared to 2025, the recent increase in the employment rate for people aged 50 to 64 years appears to be driven mainly by an increase in part-time employment. Those aged 50 to 54 and 60 to 64 report increases in part-time employment of 0.3 and 1.0 percentage points over the past year, respectively, with no change for the group aged 55 to 59. Those aged 55 to 59 saw a 0.7 percentage point increase in full-time employment, while those aged 50 to 54 saw a 0.1 percentage decrease and those aged 60 to 64 saw a 0.4 percentage increase. None of these changes were statistically significant.
Women aged 50 to 64 years are statistically significantly more likely than men of the same age to be in part-time employment, with around three in ten (28.3%) women aged 50 to 64 years in part-time employment in 2026 compared to around one in nine (11.2%) men of the same age. This trend holds true across all five-year age bands between ages 50 and 64 years where women are more likely to be in part-time employment than men.
The proportion of employed people aged 50 to 64 years in self-employment (as opposed to being employees) decreased from 17.2% in 2025 to 17.1% in 2026. Conversely, the proportion of employed people aged 35 to 49 years in self-employment increased from 12.1% in 2025 to 13.1% in 2026. Those aged 50 to 64 years are still more likely to be self-employed than those aged 35 to 49. The change in self-employment rate for 35 to 49 year olds was statistically significant.
Full-time and part-time employment rates of people aged 35 to 49 years and people aged 50 to 64, UK
Source: Table 4 Economic Labour Market Status of individuals aged 50 and over statistics.
Working patterns
In 2026, there was a similar distribution of hours worked for adults aged 35 to 49 years and aged 50 to 64 years; 67.5% of adults aged 50 to 64 years and 74.2% of adults aged 35 to 49 years work 30 hours or more per week. Women aged 50 to 64 years were more likely to work fewer hours per week than men, with twice as many women (43.6%) working under 30 hours compared to men (21.8%) this difference is statistically significant. This is broadly similar to the trends seen for those aged 35 to 49 years.
Adults aged 50 to 64 years follow a similar distribution across their main work location to those aged 35 to 49 years, with the majority of those in employment mainly working at ‘somewhere quite different from home’. This holds true for both men and for women across both age groups.
Working patterns between those aged 50 to 64 years and those aged 35 to 49 years are relatively similar. A key difference between genders across working patterns is term-time working. Women aged 50 to 64 years are around five times more likely to work term-time compared to men in 2026 (7.6% of women compared to 1.5% of men aged 50 to 64 years). This difference is statistically significant.
Employment by industry sector
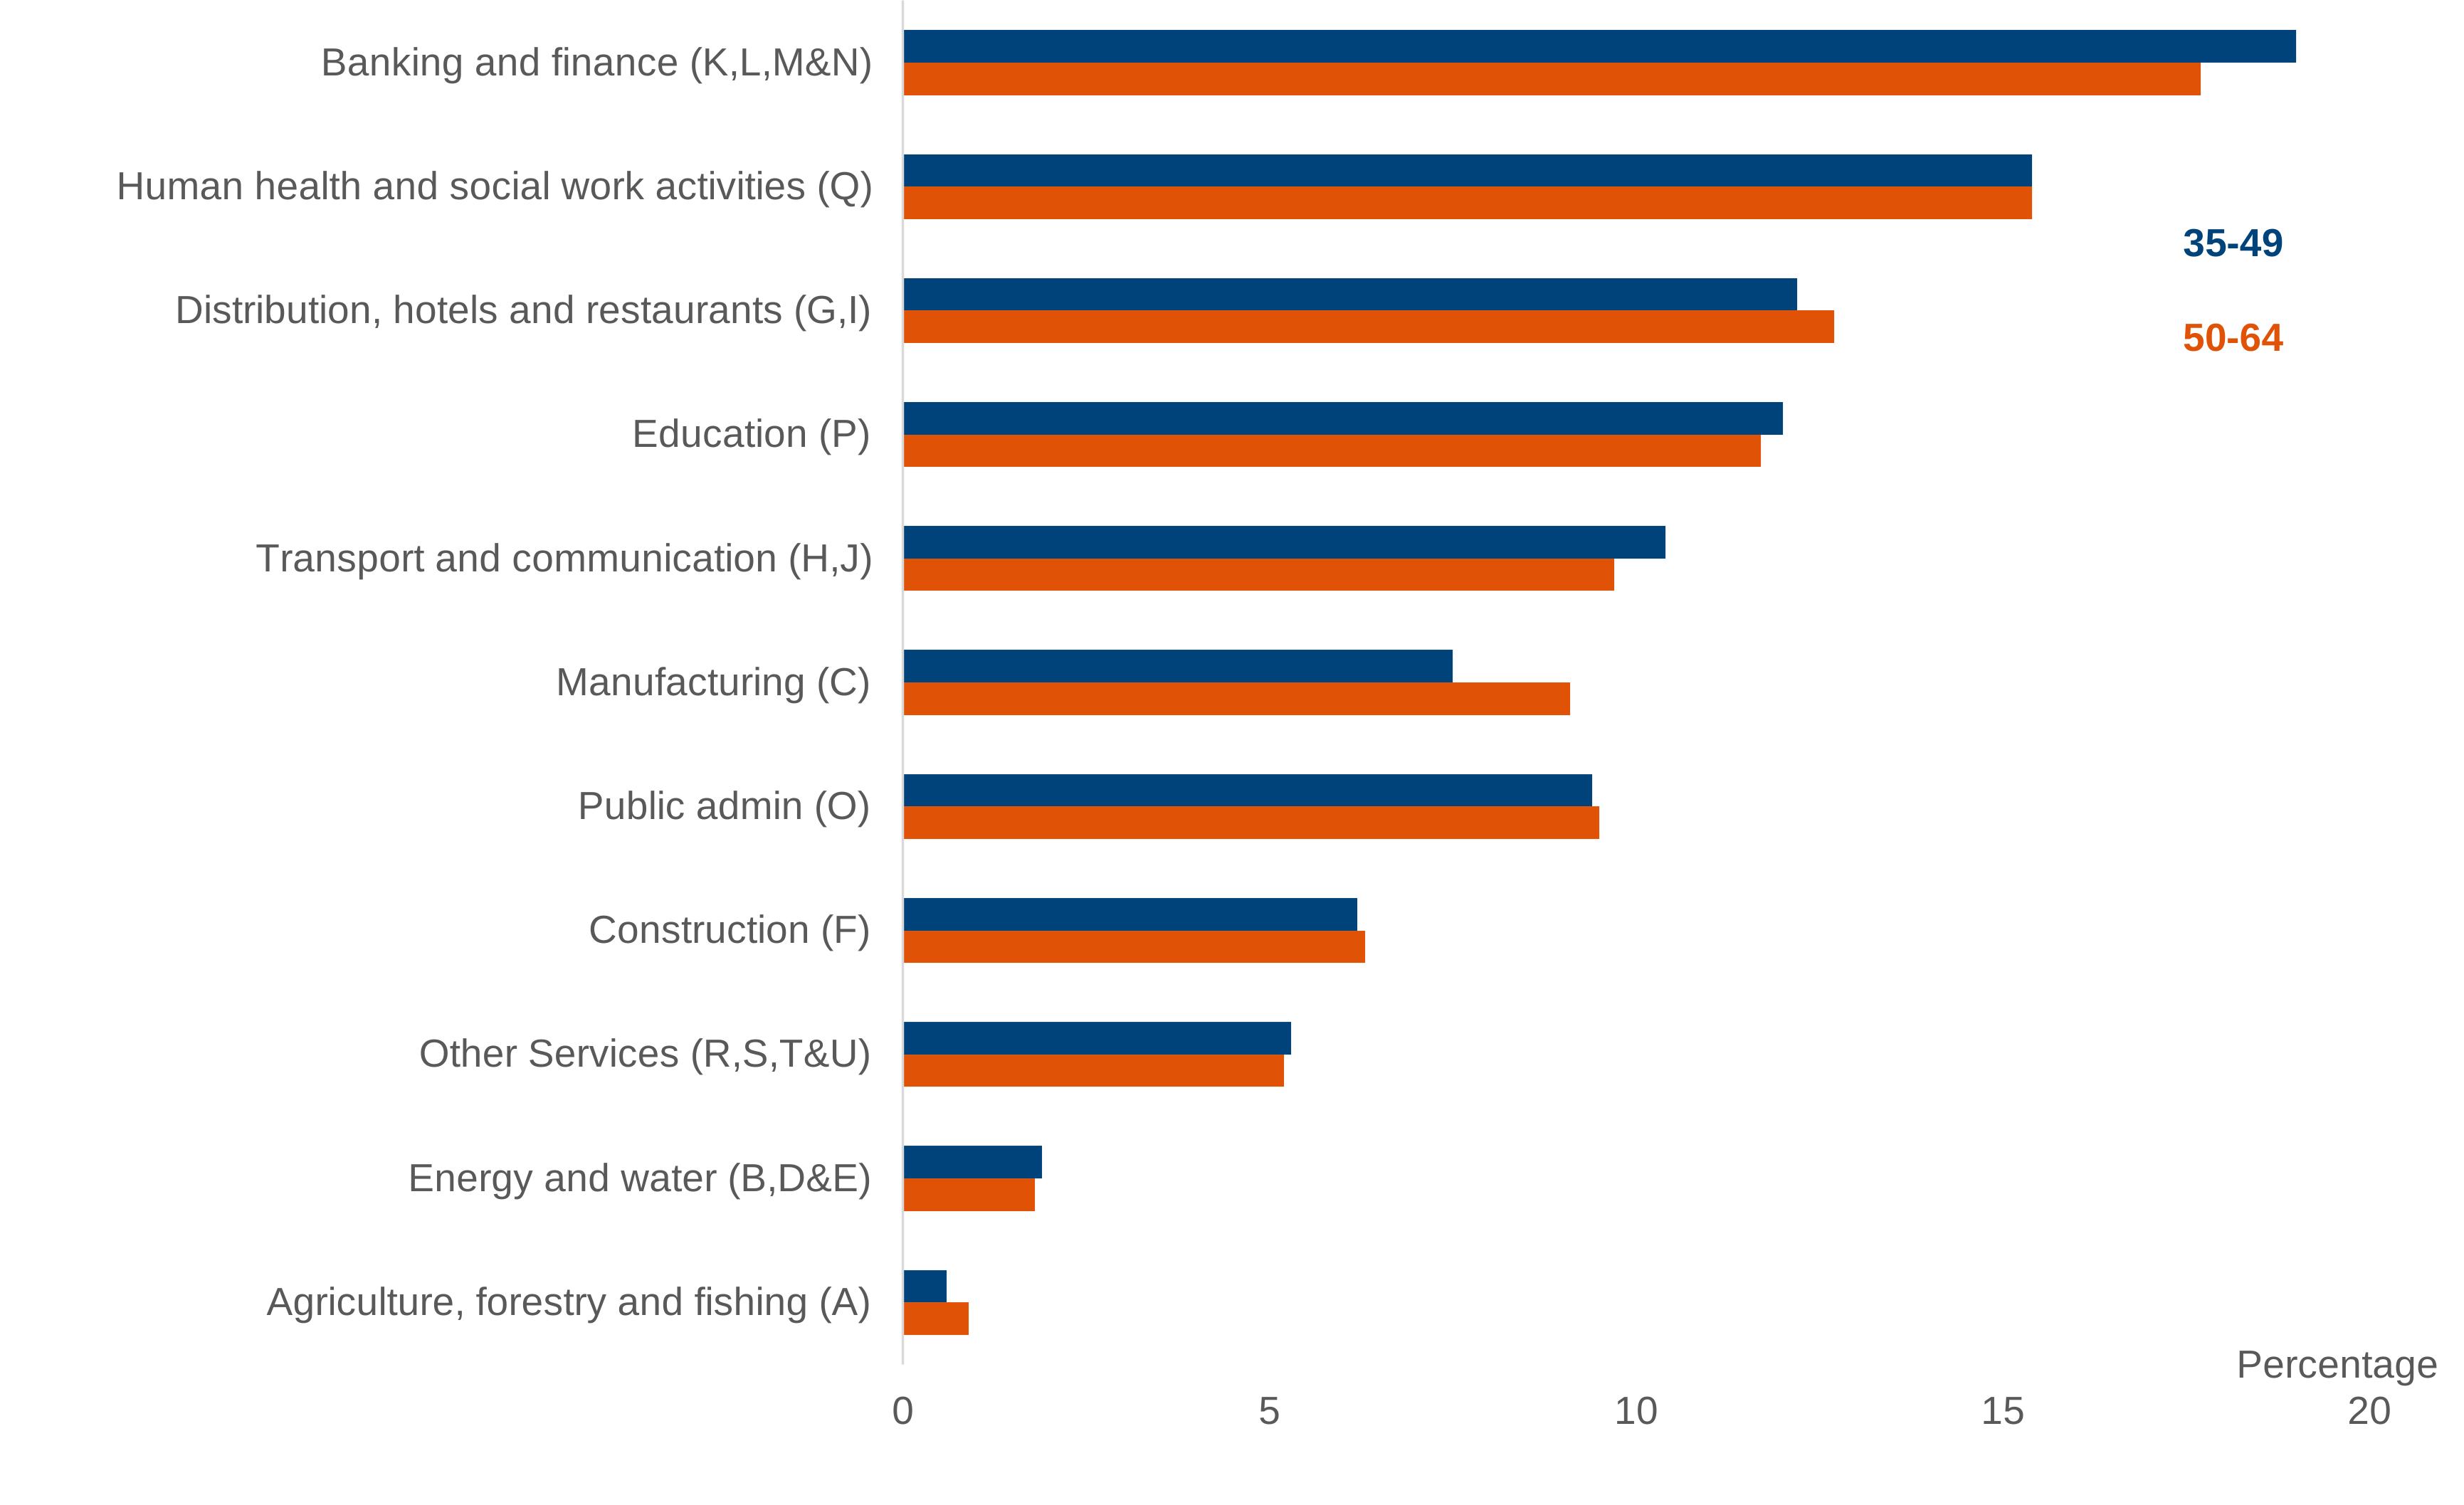
Workers aged 50 to 64 years have a broadly similar distribution amongst industry sectors to those aged 35 to 49 years. The most likely sector for individuals in both age groups to be employed in is the banking and finance sector, with 17.7% of workers aged 50 to 64 years and 19.0% of those aged 35 to 49 years employed in this sector. The difference between the proportions between age groups is statistically significant.
The sector with the lowest proportion of people employed in both age groups is the agriculture, forestry and fishing sector, with only 0.9% of those aged 50 to 64 years and 0.6% of those aged 35 to 49 years employed in this sector.
The largest proportion of women aged 50 to 64 years are employed in the human health and social work activity sector (23.9%), this is followed by the education sector (17.2%), and then the banking and finance sector (16.2%). This is a slight change from the previous year when banking and finance was the second most common sector, followed by education.
In comparison, men aged 50 to 64 years have a more even distribution across all industry sectors, with 19.0% of those aged 50 to 64 employed in the banking and finance sector, followed by transport and communication (14.8%) and then manufacturing (12.7%). This is a slight change from last year when distribution, hotels and restaurants was the third most common sector.
Men aged 50 to 64 years are around two times as likely as women to be employed in manufacturing, (12.7% compared to 5.4%), around three times as likely to be employed in the transport and communications sector (14.8% compared to 4.5%) and five times as likely as women to be employed in the construction sector (10.3% compared to 2.2%). All of these differences are statistically significant.
Proportion of people aged 35 to 49 years and people aged 50 to 64 years employed by industry sector, 2026, UK
Source: Table 13 Economic Labour Market Status of Individuals aged 50 and over statistics.
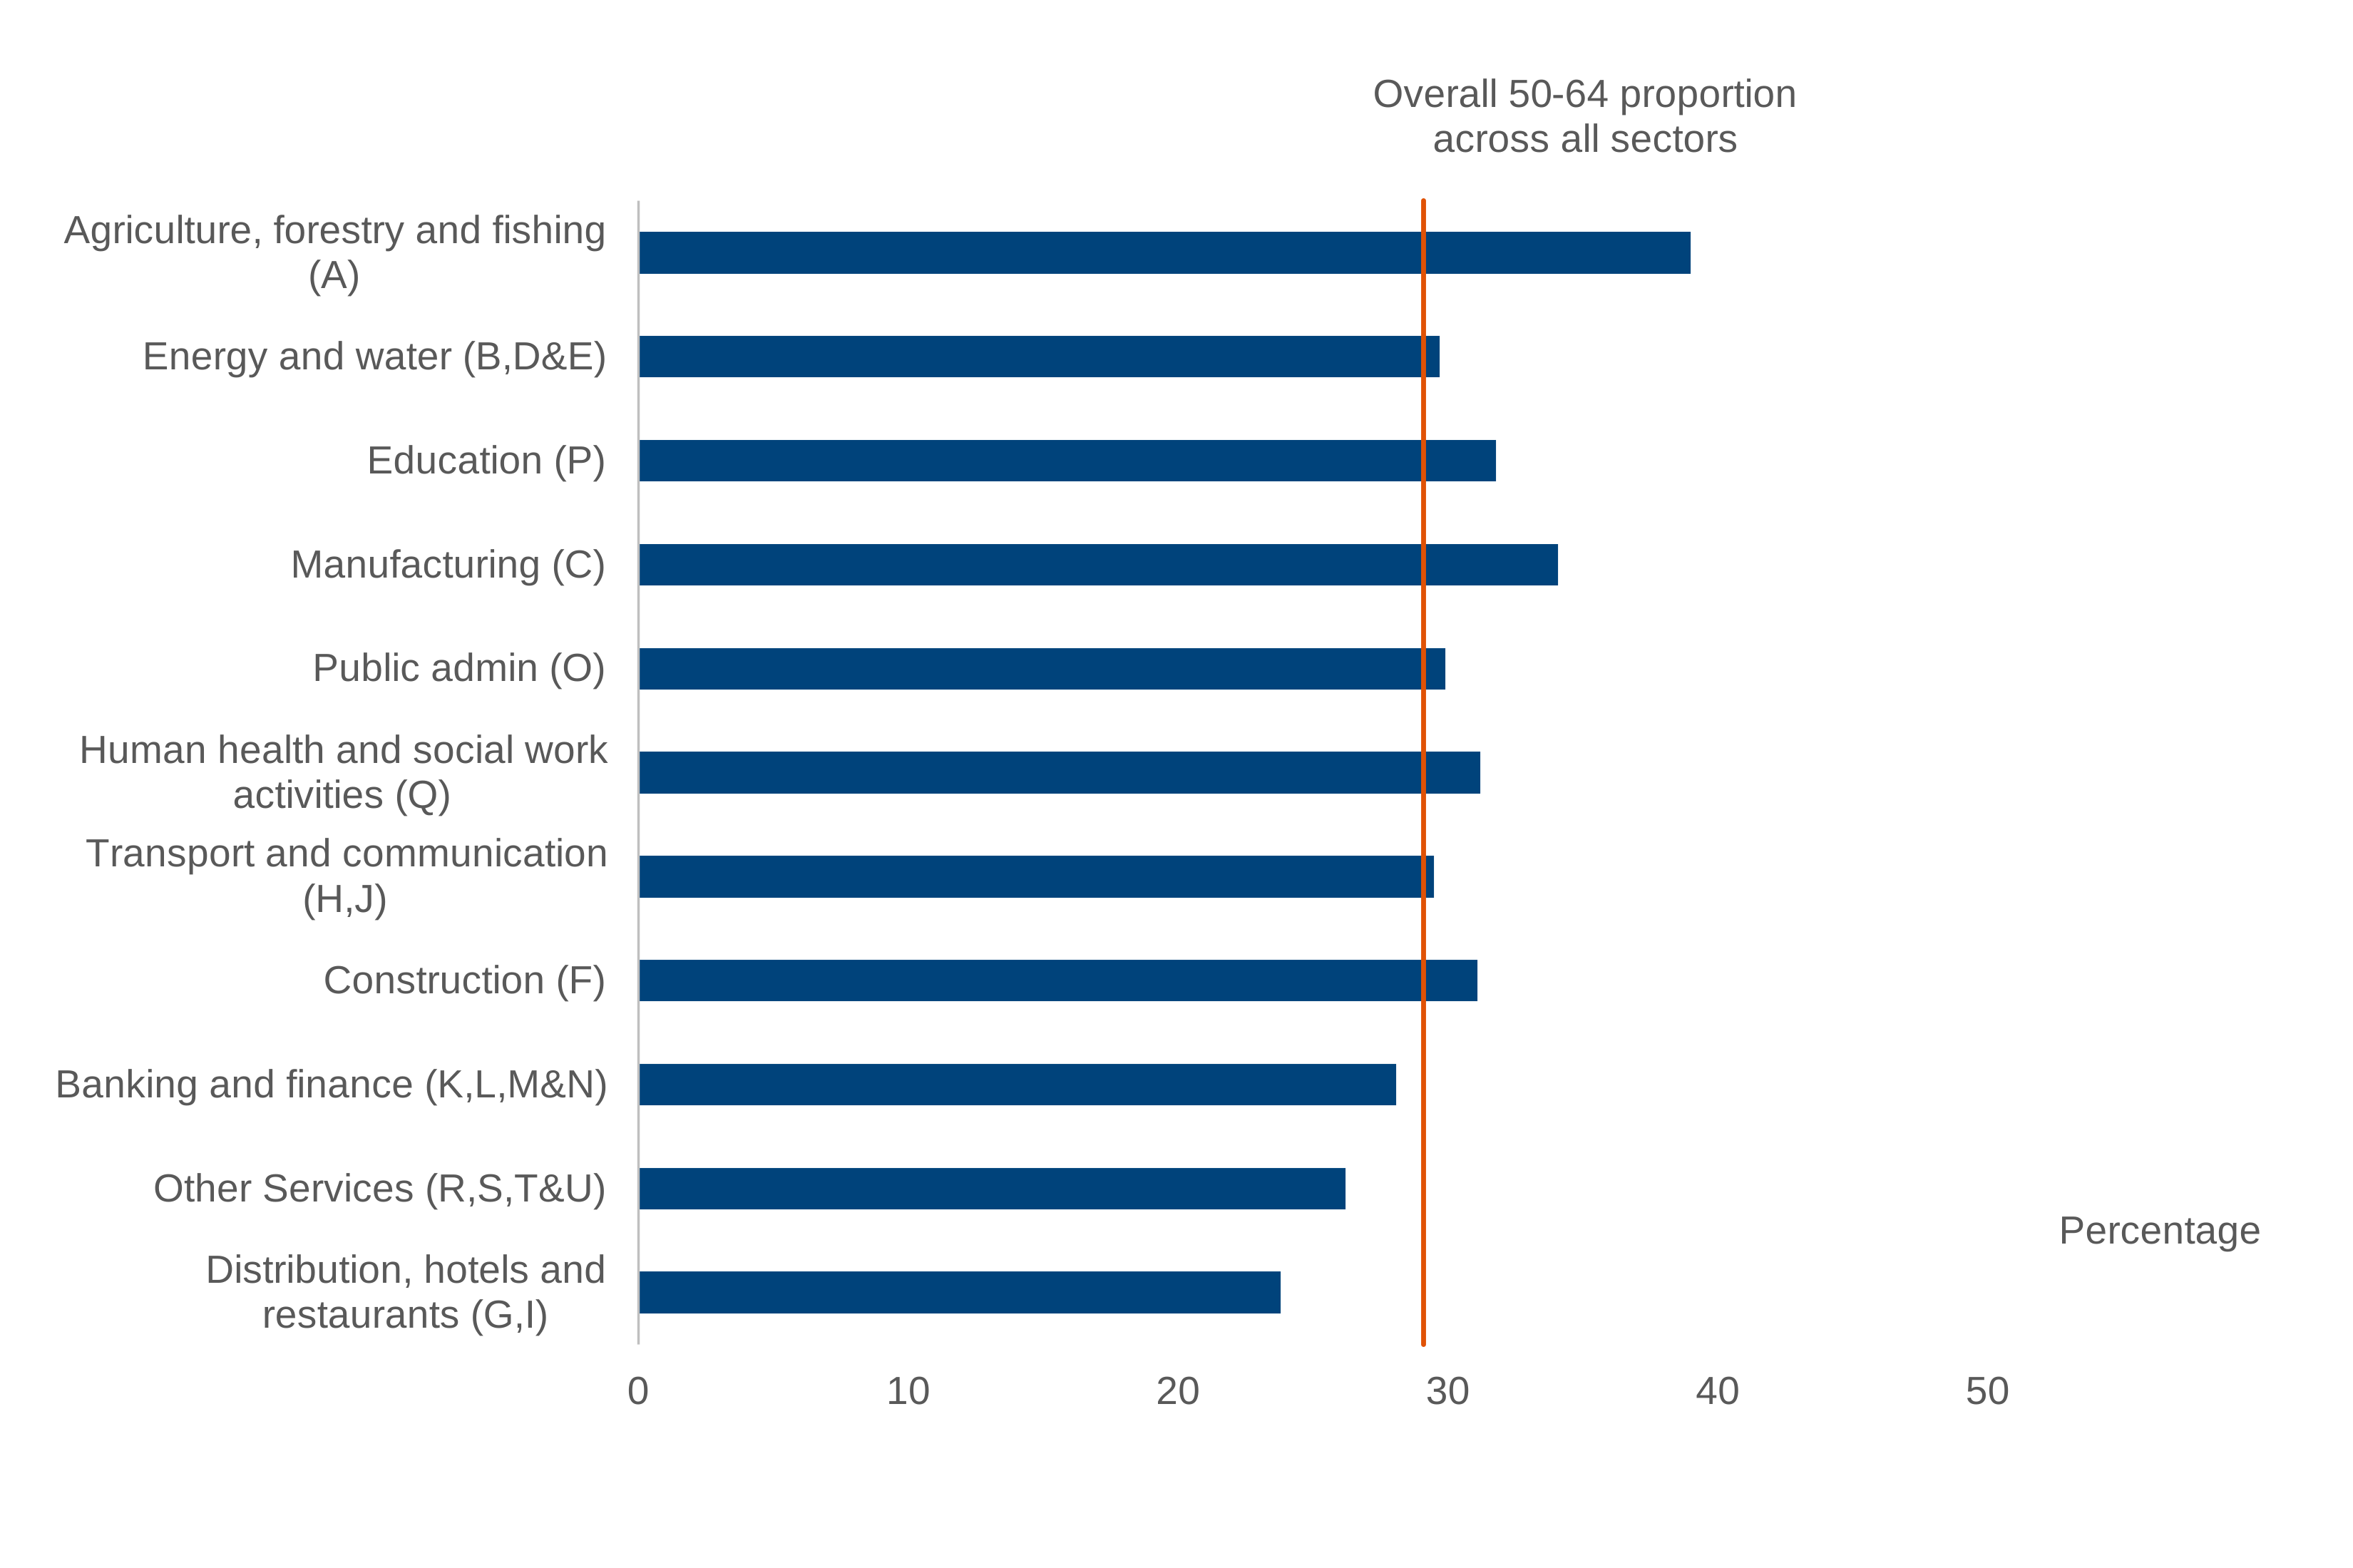
Even though those aged 50 to 64 are most likely to be employed in the banking and finance sector, this age group only makes up around 28.1% of all people aged 16 to 64 who are employed within this sector. Meanwhile, less than 0.9% of those aged 50 to 64 are employed in the agriculture, forestry and fishing sector, but this age group makes up 39.0% of all people aged 16 to 64 employed in this sector.
Out of all sectors, the distribution, hotels, and restaurant sector had the lowest proportion (23.8%) of those aged 50 to 64 as a proportion of those aged 16 to 64 employed in that sector; and the agriculture, forestry and fishing sector had the highest proportion of those aged 50 to 64 employed.
Individuals aged 50 to 64 years as a proportion of those aged 16 to 64 years who are employed within each sector, 2026, UK
Source: Table 21 Economic Labour Market Status of individuals aged 50 and over statistics.
Employment by region/country
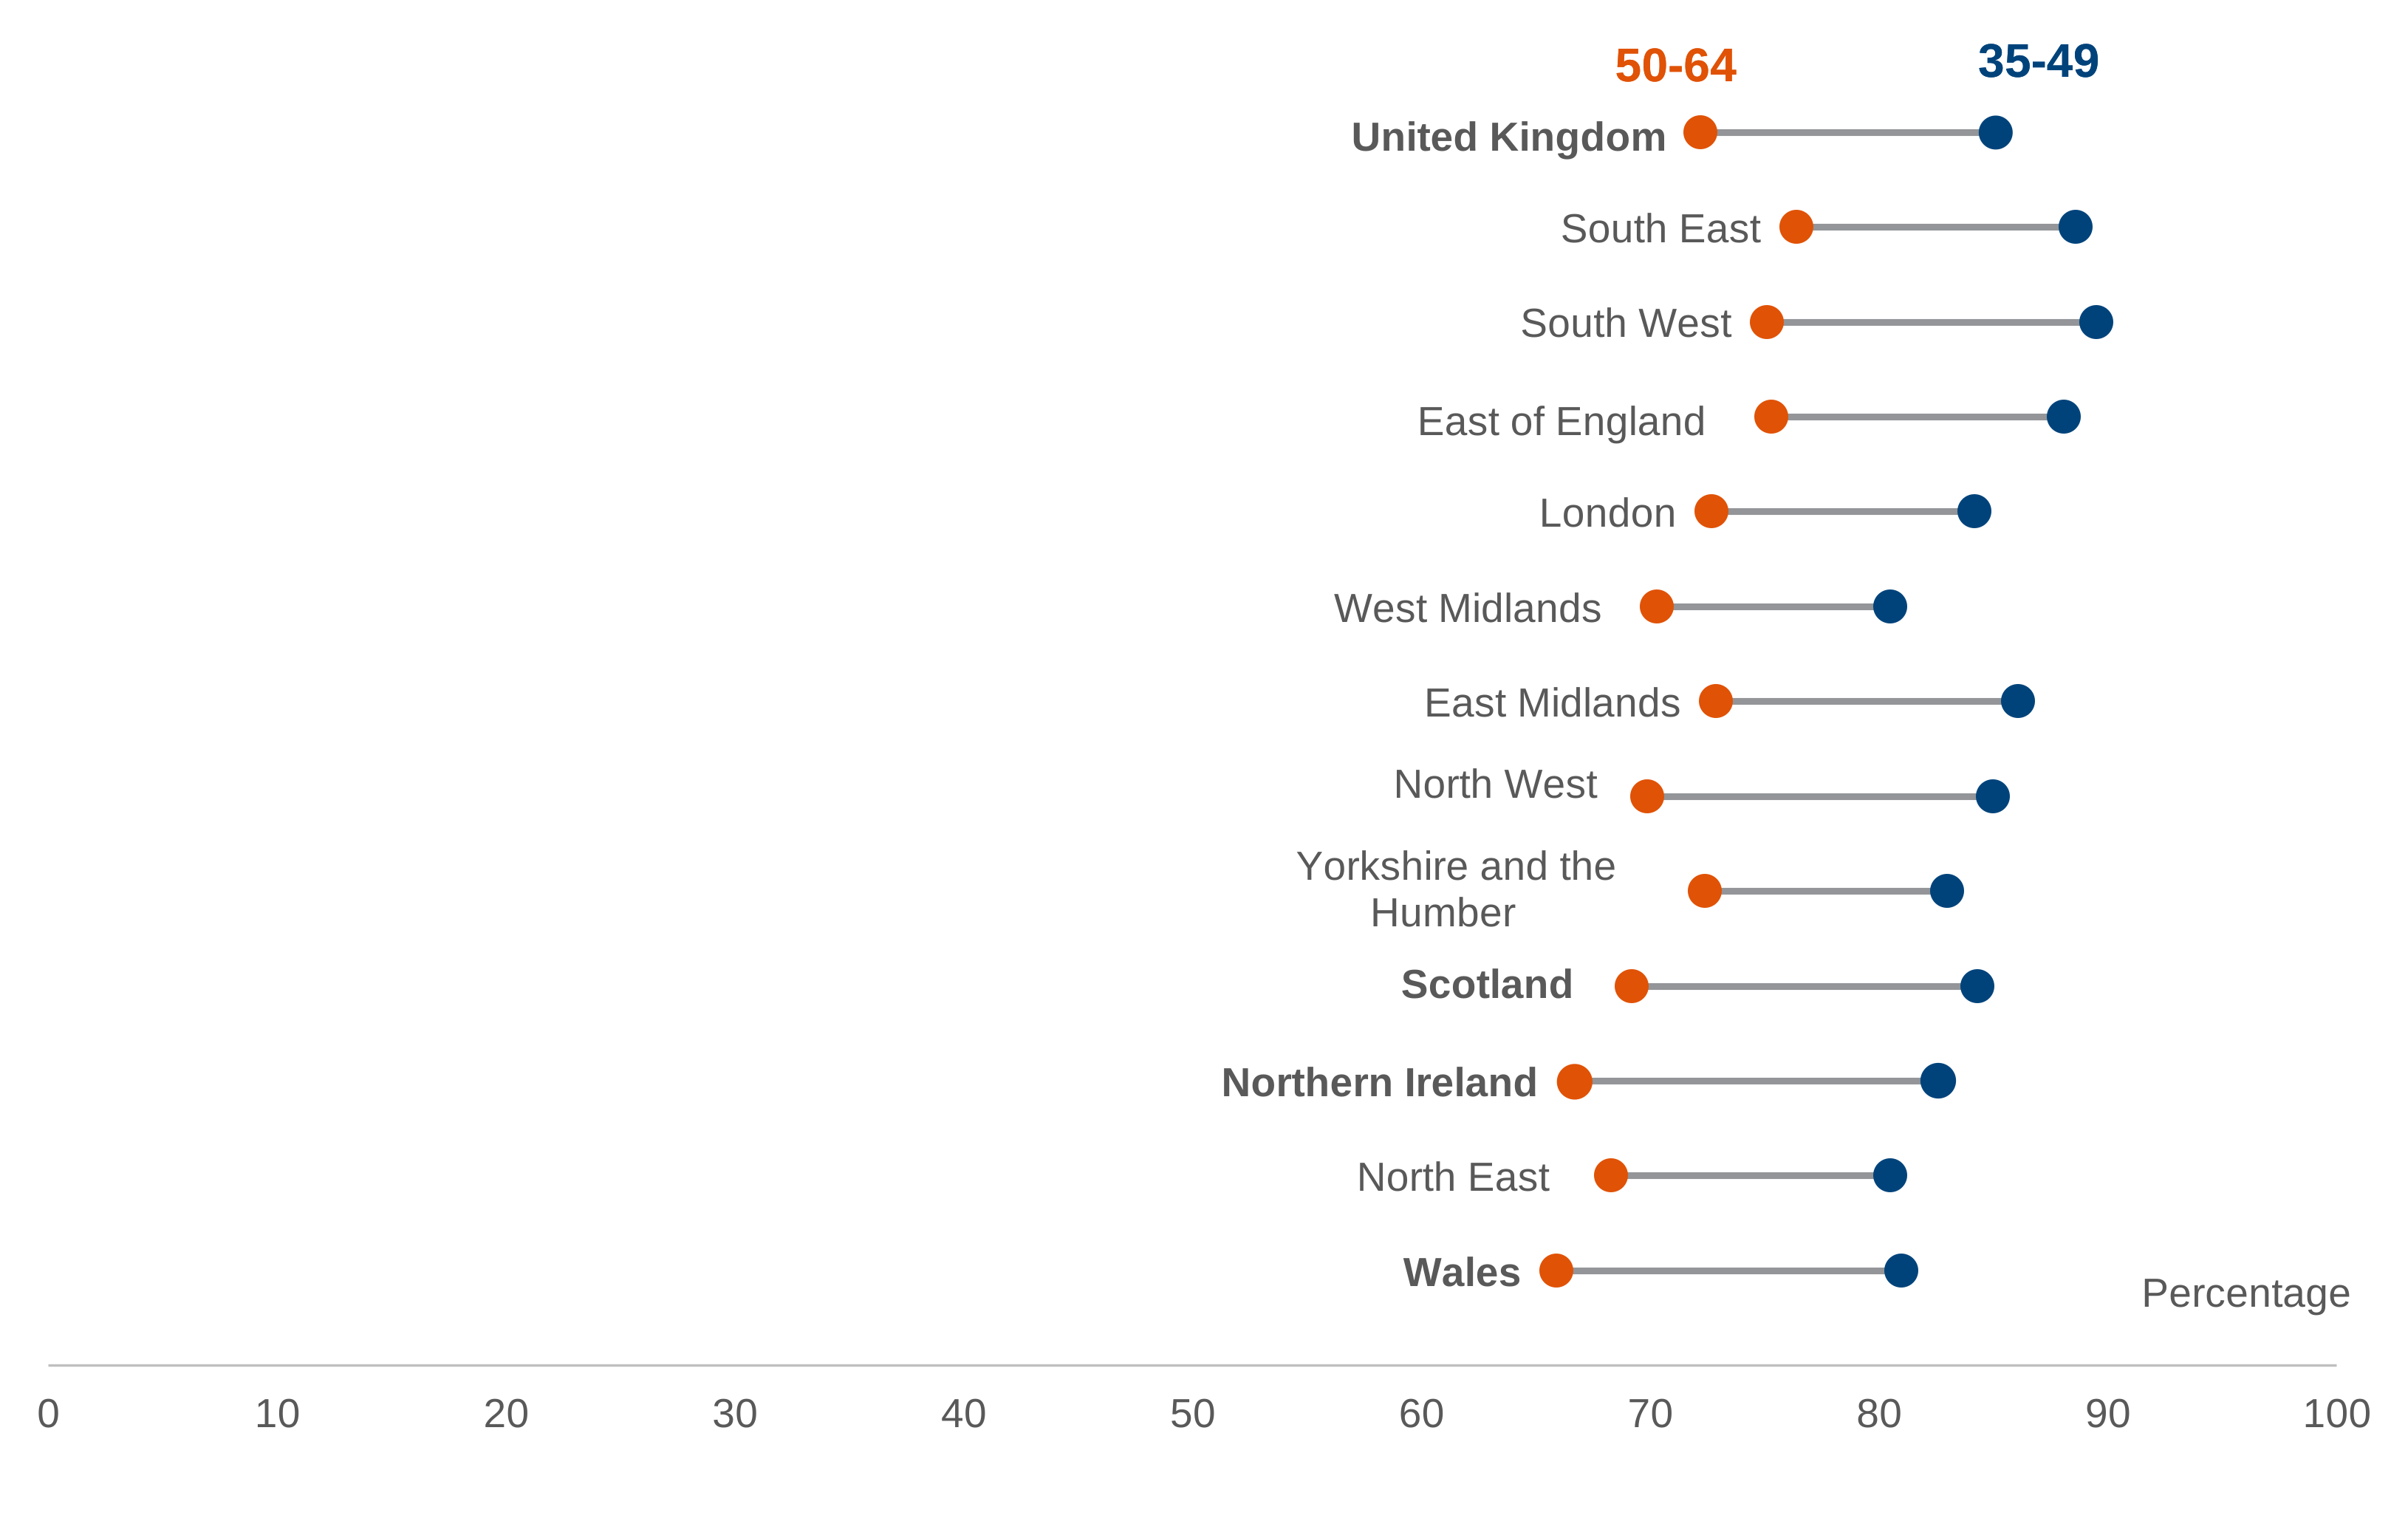
Within countries in the United Kingdom, Wales had the lowest employment rate among those aged 50 to 64 years at 65.9%, and England had the highest employment rate at 73%. Although Wales has the lowest employment rate, it has seen the highest yearly increase of all the countries from 2025 to 2026 with the employment rate increasing by 2.4 percentage points, though this was not statistically significant.
Of all regions in England, the North-East of England had the lowest employment rate for people aged 50 to 64 years at 68.3% and was lower compared to the average across England (73%), but this is not statistically significant. The highest employment rate for people aged 50 to 64 years was in the South-East of England with an employment rate of 76.4%, though this is not statistically significantly higher than the employment rate for those aged 50 to 64 years across England on average.
There is variation in the employment rate gap between people aged 35 to 49 years and people aged 50 to 64 years across regions and countries. The lowest employment rate gap is in West Midlands (10.2 percentage points), whilst Northern Ireland has the largest gap (15.9 percentage points).
In 2026, the employment rate gap between the North-East and the South-East increased for those aged 50 to 64 years from 6.7 percentage points in 2025 to 8.1 percentage points in 2026, this change was statistically significant. The employment rate gap between those aged 35 to 49 years in the same areas decreased from 8.7 percentage points in 2025 to 8.1 percentage points in 2026, however this was not statistically significant.
The employment rate gap for those aged 50 to 64 between the North-West and the South-West statistically significantly decreased from 9.5 percentage points in 2025 to 5.2 percentage points in 2026.
Employment rates of people aged 35 to 49 years and people aged 50 to 64 years by region, 2026, UK
Source: Table 14 – Economic Labour Market Status of individuals aged 50 and over statistics.
Employment by ethnicity
Of ethnicities with reliable sample sizes, those of the ‘Any other Asian background’ ethnicity reported the highest employment rate for those aged 50 to 64 years (79.8%). The second highest employment rate was those of the “Indian” ethnicity with an employment rate of 79.6% for the same age group, whilst those with a reported ethnicity of ‘Bangladeshi’ reported the lowest (60.7%).
The employment rate gap of individuals aged 50 to 64 years and aged 35 to 49 years with a reported ethnicity of ‘Chinese’ was 20.9 percentage points, this was the largest employment rate gap across ethnicity categories with reliable sample sizes. This was followed by those with a reported ethnicity of ‘White’, with the employment rate gap between those aged 35 to 49 and 50 to 64 years at 14.4 percentage points.
Employment by highest qualification
In general, the higher the education level obtained for individuals aged 50 to 64 years, the higher the employment rate. Individuals aged 50 to 64 years with degree level qualifications or equivalent are more likely to be in employment (80.5%) than those with no qualifications (46.0%).
The employment rate gap between individuals with no qualifications and those holding any type of qualification was larger than any employment rate gap observed between the levels of qualification obtained. For example, the employment rate gap between individuals aged 50 to 64 years with no qualifications and those with ‘GCSE grades A* to C or equivalent’ was 22.2 percentage points in 2026. This is statistically significantly larger than the employment rate gap between those with ‘GCSE grades A* to C or equivalent’ and degree level qualifications, with the gap standing at 12.3 percentage points in 2026. A similar trend can also be seen for those aged 35 to 49 years.
The employment rate of women aged 50 to 64 years with a degree or equivalent is 3.1 percentage points lower than that of men of the same age, a statistically significant difference. The employment rate of women aged 50 to 64 years with no qualifications (36.3%) is 17.8 percentage points lower than men of the same age (54.1%), this difference is also statistically significant.
6. Economic inactivity
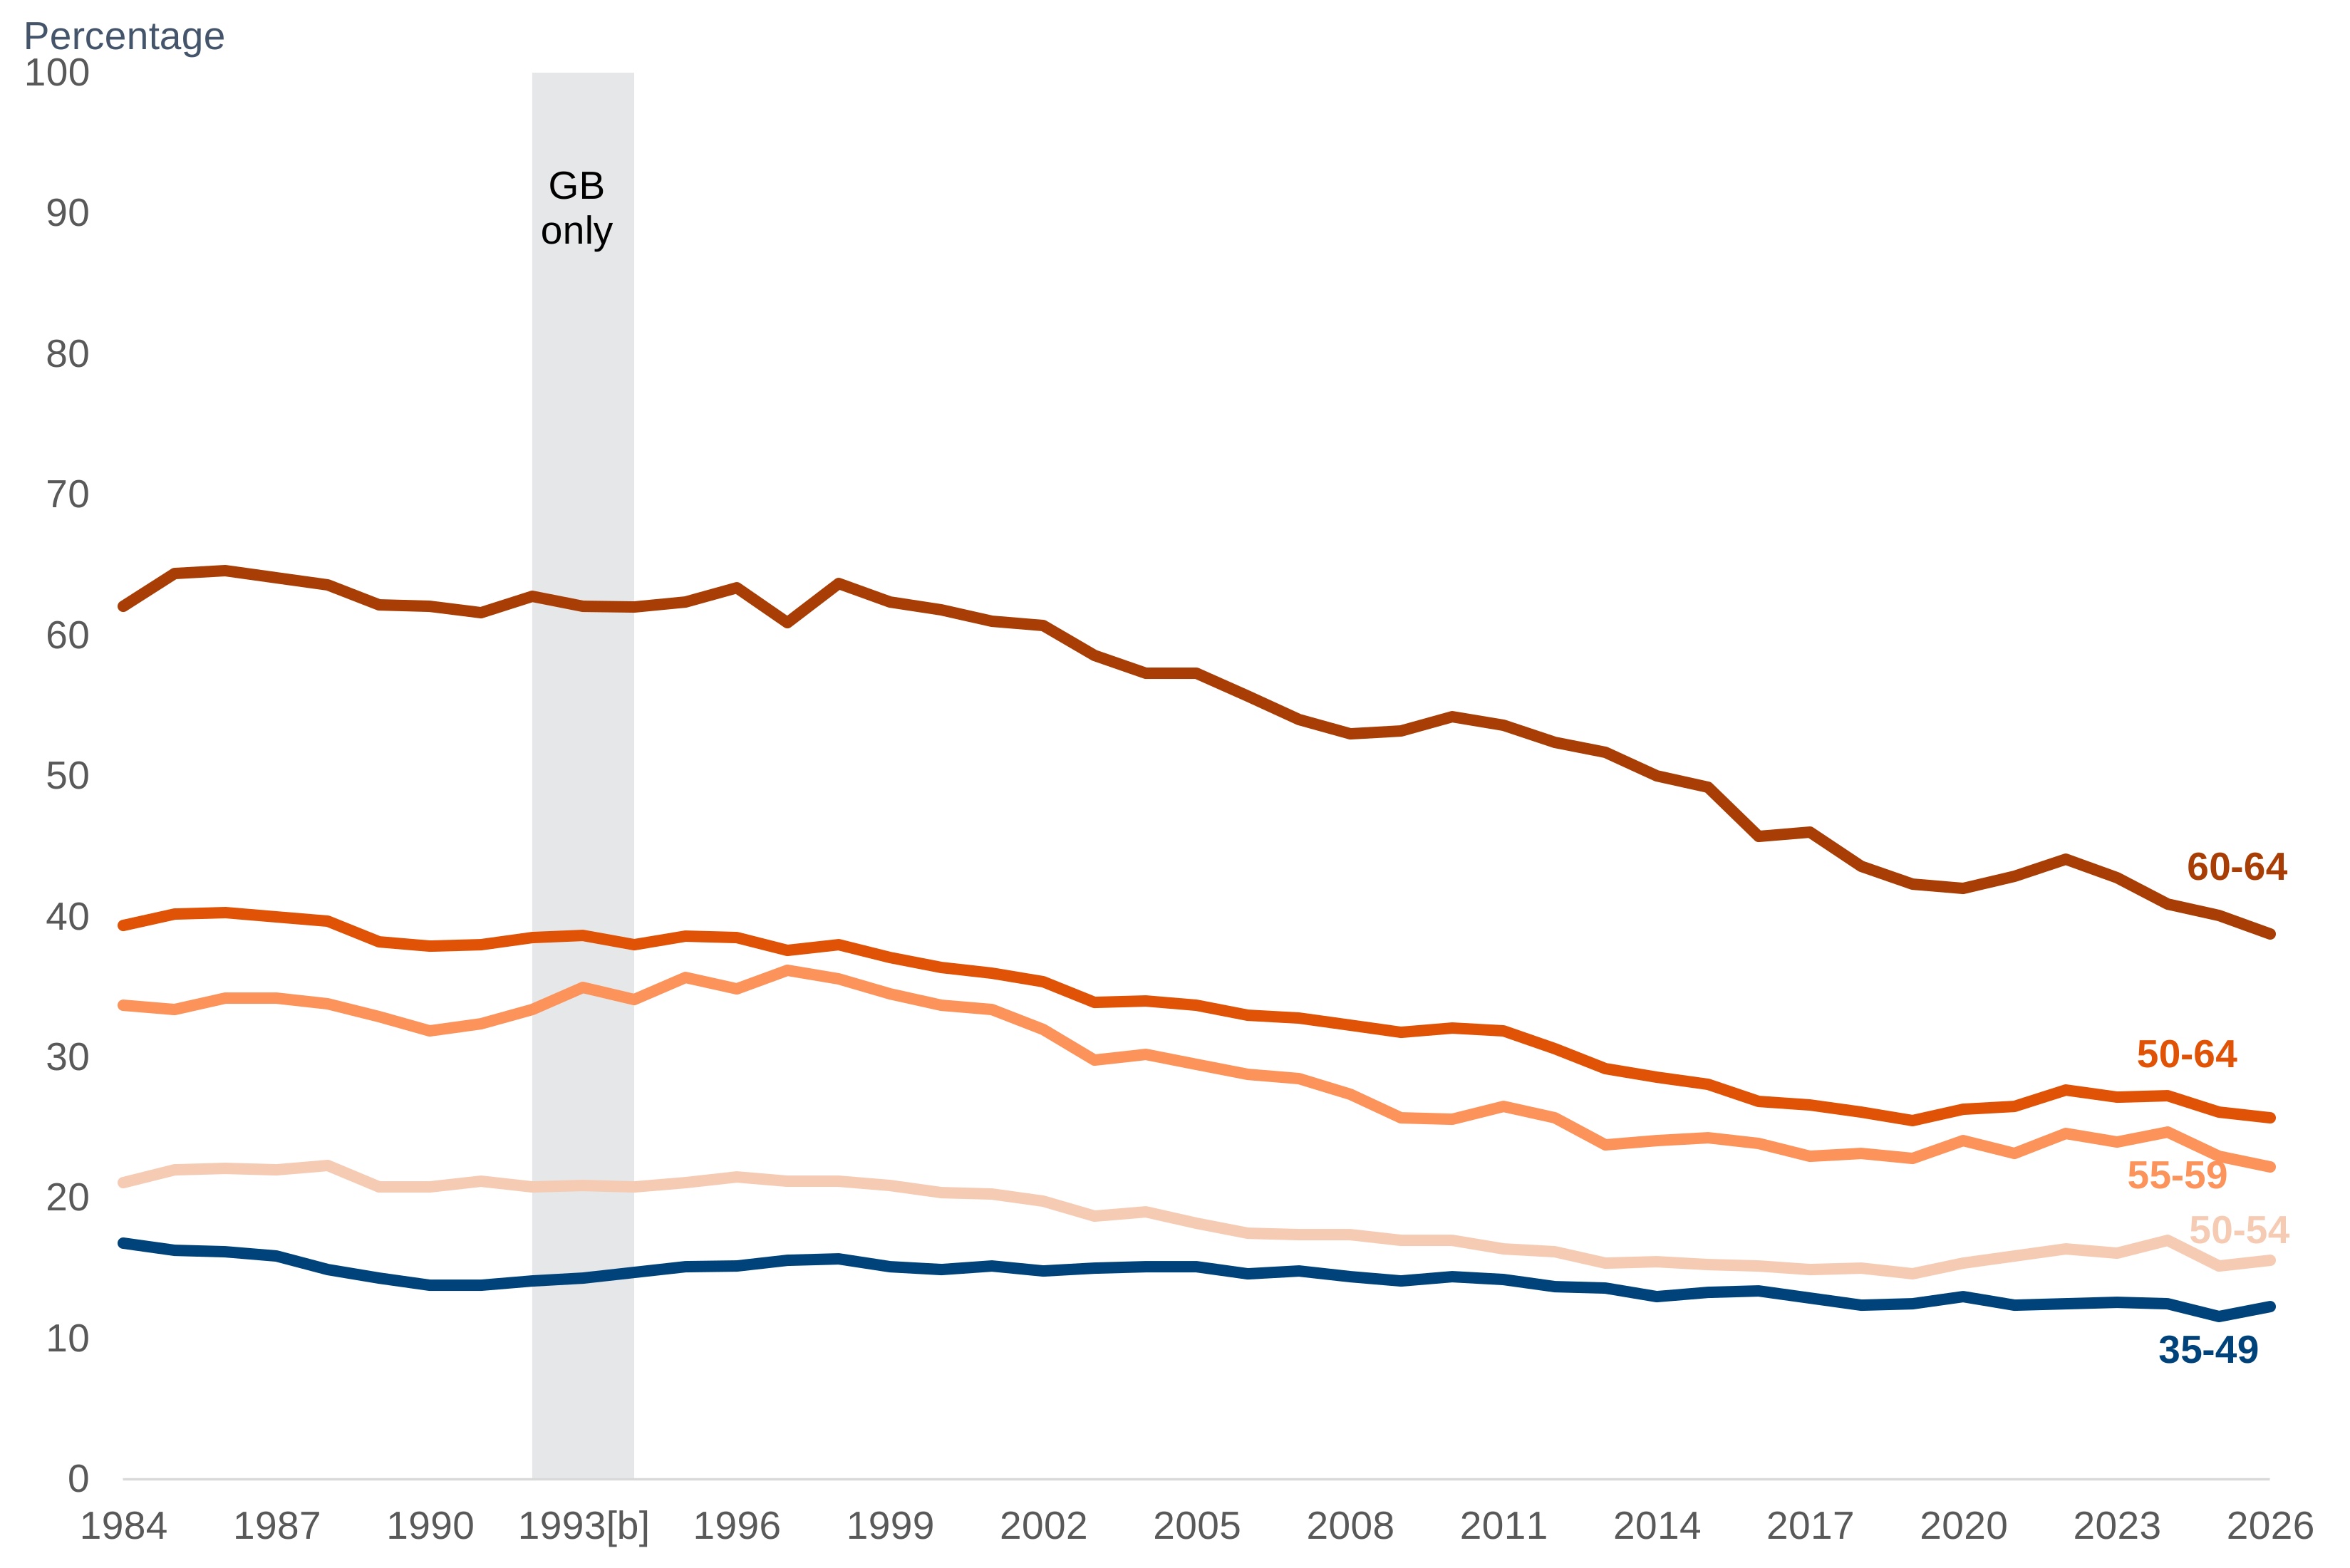
The economic inactivity rate for people aged 50 to 64 years in 2026 was 25.7%. This is a decrease of 0.4 percentage points compared to 2025. This decrease is not statistically significant.
The economic inactivity rate for people aged 50 to 64 years fell steadily from 39.4% in 1984 through to 2019, when it stood at 25.5%. For the following three years, the rate increased up to 27.7% in 2022. It is now lower than the rate seen in 2022 but remains higher than that in 2019. An equivalent sustained increase after 2019 was not evident in the economic inactivity rate for individuals aged between 35 and 49, where the rate has been more consistent and was at 12.3% in 2026, falling below the rate in 2019.
From age 50 onwards, the economic inactivity rate generally increases with individual age. In 2026, at age 50, the inactivity rate was 14.6% which increased to 51.8% at age 65 and further increased to 65.6% at age 66, with both increases being statistically significant.
The economic inactivity rate of people aged 65 years has decreased over the last decade, from 71.2% in 2016 to 51.8% in 2026. This decrease is statistically significant.
For those aged 50 to 54, the inactivity rate rose after 2020, fluctuated, then fell back down to close to its 2020 level by 2025 (in 2026 it is 15.6% compared to 15.2% in 2025). For those aged 55 to 59 there have been fluctuations since 2020, with 2026’s level being 1.9 percentage points lower than 2020’s. For the 60 to 64 age band, 2026’s economic inactivity rate of 38.8% is 3.2 percentage points lower than 2020’s rate of 42.0%, while the 65 to 69 age band saw a fall of 5.6 percentage points from 74.9% in 2020 to 69.3% in 2026.
The long-term decrease in the economic inactivity rate for people aged between 50 and 64 has been largely driven by the decreased inactivity rate of women in this age range, which has decreased by 19.4 percentage points between 1995 and 2026 compared with a 6.2 percentage point decrease for men of the same age. The economic inactivity rate for women aged between 50 and 64 remains statistically significantly higher, at 29.0% in 2026 when compared to men of the same age (22.2%).
Economic inactivity by five-year age bands, UK
Source: Table 6 Economic Labour Market Status of individuals aged 50 and over statistics.
Inactivity by country and region
In 2026, Northern Ireland had the highest economic inactivity rate for people aged 50 to 64 (32.8%), this was statistically significantly higher than the economic inactivity rate in England (24.7%). It was also higher than the economic inactivity rates in Scotland (29.2%), and Wales (32.5%) but these differences were not statistically significant.
In Scotland, the economic inactivity rate for people aged 50 to 64 increased by 0.7 percentage points between 2025 and 2026. The economic inactivity for the same age group decreased in Northern Ireland (by 0.8 percentage points), in England (by 0.4 percentage points) and in Wales (by 1.6 percentage points) over the same year. These changes were not statistically significant.
The economic inactivity rate for people aged 50 to 64 years is higher than those aged 35 to 49 across the UK, with an economic inactivity rate gap of 13.4 percentage points. The gap in economic inactivity rate between those aged 50 to 64 and aged 35 to 49 years was highest in Scotland (16.3 percentage points), compared to England (12.9 percentage points), Wales (14.9 percentage points), and Northern Ireland (16 percentage points).
In all the regions in England, the South-East had the lowest economic inactivity rate for those aged 50 to 64 years (21.2%), followed by the South-West (23.0%) and London (23.4%). The North-East had the highest economic inactivity rate for those aged 50 to 64 years (30.2%), followed by the North-West (27.9%) and West Midlands (27.1%). The inactivity rate gap between the North-East and the South-East was 9 percentage points, which is statistically significant.
Compared to 2025, the largest percentage point decrease in the economic inactivity rate for those aged 50 to 64 years was in the North-West (2.6 percentage points). The largest percentage point increase was in the East of England (1.5 percentage points). Neither of these changes is statistically significant.
Reasons for not looking for work, individuals aged 50 to 64 years who are inactive
In 2026 there were 3.4 million people aged 50 to 64 years who were economically inactive in the UK, of which 1.4 million were men and 2.0 million were women.
Of the 3.4 million economically inactive individuals aged 50 to 64, 43.8% gave ‘sick or disabled’ as the main reason for not looking for work. This percentage has dropped by 0.9 percentage points since 2025, which is not statistically significant. A further 31.1% (in 2026) gave the reason ‘retired’ and 12.7% gave the reason ‘looking after home or family’. The remaining inactive people aged 50 to 64 years (12.4%) gave ‘other’ as the main reason for not looking for work.
In 2026, the proportion of economically inactive women aged 50 to 64 who gave ‘looking after home or family’ as the main reason for not looking for work (16.5%) was statistically significantly higher compared to economically inactive men of the same age (7.4%), with women being more than twice as likely as men to report this reason. Meanwhile, the proportion of economically inactive men aged 50 to 64 giving the main reason as ‘retired’ (35.1%) was statistically significantly higher than economically inactive women of the same age (28.2%).
Reasons for not looking for work, individuals aged 50 to 64 who are inactive but are willing or would like to work
In 2026, there were around 585,000 people aged 50 to 64 years who were economically inactive but were willing to, or would like to, work, an increase of around 13,000 people since 2025. Of those 585,000, 62.2% gave the reason for not looking for work as being ‘sick, injured or disabled’, a decrease of 3.9 percentage points from 2025. ‘Looking after home or family’ was given as a reason by 15.8% and 21.9% gave the reason of ‘other’.
Similarly to all economically inactive individuals aged between 50 and 64, among those who are willing or would like to work, a higher proportion of women aged between 50 and 64 (22.0%) gave ‘looking after home and family’ as the main reason for not looking for work than men (9.0%). For women, this proportion was an increase of 1.0 percentage point compared with 2025, whereas the proportion for men decreased by 0.6 percentage points.
Inactivity and previous employment
In 2026, 49.9% of individuals aged 50 to 64 who were inactive left their job five or more years ago. A higher proportion of women (52.4%) aged 50 to 64 who were inactive left their job more than five years ago compared to men (46.5%). The next highest proportions were inactive individuals who had left their job in the last year (10.8%) and those who had left 1 year ago but less than 2 years ago (9.8%).
In 2026, the highest proportion of individuals aged 50 to 64 who were inactive and left their job in the last 2 years worked in the banking and finance sector (15.5%), followed by the human health and social work sector (15.2%).
Of those who are inactive due to retirement and left their job in the last 2 years, the highest proportion worked in the banking and finance sector (16.5%), followed by the public admin sector (14.3%).
7. Unemployment
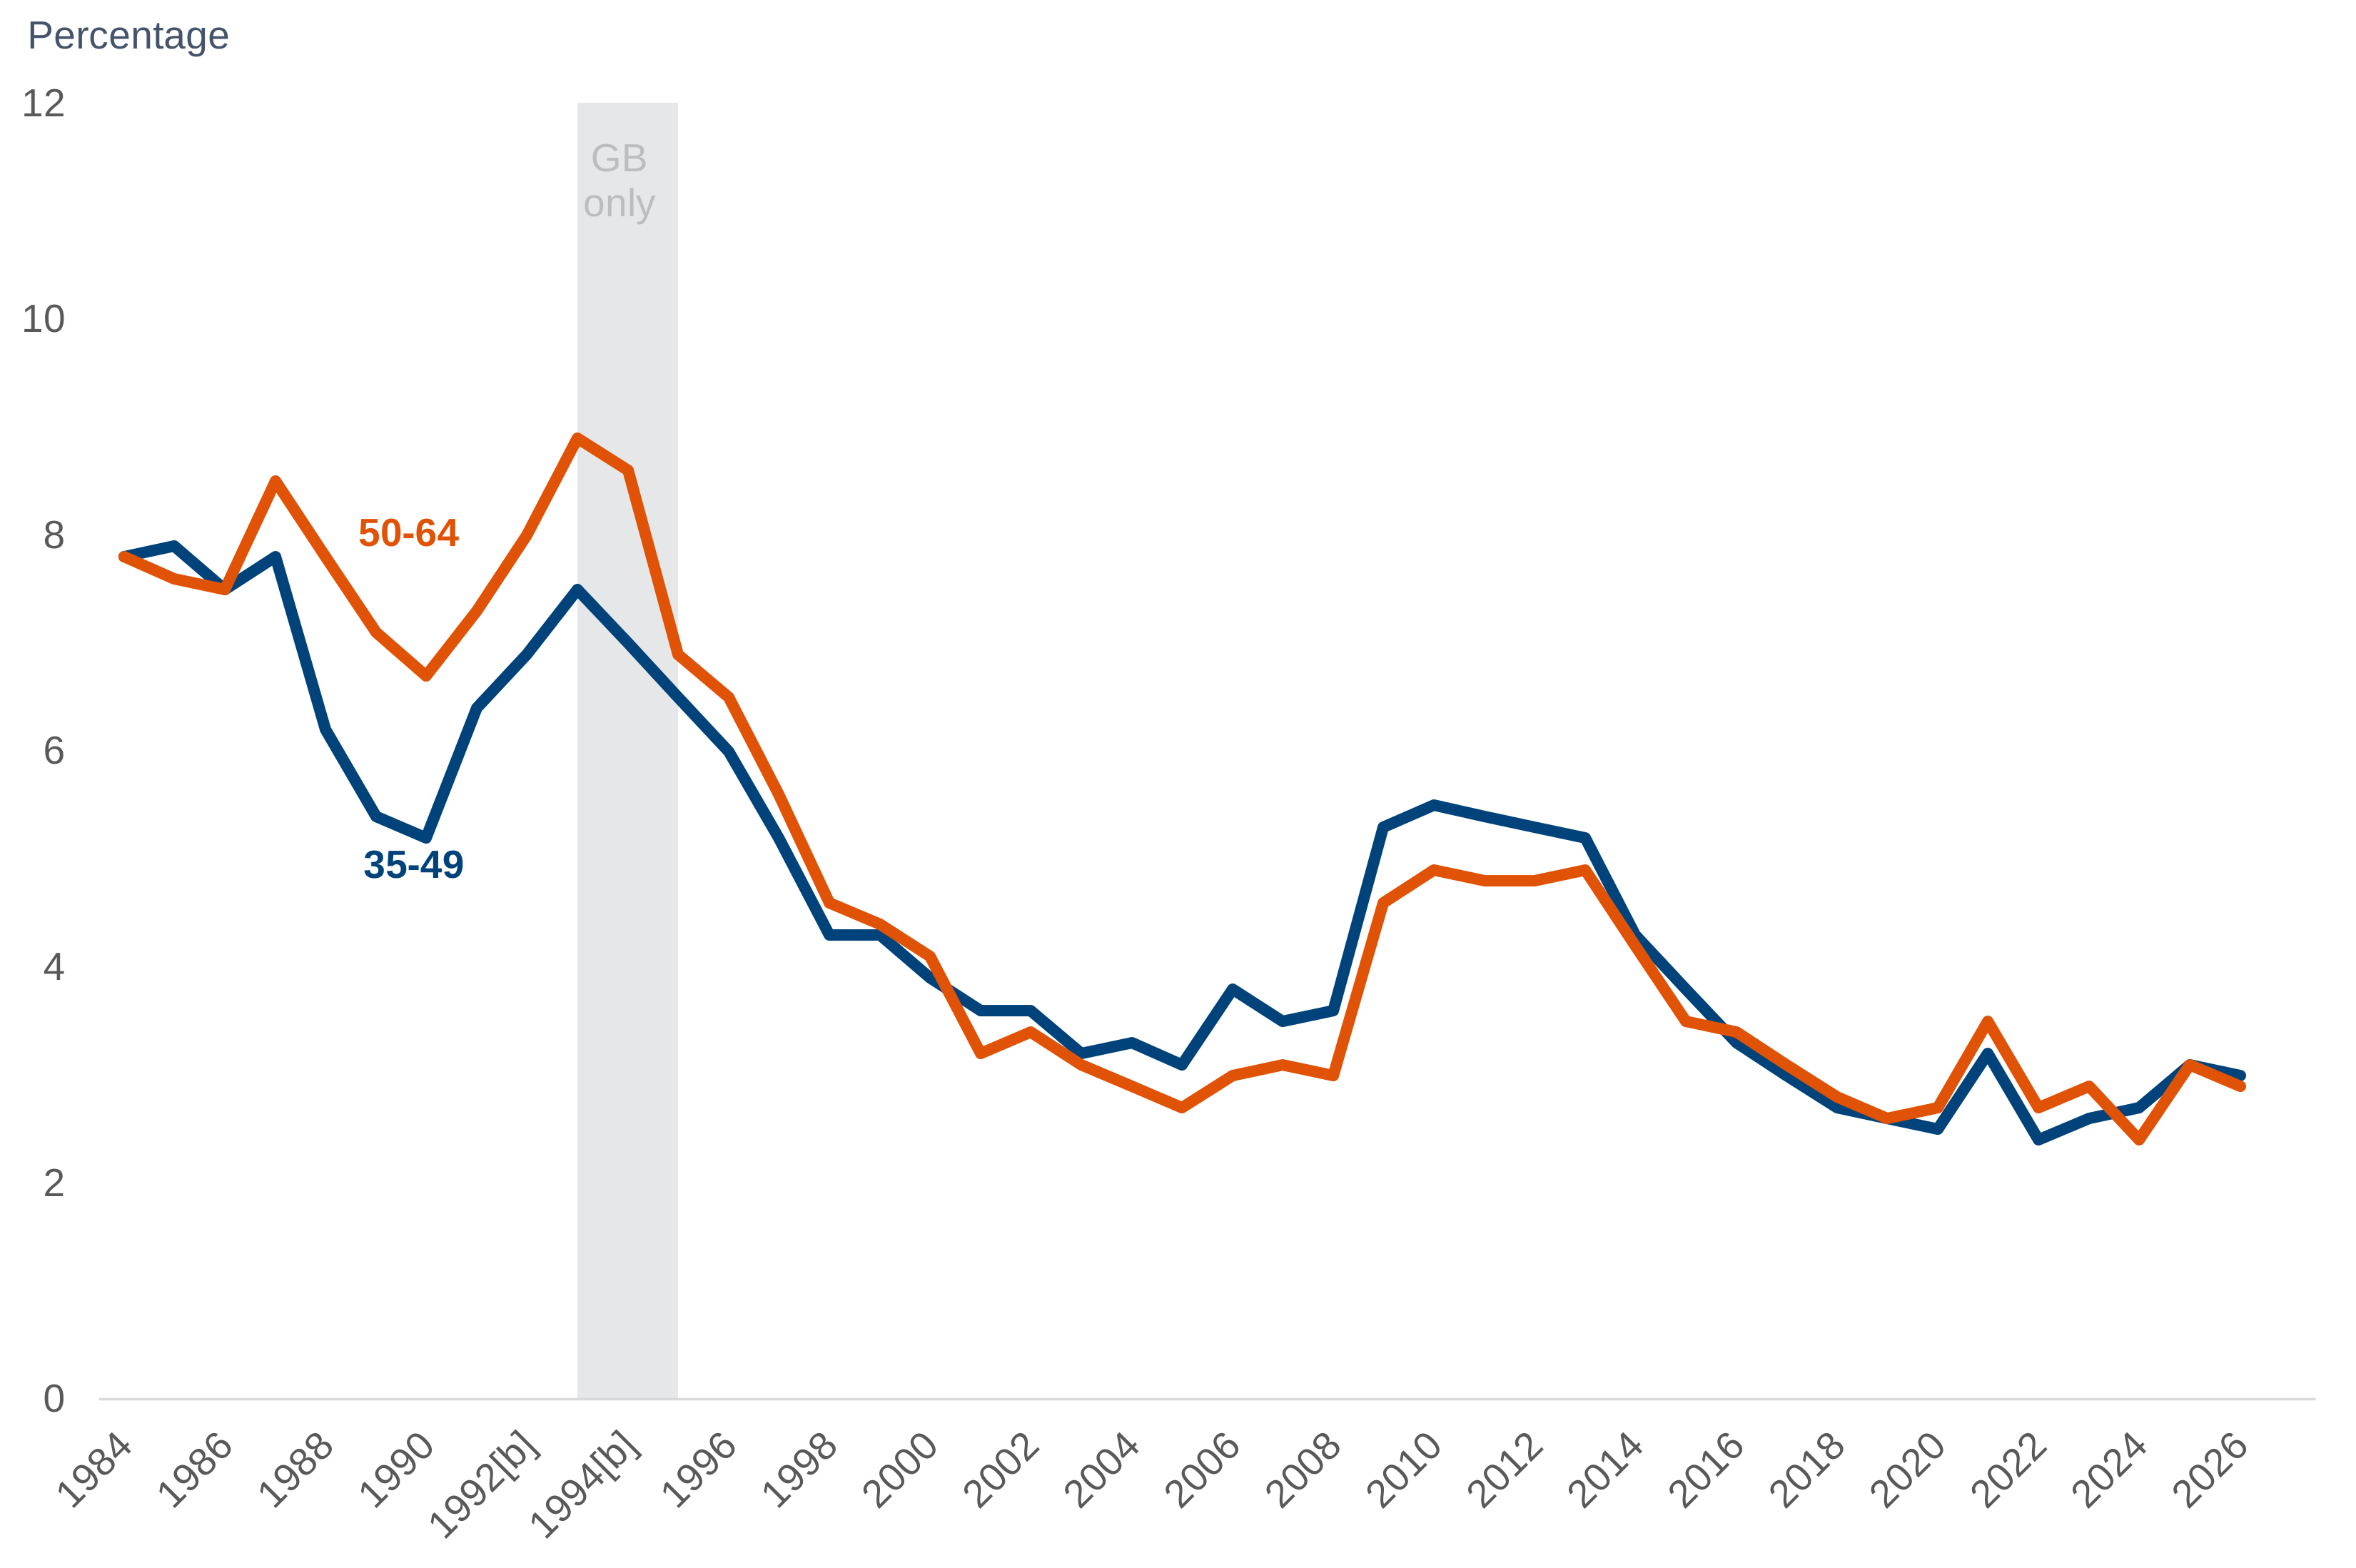
The unemployment rate for people aged 50 to 64 group decreased by 0.2 percentage points from 3.1% in 2025 to 2.9% in 2026. This change is not statistically significant.
The unemployment rate for people aged 50 to 64 years follows a similar overall trend to the unemployment rate for people aged 35 to 49 years, with both rates tracking very closely since 2014. Since 2023, the unemployment rates for these two groups have had the 50 to 64 group be higher in 2023 (2.6% aged 35 to 49 vs. 2.9% aged 50 to 64) and then the rate for those aged 35 to 49 be higher in 2024 (2.7% aged 35 to 49 vs. 2.4% aged 50 to 64). In 2026, there is a 0.1 percentage point difference between the two age groups (3.0% aged 35 to 49 vs. 2.9% aged 50 to 64). None of these differences are statistically significant, meaning these rates are very similar for both age groups.
Unemployment rate for people aged 35 to 49 years and people aged 50 to 64 years, 1984 to 2026, UK
Source: Table 8 Economic Labour Market Status of individuals aged 50 and over statistics.
In the mid-1990s the unemployment rate for men aged 50 to 64 years was around 4.8 percentage points higher than the rate for women of the same age. At this time, women aged 50 to 64 years were more likely than men to be economically inactive. The gender difference in the unemployment rate started to narrow from the mid-1990s onwards. In 2026, the difference in the unemployment rate gap between men and women aged 50 to 64 decreased from 0.8 percentage points in 2025 to 0.7 percentage points in 2026 and this change is statistically significant.
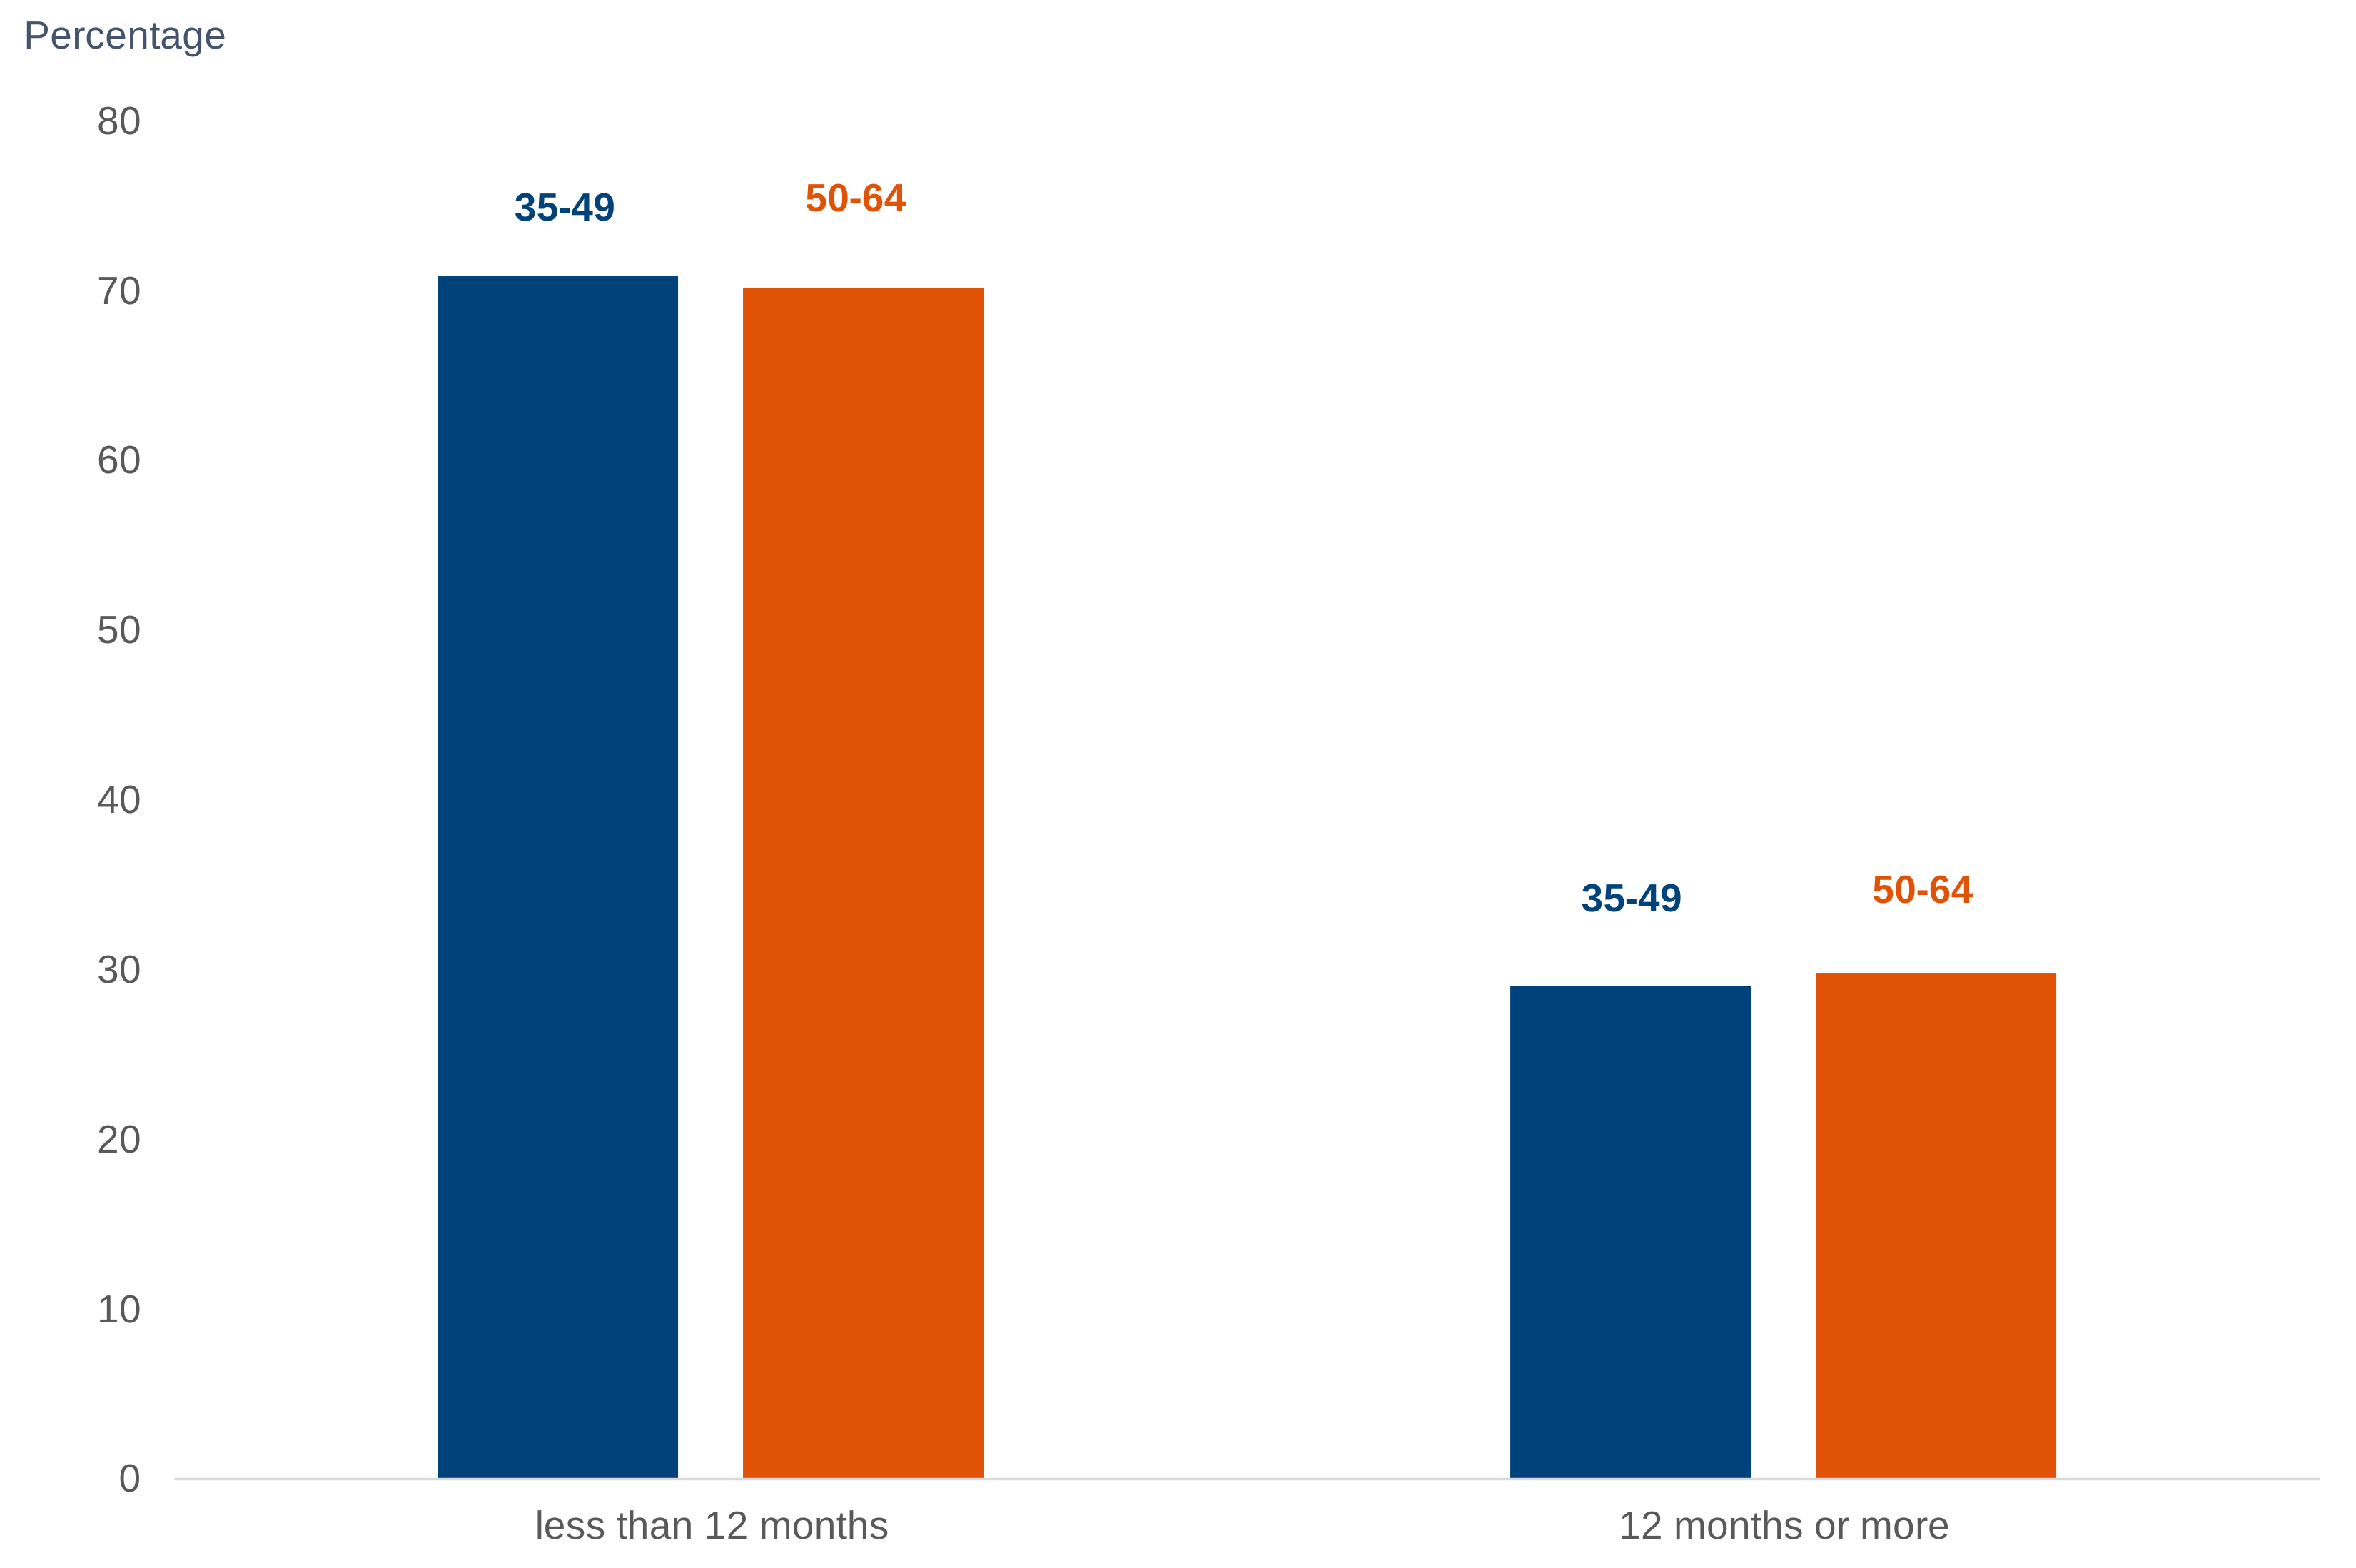
Those aged 50 to 64 years, who are unemployed, are more likely to be unemployed for a shorter amount of time than be classified as “long-term unemployed” (defined as being unemployed for 12 months or more). In 2026, 70.2% of people aged 50 to 64 years had been unemployed for less than 12 months and 29.8% had been unemployed for more than 12 months.
Despite this, of those who are unemployed, individuals aged 50 to 64 years are more likely to be classified as long-term unemployed than unemployed individuals aged 35 to 49. In 2026, out of those who are unemployed, the proportion of individuals aged 50 to 64 years who were long-term unemployed was 29.8% compared to 29.1% of those long-term unemployed aged 35 to 49 years, a 0.7 percentage point gap, which is not statistically significant. Over the past year, the gap between those long-term unemployed aged 50 to 64 years and those aged 35 to 49 years has decreased from 1.6 percentage points to 0.7 percentage points. This change is statistically significant.
Proportion of those unemployed for 12 months or longer, of those unemployed for people aged 35 to 49 and 50 to 64 years, 2024 and 2026
Source: Table 20 Economic Labour Market Status of individuals aged 50 and over statistics.
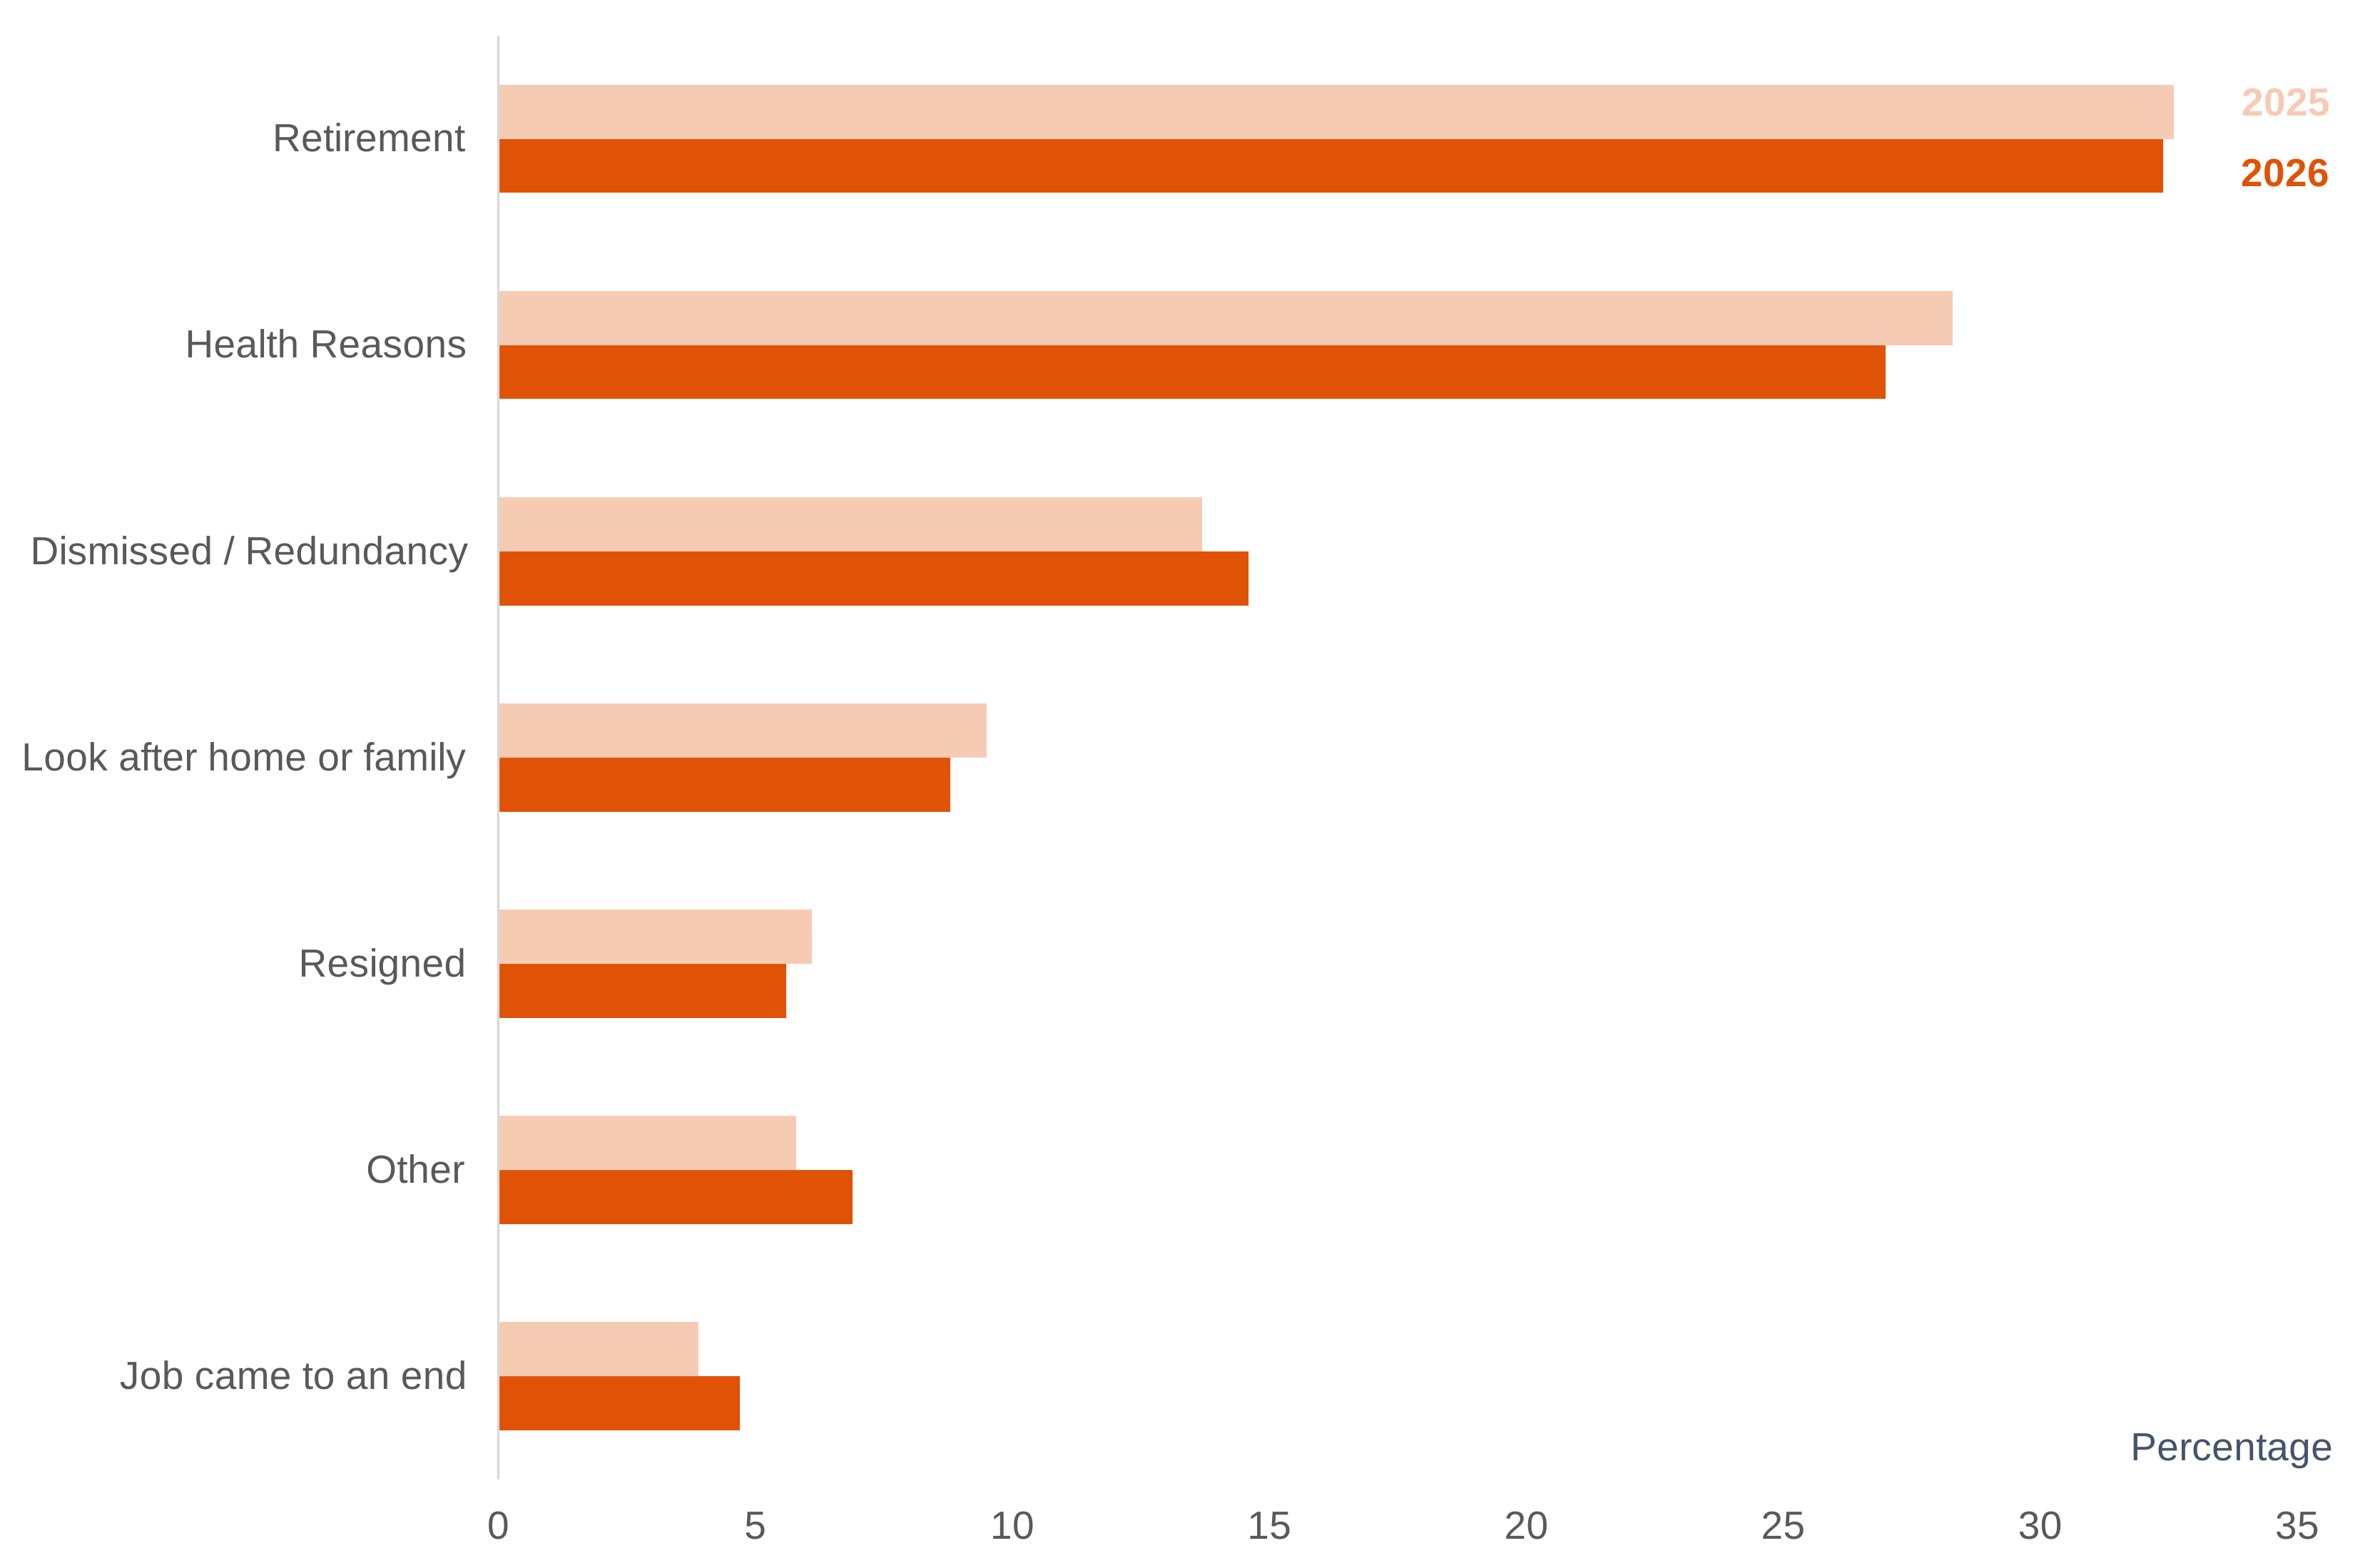
Of the 2.1 million people aged 50 to 64 years who were not in work in 2026 (those inactive or unemployed) and who had left their last job at some point in the last eight years, around one third (32.4%) gave a reason for leaving their last job as ‘retirement’. This is a decrease from 2025 (32.6%).
Those leaving their last job due to ‘health reasons’ has decreased in the past year. In 2026, 27.0% of relevant individuals had left their last job in the last eight years due to ‘health reasons’. This has decreased by 1.3 percentage points since 2025; this decrease is not statistically significant.
Women are more likely than men to have left work in the last eight years due to ‘looking after the home or family’ with 11.3% of women leaving due to this reason compared to 5.9% of men.
Reason for leaving last job, people aged 50 to 64 who are not in work, UK, 2024 and 2026
Source: Table 15 Economic Labour Market Status of individuals aged 50 and over statistics.
8. About these statistics
These ‘Official Statistics in Development’ have been compiled using data from the Labour Force Survey (LFS). The LFS is produced by the Office for National Statistics (ONS) and follows the same definitions and UK coverage used in the ONS Labour Market Statistics bulletin.
As part of continuing work to improve Labour Force Survey estimates (which have been affected by changes to survey operation caused by the coronavirus (COVID-19) pandemic), typical weighting methodology was reinstated from 13 February 2024. The new reweighted LFS estimates incorporate latest estimates of the size and composition of the UK population, improving representativeness. Since December 2024, reweighting has been applied from January to March 2019 onwards. Find more information on reweighting.
Due to the ongoing challenges with response rates and levels, LFS-based labour market statistics will be badged as ‘Official Statistics in Development’ until further review. This is in line with the letter from the Office for Statistics Regulation (OSR).
Pre-release access
In addition to staff who are responsible for the production and quality assurance of the statistics, up to 24-hour pre-release access is provided to Ministers and other officials. We publish the job titles and organisations of the people who have been granted up to 24-hour pre-release access to the latest Economic 50+ Labour Market Statistics.
Where to find out more
For more information on the LFS see the background information and methodology document released alongside these statistics.
This release, the summary tables and background information for the statistics, can be found on the Economic labour market status of individuals aged 50 and over page.
More information about the LFS can be found on the Labour Force Survey (LFS) quality and methodology information (QMI).
Contact information and feedback
The Department for Work and Pensions (DWP) would like to hear your views on these statistics. We would be interested in hearing what you use them for and how well they meet your requirements. Please e-mail: 50pluschoices.analysis@dwp.gov.uk
Press enquiries should be directed to the DWP Press Office.
Author: Daniel Jendrzejewski
Lead Analyst: Matthew Collins
ISBN: 978-1-78659-884-4