Economic Estimates: Employment in the Digital Sector, January 2025 to December 2025
Published 1 October 2026

© Crown copyright 2026
This publication is licensed under the terms of the Open Government Licence v3.0 except where otherwise stated. To view this licence, visit nationalarchives.gov.uk/doc/open-government-licence/version/3 or write to the Information Policy Team, The National Archives, Kew, London TW9 4DU, or email: psi@nationalarchives.gov.uk.
Where we have identified any third party copyright information you will need to obtain permission from the copyright holders concerned.
This publication is available at https://www.gov.uk/government/statistics/economic-estimates-employment-in-the-digital-sector-january-2025-to-december-2025/economic-estimates-employment-in-the-digital-sector-january-2025-to-december-2025
1. Details
This publication provides estimates of employment in the Digital Sector and the United Kingdom (UK) overall based on the latest 2025 data from the Annual Population Survey (APS) run by the Office for National Statistics (ONS). For this purpose, estimates will cover employment (measured by the number of filled jobs) in the Digital Sector from January 2025 to December 2025 (calendar year).
Statistics in this release have been reclassified as Official Statistics in Development due to issues with low sample size in underlying Annual Population Survey (APS) data, in line with other statistical organisations (including the ONS). Although the ONS has since reviewed this decision and will publish future APS based outputs as Official Statistics, this publication will remain Official Statistics in Development as it is based on APS data which were classified as Official Statistics in Development at publication. For further information on this decision, please see Section 4: Technical Note.
Approximate number of filled jobs discussed in this report are rounded to the nearest 1,000 or the nearest 10,000 where figures are over 1 million.
2. Highlights
- Digital Sector employment was approximately 1.81 million in 2025, an increase on the 1.77 million Digital Sector filled jobs reported in 2024.
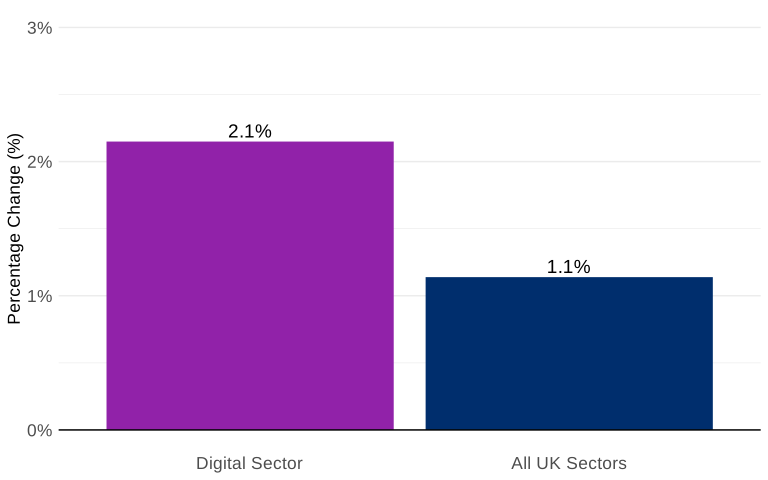
- Digital Sector filled jobs increased by approximately 38,000 or 2.1% from 2024 to 2025. By comparison, employment in the UK overall increased by approximately 388,000 filled jobs or 1.1% from 34.07 million in 2024 to 34.46 million in 2025.
- The Digital Sector accounted for 5.2% of the UK’s filled jobs in 2025, no change on the 5.2% proportion reported in 2024.
- The increase in Digital Sector filled jobs between 2024 and 2025 follows a decrease in Digital Sector filled jobs of 120,000 or 6.3% from 2023 to 2024.
- Between 2024 and 2025, the largest absolute increases in employment were in the ‘Film, TV, video, radio and music’, ‘Computer programming, consultancy and related activities’ and ‘Publishing (excluding translation and interpretation activities)’ subsectors, up 23,000, 17,000 and 11,000 filled jobs respectively. The largest absolute decrease in Digital Sector employment was in the ‘Manufacturing of electronics and computers’ subsector, down 18,000 filled jobs.
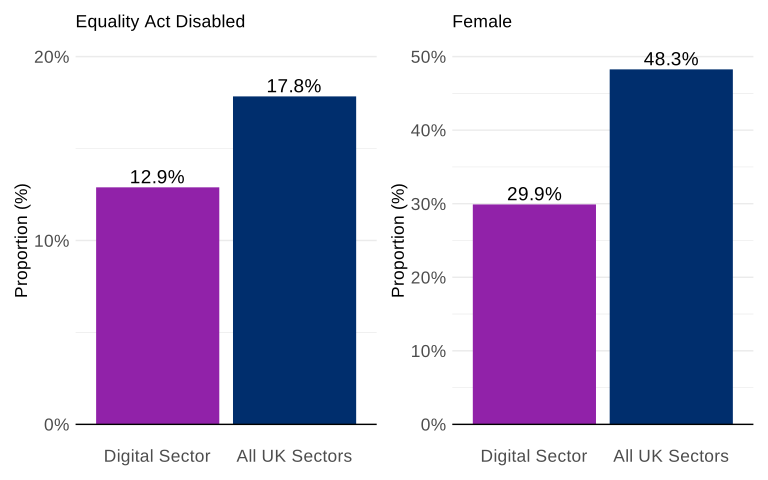
- The proportion of filled jobs held by female workers in the Digital Sector was 29.9% in 2025, an increase from 28.5% in 2024. The proportion of filled jobs held by disabled workers was 12.9% in 2025, a decrease from 15.1% in 2024. The Digital Sector continued to under-represent these groups compared to the UK overall within which 48.3% were female workers and 17.8% were disabled workers.
- The largest proportional increase in Digital Sector employment across regions of the UK was in the North East of England, which increased by 24.3% or approximately 9,000 filled jobs from 2024 to 2025. London saw the largest absolute increase in Digital Sector filled jobs at approximately 23,000 or 5.1%. London continued to hold the largest proportion of Digital Sector filled jobs at 26.1% in 2025, up 0.8 percentage points on 2024.
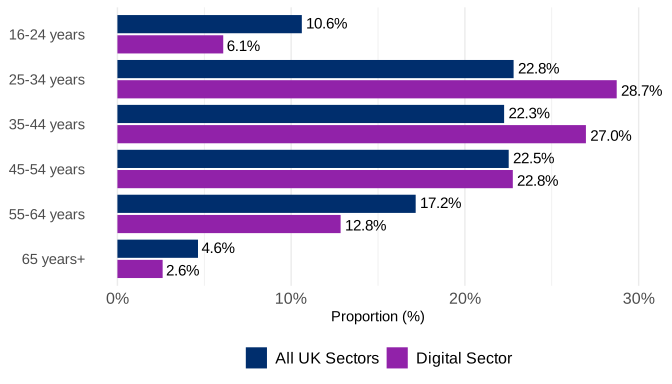
- The largest absolute increase in Digital Sector employment from 2024 to 2025 across age bands was for people aged 35-44, up approximately 38,000 filled jobs or 8.5%. Digital Sector filled jobs for people aged 16-24 also increased by 8.9% or approximately 9,000 filled jobs. The 25-34 and 35-44 age groups continued to hold the largest proportion of Digital Sector filled jobs at 28.7% and 27.0% respectively.
3. Sectors
The estimates reported in this release cover employment (measured by the number of filled jobs) in the Digital Sector and its subsectors, as well as employment in the UK overall.
It should be noted that while the Telecommunications Sector is considered a sector in its own right, it is also a subsector within the Digital Sector. Aggregates based on the Digital Sector, therefore, include data from the Telecommunications Sector in addition to all other Digital Subsectors.
Please see the associated technical and quality assurance report for more information on how we define the Digital Sector and its subsectors.
4. Technical Note
The ‘Economic Estimates: Employment in the Digital Sector, January 2025 to December 2025’ report is derived from the Office for National Statistics (ONS) Annual Population Survey (APS). This statistical release provides estimates of the number of filled jobs, including both full-time and part-time jobs, in the Digital Sector for the calendar year January 2025 and December 2025. Estimates for January 2024 to December 2024 published by the former Department for Science Innovation and Technology (DSIT) in July 2025, have been used to produce comparisons in this report.
The statistics in this series (including this release) are classified as Official Statistics in Development. Previous releases in the Digital Sector Economic Estimates: Employment series have been classed as Accredited Official Statistics. The Office for Statistics Regulation (OSR) has removed accreditation at former-DSIT’s request, following ONS reporting concerns with the quality of estimates for smaller segments of the APS population, which the Digital Sector Economic Estimates: Employment series depends upon. The ONS provide further information on APS quality issues in their APS quality update article.
Our approach in moving the Digital Sector Economic Estimates: Employment series to Official Statistics in Development is in line with ONS’s decision to consider its APS based labour market statistics as Official Statistics in Development. Although ONS has since reviewed this decision and will publish future APS based outputs as Official Statistics, this publication will remain Official Statistics in Development. This is because this publication is based on APS data which were classified as Official Statistics in Development at publication.
We have additionally compared APS based employment estimates with employment estimates derived from other data sources in order to review the statistical robustness of employment estimates in previous releases. This comparison showed APS based employment estimates diverged from alternative data sources from 2019 onwards, suggesting further potential data quality issues with underlying APS data. Further information on this potential data quality issue is available in the technical report. Users are advised to consult a wide range of data sources to evaluate trends in Digital Sector employment.
In addition to reclassifying Economic Estimates: Employment in the Digital Sector estimates as Official Statistics in Development, we have removed breakdowns to the individual SIC code level due to low sample sizes. We have also included coefficient of variation and confidence interval measures of variability to provide further information on the statistical robustness of employment estimates.
Although we provide confidence intervals and coefficient of variation data to help users assess the statistical uncertainty associated with estimates in this release, changes from year to year have not been tested for significance. As a result, users should exercise caution when interpreting year-on-year changes, as apparent differences in estimates may reflect sampling variability rather than underlying changes in employment.
In order to produce these Economic Estimates, it is necessary to define the make-up of the economy and the sectors comprising it. The Digital Sector definition is based on Standard Industrial Classification 2007 (SIC) codes. This allows data sources to be nationally consistent and enables international comparisons. The definition of the Digital Sector is based on the Organisation for Economic Cooperation and Development (OECD) definition of the ‘information society’. This is a combination of the OECD definition for the ‘ICT Sector’ and the ‘Content and Media Sector’.
To produce our Employment estimates, we only include respondents who are ‘in work’ from the APS dataset for analysis. The APS provides data on an individual level for both a respondent’s first job, and if applicable, a respondent’s second job as separate variables. The APS also includes data on those who have a first or second job but are inactive, for example due to long-term illness. Therefore, in the dataset across these two variables, we define ‘in work’ as those with a first or second job who are categorised as an employee or self-employed. The data presented in this report, and the accompanying Employment dataset, therefore includes both employed and self-employed workers.
As we estimate employment as the number of filled jobs, we restructure the data to be on a per job basis, rather than a per respondent basis. Restructuring by filled jobs means that some respondents may be included in the data tables twice if they have both a first and second job in the Digital Sector. Inclusion of jobs from the same individual more than once makes up less than 4% of the Digital Sector total filled jobs.
After restructuring, we select entries that are relevant for a particular subsector (e.g. all entries with a SIC code of 26.11 to calculate total employment in ‘Manufacture of electronic components’ subsector) and aggregate over the associated population weights to generate an estimate of the total filled jobs. These estimates are then provided for demographic breakdowns.
Demographic breakdowns in the associated data tables provide estimates for employment status (employed/self-employed), International Territorial Level 1 (ITL1) region of work, nationality, sex, ethnicity, age, highest level of education, working pattern (full time/part time), managerial status, socio-economic group (National Statistics Socio-economic Classification), and Equality Act disability status. Data on demographic breakdowns, including the sex of workers, are collected through survey questions. Whilst there are additional breakdowns in the associated data tables combining selected variables with employment status, some of these additional breakdowns have been removed due to low sample sizes.
As part of the production process, we apply disclosure control and quality assurance measures to prevent the identification of any respondents. We suppress values where the number of respondents for a particular demographic breakdown is below a set threshold (below or equal to 3 responses). Where appropriate, we also apply secondary suppression to prevent disclosure via differencing (i.e. being able to calculate the disclosed value from the other values presented).
Proportions provided within the demographic breakdowns in this report are calculated based on the total number of people who answered the relevant question (e.g. the proportion of self-employed people working in the Digital Sector would be calculated by dividing the number of self-employed people by the sum of the number of self-employed and employed and then multiplying by 100).
For more detailed information on the methodology, as well as its limitations, data sources, and quality assurance processes, see the associated technical and quality assurance report.
We will continue to monitor the reliability of underlying data, review the designation and provide caveats for the Economic Estimates: Employment in the Digital Sector series where appropriate in line with the Code of Practice for Statistics.
You are welcome to contact us directly with any comments about how we meet these standards.
Alternatively, you can contact OSR by emailing regulation@statistics.gov.uk or via the OSR website.
5. Change in Employment
5.1 Digital Sector
During the 2025 calendar year, there were a total of approximately 1.81 million filled jobs in the Digital Sector. This is higher than in 2024 with an increase of approximately 38,000 filled jobs.
In terms of percentage change, employment in the Digital Sector increased by 2.1% compared to a 1.1% increase for the UK overall (approximately 388,000 filled jobs) between 2024 to 2025, as shown in Figure 1. The Digital Sector made up approximately 5.2% of filled jobs in the UK overall in 2025, no change on the 5.2% proportion reported in 2024.
Figure 1: Percentage change in employment (filled jobs) within the Digital Sector and the UK overall, 2024 to 2025.
As shown in Figure 2, there was an increase in the number of Digital Sector filled jobs between 2024 to 2025. This follows a decrease in Digital Sector filled jobs from 2023 to 2024, occurring after no substantial change in Digital Sector employment from 2022 to 2023. Figure 2 also shows an increase in the size of confidence intervals, particularly since 2019. Table 1 shows that the size of the confidence intervals increased from 100,000 filled jobs in 2019 to 130,000 filled jobs in 2025. This increase in the size of the confidence intervals indicates a decrease in the certainty of employment estimates due to sampling issues. These confidence intervals do not, however, capture uncertainty resulting from all data quality issues outlined in the technical report. For example, uncertainty due to weighting inaccuracies or survey mode changes would not be captured.
Figure 2: Employment (filled jobs) in the Digital Sector with confidence intervals, UK, 2014 to 2025.
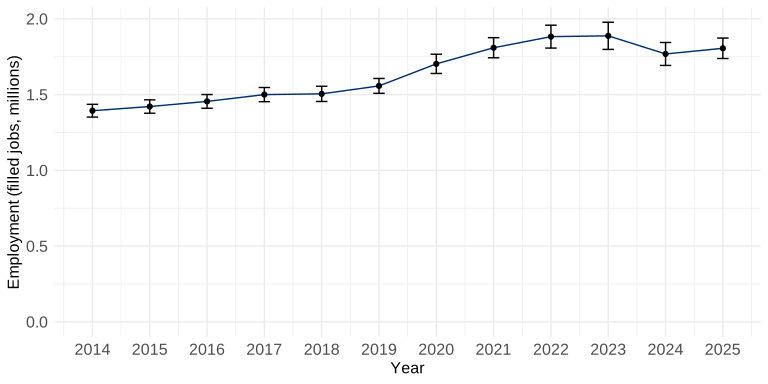
Table 1: Employment (filled jobs) estimates and confidence interval limits shown in Figure 2, millions of filled jobs, UK, 2014 to 2025.
| Year | 2014 | 2015 | 2016 | 2017 | 2018 | 2019 | 2020 | 2021 | 2022 | 2023 | 2024 | 2025 |
|---|---|---|---|---|---|---|---|---|---|---|---|---|
| Upper confidence interval | 1.44 | 1.47 | 1.50 | 1.55 | 1.56 | 1.61 | 1.77 | 1.88 | 1.96 | 1.98 | 1.84 | 1.87 |
| Employment estimate | 1.39 | 1.42 | 1.46 | 1.50 | 1.50 | 1.56 | 1.70 | 1.81 | 1.88 | 1.89 | 1.77 | 1.81 |
| Lower confidence interval | 1.35 | 1.38 | 1.41 | 1.45 | 1.45 | 1.51 | 1.64 | 1.74 | 1.81 | 1.80 | 1.69 | 1.74 |
5.2 Digital Subsectors
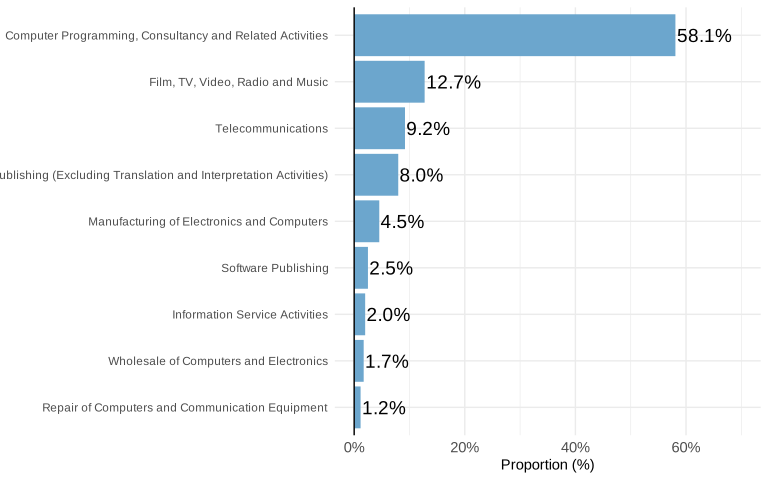
The ‘Computer programming, consultancy and related activities’ subsector is the largest Digital Subsector constituting 58.1% of Digital Sector filled jobs, as shown in Figure 3. The next largest Digital Subsector is ‘Film, TV, video, radio and music’ at 12.7% of Digital Sector filled jobs in 2025. ‘Telecommunications’, ‘Publishing (excluding translation and interpretation activities)’ and ‘Manufacturing of electronics and computers’ each make up 9.2%, 8.0% and 4.5% of Digital Sector filled jobs respectively. The remaining Digital Subsectors combined make up a total of 7.4% of Digital Sector filled jobs.
Figure 3: Proportion of Digital Sector employment (filled jobs) in the Digital Subsectors, UK, 2025.
While employment in the Digital Sector increased from 2024 to 2025, it did not increase equally or for all Digital Subsectors, as shown in Figures 4 and 5.
Figure 4 shows that three Digital Subsectors were responsible for the majority of the increase in Digital Sector employment from 2024 to 2025. The largest absolute increase in employment was approximately 23,000 filled jobs (up 11.1% on 2024) in the ‘Film, TV, video, radio and music’ subsector. The ‘Computer programming, consultancy and related activities’ subsector had the second largest absolute increase in Digital Sector filled jobs at approximately 17,000 (up 1.6% on 2024). The third largest absolute increase in employment between 2024 and 2025 was in the ‘Publishing (excluding translation and interpretation activities)’ subsector at approximately 11,000 filled jobs (up 8.3% on 2024).
Combining the change in employment across these three subsectors sums to an increase of approximately 51,000 filled jobs. This accounts for more than the total 38,000 approximate increase in filled jobs observed across the whole Digital Sector, as there was a decrease in employment in other Digital Subsectors.
The largest absolute decrease in employment across Digital Subsectors from 2024 to 2025 was approximately 18,000 filled jobs in ‘Manufacturing of electronics and computers’ (down 18% on 2024).
Figure 4: Absolute change in employment in the Digital Subsectors, thousands of filled jobs, UK, 2024 to 2025.
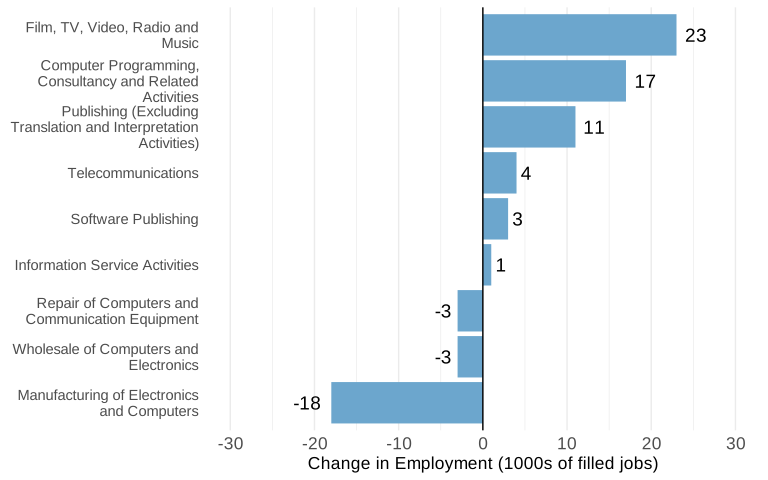
As shown in Figure 5, despite relatively small absolute changes in employment the ‘Software publishing’ and ‘Repair of computers and communication equipment’ subsectors saw relatively large proportional changes in employment. Between 2024 and 2025, the ‘Software publishing’ subsector grew by only approximately 3,000 filled jobs but 7.1%. The ‘Repair of computers and communication equipment’ subsector decreased by only approximately 3,000 filled jobs but 12.5%. As described earlier, these Digital Subsectors are relatively small, meaning that even small absolute changes can result in relatively large proportional changes.
Figure 5: Percentage change in employment (filled jobs) in the Digital Subsectors, UK, 2024 to 2025.
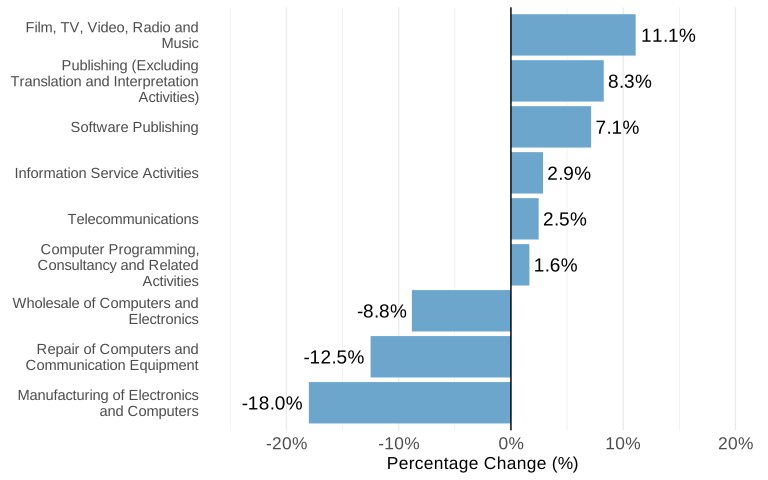
All remaining Digital Subsectors had relatively small changes in employment: ‘Telecommunications’ increased by approximately 4,000 filled jobs (up 2.5% on 2024); ‘Information service activities’ increased by approximately 1,000 filled jobs (up 2.9% on 2024); ‘Wholesale of computers and electronics’ decreased by approximately 3,000 filled jobs (down 8.8% on 2024).
For further details on how these Digital Subsectors are defined, please see the associated technical and quality assurance report.
6. Demographic Breakdowns
Within this report, analysis on demographic breakdowns focus on the Digital Sector as a whole. This is because many employment estimates for the demographic breakdowns of Digital Subsectors are of low statistical robustness as they rely on small sample sizes. We therefore only report on notable features or substantial changes in Digital Subsectors which are based on estimates of acceptable statistical robustness or higher. This is defined by a coefficient of variation of 20% or lower. Similar to the standard error, the closer the coefficient of variation is to zero, the more precise the estimate is. Users can see the associated data tables for demographic breakdowns of all Digital Subsectors along with the coefficient of variation measure of statistical robustness. As with confidence intervals, the coefficient of variation data do not capture uncertainty resulting from all data quality issues outlined in the technical report. For example, uncertainty due to weighting inaccuracies or survey mode change would not be captured.
6.1 Disability and Sex
According to 2025 estimates, the proportion of filled jobs held by both disabled workers and female workers within the Digital Sector continued to be smaller than for the UK overall, as shown in Figure 6.
In 2025, the proportion of filled jobs held by disabled workers in the Digital Sector was at 12.9% (approximately 231,000 filled jobs) compared to 17.8% of employment in the UK overall (approximately 6.07 million filled jobs). This represents a decrease in the proportion of filled jobs held by disabled workers working in the Digital Sector, from 15.1% in 2024 (approximately 265,000 filled jobs).
Additionally, in 2025, the proportion of filled jobs held by female workers in the Digital Sector was at 29.9% (approximately 540,000 filled jobs) compared to 48.3% in the UK overall (approximately 16.63 million filled jobs). This represents an increase in the proportion of filled jobs held by female workers in the Digital Sector, up from 28.5% in 2024 (approximately 504,000 filled jobs).
It is important to note that changes in the proportion of filled jobs held by disabled workers and female workers is in the context of an overall increase in Digital Sector employment, as discussed in Section 5.1.
Figure 6: Proportion of filled jobs in the Digital Sector and UK overall, by Equality Act disabled workers (left) and female workers (right), UK, 2025.
The ‘Publishing (excluding translation and interpretation activities)’ sector remained the only Digital Subsector with a higher proportion of filled jobs held by female workers than the UK overall at 53.5% compared to 48.3% for the UK overall. The proportion of filled jobs held by female workers in the ‘Publishing (excluding translation and interpretation activities)’ sector decreased by 6.4 percentage points from 2024 to 2025 with the number of filled jobs decreasing by approximately 2,000 for female workers and increasing by approximately 14,000 for male workers.
6.2 Ethnicity
In 2025, the proportion of filled jobs held by people from the Asian or Asian British ethnic group in the Digital Sector was proportionally greater than in the UK overall, as shown in Figure 7. The proportion of filled jobs in the Digital Sector held by people in the Asian or Asian British ethnic group was 13.8% (approximately 249,000 filled jobs) compared to 8.6% for the UK overall (approximately 2.98 million filled jobs).
Conversely, the proportion of filled jobs held by people from the White ethnic group in the Digital Sector was proportionally lower than in the UK overall, as shown in Figure 7. The proportion of filled jobs held by the White ethnic group was 77.7% (approximately 1.4 million filled jobs) compared to 82.8% in the UK overall (approximately 28.54 million filled jobs).
Figure 7: Proportion of employment (filled jobs) held by different ethnic groups, within the Digital Sector and UK overall, 2025.
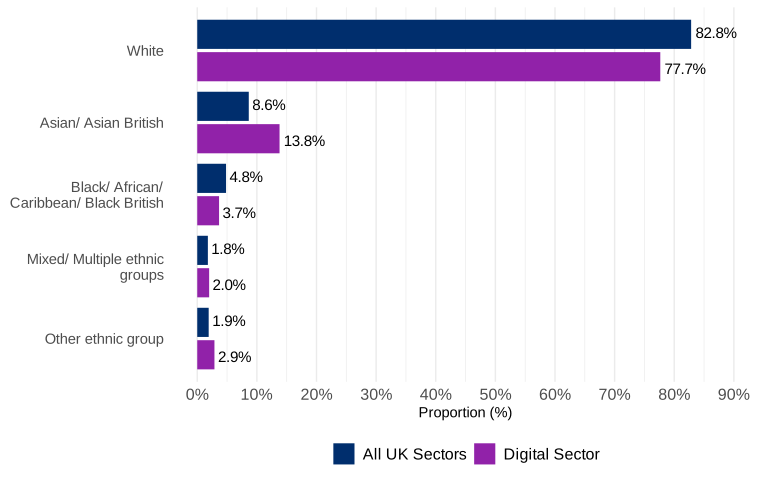
There were small changes in the proportion of jobs held by different ethnicities in the Digital Sector from 2024 to 2025. The largest decrease in proportion from 2024 to 2025 was a 2.2 percentage point decrease in the number of filled jobs held by people from the White ethnic group in the Digital Sector (approximately 11,000 filled jobs) compared to a 1.2 percentage point decrease in the proportion of filled jobs held by this group in the UK overall (approximately 91,000 filled jobs). The proportion of filled jobs held by people from the other ethnicities surveyed each increased by less than 1.0 percentage point in both the Digital Sector and UK overall.
6.3 Region
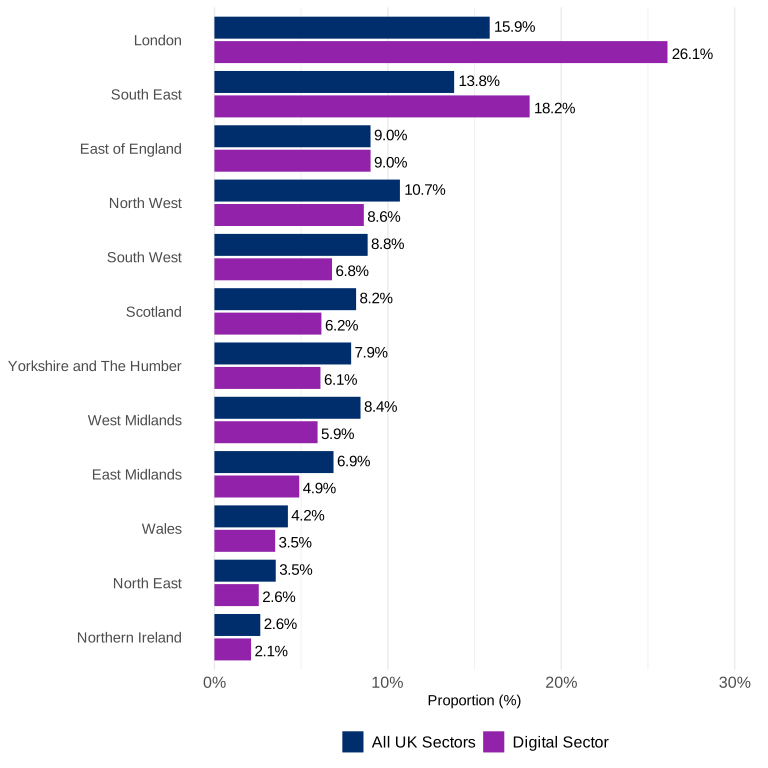
London and the South East of England accounted for the highest proportion of Digital Sector employment in 2025 at 26.1% (approximately 470,000 filled jobs) and 18.2% (approximately 327,000 filled jobs) respectively. As shown in Figure 8, this is higher than these regions’ proportion of filled jobs held across all UK sectors. London accounted for 15.9% (approximately 5.44 million filled jobs) of filled jobs across all UK sectors whilst the South East accounted for 13.7% (approximately 4.73 million filled jobs). Remaining regions of the UK each account for less than 10% of total Digital Sector employment.
Figure 8: Proportion of Digital Sector employment (filled jobs) in regions of the UK, 2025.
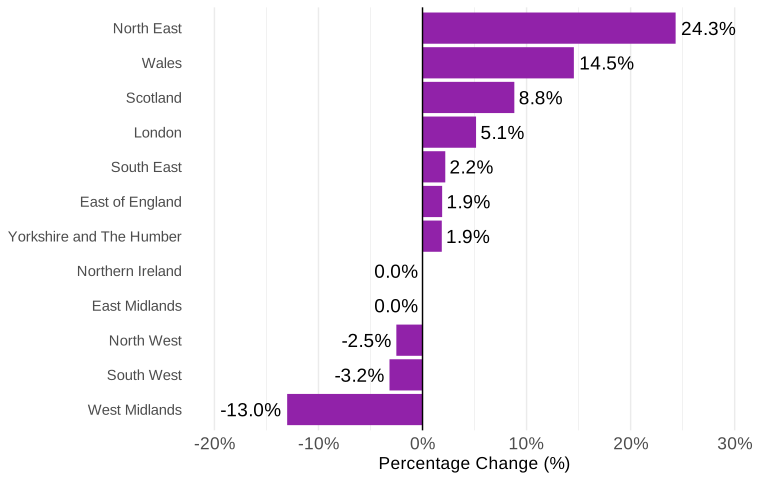
From 2024 to 2025, the largest absolute increase in Digital Sector employment across the regions of the UK was in London at approximately 23,000 filled jobs. As shown in Figure 9, this represents a 5.1% increase in Digital Sector employment in London or an increase of 0.8 percentage points from 25.4% in 2024 to 26.1% in 2025 due to rounding. The largest proportional increase in Digital Sector employment across regions of the UK between 2024 and 2025 was in the North East of England at 24.3% (approximately 9,000 filled jobs). Scotland, Wales and the South East of England each had similar absolute increases in Digital Sector employment at approximately 9,000 (8.8%), 8,000 (14.5%) and 7,000 (2.2%) filled jobs respectively.
The West Midlands had the largest proportional decrease in Digital Sector employment from 2024 to 2025 at 13.0% (approximately 16,000 filled jobs). Digital Sector employment in all other regions of the UK changed by less than 5,000 filled jobs or 4.0% from 2024 to 2025.
Figure 9: Percentage change in employment (filled jobs) in the Digital Sector by regions of the UK, 2024 to 2025.
6.4 Age
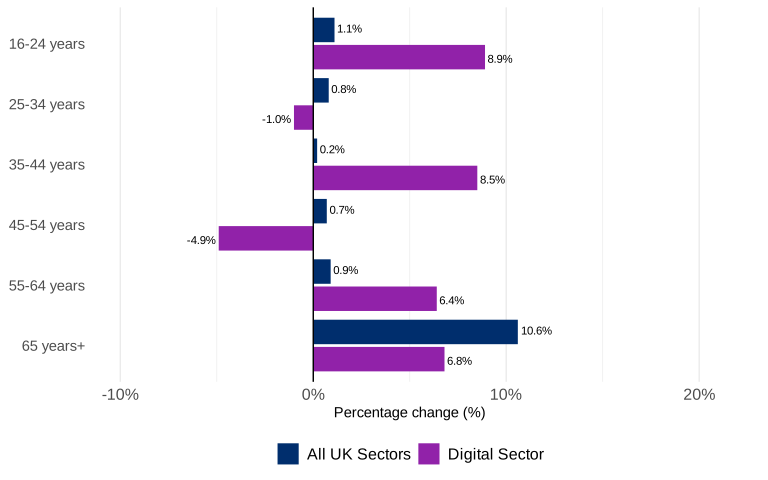
In the previous release we described a decrease in Digital Sector employment for people aged 16-24 of approximately 66,000 filled jobs or 39.6% from 2023 to 2024. Here, we report an increase in Digital Sector employment for people aged 16-24 of approximately 9,000 filled jobs or 8.9% from 2024 to 2025. This is compared to an increase in employment for people aged 16-24 in all sectors of the UK overall of approximately 41,000 filled jobs or 1.1%.
As shown in Figure 10, Digital Sector employment also increased for people aged 35-44, 55-64 and 65+ by approximately 38,000 (8.5%), 14,000 (6.4%) and 3,000 (6.8%) filled jobs respectively. Employment in the UK overall increased for these age groups by 18,000 filled jobs (0.2%) for people aged 35-44, 55,000 filled jobs (0.9%) for people aged 55-64, and 153,000 filled jobs (10.6%) for people aged 65+.
From 2024 to 2025, Digital Sector employment decreased for people aged 25-34 by 5,000 filled jobs (1.0%) and 21,000 filled jobs (4.9%) for people aged 45-54. This is compared to an increase in the UK overall of approximately 65,000 filled jobs (0.8%) for people aged 25-34 and approximately 55,000 filled jobs (0.7%) for people aged 45-54.
Figure 10: Percentage change in employment (filled jobs) in the Digital Sector by age bands, UK, 2024 to 2025.
As shown in Figure 11, the proportion of Digital Sector filled jobs held by people in each age band mirrored proportions in the UK overall for 2025. There was a higher proportion of people aged 16-24 employed in the UK overall at 10.6% compared to the Digital Sector at 6.1%. Similarly, there was a higher proportion of people aged 55-64 employed in the UK overall at 17.2% compared to the Digital Sector at 12.8%.
The Digital Sector employed a higher proportion of people aged 25-34 and 35-44 than the UK overall at 28.7% and 27.0% respectively, compared to 22.8% and 22.3% for the UK overall. The proportion of people aged 45-54 and 65 + in the Digital Sector was 22.8% and 2.6% respectively, similar to the 22.5% and 4.6% of people employed in these aged groups in the UK overall.
Figure 11: Proportion of Digital Sector employment (filled jobs) by age bands, UK, 2025.