Bioscience and health technology sector statistics 2024 to 2025
Published 17 September 2026

© Crown copyright 2026
This publication is licensed under the terms of the Open Government Licence v3.0 except where otherwise stated. To view this licence, visit nationalarchives.gov.uk/doc/open-government-licence/version/3 or write to the Information Policy Team, The National Archives, Kew, London TW9 4DU, or email: psi@nationalarchives.gov.uk.
Where we have identified any third party copyright information you will need to obtain permission from the copyright holders concerned.
This publication is available at https://www.gov.uk/government/statistics/bioscience-and-health-technology-sector-statistics-2024-to-2025/bioscience-and-health-technology-sector-statistics-2024-to-2025
1. Main points
The Office for Life Sciences (OLS) estimates that in 2024/25:
-
there were 6,500 businesses operating in the UK life sciences sector across 7,600 companies. The number of businesses decreased by 4% and the number of companies decreased by 3% compared to 2023/24.
-
these companies employed 306,700 people, a decrease of 2% compared to 2023/24. Companies in the UK life sciences sector generated £125.8 billion of turnover, a 1% decrease compared to 2023/24.
-
in these statistics, the life sciences industry is split into these two main subsectors, biopharmaceuticals and medical technology. The largest subsector in terms of employment and the number of companies was medical technology, which accounted for 59% of companies and 52% of employment. Meanwhile, biopharmaceutical companies accounted for 41% of companies and 48% of employment. The share of companies and employment across the two subsectors was similar in 2024/25 compared to 2023/24.
-
the subsector that generated the highest turnover value was the biopharmaceutical subsector, accounting for 65% of turnover across the life sciences industry. This share remains unchanged from 2023/24.
-
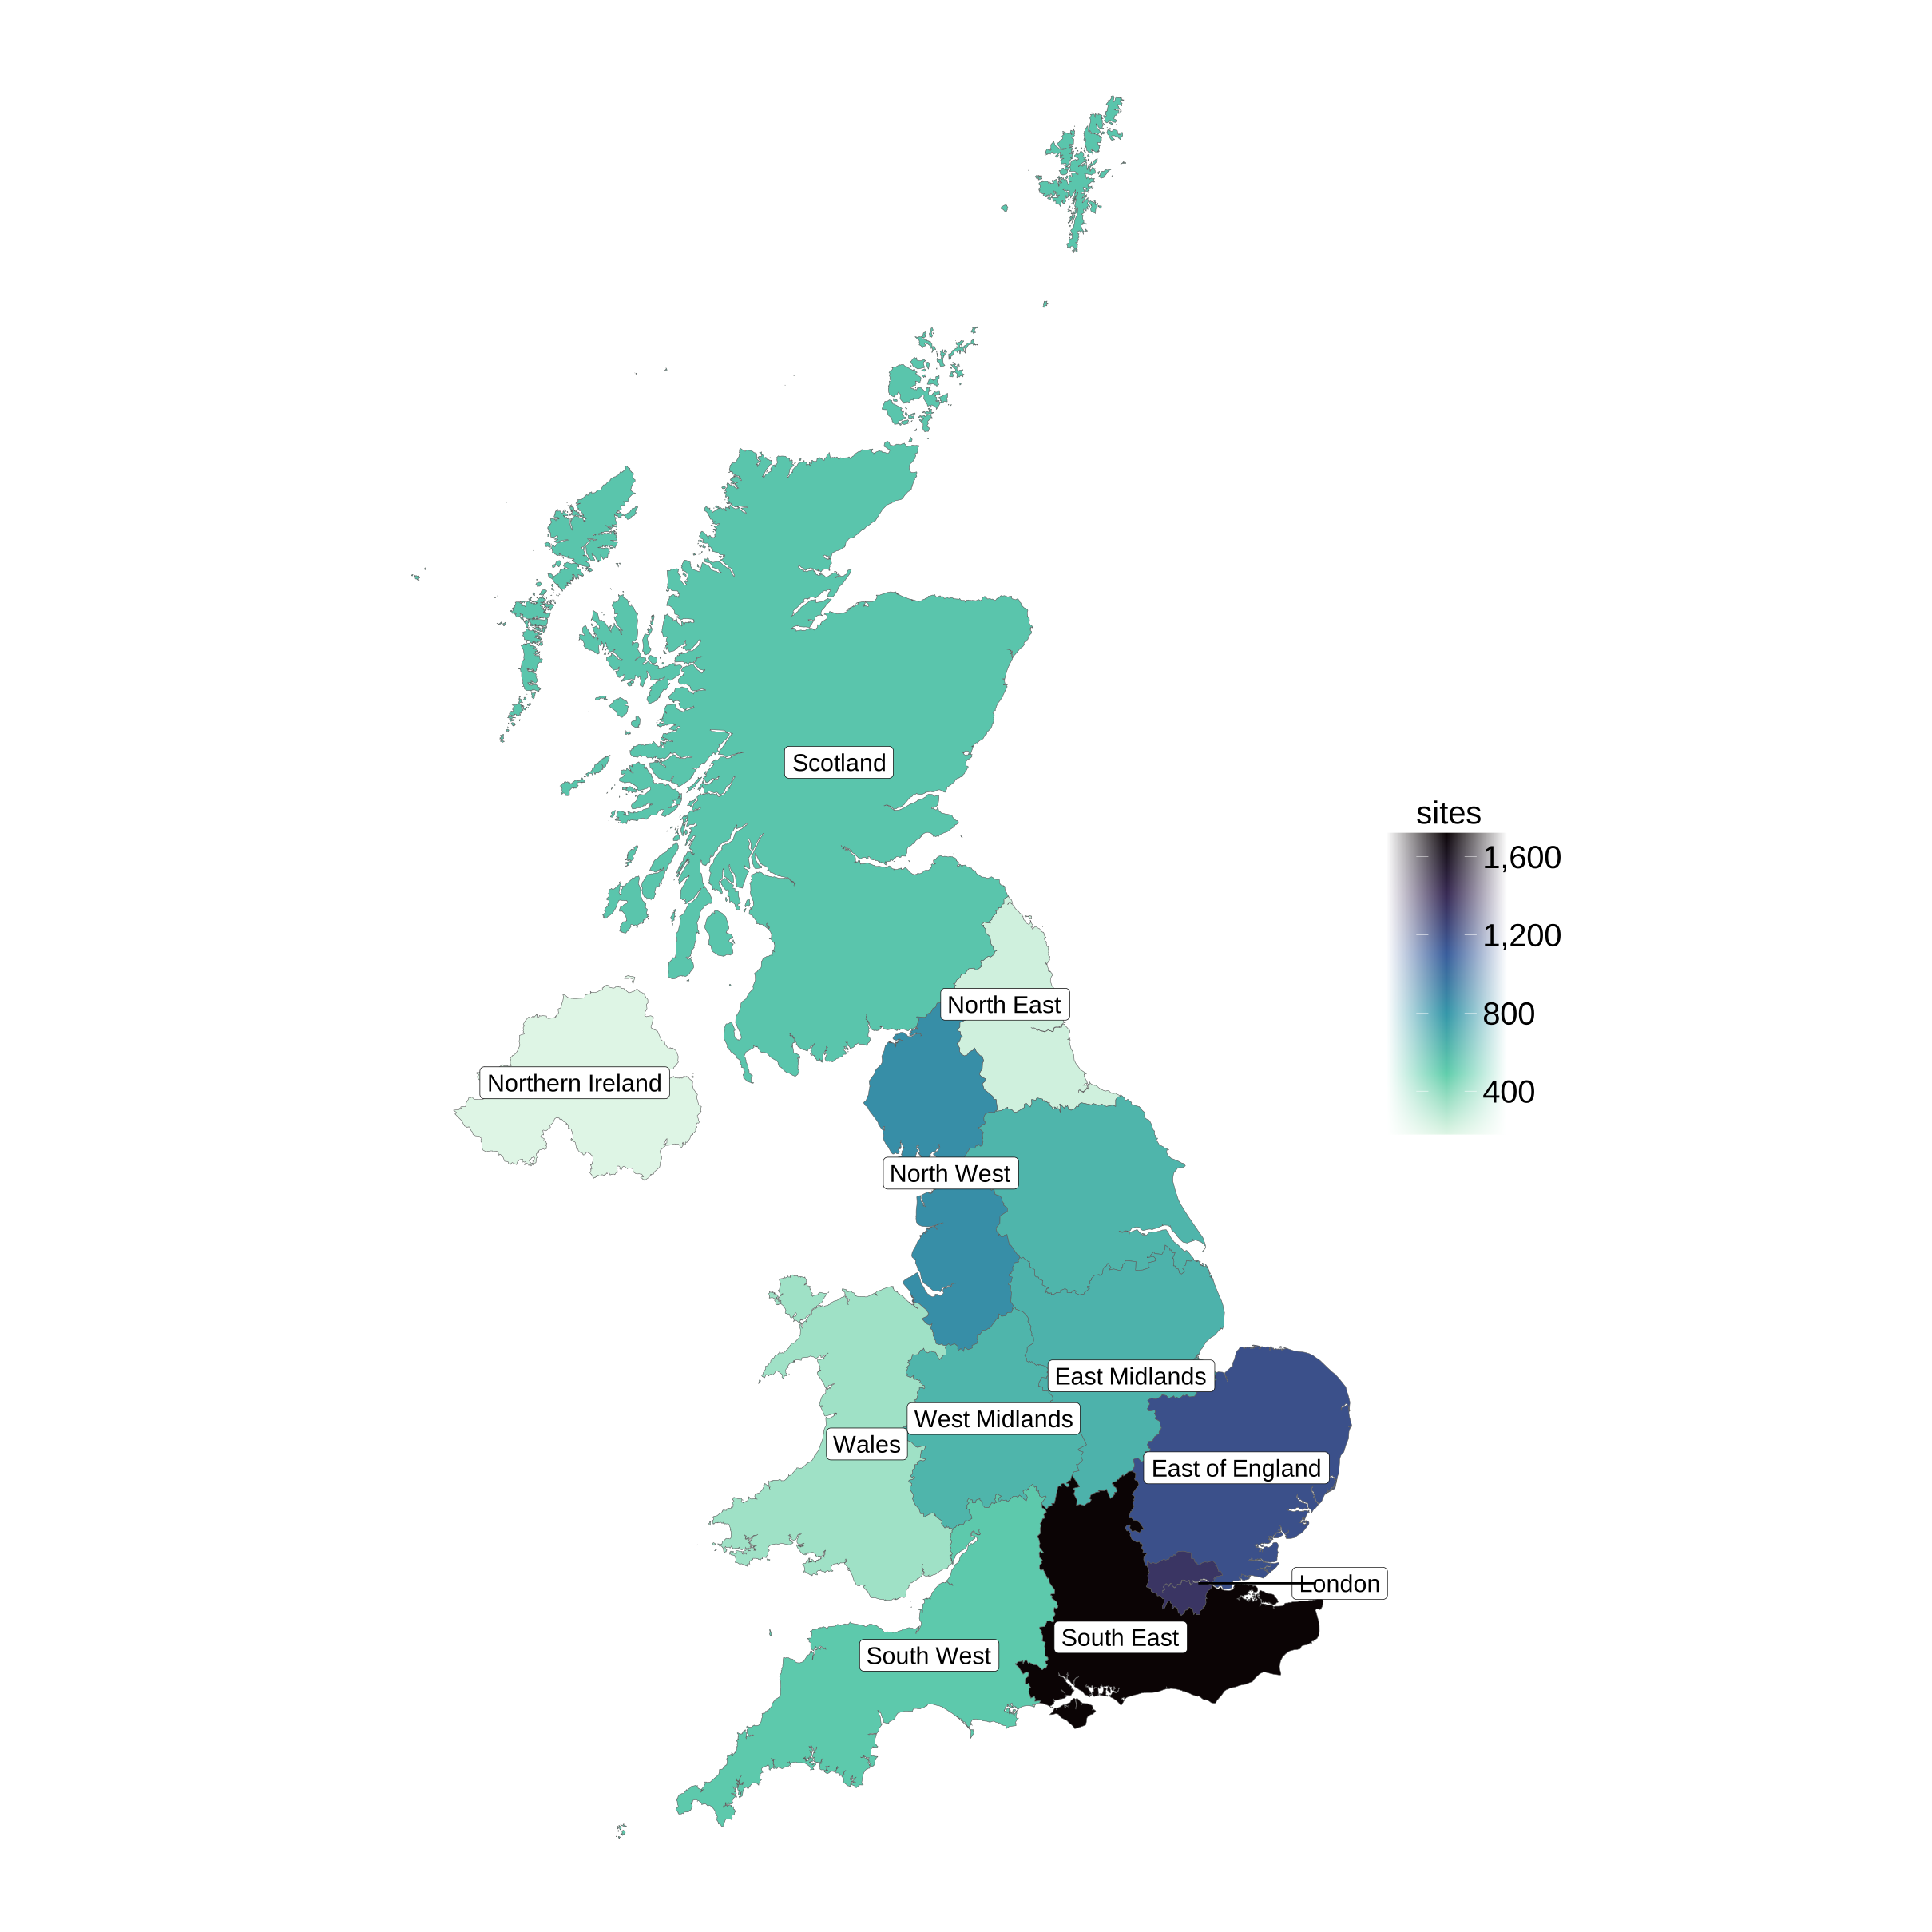
there were 8,800 sites associated with life sciences businesses in the UK, a 3% decrease from 2023/24. The South East had the highest number of sites of any international territorial level (ITL) 1 region, with 1,700 sites, accounting for 20% of the UK total.
-
the ITL 1 region with the highest share of employment and turnover (based on registered addresses of companies) continues to be the South East, accounting for 25% of employment and 27% of turnover.
-
25% of life sciences companies reported manufacturing as their primary activity.
-
19% of life sciences companies reported research and development (R&D) as their primary activity.
2. Introduction
The bioscience and health technology sector statistics (BaHTSS) publication provides estimates of the size and composition of the UK life sciences sector.
The definition of the life sciences industry used in this publication covers businesses operating operating within the biopharmaceutical or medical technology subsectors in the UK.
The three main metrics used in this series are:
• employment
• turnover
• number of businesses and companies
The terminology section includes definitions of the subsectors and metrics used in this report.
This report is the latest edition in the annual BaHTSS publication series, covering data relating up to 2024/25. This report is also accompanied by:
-
Bioscience and health technology sector statistics 2024 to 2025: user guide – this guide provides guidance on how these statistics can be used, how they were compiled and the underlying quality behind them. This guide also documents changes from past publications and how data can be compared to previous reports in the series
-
Bioscience and health technology sector statistics 2024 to 2025: accompanying data tables – a set of accompanying Excel data tables providing the figures used in this report, as well as further aggregations of the data for users
3. Estimates of the life sciences sector
The estimates in this report are derived from a dataset of life sciences companies collected by the OLS. The dataset includes information on an extensive number of companies that meet the criteria set out in section 2 of the accompanying user guide. The companies in this dataset have been included through either:
-
manual identification based on information provided by data partners. Data partners are organisations with expertise in the life sciences sector and provide OLS information on companies they know to be operating in the sector
-
automated identification based on the descriptive text content of their website. Large language models (LLMs) and natural language processing is used to identify life sciences companies out of a wider cohort of company websites
Neither of the above methods offer a comprehensive way of identifying all companies across the sector. As a result, the dataset does not contain a full population of all life sciences companies operating in the UK and therefore any figures in this report should be treated as an estimate. More information on the quality and coverage of the dataset can be found in section 4 of the accompanying user guide.
4. Publication updates
4.1 Changes and additions from previous publications
The 2024/25 release includes new data points for the 2024/25 financial year, alongside routine revisions to the 2023/24 data points originally published in the 2023/24 release.
Data relating to 2021/22 and before has not been revised due to a notable methodology change that was implemented form the 2023/24 release, and is not directly comparable to subsequent data points.
The following changes and additions have been implemented in the 2024/25 release:
-
A new definition for how Small and Medium Enterprises (SMEs) are defined. Please see the section on Size and ownership of life sciences businesses for more details.
-
The reintroduction of a timeseries, starting from estimates for 2023/24. The 2024/25 statistics have been compiled using the same methodology as estimates relating to 2023/24, allowing for direct comparisons between the years.
-
Estimates of the number of sites belonging to life sciences companies by region and Local Authority District (LAD). A site is defined as the physical location a company operates out of. Please see the section on ‘Variation across the UK’ for more details.
4.2 Revision notices
The BaHTSS publication routinely revises previously published estimates in past releases. The 2024/25 release publishes revised estimates for 2023/24 data points. The originally published estimates in the 2023/24 release have been notably revised downwards in the 2024/25 release. This has resulted in a reduction in both national employment and turnover of 13% for 2023/24 compared to the previously published estimates. These revisions have predominantly occurred due to improvements in quality of the company list that underpins the BaHTSS statistics. More details on the impact of this revision can be found in the accompanying user guide.
5. Official Statistics designation
The BaHTSS publication series was previously labelled as Official Statistics. Since the 2023/24 release, these statistics have been designated as ‘official statistics in development’. This is defined by the UK Statistics Authority as a ‘subset of official statistics that are undergoing a development; they may be new or existing statistics, and will be tested with users, in line with the standards of trustworthiness, quality, and value in the Code of Practice for Statistics.’
This change in designation is being implemented whilst OLS:
-
explore further ways to improve the quality of the new methodology implemented since the 2023/24 release
-
consider users’ feedback on the new approach
-
explore ways to reintroduce some breakdowns of the life sciences sector which were temporarily removed due to the change in methodology
A description of planned methodological developments intended for future BaHTSS publications is provided in section 4 of the user guide accompanying this report.
Any feedback on the new methodology and statistics is welcome from users. Please contact analysis@officeforlifesciences.gov.uk to provide any comments or suggestions.
6. Size and economic activity of the life sciences sector
In 2024/25, there were an estimated 6,500 businesses operating across 7,600 companies in the UK life sciences sector. The number of businesses and companies in 2024/25 decreased by 4% and 3% respectively compared to 2023/24.
Life sciences companies in the UK employed an estimated 306,700 people in 2024/25, a 2% decrease from 313,100 in 2023/24. These companies generated an estimated £125.8 billion of turnover in 2024/25, a 1% decrease from £127.3 billion (adjusted for inflation and in 2024/25 prices) in 2023/24. For more information on how estimates of employment and turnover are derived, please see section 2.1 of the accompanying user guide.
7. Size and economic activity of the biopharmaceutical and medical technology subsectors
In 2024/25, there were an estimated 3,100 companies operating in the biopharmaceutical subsector, and 4,500 in the medical technology subsector. Biopharmaceutical companies accounted for 41% of all life sciences companies in 2024/25, whilst medical technology companies accounted for 59%. These proportions have remained unchanged since 2023/24.
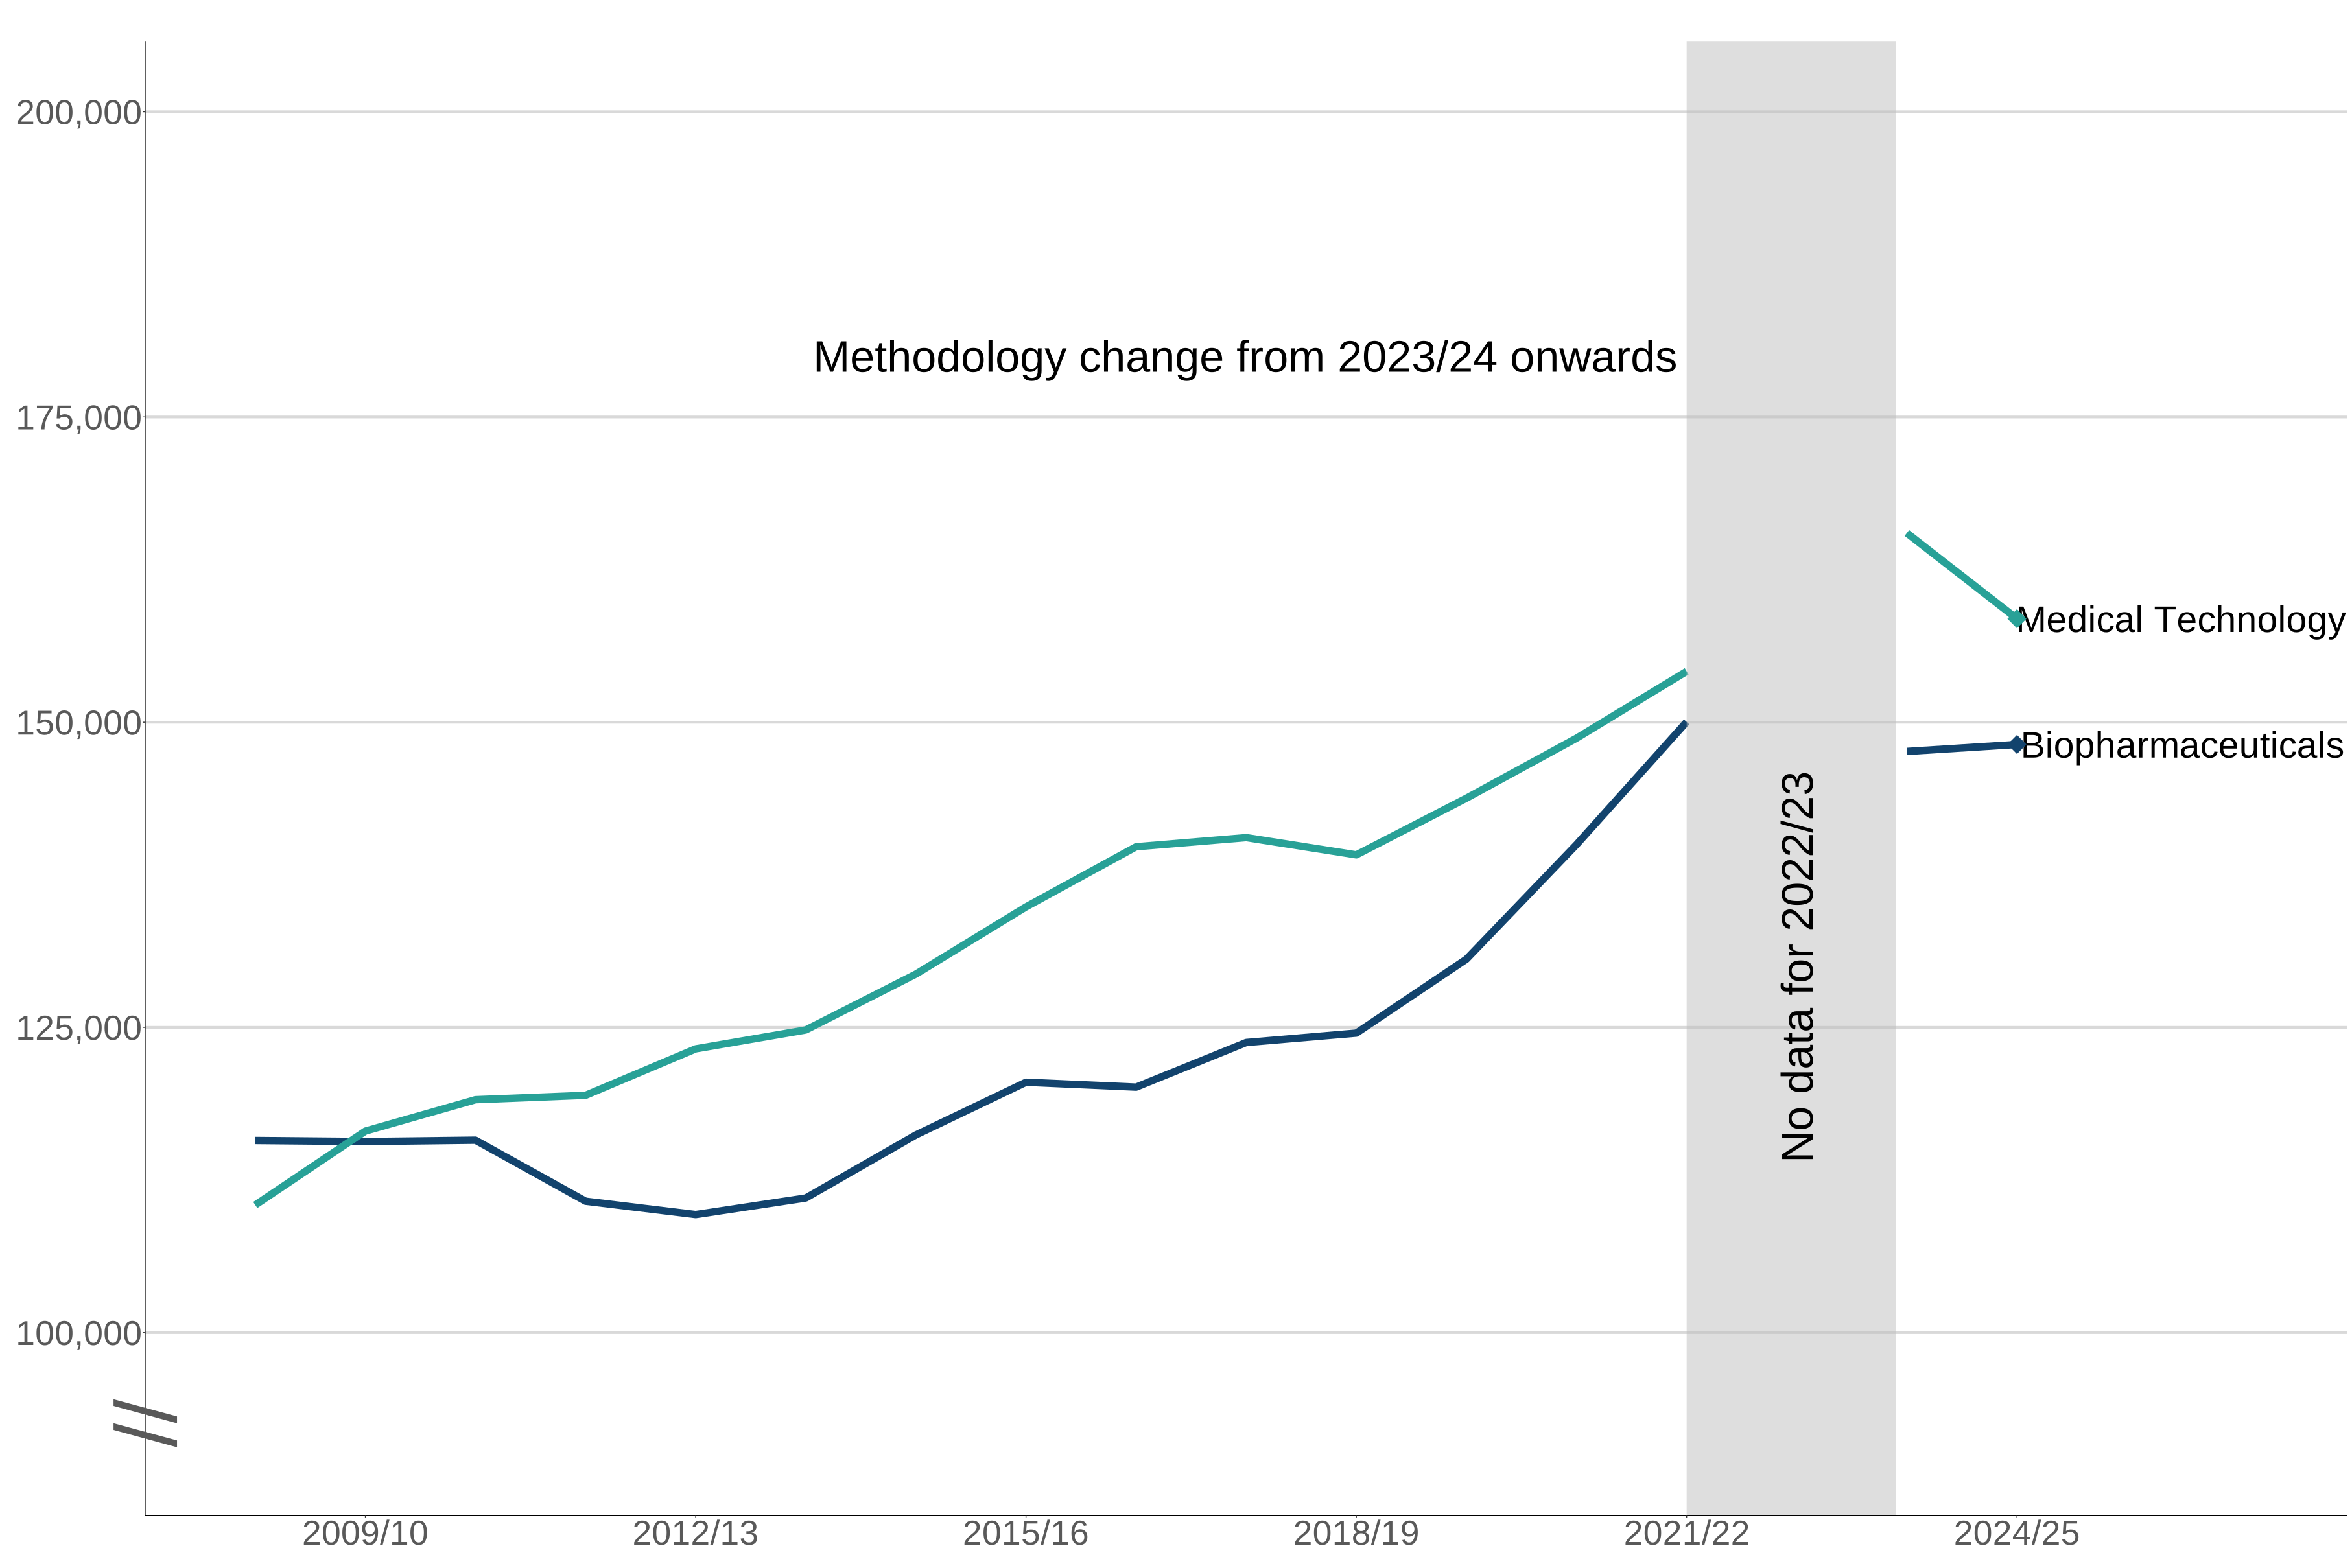
148,200 people were employed at companies operating in the biopharmaceutical subsector in 2024/25, which is broadly similar to employment numbers in 2023/24.
158,500 people were employed at companies operating in the medical technology subsector. Employment in the medical technology subsector decreased by 4% in 2024/25 compared to 2023/24.
In 2024/25, 48% of people employed in the life sciences sector were in employed in the biopharmaceutical subsector compared to 52% in the medical technology subsector. These proportions have remained broadly similar compared to 2023/24.
Figure 1: Employment at life sciences companies by subsector, UK, 2008/09 to 2024/25
Notes:
- the y axis does not start at 0
- data from figure 1 can be found in table 3 of the ‘Bioscience and health technology sector statistics 2024/25: accompanying data tables’
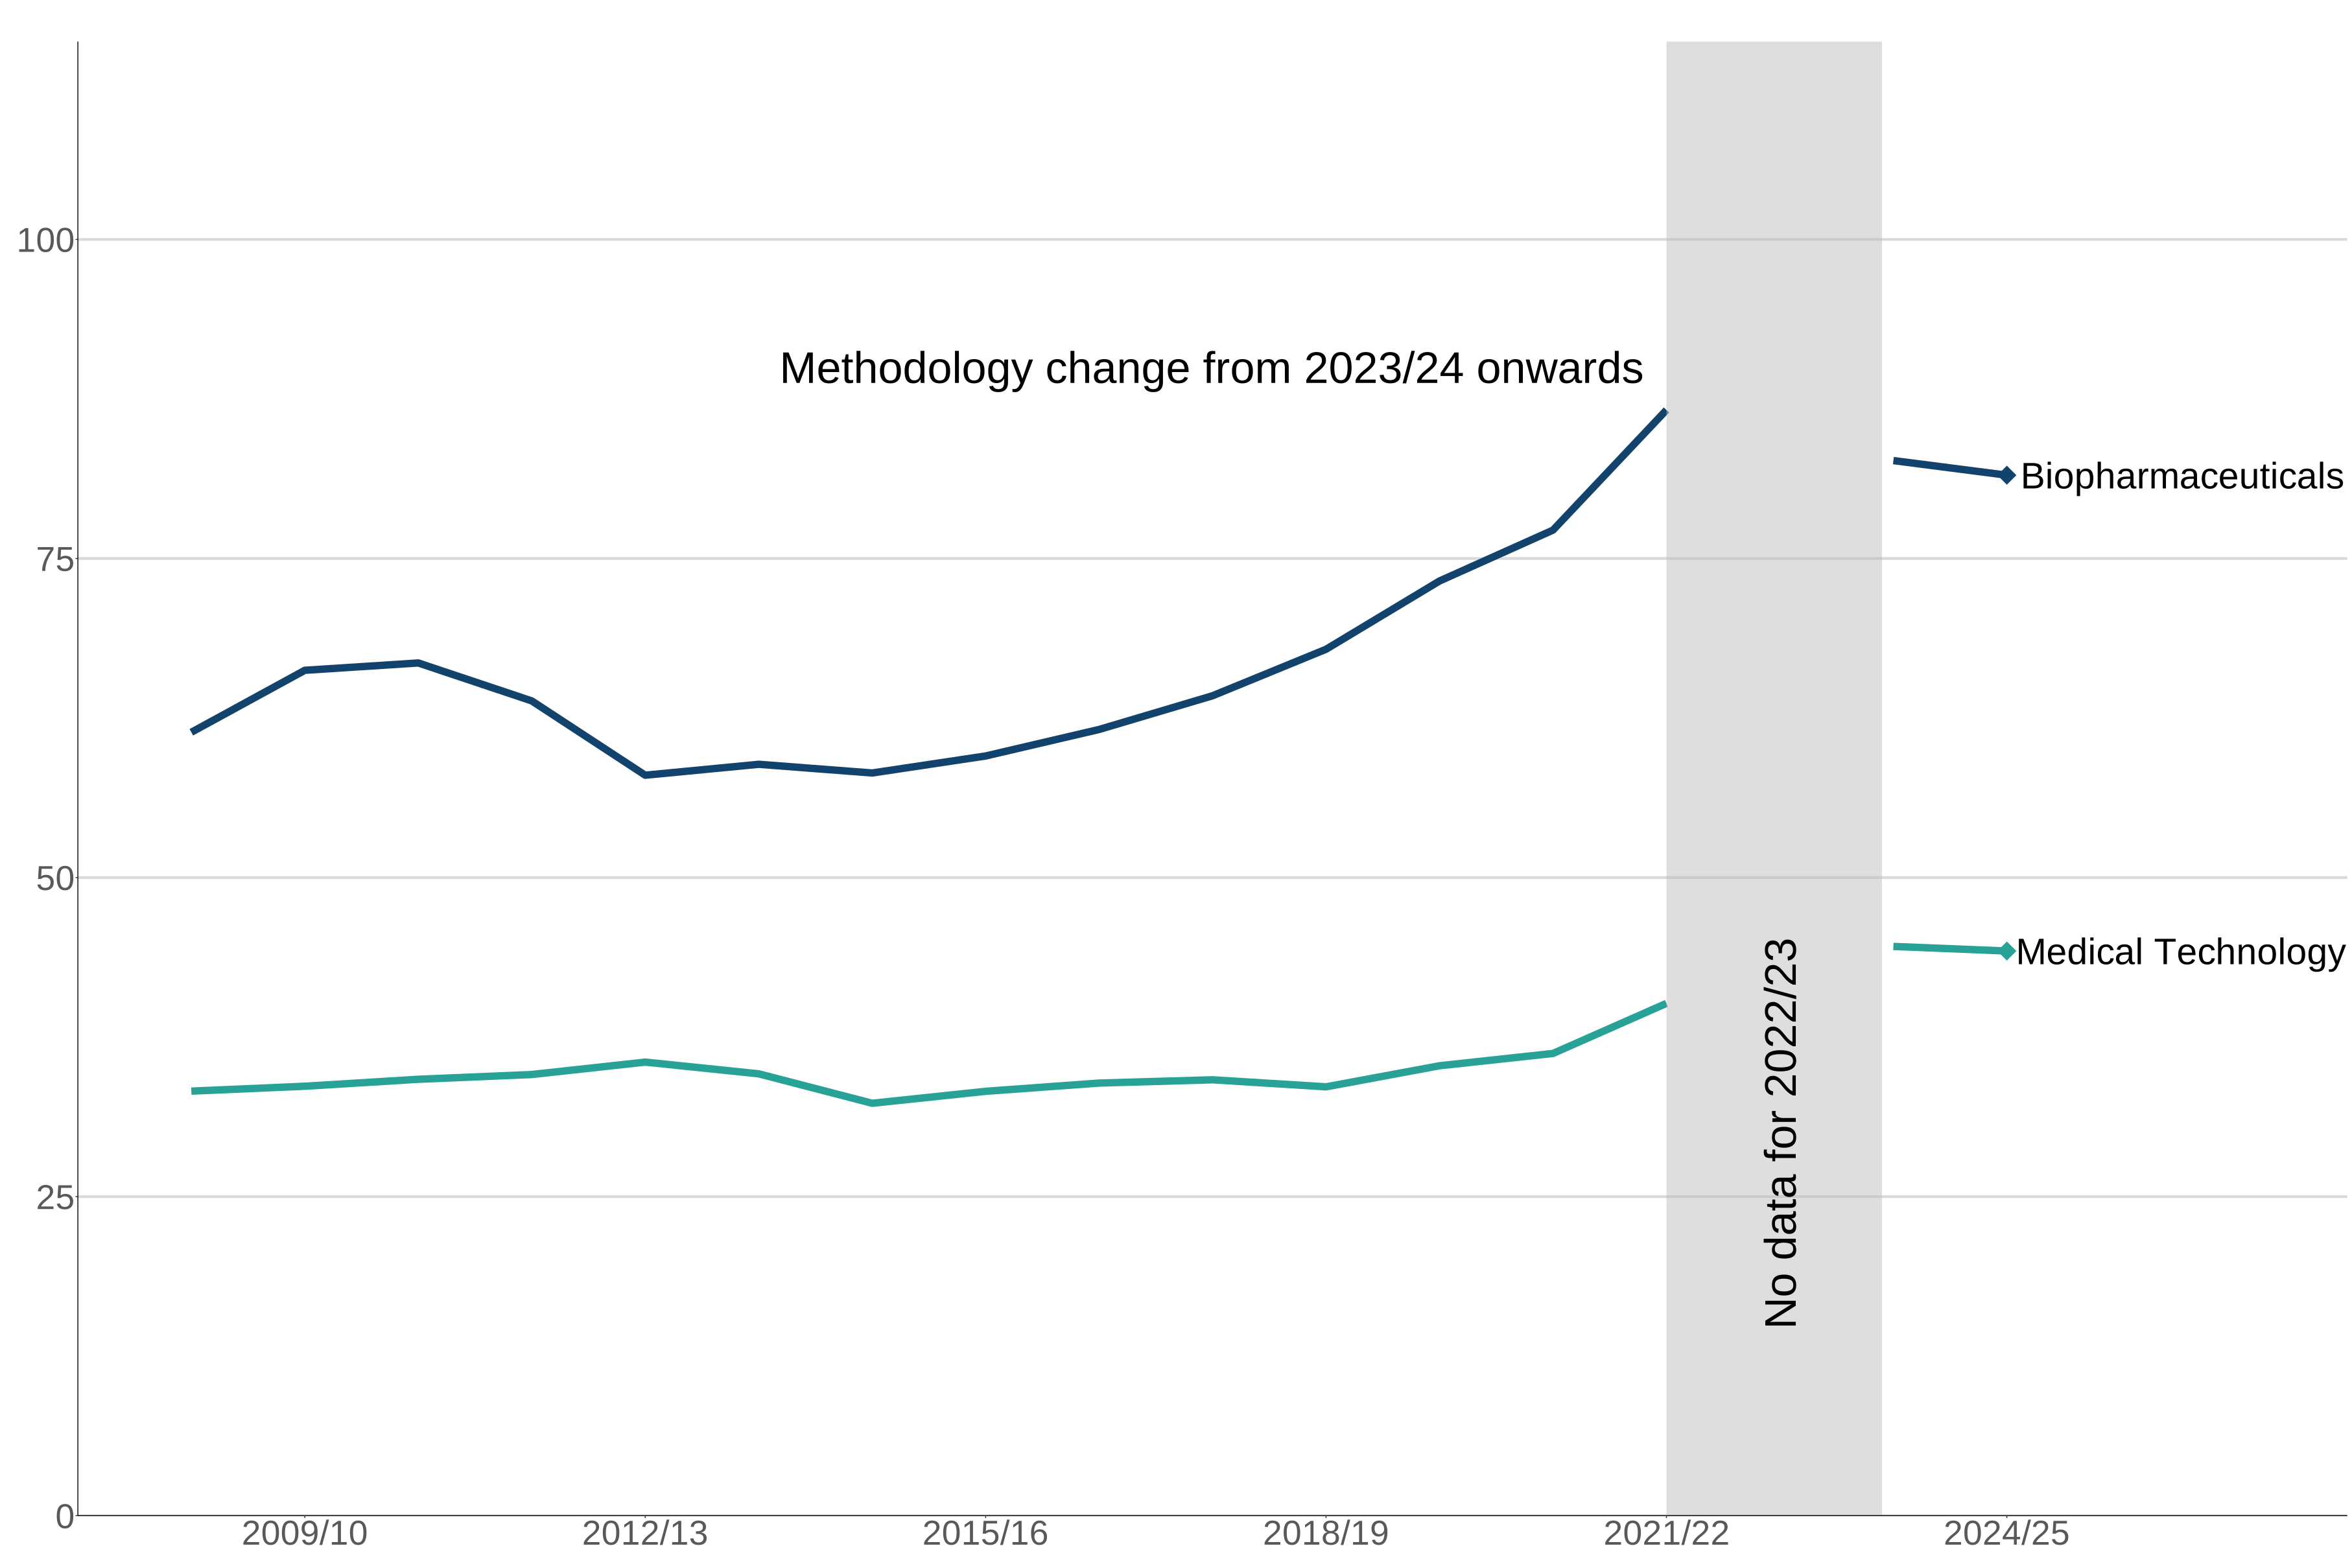
£81.5 billion in turnover was generated by companies operating in the biopharmaceutical subsector in 2024/25. Turnover generated by the biopharmaceutical subsector decreased slightly by 1% in 2024/25 compared to 2023/24.
£44.2 billion in turnover was generated by companies operating in the medical technology subsector in 2024/25. Turnover generated by the medical technology subsector also decreased slightly by 1% in 2024/25 compared to 2023/24.
The biopharmaceutical subsector generated nearly two thirds (65%) of turnover generated by the life sciences sector in 2024/25. This is despite the biopharmaceutical subsector accounting for a lower share of employment (48%) and number of companies (41%) compared to the medical technology subsector.
Figure 2: Turnover generated by life sciences companies by subsector (£ billions), UK, 2008/09 to 2024/25
Notes:
- data from figure 2 can be found in table 4 of the ‘Bioscience and health technology sector statistics 2024/25: accompanying data tables’
- figures are adjusted for inflation and are in 2024/25 prices
8. Variation across the UK
The 2024/25 release provides the following geographical analysis:
-
number of companies, employment and turnover by International territorial level (ITL1) regions of the UK and Local Authority District (LAD) boundaries of the UK. This is based on the registered address of the company (which may just be an address that serves an administrative function), rather than the physical sites that companies operate from.
-
the number of sites by ITL1 regions of the UK and LAD boundaries of the UK. This is based on the physical address that companies operate from. This analysis has been reintroduced in the 2024/25 release and covers the periods 2023/24 and 2024/25.
8.1 UK life sciences sector employment
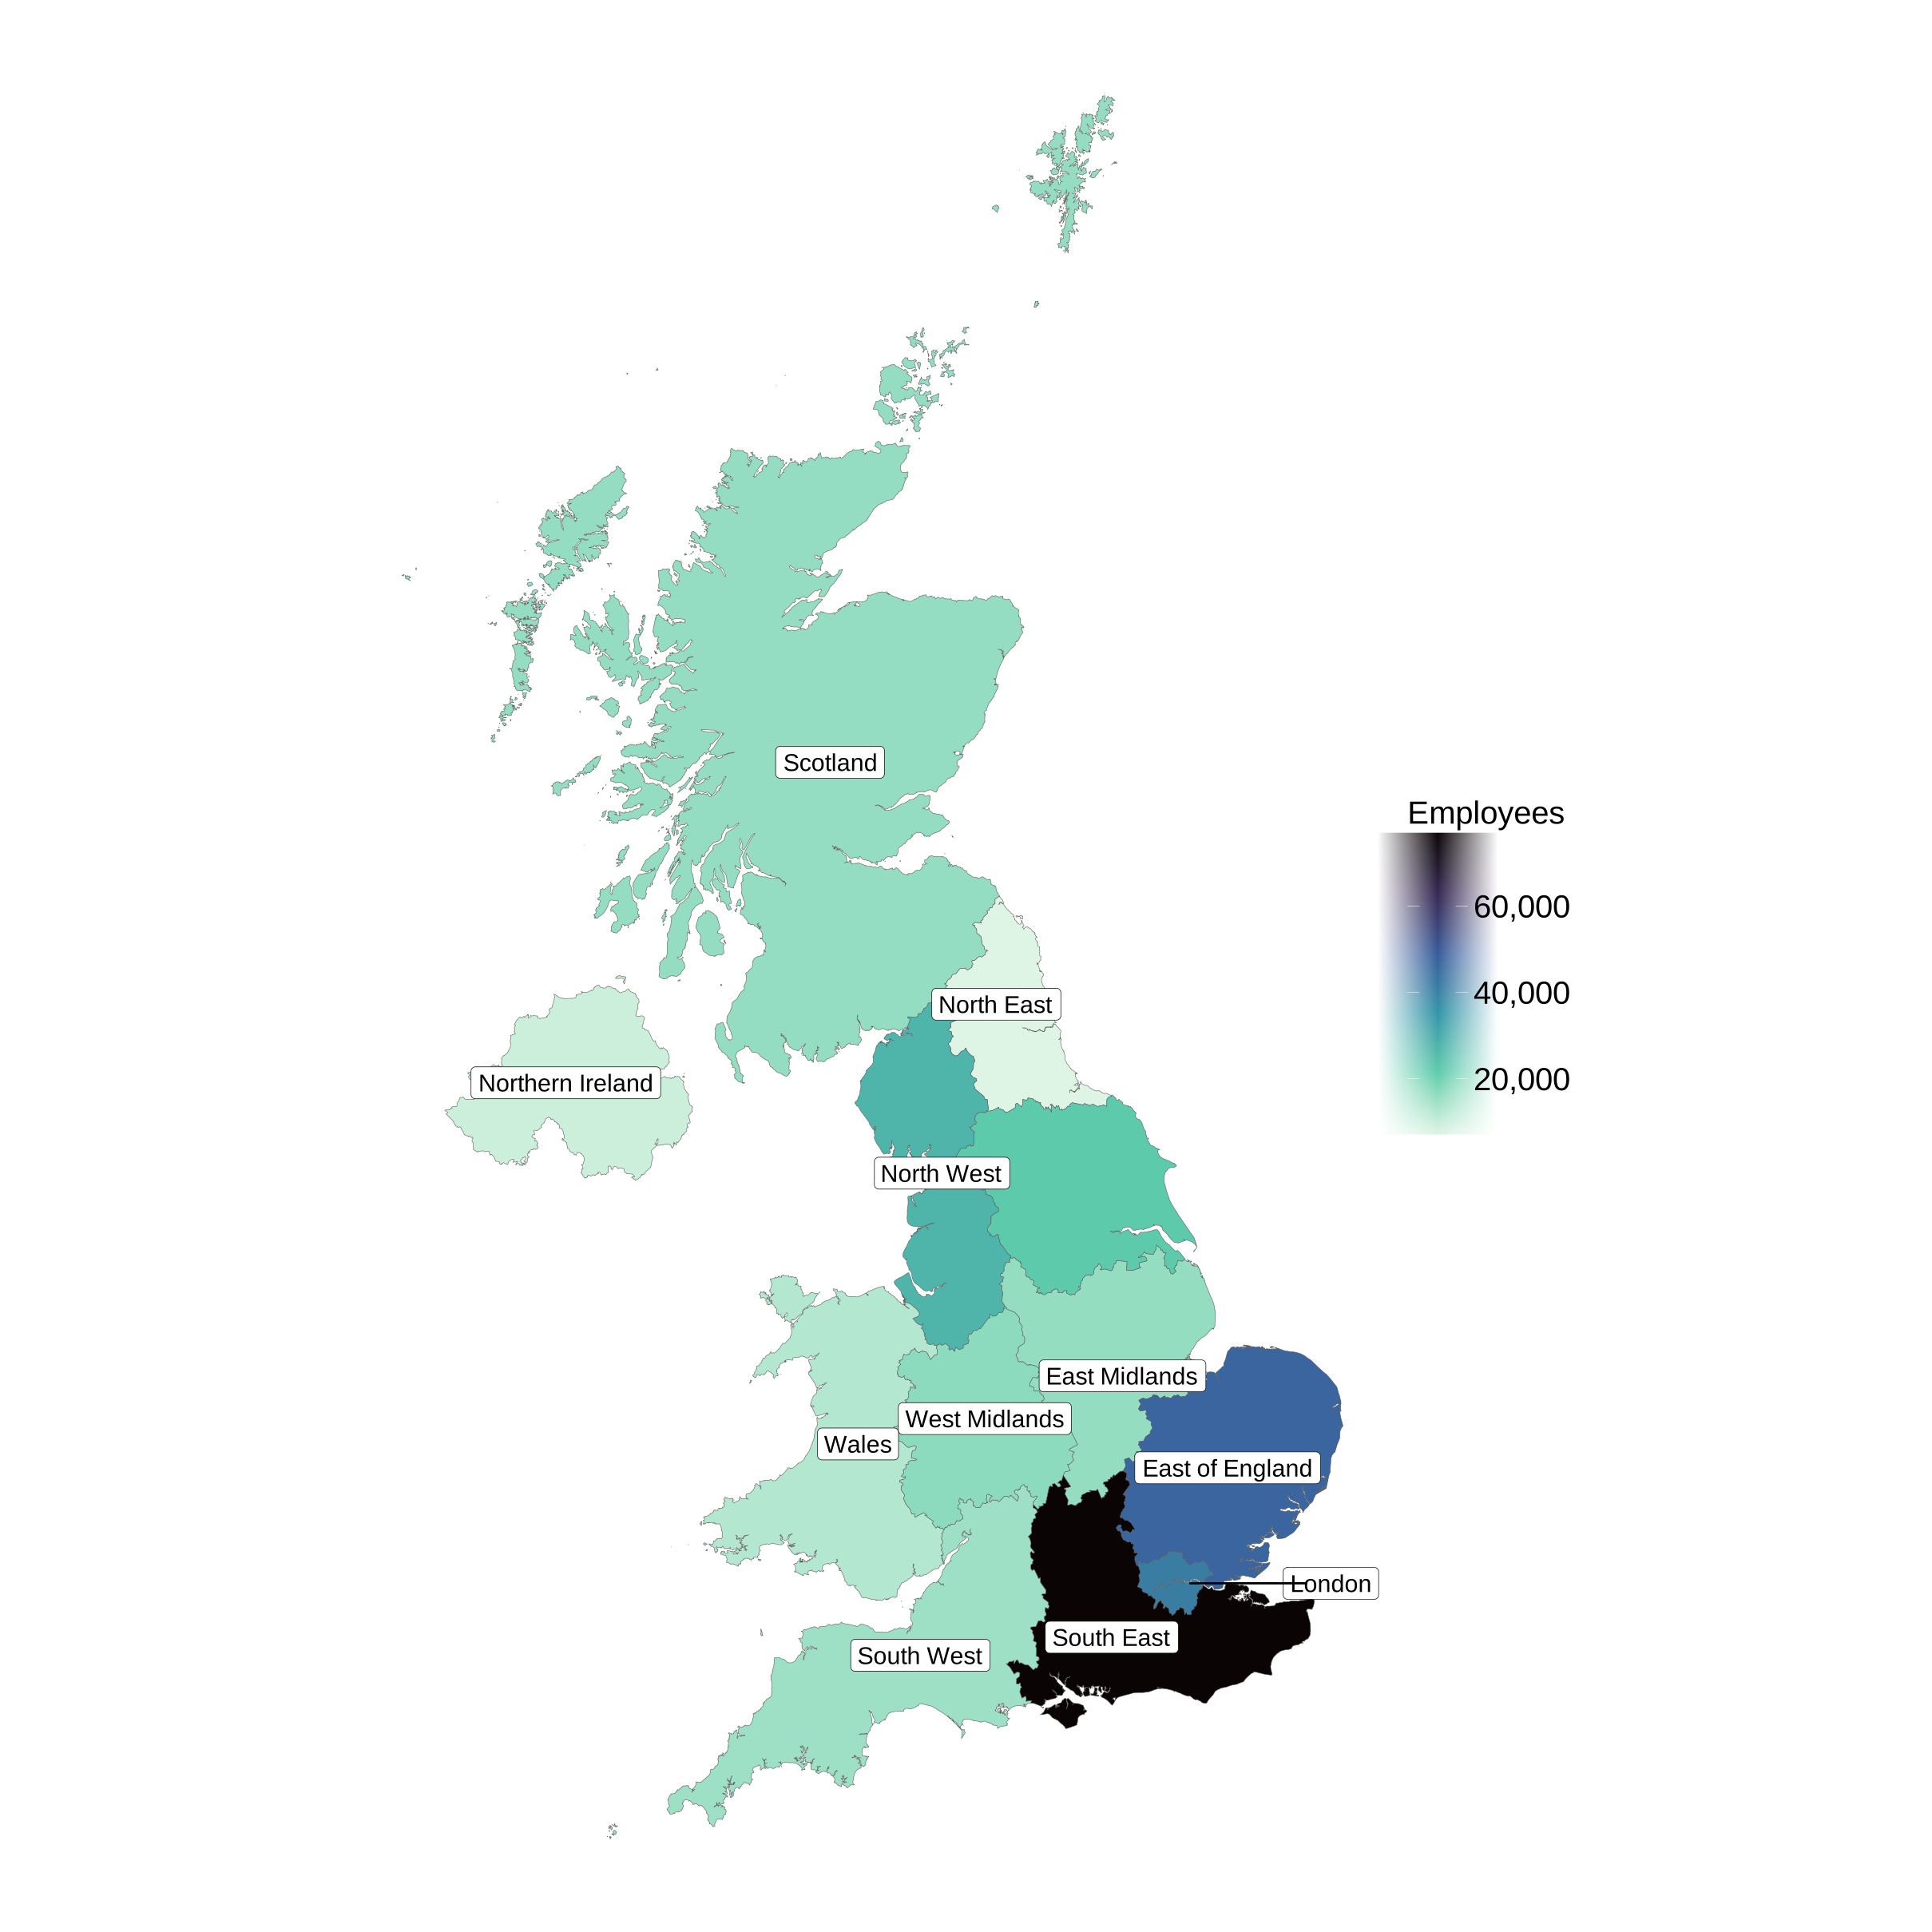
Companies registered in the South East had the highest employment of all ITL 1 regions in the UK at 76,800 in 2024/25, accounting for 25% of all employment in the sector. Companies registered in the South East saw a 2% decrease in employment in 2024/25 compared with 2023/24, falling from 78,600 in 2023/24.
Companies registered in the East of England and London regions also accounted for a notable percentage of employment in the sector, at 15% and 13% respectively. Both regions saw a decrease in employment in 2024/25 compared to 2023/24, with employment decreasing by 3% in the East of England and 8% in London over this period.
Most ITL 1 regions either saw a decrease in employment or remained broadly similar in 2024/25 compared to 2023/24. The exception to this was the North West which saw an increase of 8% over the same period. The regional distribution of employment across the UK ITL 1 regions is mostly unchanged since 2023/24.
Figure 3: Employment at life sciences companies by ITL 1 region, UK, 2024/25
Notes:
- data from figure 3 can be found in table 7 of the ‘Bioscience and health technology sector statistics 2024/25: accompanying data tables’
- company employment figures are allocated to ITL1 regions based on the location of the company’s registered address
Biopharmaceutical employment
Companies registered in the South East had the highest employment of all ITL 1 regions in the biopharmaceutical subsector. The South East had 36,700 employees in 2024/25, accounting for 25% of all employment in the subsector. Biopharmaceutical employment in the South East reduced by 1% in 2024/25 compared to 2023/24.
Companies registered in London and the East of England also accounted for a notable percentage of employment in the biopharmaceutical subsector in 2024/25, at 18% and 17% respectively. The East of England saw a decrease of 5% in employment in 2024/25 compared to 2023/24 whilst London saw an increase of 3% over the same period.
Companies registered in the North West saw a notable increase of 25% between 2024/25 compared to 2023/24. The distribution across the UK ITL 1 regions for biopharmaceutical employment in 2024/25 was similar to that observed in 2023/24.
Medical technology employment
Companies registered in the South East had the highest employment of all ITL 1 regions in the medical technology subsector. The South East had 40,100 employees in 2024/25, accounting for 25% of all employment in the subsector. Medical technology employment in the South East reduced by 3% in 2024/25 compared to 2023/24.
Companies registered in the East of England and London also accounted for a notable percentage of employment in the medical technology subsector in 2024/25, at 12% and 10% respectively. The East of England saw a slight increase of 1% in medical technology employment in 2024/25 compared to 2023/24 whilst London saw a notable decrease of 21% in employment over the same period.
Most ITL 1 regions either saw a decrease in medical technology employment or remained broadly similar in 2024/25 compared to 2023/24. The exception to this was companies registered in Northern Ireland which saw an increase of 6% over the same period. The distribution across the UK ITL 1 regions for employment in medical technology companies in 2024/25 was similar to that observed in 2023/24.
8.2 UK life sciences turnover
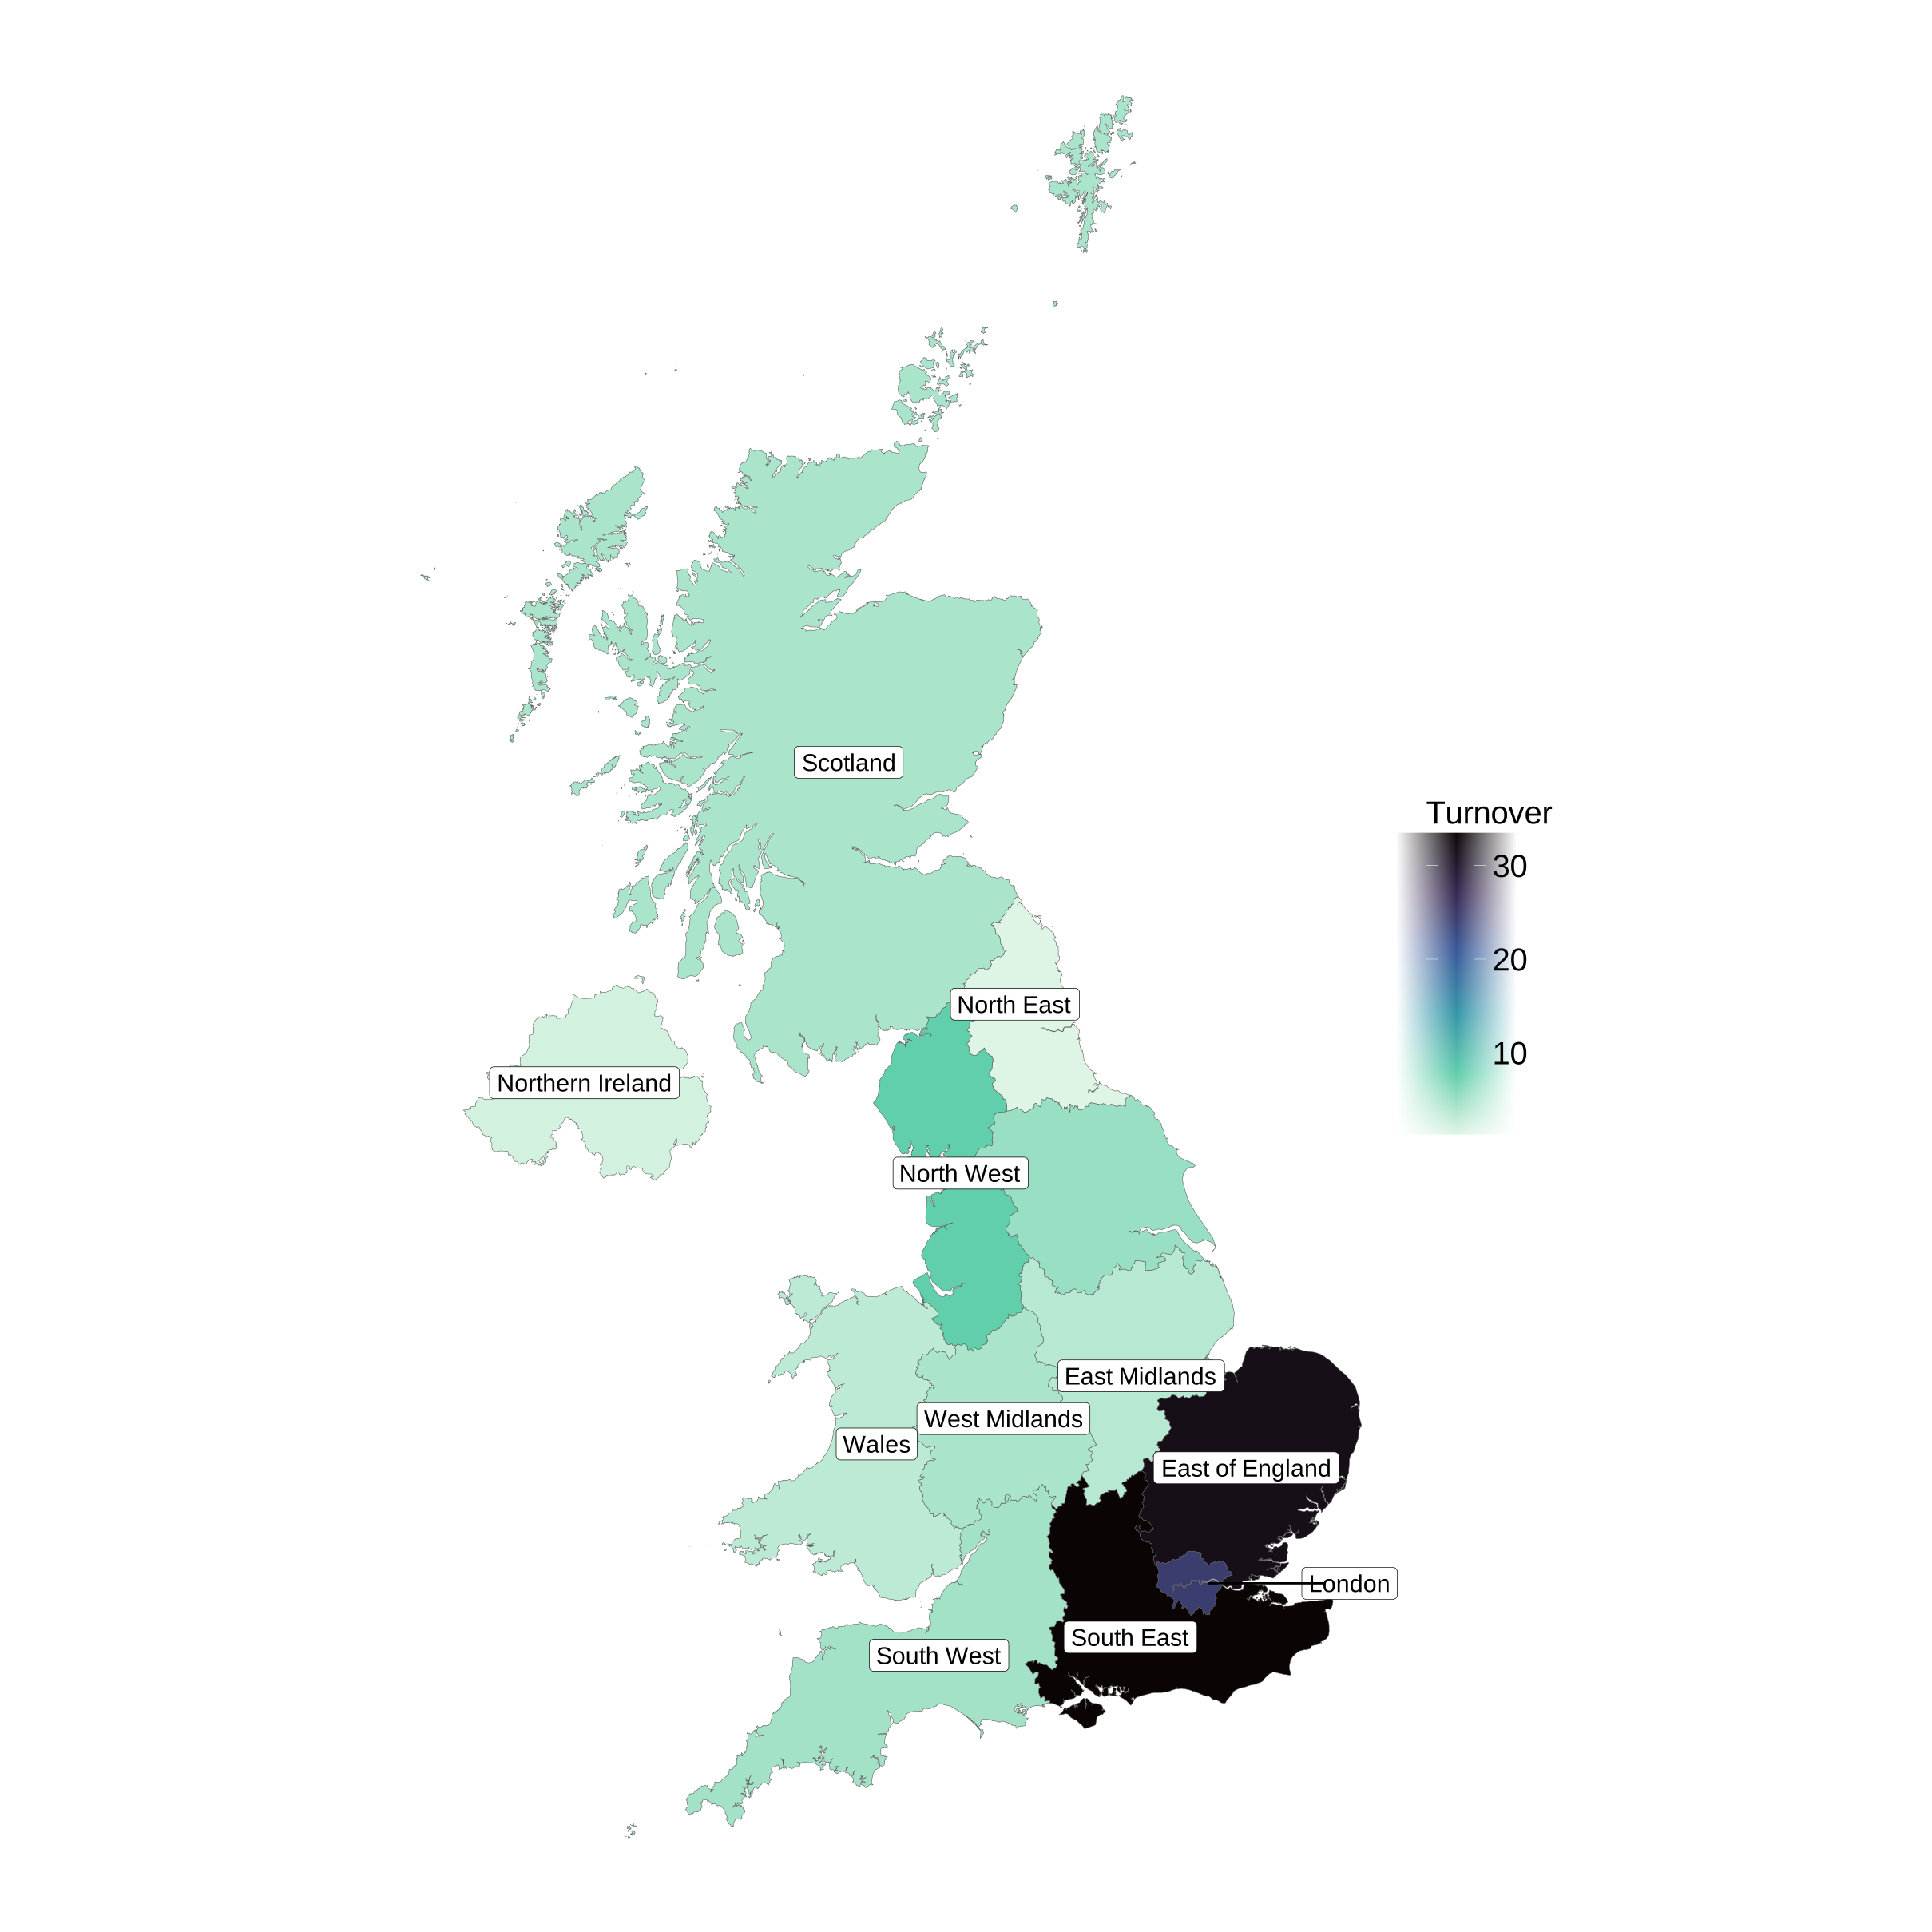
Similar to employment, companies registered in the South East had the highest share of life sciences sector turnover of all ITL 1 regions, at 27% (or £33.4 billion) in 2024/25. Companies registered in the South East saw a 9% decrease in turnover in 2024/25 compared with 2023/24, falling from £36.6 billion in 2023/24.
Companies registered in the East of England and London accounted for the second and third largest shares of turnover in 2024/25, at £32.1 billion (26% share) and £24.6 billion (20% share) respectively. Both regions saw an increase in turnover in 2024/25 compared to 2023/24, turnover increased slightly by 1% in the East of England and 8% in London over this period.
Companies registered in the North East saw a notable increase of 18% between 2024/25 compared to 2023/24. The distribution of turnover across the UK ITL 1 regions for 2024/25 was similar to that observed in 2023/24.
Figure 4: Turnover generated by life sciences companies by ITL 1 region (£ billions), UK, 2024/25
Notes:
- data from figure 4 can be found in table 8 of the ‘Bioscience and health technology sector statistics 2024/25: accompanying data tables’
- company turnover figures are allocated to ITL1 regions based on the location of the company’s registered address
Biopharmaceutical turnover
In 2024/25, companies registered in the East of England accounted for the highest share of turnover of all ITL1 regions in the biopharmaceutical subsector. The East of England generated £24.8 billion in turnover, which accounted for 30% of all UK turnover generated from the subsector. Companies registered in the East of England saw a slight increase of 1% in turnover generated by the biopharmaceutical subsector in 2024/25 compared to 2023/24.
Companies registered in the South East and London also accounted for notable shares of biopharmaceutical turnover in 2024/25, at 26% and 24% respectively. Biopharmaceutical turnover decreased by 12% in the South East between 2023/24 and 2024/25, while London saw a notable increase of 11% over the same period.
Companies registered in the North East and North West regions saw notable increases of 22% and 21% respectively between 2024/25 compared to 2023/24 in turnover generated by the biopharmaceutical subsector. The distribution of turnover across the UK ITL 1 regions for biopharmaceutical turnover in 2024/25 was similar to that observed in 2023/24.
Medical technology turnover
In 2024/25, companies registered in the South East continued to account for the highest share of turnover of all ITL 1 regions in the medical technology subsector. The South East generated 27% (£12.0 billion) of the total UK turnover from the medical technology subsector. Companies registered in the South East generated 3% less turnover in 2024/25 compared to 2023/24.
Companies registered in the East of England and London also accounted for a notable share of turnover generated in the medical technology subsector in 2024/25, at 17% and 11% respectively. The East of England saw an increase of 2% in turnover generated by the medical technology subsector in 2024/25 compared to 2023/24 whilst London saw a slight decrease of 1% in turnover over the same period.
Companies registered in the South West region saw the highest increase (9%) between 2024/25 compared to 2023/24 in turnover generated by the medical technology subsector. The distribution across the UK ITL 1 regions for medical technology turnover in 2024/25 was similar to that observed in 2023/24.
8.3 Life sciences sector sites
In 2024/25 there were 8,800 sites associated with life sciences businesses in the UK. The number of sites decreased by 3% in 2024/25 compared to 2023/24.
The ITL 1 region with the highest number of sites was the South East, with 1,700 sites (20% of all UK life sciences sites). There was a decrease in the number of sites in the South East of 2% since 2023/24.
The London and East of England ITL 1 regions also accounted for a notable share of life sciences sites in 2024/25, at 15% and 13% respectively. The East of England saw a decrease of 2% in the number of life sciences in 2024/25 compared to 2023/24 whilst London saw a decrease of 3% in sites over the same period. All UK ITL 1 regions saw a decrease in the number of sites in 2024/25 compared to 2023/24.
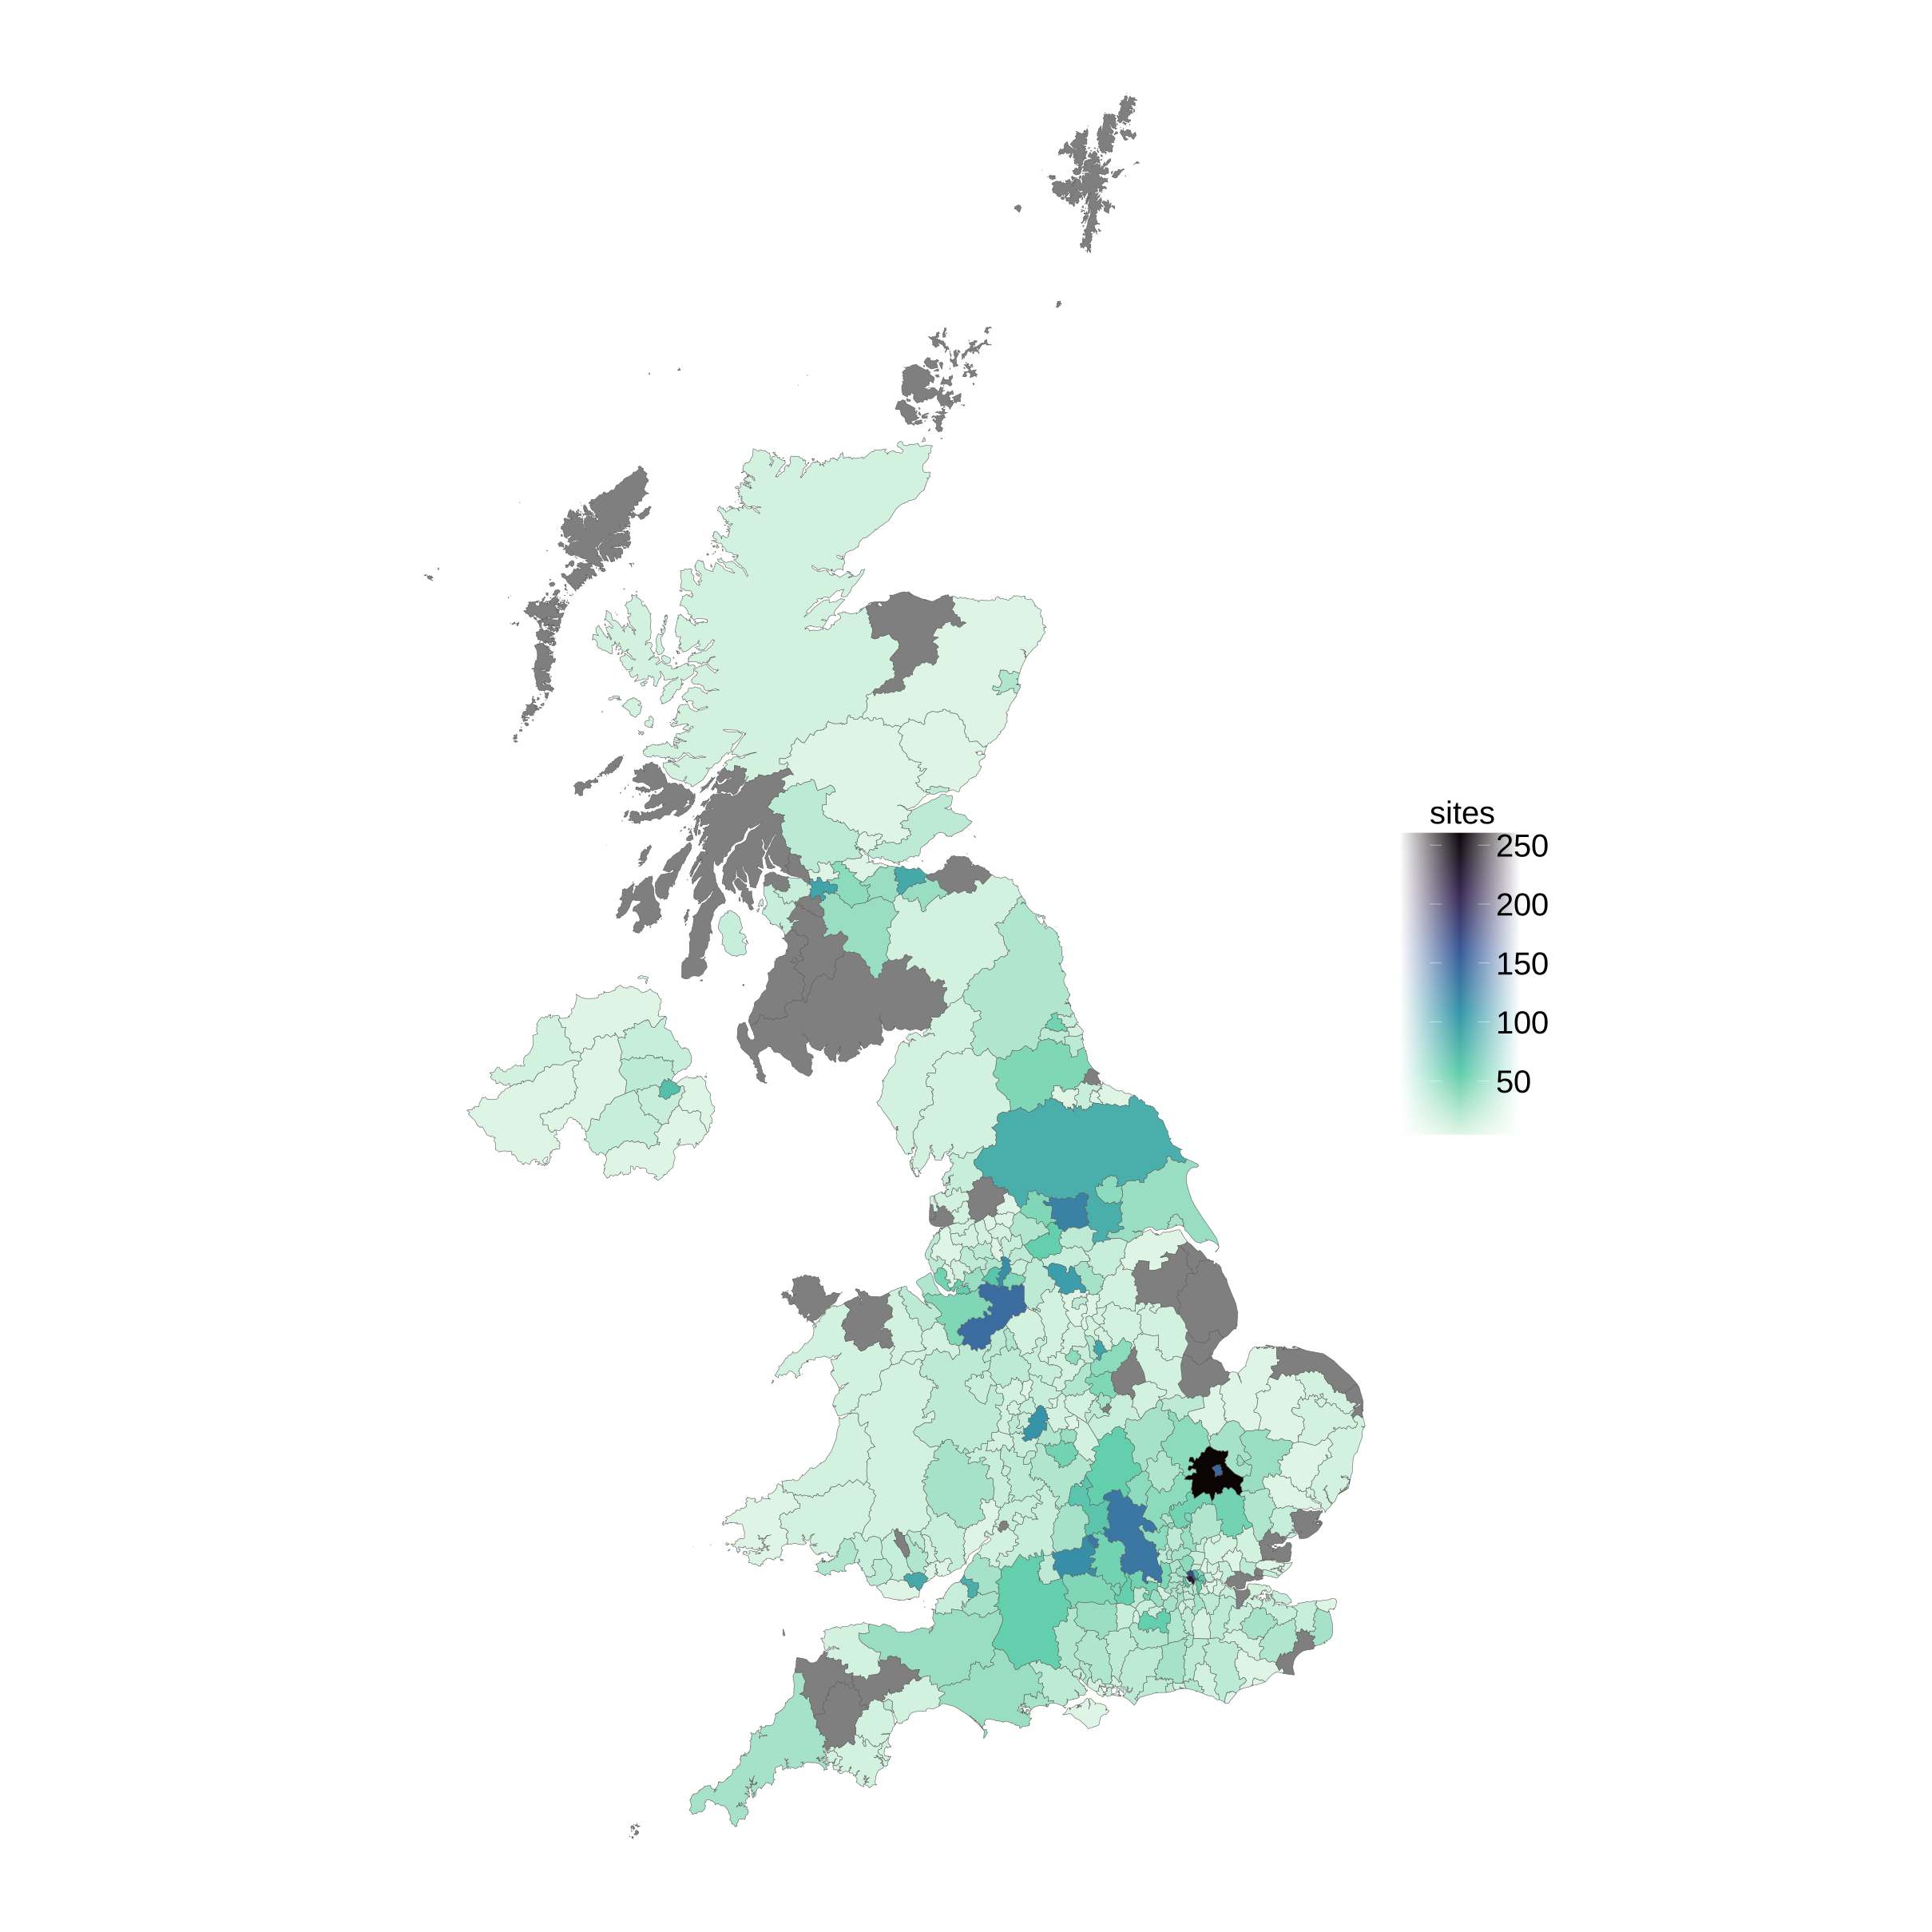
The Local Authority District with the largest share of sites associated with life sciences businesses was South Cambridgeshire with 260 sites (3% of all sites).
Figure 5: Number of life sciences sites by ITL 1 region, UK, 2024/25
Notes:
- data from figure 5 can be found in table 34 of the ‘Bioscience and health technology sector statistics 2024/25: accompanying data tables’
- site location is based on the physical address of the site
The Local Authority with the largest share of sites associated with life sciences businesses was South Cambridgeshire with 260 sites (3% of all sites).
Figure 6: Number of life sciences site by Local Authority District (LAD), UK, 2024/25
Notes:
- data from figure 6 can be found in table 35 of the ‘Bioscience and health technology sector statistics 2024/25: accompanying data tables’
- site location is based on the physical address of the site
- areas coloured in grey indicate value is suppressed to avoid disclosure
9. Life sciences industry segments
Previously, alongside a subsector classification, an associated taxonomy for defining more granular subsectors and activities carried out by these companies (segmentation) was provided. However, this level of detail is not available for the 2024/25 release due to a methodology change that occurred in the 2023/24 release. Section 4 in the accompanying user guide contains further information about future development plans for the statistics.
10. Manufacturing and research and development (R&D) activity
In this section of the report, figures relate to companies whose primary activity is manufacturing or R&D, as defined by their Standard Industry Classification (SIC). This is a mutually exclusive categorisation, meaning that a company that undertakes both activities will be categorised based on the self-reported dominant activity.
Some of these companies will undertake other types of work in addition to manufacturing or research, and therefore employment and turnover figures from these companies includes contributions from non-manufacturing or non-research activities. Similarly, some companies that undertake manufacturing or R&D activities won’t have a primary SIC code that relates to this activity, so the manufacturing and R&D data reported here will not fully cover all the manufacturing and R&D activity that takes place across the sector.
Manufacturing and R&D activity has been identified using a different methodology since the 2023/24 release compared prior publications, where sites were categorised based on any manufacturing or R&D activity occurring within the company, regardless of whether it was necessarily the ‘primary’ activity. This means that this estimates relating to 2023/24 onwards are not comparable to estimates in previous releases.
10.1 Manufacturing
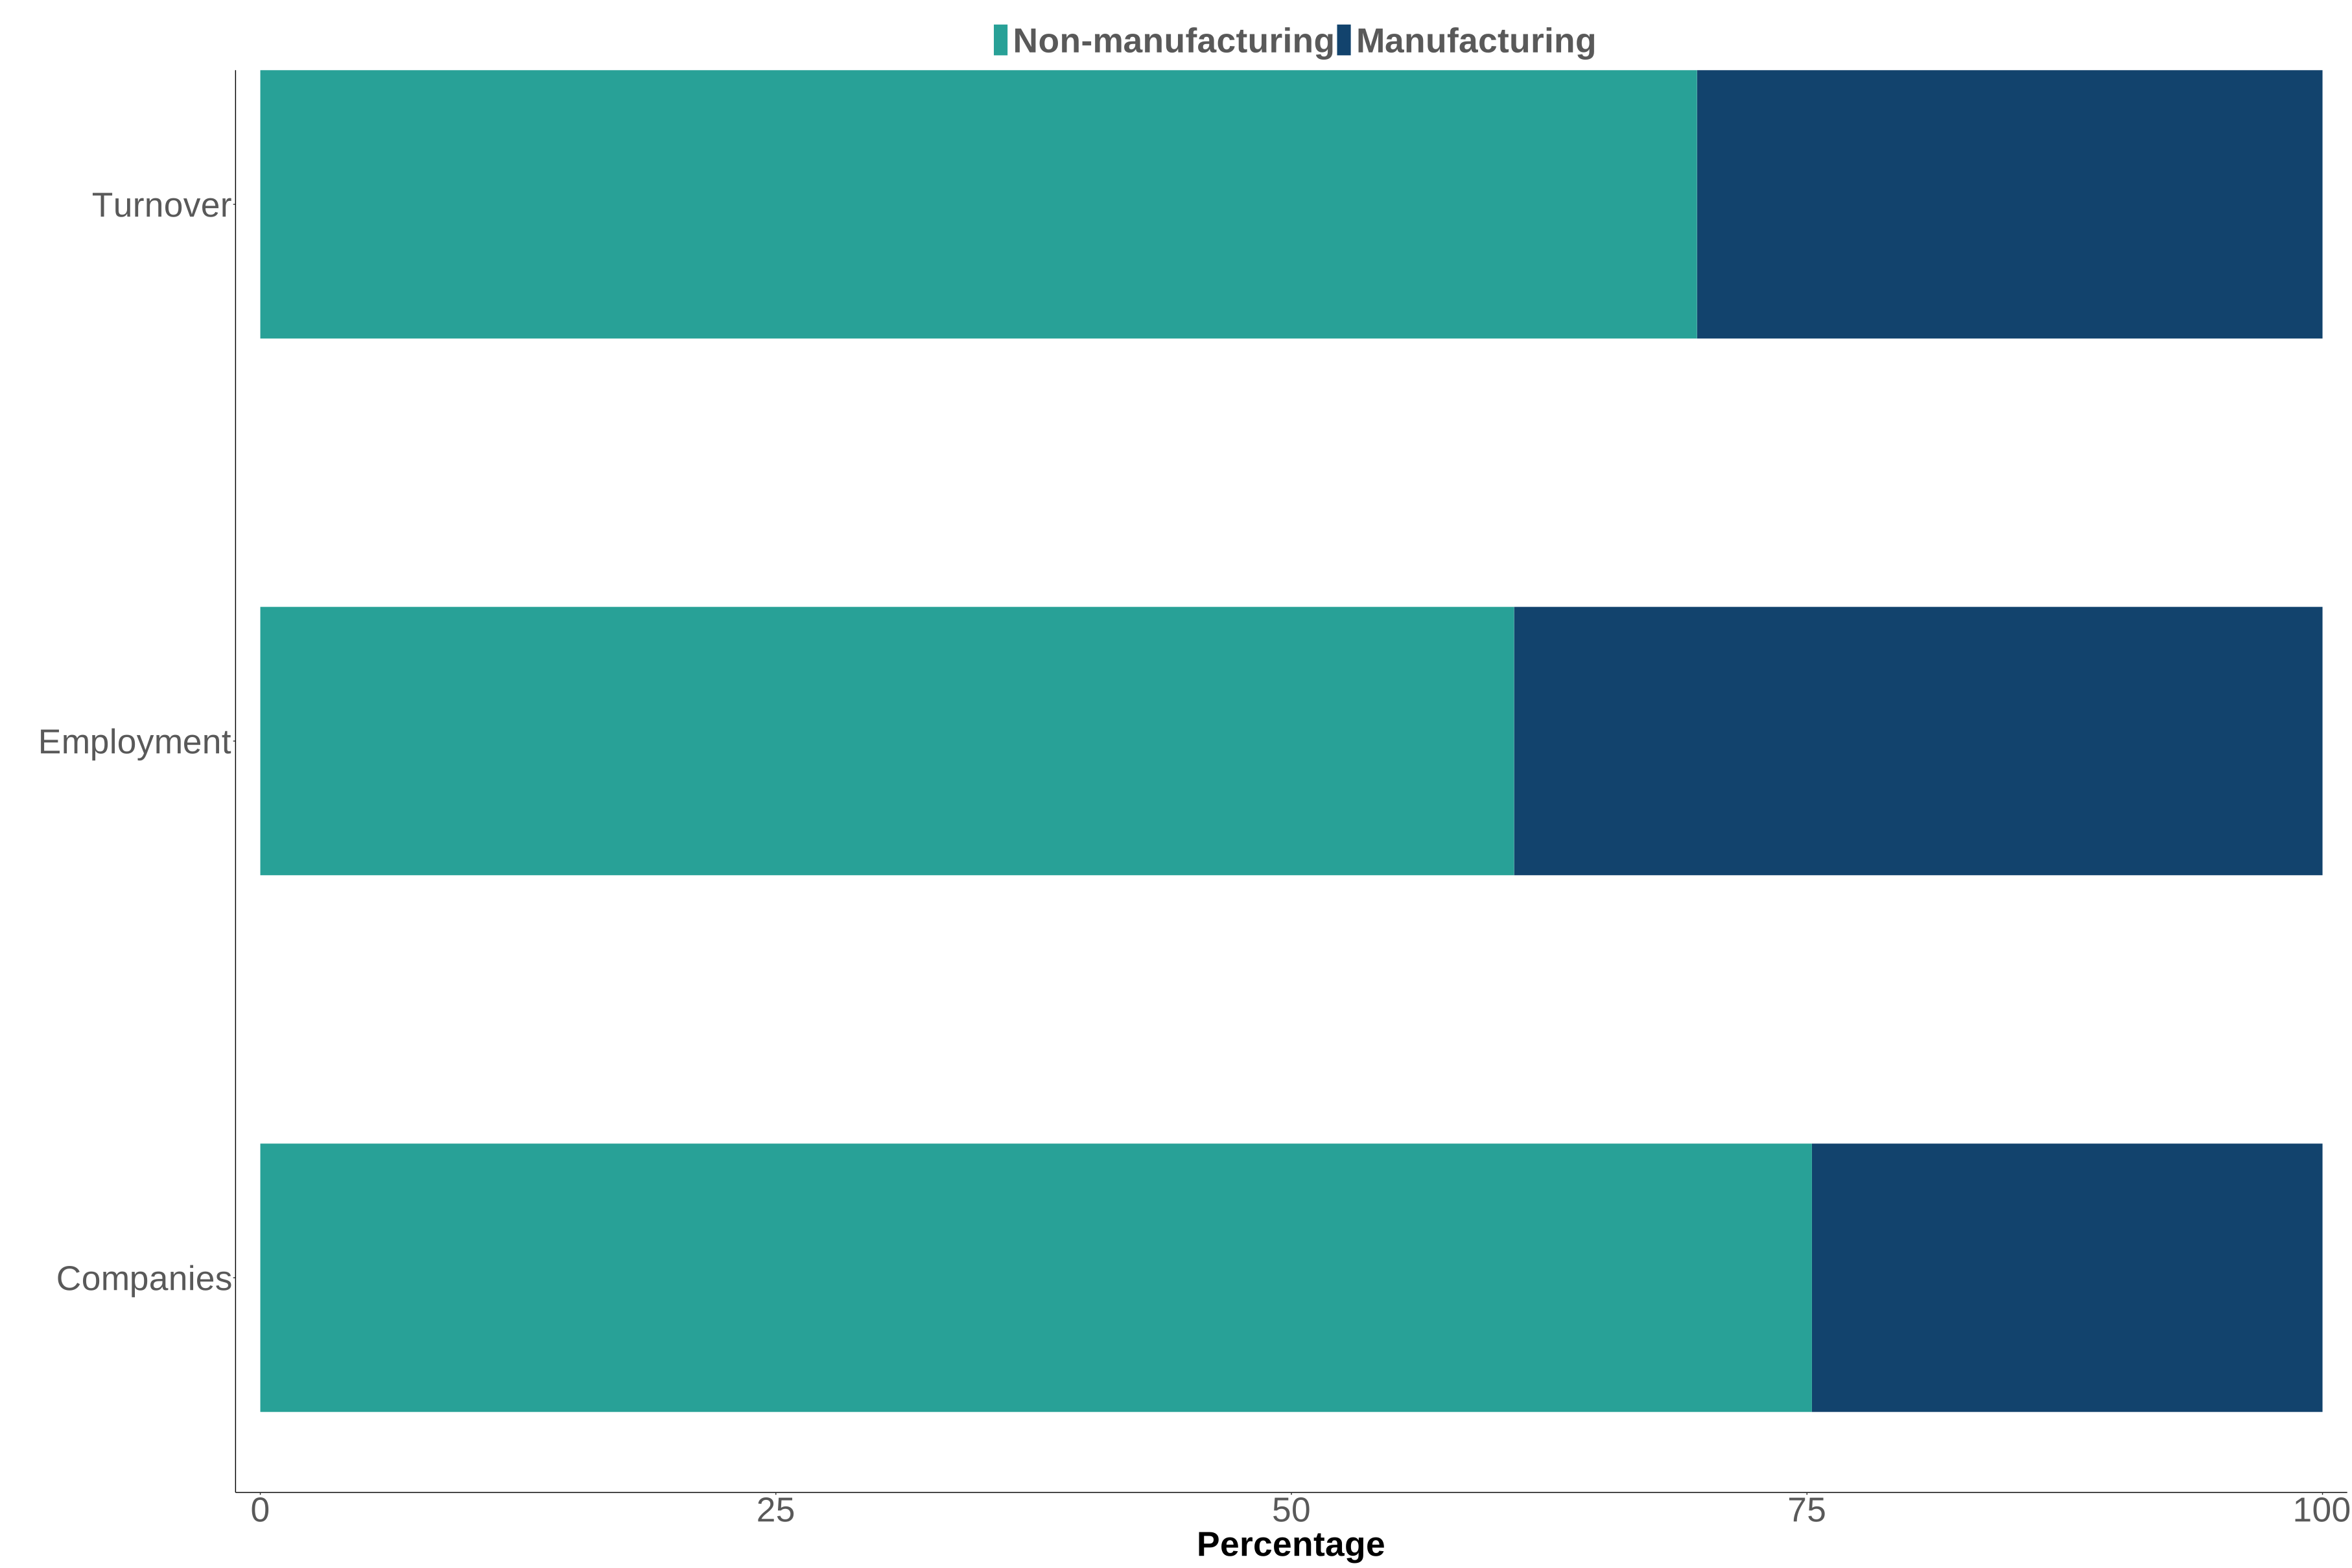
In 2024/25, there were 1,900 life sciences companies across the UK whose primary activity was manufacturing (referred to in this section as ‘manufacturing companies’). The number of manufacturing companies in 2024/25 decreased by 2% compared to 2023/24. Manufacturing companies accounted for 25% of all life sciences companies in 2024/25, a proportion that remained similar to 2023/24.
The proportion of life sciences companies that were manufacturing companies varied substantially between subsectors. 15% of biopharmaceutical companies were manufacturing companies in 2024/25 compared to 31% of medical technology companies.
The ITL 1 region with the highest share of manufacturing companies was the South East, with 18% of all manufacturing companies registered in the region in 2024/25. The South East also had the highest share of all life sciences companies nationally. Other ITL 1 regions which also had a substantial share of the UK’s manufacturing companies were the East of England (13%) and London (12%).
In 2024/25, employment at life sciences manufacturing companies was 120,200, which was an increase of 2% compared to 2023/24. Employment at manufacturing companies accounted for 39% of all life sciences sector employment.
Manufacturing companies registered in the South East ITL 1 region had the highest share of employment, accounting for 22% of all manufacturing employment in 2024/25. This was notably higher than other ITL 1 regions, with the second and third highest regions for manufacturing employment being East of England and North West (both having 12% respectively shares of employment).
Manufacturing companies generated £38.1 billion of turnover in 2024/25, which was a decrease of 3% compared to 2023/24. 30% of all turnover generated by the life sciences sector was generated by manufacturing companies.
The South East ITL 1 region accounted for the highest share of manufacturing turnover out of all UK ITL 1 regions, at 23% in 2024/25, followed by East of England at 18% and North West England at 11%.
Figure 7: Proportion of companies, turnover and employment by manufacturing status, UK, 2024/25
Notes:
- a manufacturing company is defined as a company where manufacturing is the primary activity
- data from figure 7 can be found in tables 2-4 and 12-14 of the ‘Bioscience and health technology sector statistics 2024/25: accompanying data tables’
10.2 Research and development (R&D)
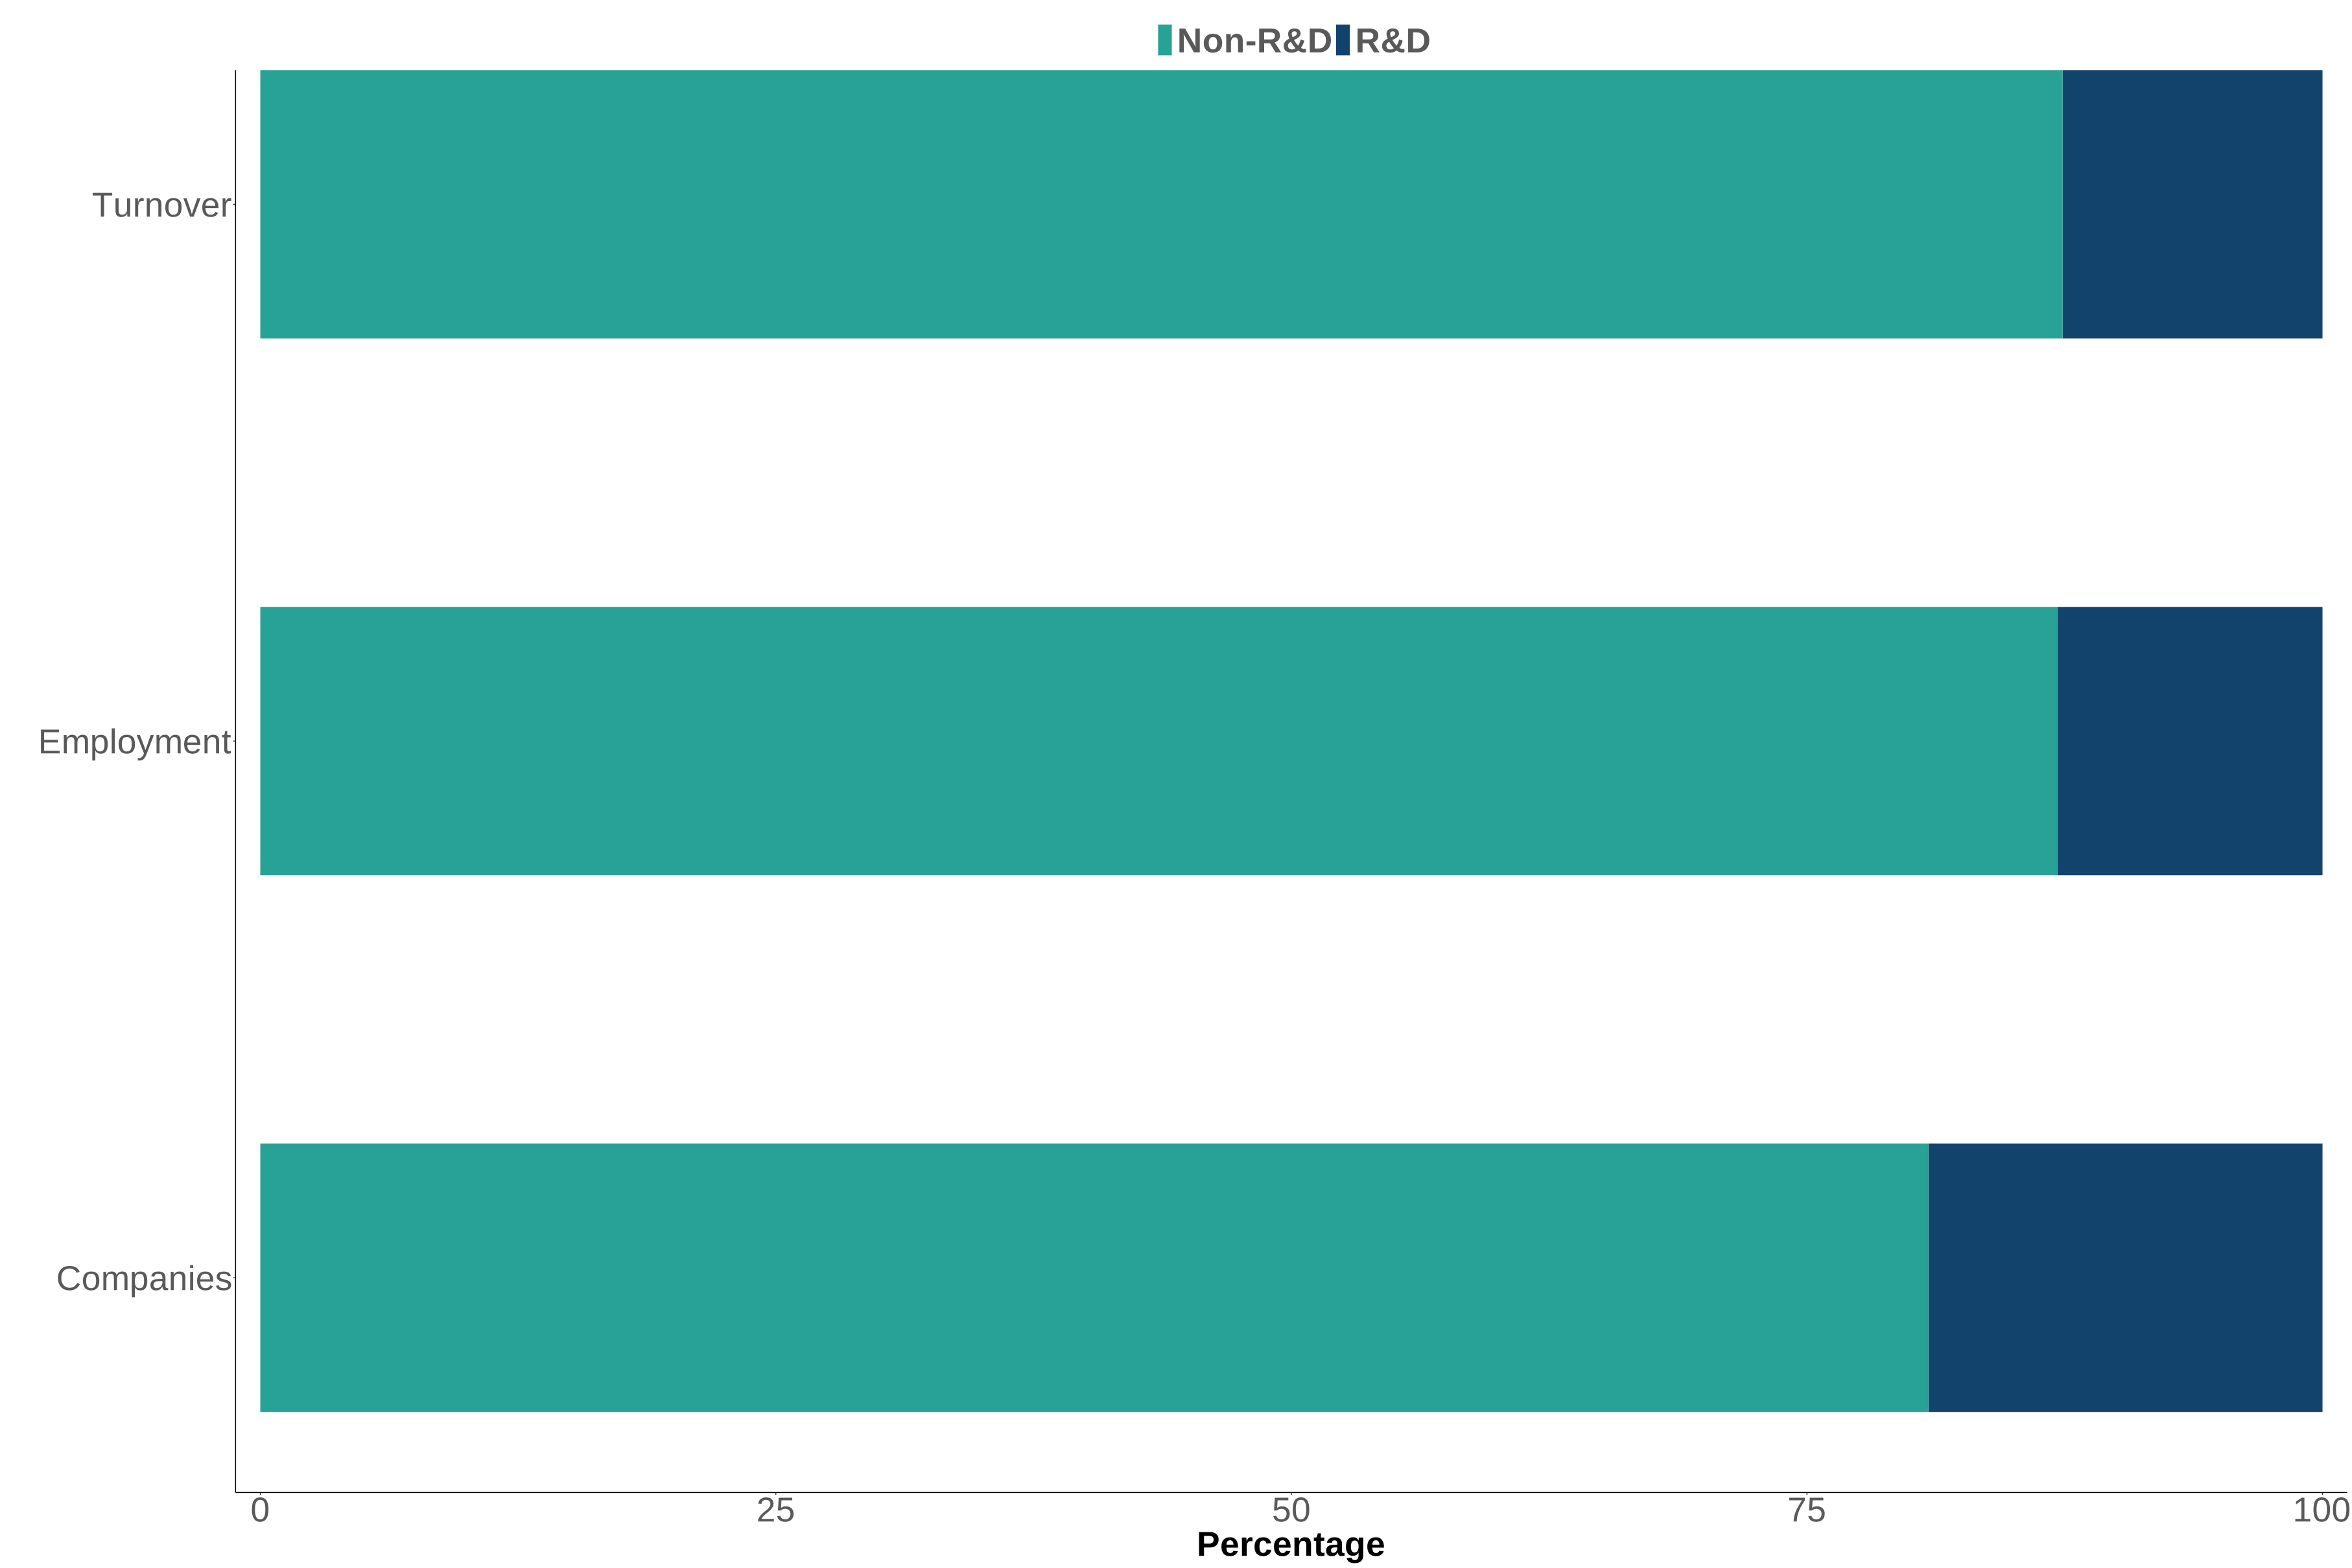
There were 1,500 life sciences companies in 2024/25 across the UK that had R&D as their primary activity (referred to in this section as ‘R&D companies’). The number of R&D companies in 2024/25 decreased by 4% compared to 2023/24. R&D companies accounted for 19% of all life sciences companies in 2024/25, a proportion that remained similar to 2023/24.
The proportion of life sciences companies that were R&D companies varied substantially between subsectors. 32% of biopharmaceutical companies had R&D as their primary activity in 2024/25 compared to 11% of medical technology companies.
The ITL 1 regions with the highest share of R&D companies were London and the South East, with these regions each accounting for 22% and 21% of R&D companies in the UK respectively in 2024/25.
In 2024/25, employment across all companies where R&D was the primary activity was 39,400, accounting for 13% of employment in the life sciences sector. This was a 4% decrease compared with 40,900 in 2023/24.
R&D companies generated £15.9 billion of turnover in 2024/25, which was an increase of 10% compared to 2023/24. 13% of all turnover generated by the life sciences sector was generated by R&D companies
Figure 8: Proportion of companies, turnover and employment by R&D status, UK, 2024/25
Notes:
- a R&D company is defined as a company where R&D is the primary activity
- data from figure 8 can be found in tables 2-4 and 15-17 of the ‘Bioscience and health technology sector statistics 2024/25: accompanying data tables’
11. Size and ownership of life sciences businesses
11.1 Business size
The 2024/25 release uses an updated definition to define businesses classed as Small and Medium Enterprises (SMEs). SMEs are now defined as businesses with an employment value of less than 250. This definition has been applied to data points from 2023/24 onwards.
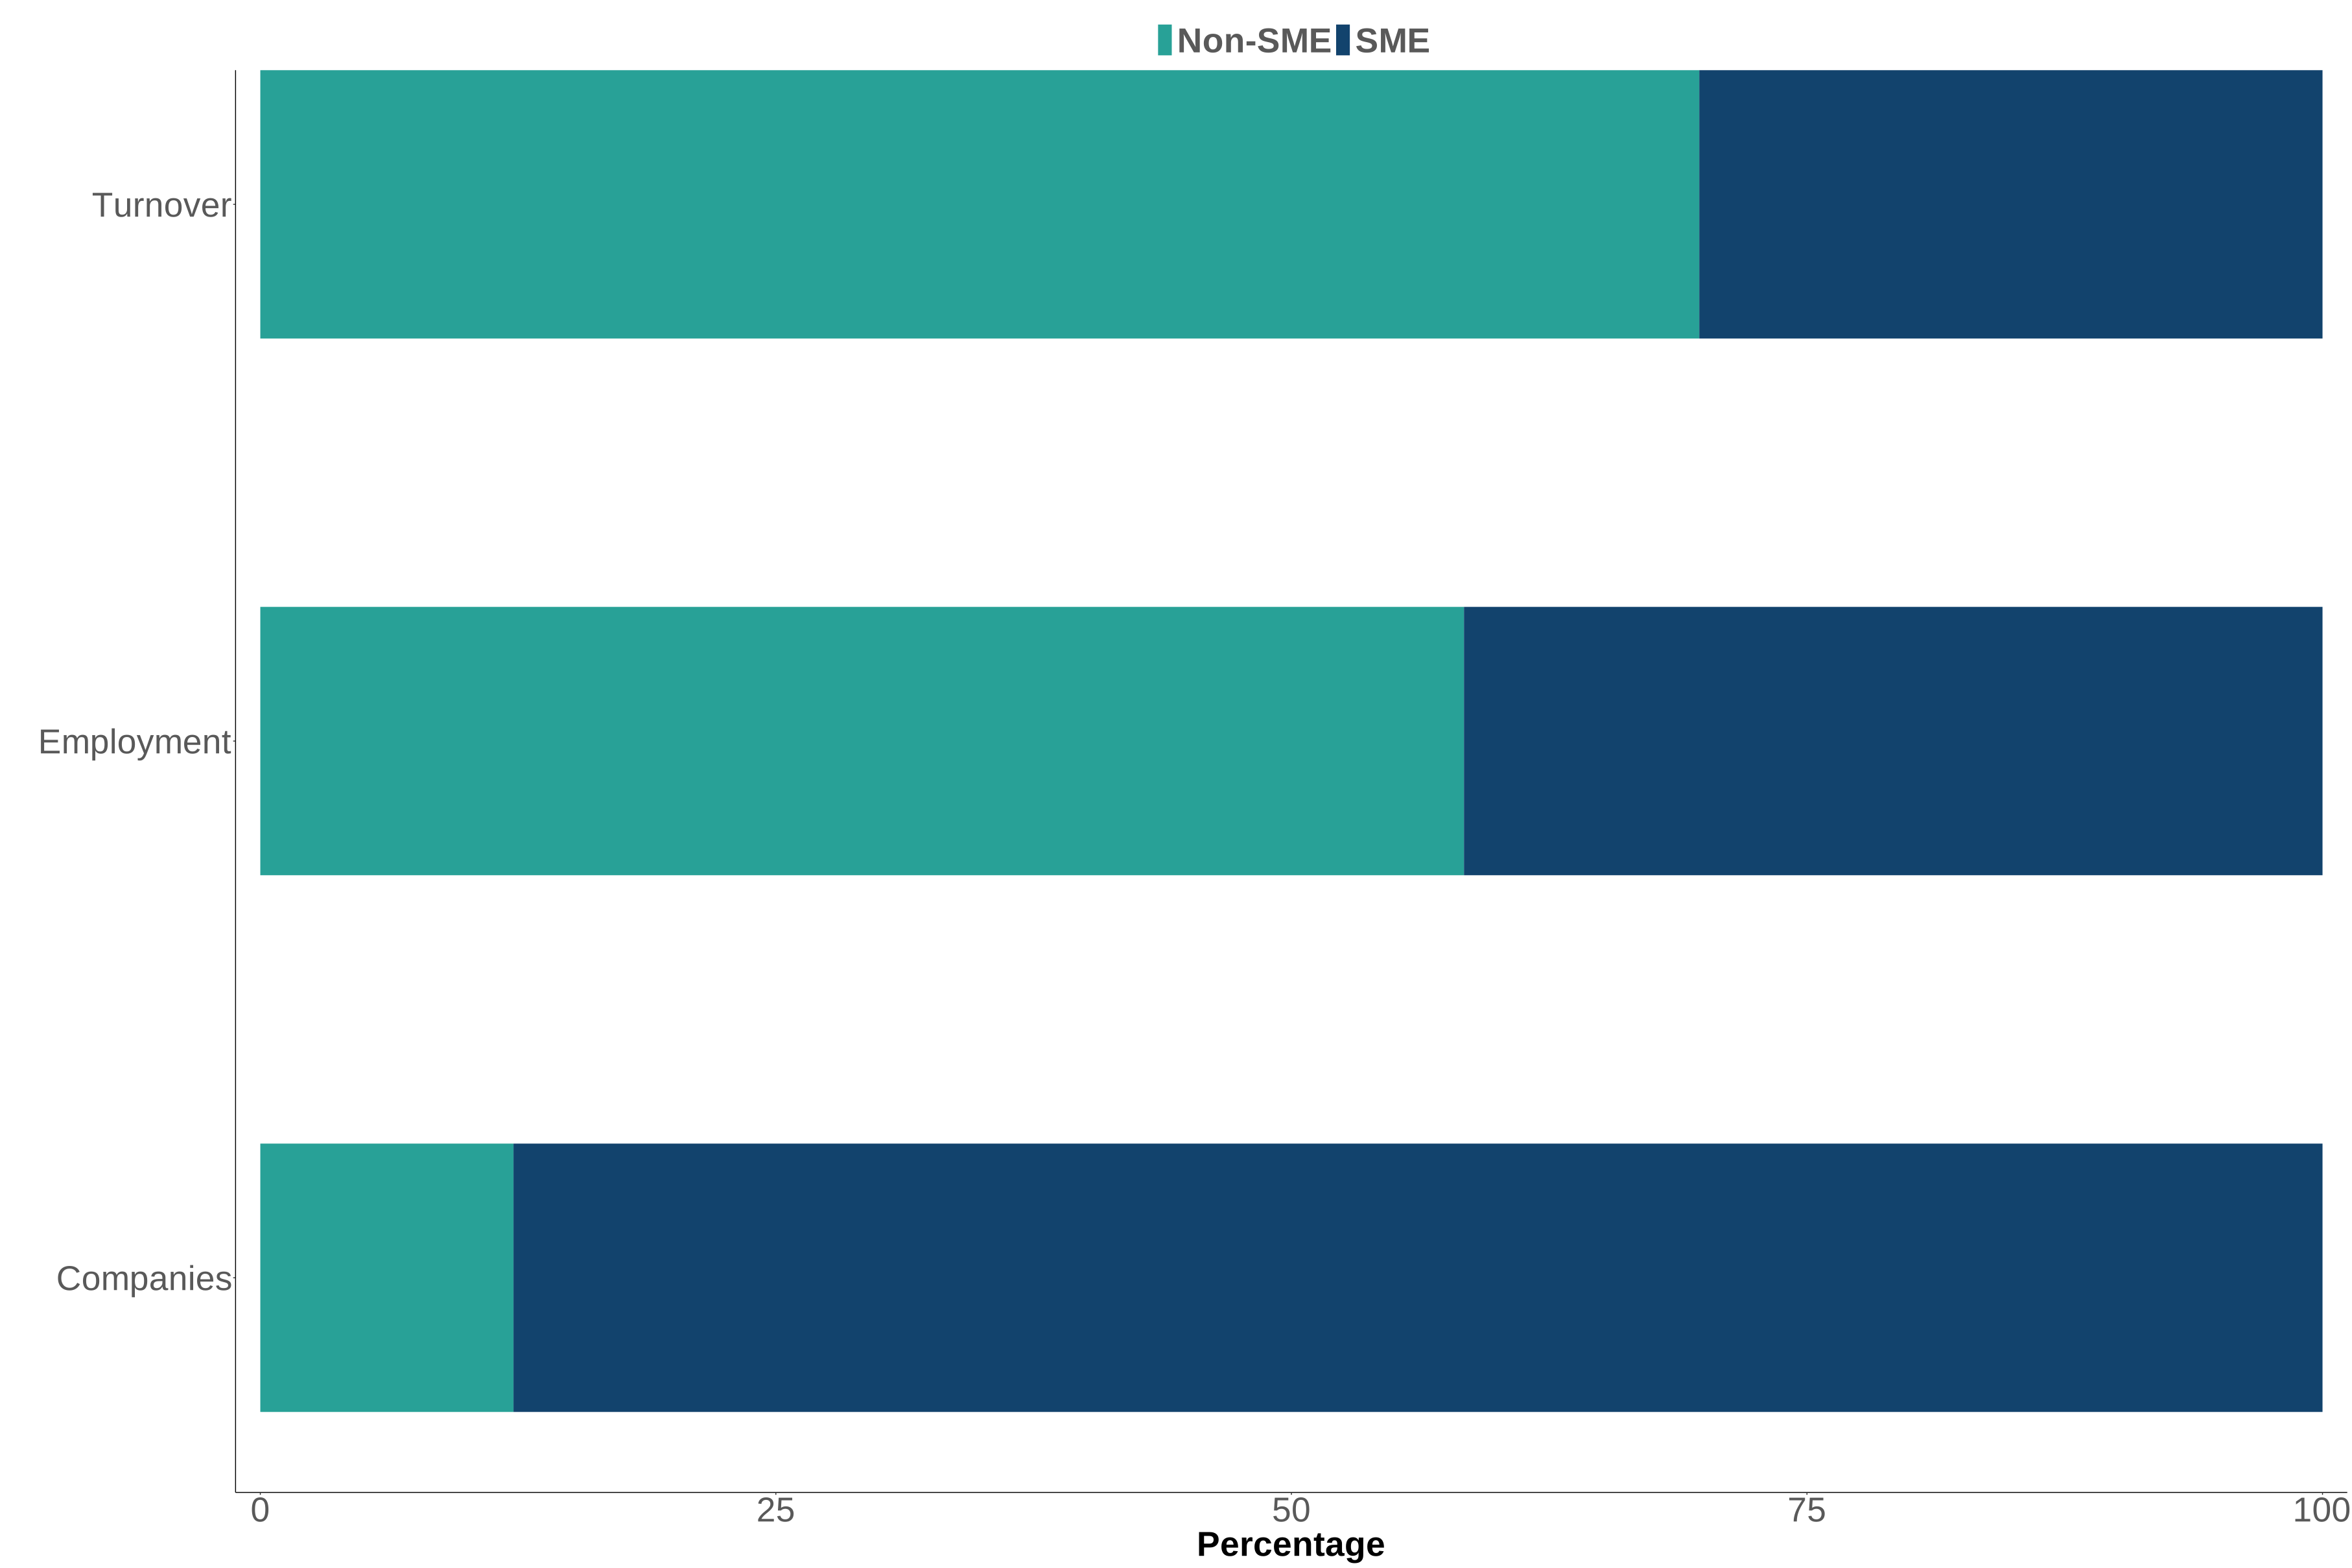
In 2024/25, there were 6,700 SME companies in the life sciences sector in the UK. SMEs, which accounted for 88% of all life sciences companies in 2024/25, which remains unchanged since 2023/24. Despite making up the majority of companies, SMEs accounted for a smaller fraction of the life sciences sector employment and turnover generated. In 2024/25, SMEs employed 127,700 people (42% of total employment in the life sciences sector) and generated £38.0 billion in turnover (30% of total turnover generated by the life sciences sector).
Figure 9: Proportion of companies, employment and turnover by SME status, UK, 2024/25
Note: data from figure 9 can be found in tables 24-26 of the ‘Bioscience and health technology sector statistics 2024/25: accompanying data tables’
11.2 Company ownership
This section reports on the ‘global ultimate owners’ of life sciences companies and whether they are based in the UK or overseas.
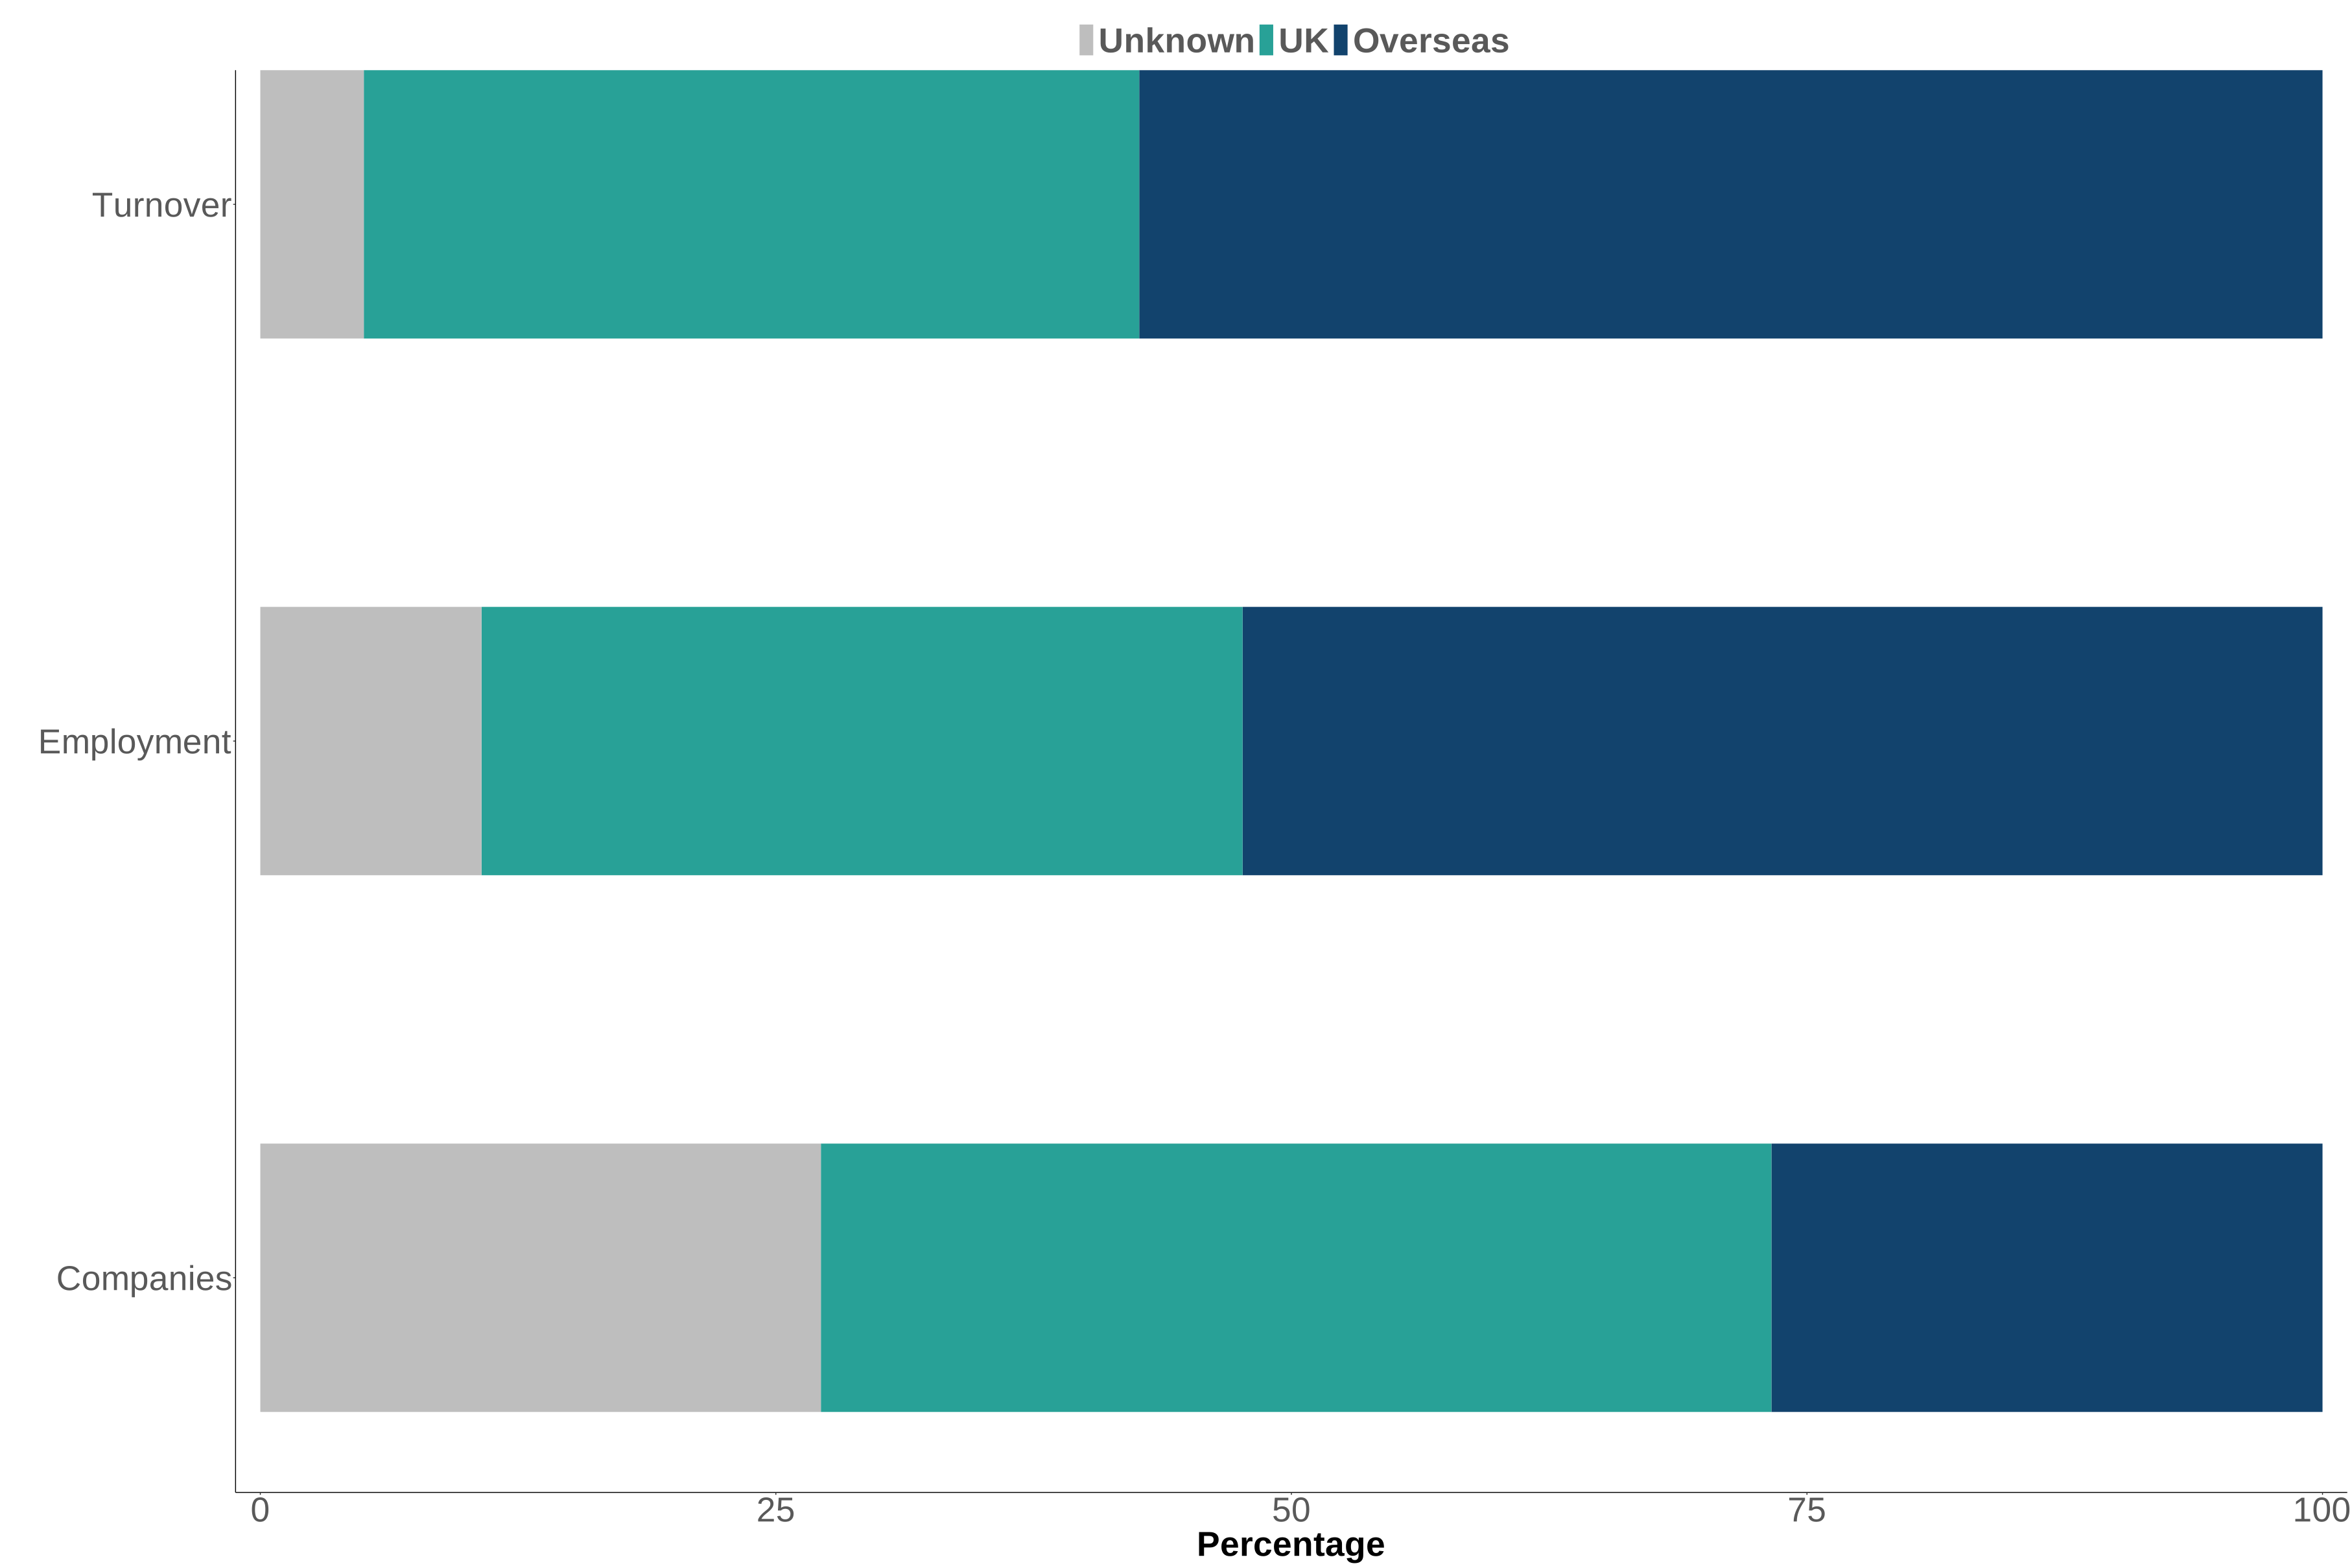
The global ultimate owner’s country location was unknown for 27% of companies in the dataset in 2024/25. In 2024/25, 27% of companies operating in the UK were identified as being owned by overseas companies, which was a similar proportion seen in 2023/24. The companies that were identified as having overseas ownership accounted for 52% of employment and 57% of turnover in 2024/25.
Figure 10: Proportion of companies operating in the UK, turnover and employment by company ownership, 2024/25
Note: data from figure 10 can be found in tables 27-29 of the ‘Bioscience and health technology sector statistics 2024/25: accompanying data tables’
12. Terminology
Sector: used when referring to life sciences as a whole (biopharmaceutical and medical technology subsectors combined).
Employment: people working for a business, including owners and partners.
Turnover: the income received by life sciences businesses from the sales of goods and/or services charged to third parties. This excludes value-added tax (VAT).
Subsector: used to describe the two component subsectors of the life sciences industry (biopharmaceuticals and medical technology).
Biopharmaceutical subsector: this subsector includes:
-
core companies that develop and/or produce their own pharmaceutical products. This includes companies working on small molecules, vaccines and advanced therapy medicinal products (ATMPs)
-
service and supply companies that offer goods and services to core biopharmaceutical companies including, for example, contract research and manufacturing organisations (CRMOs), and suppliers of consumables and reagents for research and development (R&D) facilities
Medical technology subsector: this subsector includes:
-
core companies that develop and produce medical technology products, ranging from single-use consumables to complex hospital equipment, including digital health products
-
service and supply companies that offer services to core medical technology companies including, for example, CRMOs, and suppliers of consumables and reagents for R&D facilities
Business: an entity that is the legal owner of one or more companies. Companies are considered part of the same business when they are part of the same enterprise group structure, as defined by the Office for National Statistics’ (ONS) Inter-Departmental Business Register (IDBR).
Company: a company is a legal entity which may have a distinct identity from the broader organisation that owns or runs it. A company in the BaHTSS publication is defined as an entity registered with Companies House that has an assigned Company Registration Number (CRN).
Site: the physical locations that life sciences companies operate out of.
SME status: based on the European definition of Small and Medium-sized Enterprises (SMEs) and refers to businesses with fewer than 250 employees and which either have annual turnover up to and including €50m and/or have an annual balance sheet total up to and including €43m.