Benefit cap: number of households capped to May 2026
Published 22 September 2026
Applies to England, Scotland and Wales

© Crown copyright 2026
This publication is licensed under the terms of the Open Government Licence v3.0 except where otherwise stated. To view this licence, visit nationalarchives.gov.uk/doc/open-government-licence/version/3 or write to the Information Policy Team, The National Archives, Kew, London TW9 4DU, or email: psi@nationalarchives.gov.uk.
Where we have identified any third party copyright information you will need to obtain permission from the copyright holders concerned.
This publication is available at https://www.gov.uk/government/statistics/benefit-cap-number-of-households-capped-to-may-2026/benefit-cap-number-of-households-capped-to-may-2026
This quarterly release of Benefit Cap Statistics covers data for Great Britain and is part of the Benefit Cap statistics collection. Data is available on Stat-Xplore.
The next release is scheduled for 15 December 2026.
Improvements in this release:
Outcomes at off-flow is now available on Stat-Xplore with a revised methodology. In June 2026 the outcomes at off-flow was suspended due to an issue identified with the statistical methodology.
Off-flows are now counted in the first month after they were last capped. This improvement has been made to align off-flows with point in time statistics and aid user understanding. This improvement does not affect the number of off-flows, only the month they are reported against.
More information about these improvements is available in the Background and Information Methodology document.
1. Main stories
All figures in this summary document refer to the Benefit Cap on UC
- In total, 160,000 households had their benefit capped, almost all of which are capped on UC (150 households had their benefit capped on HB) at May 2026
On UC, in May 2026:
-
the number of capped households has increased by 53,000 (48%) compared with February 2026 and increased by 47,000 (41%) compared with May 2025. This coincides with annual uprating to benefit rates, the removal of the two-child limit policy and rebalancing of UC in April 2026
-
the most common number of children in a capped household is 3, this compares with 2 in February 2026 and 2 in May 2025
-
2.3% of working age households claiming UC had their benefits capped, compared with 1.5% of households that had their benefit capped in February 2026
-
all family types have seen an increase in numbers since the previous quarter, single with children increasing the most by 41,000 (55%) and single without children increasing by 7,500 (33%)
-
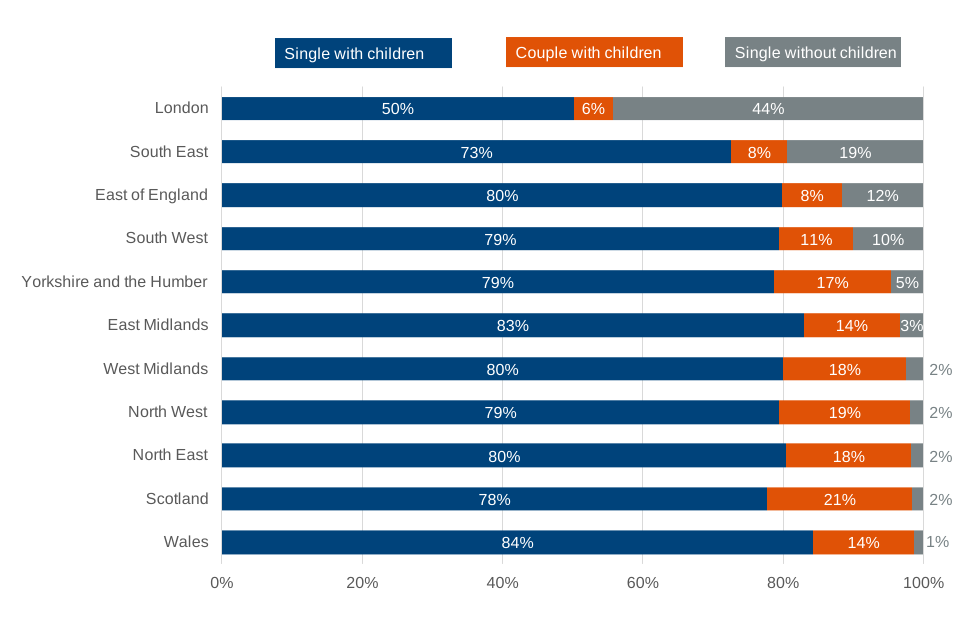
44% of capped households in London are single without children compared with 20% in South East, 12% in East of England, 10% in South West and 5% or less in other regions, Scotland and Wales
-
The monthly average (mean) cap amount has increased to £346, compared with £237 in February 2026 and £255 in May 2025
On UC, between March 2026 and May 2026, 58,000 households were newly capped, the highest number since the COVID-19 pandemic.
2. What you need to know
For the most recent reporting period (March to May 2026), the statistics should be viewed in the context of annual uprating, rebalancing of UC and the removal of the two-child limit. The Benefit Cap levels were unchanged. However, the statistics do not identify the extent to which these policies may have contributed to the change observed. More information on these policy changes is available in the Background and Information Methodology document.
The statistics are derived from DWP administrative data.
All data for households capped in Housing Benefit or Universal Credit is available in Stat-Xplore. As nearly all households are now capped in Universal Credit, this summary report only presents information on households capped in Universal Credit.
Universal Credit figures for the latest two years are revised to capture retrospective changes that may occur to UC claims. This is in line with our revisions methodology and means that historic figures published in this release may differ from already published figures.
The level of revision between previously published figures and the revised series varies across time periods, by geographical area and by other available breakdowns. However, more recent periods tend to be subject to a greater degree of revision than more historic ones.
For readers requiring text descriptions of charts, the paragraphs that follow each chart provides a description of the main information from the chart.
3. The number of capped households in GB
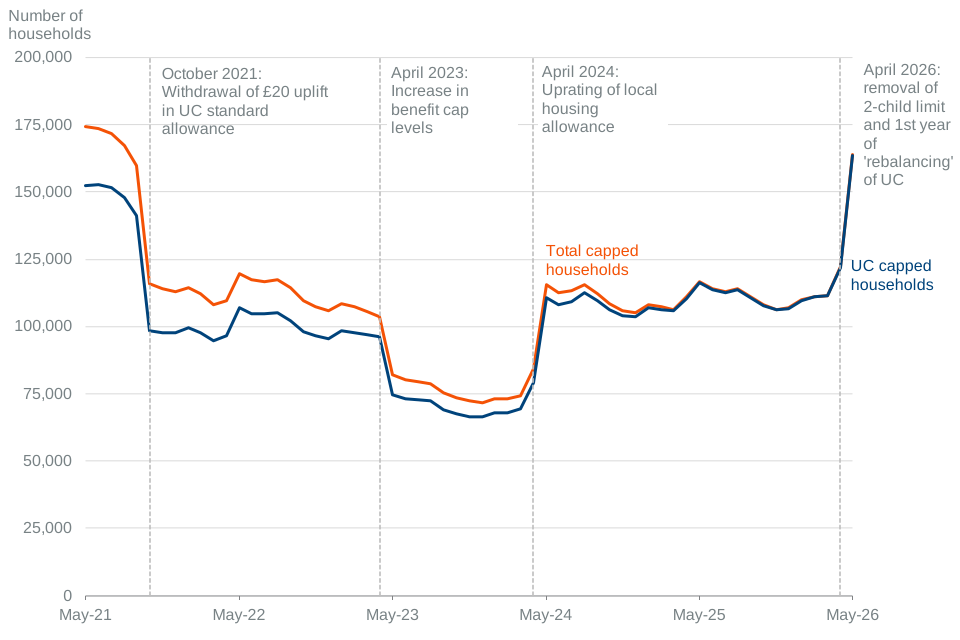
Number of capped households was 41% higher in May 2026 compared with May 2025
Figure 1: Monthly number of total and UC capped households, Great Britain, May 2021 to May 2026
Note: Total capped households includes UC and HB. Data on HB capped households is available on Stat-Xplore.
Source: Benefit Cap HB point in time caseload and UC point in time caseload statistics, Stat Xplore
Figure 1 shows that nearly all households having their benefits capped are now capped in Universal Credit. A small proportion remain capped in Housing Benefit. For this reason, this summary will focus on capped households in UC as that will be representative of capped households as a whole.
The chart shows there were 160,000 households capped in UC in May 2026. This is 48% (53,000) higher than February 2026 and 41% (47,000) higher than May 2025. This coincides with annual uprating, ‘rebalancing’ of UC and changes to two child limit policy. Benefit cap levels were unchanged. See Background and Information Methodology document for more information.
There are many factors that could change whether a household is capped by the Benefit Cap. These include, among other things, changes in personal circumstances such as employment status and earnings, living arrangements or health conditions, and policy changes. For example, households benefiting from uprating of benefit rates and policy changes in April 2026 (see What you need to know) would have had an increase to their benefit income. An increase to eligible benefit income, everything else being equal, may take a household over the benefit cap level for their area and family type, bringing them onto the Benefit Cap.
Majority of households capped in February 2026 remain capped in May 2026
Figure 2: Movement of Benefit Cap households on Universal Credit on and off the Benefit Cap, Great Britain, February 2026 to May 2026
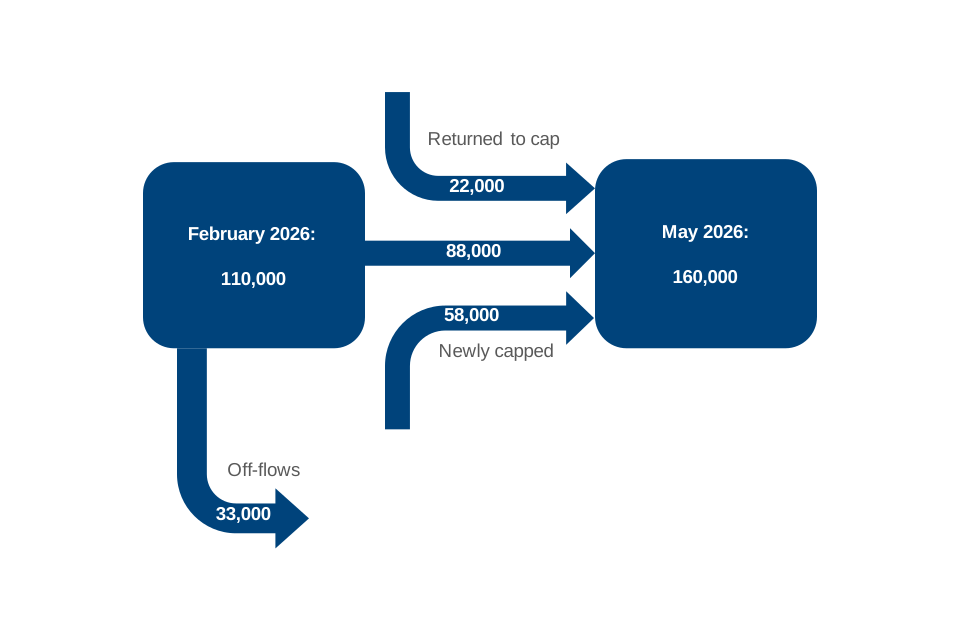
Note: Off-flows are households that were last capped between March 2026 and May 2026. Newly capped are households that were capped for the first time between March 2026 and May 2026. Returned to cap are households that were capped before February 2026, but not in February 2026, and are capped again in May 2026.
Note: Figures in the flow chart may not sum, due to households which flow on and off the cap between quarters not being included in the quarterly totals.
Figure 2 is an infographic that shows of the 160,000 households being capped in UC in May 2026:
- 88,000 of these were on the benefit cap in February 2026
- 58,000 households started on the benefit cap for the first time between March 2026 and May 2026
- 22,000 households are on the benefit cap having been capped before, but not at, February 2026
With the number of HB capped households now being very low, statistics of households moving from HB to UC while still being capped are no longer reported in this summary. However, there may still be a very small number of households that do move to UC from HB and these figures, where not negligible, will be available on Stat-Xplore.
In addition, 33,000 households have moved off the benefit cap from February 2026.
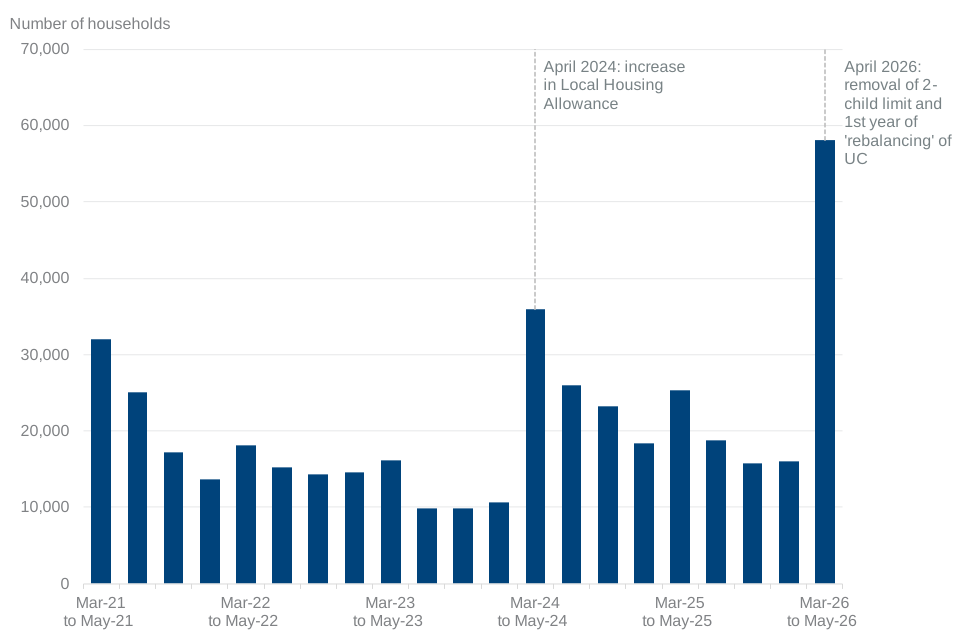
Highest number of newly capped households (58,000) in the latest quarter (March 2026 to May 2026) compared with quarters since the COVID-19 pandemic
Figure 3: Quarterly total number of newly capped UC households, Great Britain, May 2021 to May 2026
Source: Benefit Cap UC cumulative caseload statistics, Stat-Xplore
Figure 3 shows there were 58,000 households that had their benefits capped for the first time in the latest quarter (March 2026 to May 2026). This is the highest number in any quarter since the COVID-19 pandemic (88,000, March 2020 to May 2020).
This is an increase of 262% from last quarter (December 2025 to February 2026) where 16,000 households were capped for the first time.
It is also an increase of 130% from the same quarter last year (March 2025 to May 2025) where 25,000 households were capped for the first time.
This increase should be seen in the context of annual uprating in benefit, the removal of the two-child limit and ‘rebalancing’ of UC in April 2026. Benefit cap levels were unchanged. However, the statistics do not identify the extent to which these policies may have contributed to the change observed. See Background and Information Methodology for more information.
Note: Newly capped households are those that have their benefits capped for the very first time. For UC, this excludes off-flows from the HB cap who then immediately become capped under UC.
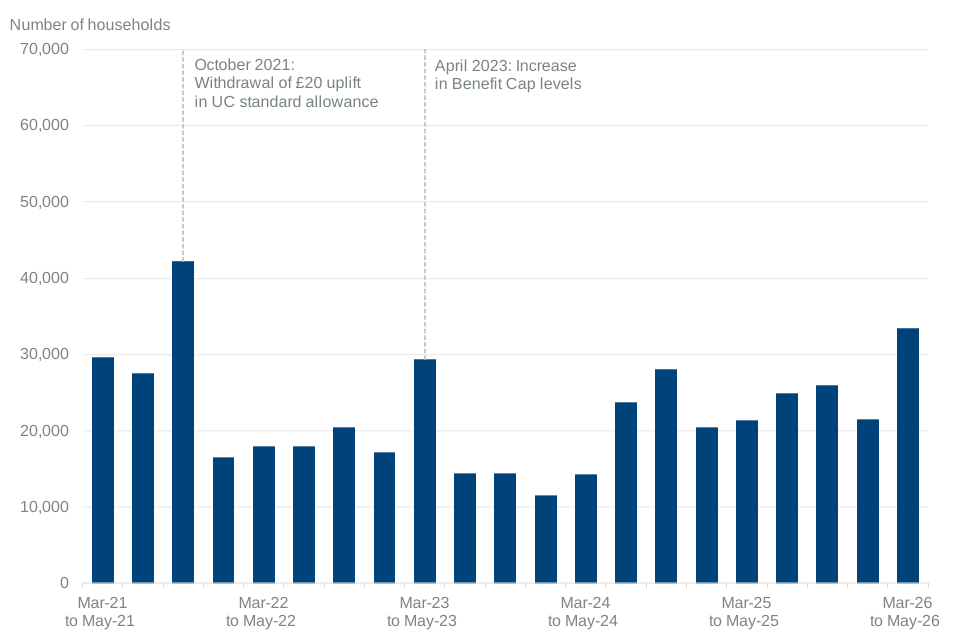
33,000 households have flowed off the Benefit Cap on UC in the latest quarter (March 2026 to May 2026)
Figure 4: Quarterly total number of households that have flowed off the Benefit cap, May 2021 to May 2026
Source: Benefit Cap HB cumulative and UC cumulative caseload statistics, Stat-Xplore
Note: Off-flows are particularly subject to retrospection, and numbers for the quarter ending May 2026 should be regarded as provisional. A household will no longer be counted as an off-flow if they reappear on Benefit Cap data in the future. Historic changes over the last 2 years show that it is expected that between 6,000 and 10,000 households in the most recent quarter reported return to the Benefit Cap during the following 3 months and no longer count as an off-flow in the quarter.
Figure 4 shows there were 33,000 households leaving the Benefit Cap in the quarter to May 2026. There were 22,000 households that left the Benefit Cap in the previous quarter ending February 2026 and have not returned by May 2026.
Of the off-flows this quarter, 4,000 households (12%) were newly capped and flowed off during the quarter.
The highest number of UC off-flows in one-quarter was for the quarter to November 2021 when 42,000 claims flowed off the cap. During this period, in October 2021, the temporary £20 a week increase to UC introduced during the pandemic was withdrawn.
There was also a higher number of off-flows in the quarter to May 2023 than there were in the previous quarter (29,000). This should be seen in the context of the increased benefit cap levels which were implemented from April 2023.
In the quarter to May 2026, 59% (20,000) of UC households that flowed off the cap left the cap due to having employment earnings at, or over, the employment earnings threshold. The remaining 41% (14,000) left due to other reasons; examples include a household’s benefit income has reduced under the cap levels, a household is in receipt of an exempting benefit, or a household is no longer claiming UC. This compares to 52% (11,000) of UC households that left due to earning over the earnings threshold, and 48% (10,000) leaving the cap due to other reasons, in the quarter to February 2026.
These figures for off-flow outcomes cannot be compared to figures published in earlier releases due to an improved methodology being implemented. For more information see the Background and Information Methodology document.
The employment earnings exemption threshold is subject to change each financial year. The earnings exemption threshold is £881 for the Financial Year Ending (FYE) 2027. Details of previous exemption threshold levels can be found in background information and methodology document.
Off-flow outcomes are shown as at the end of the quarter in which a household moved off the benefit cap, meaning the outcomes are fixed at that point, unless a household is capped again at a later date. More detail on the way off-flow outcomes are determined is included in the background information and methodology document.
4. Characteristics of capped households
At May 2026 81% (130,000) of households that had their UC capped included children. This compares with 79% in February 2026 and 84% (97,000) at May 2025. The percentage of households on UC with children being capped had been following a general downward trend since it peaked at 91% in May 2023 until March 2026.
Of the capped households with children at May 2026:
- 94% (120,000) had between 1 and 4 children
- 6% (8,300) had 5 or more children
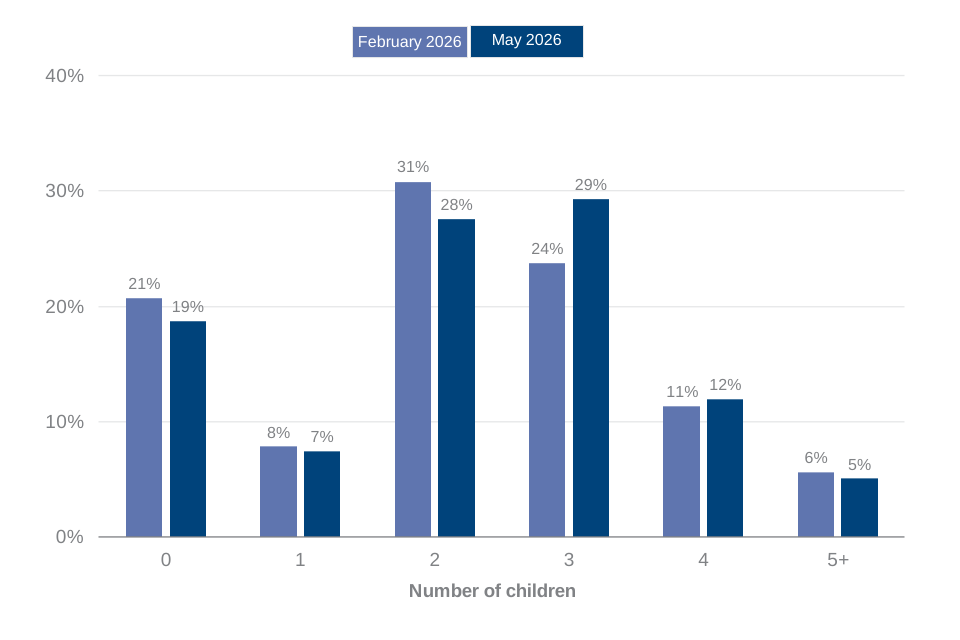
The most common number of children for UC capped households at May 2026 is 3 children
Figure 5: Proportion of UC capped households by number of children, Great Britain, February 2026 and May 2026
Source: Benefit Cap, UC point in time caseload statistics, Stat Xplore
Figure 5 shows that of capped households with children in May 2026, the majority have 3 children. In comparison the majority in February 2026 had 2 children.
Overall, households with 2 or fewer children account for a smaller proportion of households being capped in May 2026 than in February 2026.
This change in trend should be seen in the context of annual uprating in benefit, the removal of the two-child limit and ‘rebalancing’ of UC in April 2026. Benefit cap levels were unchanged. However, the statistics do not identify the extent to which these policies may have contributed to the change observed. See Background and Information Methodology for more information.
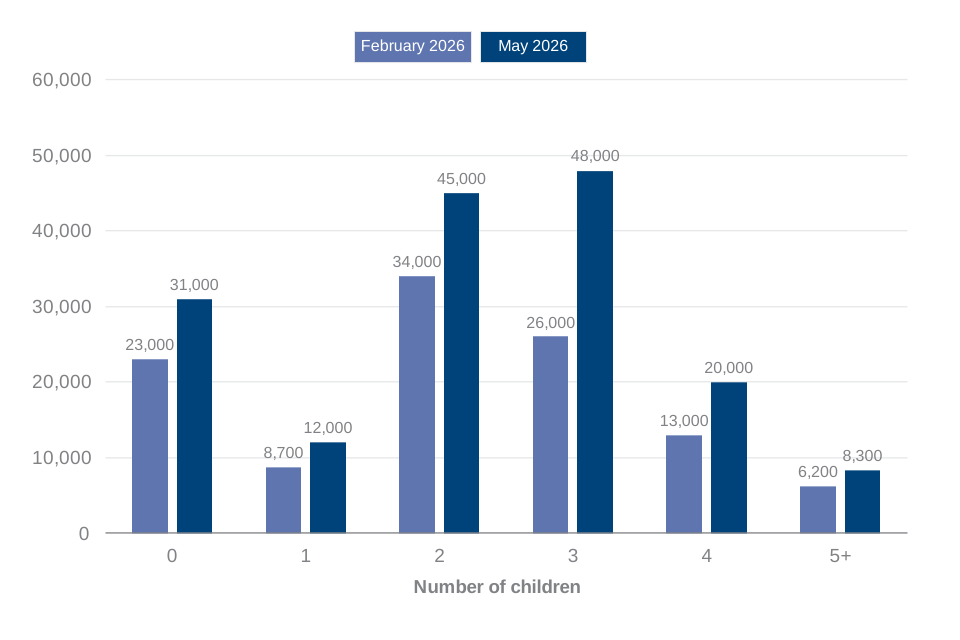
Number of capped households have increased for all household sizes for May 2026 compared with February 2026
Figure 6: Number of UC capped households by number of children, Great Britain, February 2026 and May 2026
Source: Benefit Cap, UC point in time caseload statistics, Stat Xplore
Although households with 3 or 4 children have increased as a proportion of all capped households in May 2026, the number of households being capped has increased for all household sizes, when compared to February 2026 regardless of whether they have children or not.
Figures 5 and 6 show the proportions and numbers of capped households by the number of children within each household for May 2026 and February 2026. The figures show households with:
-
no children has increased to 31,000 from 23,000 but decreased as a proportion of households being capped to 19% from 21%
-
1 child has increased to 12,000 from 8,700 but decreased as a proportion of households being capped to 7% from 8%
-
2 children has increased to 45,000 from 34,000 but decreased as a proportion of households being capped to 28% from 31%
-
3 children has increased to 48,000 from 26,000 and increased as a proportion of households being capped to 29% from 24%
-
4 children has increased to 20,000 from 13,000 and increased as a proportion of households being capped to 12% from 11%
-
5 or more children has increased to 8,300 from 6,200 but decreased as a proportion of households being capped to 5% from 6%
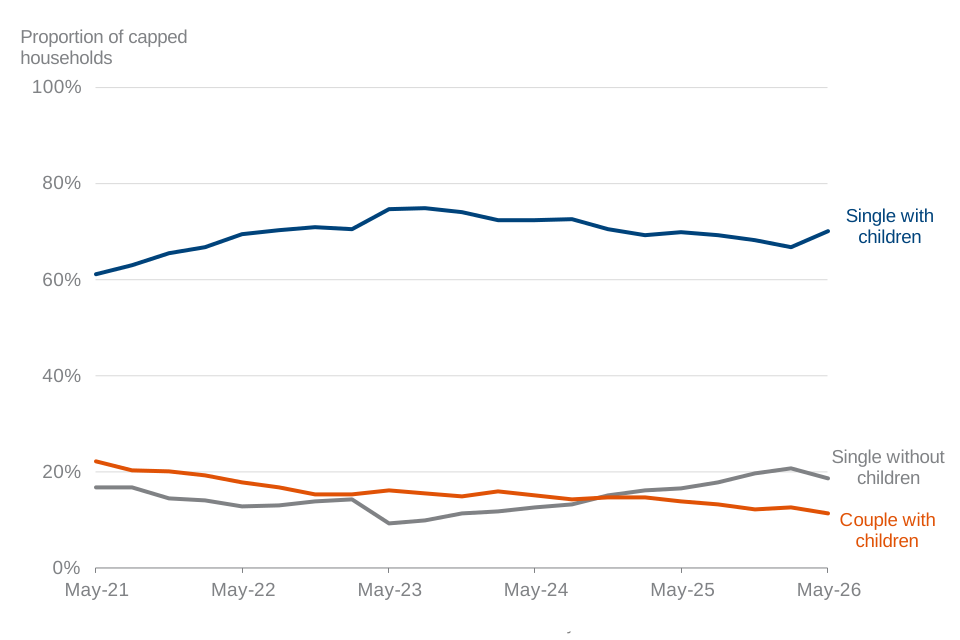
The majority of UC households that have their benefits capped are single parent households
Figure 7: Proportion of UC capped households by household type, Great Britain, May 2021 to May 2026
Source: Benefit Cap UC point in time caseload statistics, Stat Xplore
Note: This graph is plotted using quarterly point in time figures.
Figure 7 shows that single parent households have consistently accounted for the majority of capped households over the time series.
70% of capped households were single parent families in May 2026. This is an increase from 67% in February 2026. Previous to this, the proportion of single parent capped households had been on a gradual downward trend since peaking at 75% in August 2023.
The proportion of capped households that are single person households with no children has fallen to 19% in May 2026 from 21% in February 2026. Prior to this the proportion had been gradually increasing from a low of 9% in May 2023. In November 2024 single person households without children became a greater proportion of capped households than couple households with children for the first time in the charted time series.
Couple households with children accounted for 11% of capped households in May 2026. This has been gradually falling since a peak of 22% in May 2021.
These changes in trend should be seen in the context of annual uprating in benefit, the removal of the two-child limit and ‘rebalancing’ of UC in April 2026. Benefit cap levels were unchanged. However, the statistics do not identify the extent to which these policies may have contributed to the change observed. See Background and Information Methodology document for more information.
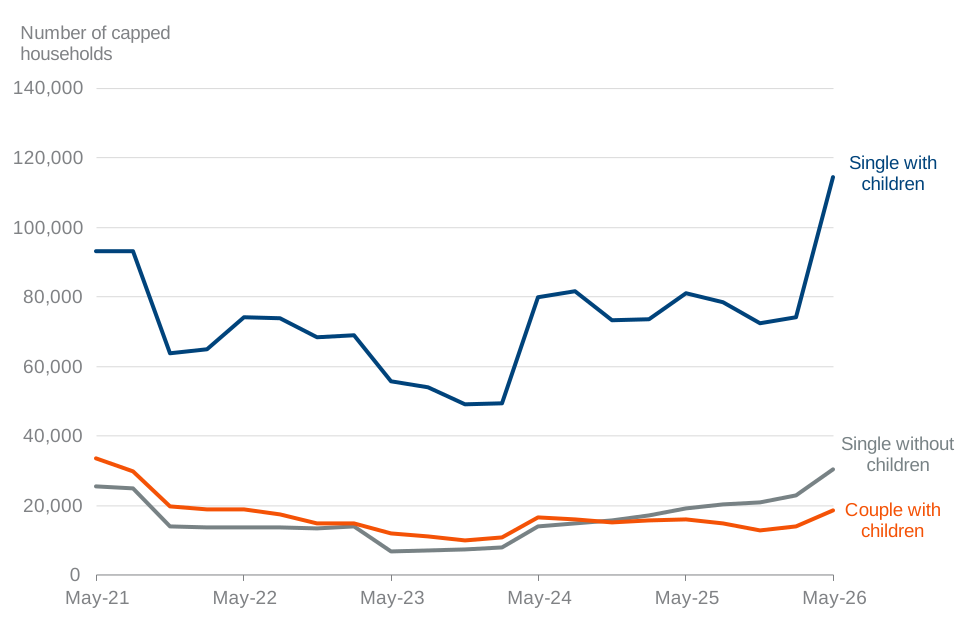
All capped household types have increased in number in May 2026 compared with February 2026
Figure 8: Number of UC capped households by household type, Great Britain, May 2021 to May 2026
Source: Benefit Cap UC point in time caseload statistics, Stat Xplore
Figure 8 shows that the number of capped households for all family types has increased in May 2026 compared with February 2026. The number of capped households for each household type for May 2026 when compared with February 2026 show:
-
single with children has increased by 55% to 110,000 from 74,000
-
single without children has increased by 33% to 30,000 from 23,000
-
couple with children has increased by 33% to 18,000 from 14,000
There are regional variations in the family types as a proportion of each region. This is described in the regional section.
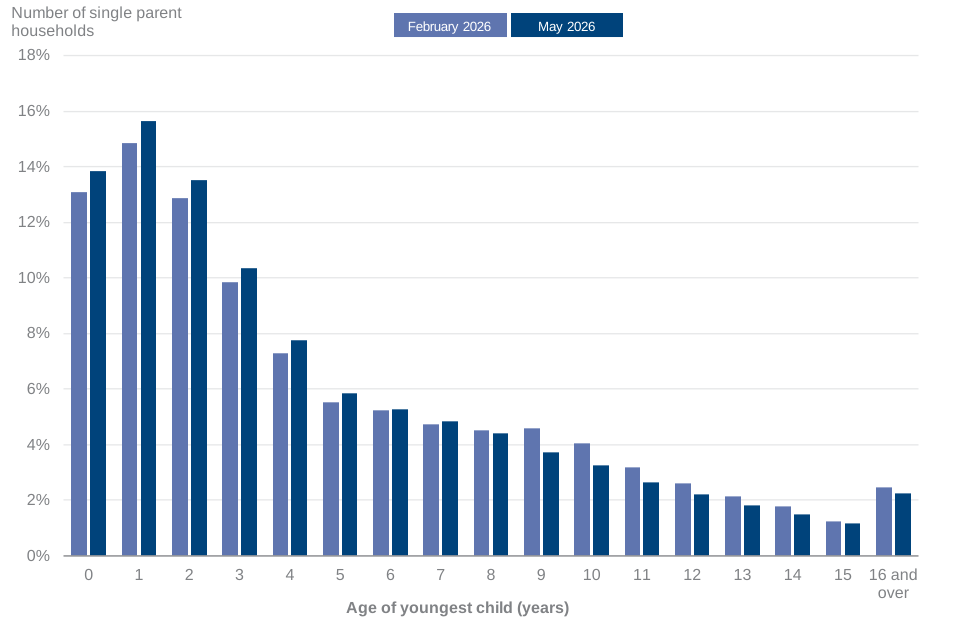
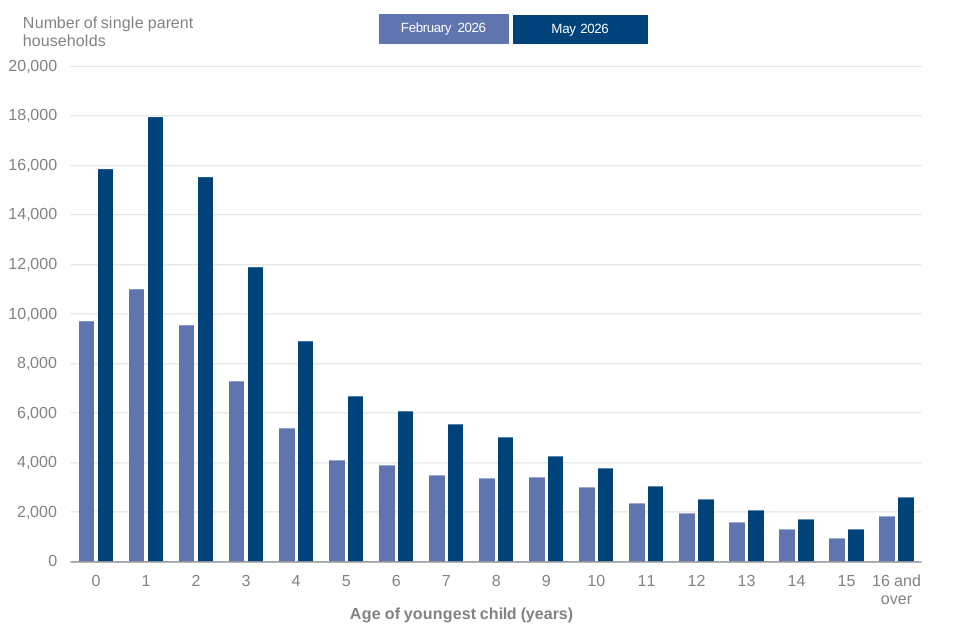
Over half of all single-parent households capped on UC have a youngest child under the age of 5 at May 2026
Figure 9: Proportion of capped UC single parent households by age of youngest child at February 2026 and May 2026
Source: DWP Universal Credit Quarterly Statistics
Figure 10: Number of capped UC single parent households by age of youngest child at February 2026 and May 2026
Source: DWP Universal Credit Quarterly Statistics.
Figures 9 and 10 show numbers and proportions of single-parent UC capped households, 70,000 (61%) have at least one child aged under 5 years at May 2026. This is an increase from 43,000 (58%) in February 2026. In the same month there were 34,000 (29%) of single-parent UC capped households having a child aged under 2 years, up from 21,000 (28%) in February 2026.
The two-child limit policy applied to households with the third or subsequent child born between 6 April 2017 and 5 April 2026. Therefore most households with the youngest child aged 9 or under would receive higher payments for children through UC following the removal of the two-child limit policy. In some instances these additional payments may increase their eligible benefit payments for the Benefit Cap to more than the Benefit Cap level applying in their area for couples and lone parents. Households with the youngest child aged over 9 would not receive higher UC payments as a result of the removal of the two-child limit policy. However, the statistics do not identify the extent to which this policy may have contributed to the change observed.
Regional UC capped households
Figure 11: Proportion of UC households capped at Region and devolved administration level at May 2026
| Region | Percentage of UC households benefit capped |
|---|---|
| London | 4.3% |
| South East | 3.0% |
| East of England | 2.6% |
| West Midlands | 2.4% |
| South West | 1.8% |
| East Midlands | 1.7% |
| Yorkshire and The Humber | 1.7% |
| North West | 1.6% |
| Wales | 1.4% |
| North East | 1.2% |
| Scotland | 1.0% |
The proportion of capped households claiming UC at May 2026 was 2.3%, compared with 1.5% as at February 2026. The London region continues to have the highest proportion of UC households affected by the benefit cap, with 4.3% capped at May 2026, compared with 3.3% at February 2026.
At May 2026 Scotland remains the region with the lowest proportion of UC households capped at 1.0%
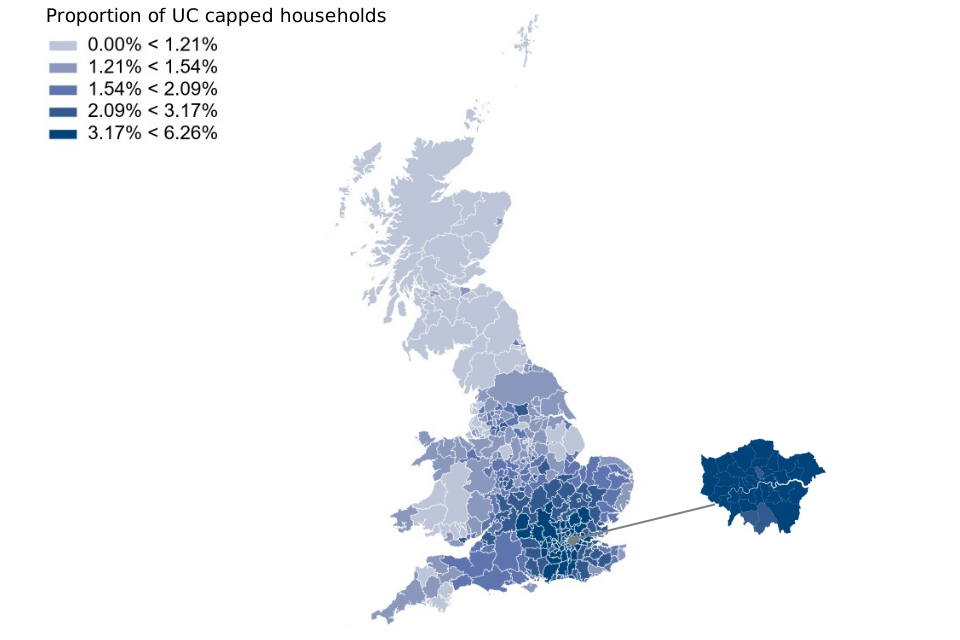
The proportion of UC claiming households that are capped is greatest in London and the South East local authorities
Figure 12: Proportion of UC households capped at Local Authority level at May 2026
Source: DWP Universal Credit Quarterly Statistics and Benefit Cap UC point in time caseload statistics. Stat-Xplore
Figure 12 is a map of Great Britain that shows of the 10 Local Authorities (LAs) with the highest proportion of UC households having their benefits capped at May 2026; 4 of them are in the London region, 4 are in the South East region and 2 are in the East of England region.
Local authorities with highest proportion of capped UC households
| Local Authority | Region | Proportion of UC households capped |
|---|---|---|
| Harrow | London | 6.3% |
| Ealing | London | 5.9% |
| Watford | East of England | 5.7% |
| Slough | South East | 5.7% |
| Enfield | London | 5.7% |
| Reading | South East | 5.6% |
| Barnet | London | 5.6% |
| Hertsmere | East of England | 5.6% |
| Spelthorne | South East | 5.5% |
| Elmbridge | South East | 5.5% |
Figure 13: Percentage of capped households by family type and region
Source: DWP Universal Credit Quarterly Statistics. Stat-Xplore
There are notable regional variations in capped households by family type. In particular, London has a much higher percentage of single person capped households without children (44%) than any of other region. There are 5% or less of capped households that are single without children in regions outside of London, South East, East of England and South West.
For all regions outside of London except for the South East the percentage of capped households with children in the region is around 80%, and closer to 70% in the South East.
5. The financial impact of being capped
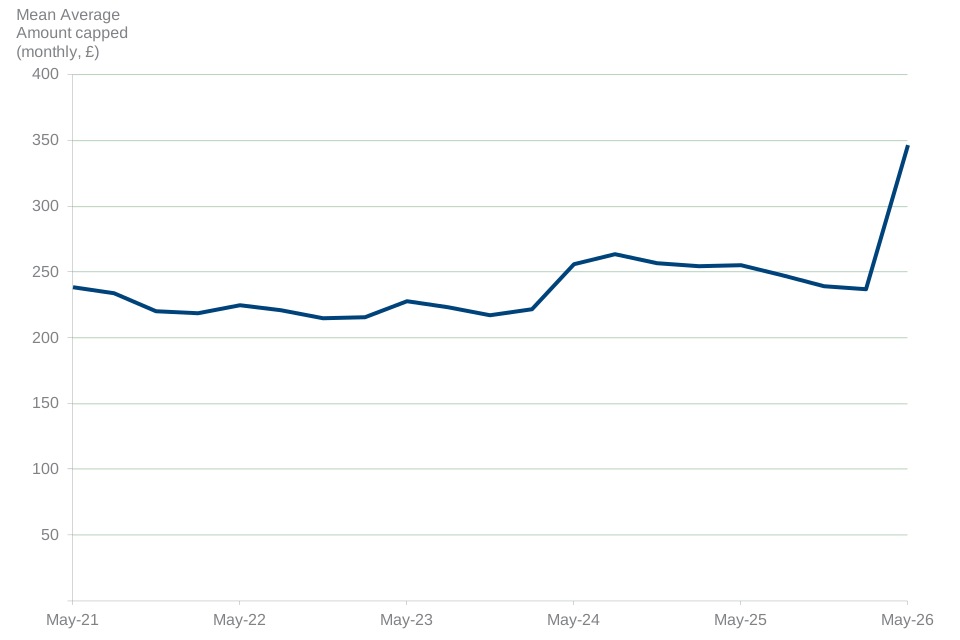
Average monthly amount capped for UC is £110 higher in May 2026 compared with February 2026
Figure 14: Average assessment period (monthly) capped amount for UC households from May 2021 to May 2026
Source: Benefit Cap UC point in time Statistics, Stat-Xplore
Note: This graph is plotted using quarterly point in time figures.
Figure 14 shows the monthly average (mean) amount that UC households are capped by is £346 at May 2026. This compares with a monthly average of £237 at February 2026 and £255 at May 2025.
This increase should be seen in the context of annual uprating in benefit, the removal of the two-child limit and ‘rebalancing’ of UC in April 2026. Benefit cap levels were unchanged. However, the statistics do not identify the extent to which these policies may have contributed to the change observed. See Background and Information Methodology for more information.
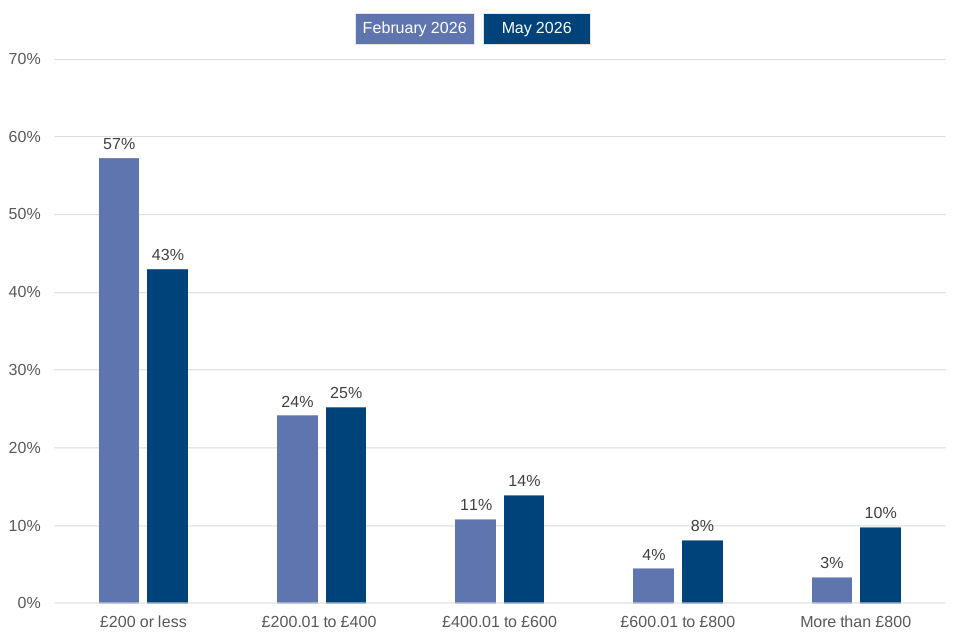
Figure 15: Proportion of UC capped households by cap amount, Great Britain, February and May 2026
Source: Benefit Cap UC point in time Statistics, Stat-Xplore
The number and percentage of capped households by band for the monthly assessment period for May 2026 are:
- 43% (70,000) of households that had their UC capped were capped by £200 or less for the assessment period, a fall from 57% (64,000) households in February 2026
- 25% (41,000) were capped by £200.01 to £400 for the assessment period, an increase from 24% (27,000) households in February 2026
- 14% (23,000) were capped by £400.01 to £600 for the assessment period, an increase from 11% (12,000) households in February 2026
- 8% (13,000) were capped by £600.01 to £800 for the assessment period, an increase from 4% (4,900) households in February 2026
- 10% (16,000) were capped by more than £800 for the assessment period, including 2% (3,400) capped by more than £1,300 for the assessment period, an increase from 3% (3,700) and 1% (570) respectively
6. About these statistics
Release schedule
The statistics are published quarterly in March, June, September, and December and are sourced from data originally collected via administrative systems. The dates for forthcoming releases are announced on the GOV.UK Statistics and Research release calendar.
Status of these statistics
These are official statistics. Our statistical practice is regulated by the Office for Statistics Regulation (OSR). OSR sets the standards of trustworthiness, quality and value in the Code of Practice for Statistics that all producers of official statistics should adhere to. You are welcome to contact us directly with any comments about how we meet these standards by emailing the statistical production team. Alternatively, you can contact OSR by emailing regulation@statistics.gov.uk or through the OSR website.
Rounding
Volumes and amounts have been rounded as detailed below. Sometimes figures are rounded differently where comparisons between figures are made based on different rounding precisions, or where the rounding of figures could potentially give a misleading picture of the statistics and trends. For more information, please see the Background Information and Methodology document.
Percentages are calculated using numbers prior to rounding and rounded to the nearest whole percentage point.
| Range | Rounded to the nearest |
|---|---|
| 0 to 1,000 | 10 |
| 1,001 to 10,000 | 100 |
| 10,001 to 100,000 | 1,000 |
| 100,001 to 1,000,000 | 10,000 |
| 1,000,001 to 10,000,000 | 100,000 |
| 10,000,001 to 100,000,000 | 1,000,000 |
Data sources
Data for UC is sourced from the administrative system called Universal Credit Full Service (UCFS). Before April 2019, Universal Credit was administered on UCFS and a separate system called Live Service. It is not possible to obtain benefit capped data from the Live Service system and the data before April 2019 is only for UC households administered on UCFS.
Note: UC statistics throughout this release refer to data from Universal Credit Full Service (UCFS) only. This is especially important to remember when looking at time series data.
Figures relating to households with their UC capped are subject to retrospection and may be revised for a 2 year period. For more information, see the Background Information and Methodology document.
The proportion capped figures have been calculated using working age HB and UC household figures obtained from Stat-Xplore. The total number of HB and UC capped households have been divided by the total number of working age households on HB and UC respectively to obtain these figures.
Where to find out more
Use Stat-Xplore to create your own tables and further breakdowns of these statistics.
Understand background Information and methodology about these statistics.
See older releases of these statistics.
Read more information on the benefit cap.
Related statistics
7. Contact details
We welcome feedback and suggestions for improvements.
For any queries or feedback on these statistics, please contact us at the email below. We are unable to assist with non-statistical queries.
Email: cbm.stats@dwp.gov.uk
Press enquiries should be directed to the DWP Press Office
ISBN: 978-1-80786-037-0