Whole of Government Accounts 2024-25
Updated 18 September 2026

© Crown copyright 2026
This publication is licensed under the terms of the Open Government Licence v3.0 except where otherwise stated. To view this licence, visit nationalarchives.gov.uk/doc/open-government-licence/version/3 or write to the Information Policy Team, The National Archives, Kew, London TW9 4DU, or email: psi@nationalarchives.gov.uk.
Where we have identified any third party copyright information you will need to obtain permission from the copyright holders concerned.
This publication is available at https://www.gov.uk/government/publications/whole-of-government-accounts-2024-25/whole-of-government-accounts-2024-25
1. Foreword from Accounting Officer
I am pleased to present the 2024-25 Whole of Government Accounts (WGA). This is the final year of the WGA recovery plan, and my fifth WGA as Accounting Officer.
This year’s WGA marks an important step forward in improving the accessibility, transparency, and usability of the WGA. We have introduced a refreshed structure and design, with clearer signposting, enhanced visual presentation and a more concise narrative. These changes are intended to make the accounts easier to navigate and to better support users in understanding the public sector’s financial position. The analytic content of the Performance Report has been strengthened with greater emphasis on explaining the drivers of key balances, trends over time, and fiscal risks.
Significant challenges continue to affect the completeness and reliability of the data underlying the WGA. The WGA has received a disclaimed audit opinion from the Comptroller and Auditor General for a third consecutive year, reflecting systemic issues within the local audit market and delays in audited accounts. This disclaimer arises from both local authority data that is missing from the WGA, and data that is not backed up by an underlying statutory audit opinion.
Although there has been a sharp reduction in missing data in 2024-25, the level of unaudited submissions continues to grow, particularly within English local government. This growth was within expectations as actions taken by HMT and MHCLG gained traction. The use of such data reflects the priority to maximise transparency while wider audit system reforms are implemented. Addressing these systemic issues is critical to restoring full audit assurance to WGA. The government’s local audit reform programme, including the introduction of statutory backstop dates, is intended to support recovery.
In response, we have further enhanced our disclosures in this year’s WGA. There is now more detailed and transparent analysis of missing and unaudited data, including clearer quantification of the scale of non-submission and the potential impact on the financial statements.
Despite these challenges, WGA continues to provide important insights into the scale of the public sector balance sheet, including the long-term liabilities arising from pensions, clinical negligence and nuclear decommissioning. It remains an essential tool for understanding fiscal sustainability and managing risks over the long term.
Looking ahead, we are committed to continuing to improve WGA. Our priorities include, improving the completeness and quality of data, making further timeliness improvements, and further enhancing the clarity and relevance of the report for users. We will continue to work closely with departments, local government, the NAO and other stakeholders to deliver these improvements.
As Co-Head of the Government Finance Function, I would like to thank finance professionals across the public sector who have contributed to this year’s accounts and to the continued improvement of WGA.
Conrad Smewing
Accounting Officer
Whole of Government Accounts
June 2026
2. Introduction to Whole of Government Accounts
The Whole of Government Accounts (WGA) provides a consolidated view of the public sector financial position and performance. It is prepared by HM Treasury under the Government Resources and Accounts Act (GRAA) 2000 and in line with International Financial Reporting Standards (IFRS, as adapted for the public sector), and is independently audited by the National Audit Office (NAO).
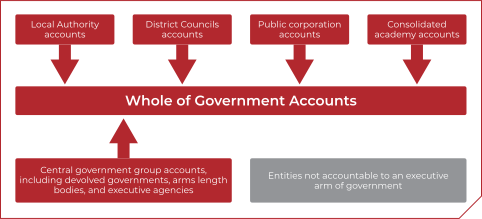
The WGA is a globally unique publication which has put the UK at the forefront of government reporting since financial year 2009-10. It brings together the results of over 10,000 public bodies including central government departments, the NHS, local authorities, devolved governments, academies and public corporations into a single set of accounts.
An introduction to WGA from Andrew Cartner, Director of Public Spending at HM Treasury and Deputy Head of the Government Finance Function (GFF)
2.1 What is WGA For?
The primary purpose of the WGA is to provide a comprehensive picture of the UK’s public sector finances supporting government transparency. It provides a single, audited set of financial statements that bring together the scale of public sector activity and the main drivers of the government’s financial position and financial performance for the year. The primary user of the WGA is UK Parliament, who scrutinise the accounts in a yearly hearing held by the Public Accounts Committee (PAC).
For the purposes of parliamentary scrutiny, the WGA supports an understanding of headline income and expenditure totals, and longer-term consequences of government policy decisions. By presenting information on assets and liabilities, the WGA enables consideration of sustainability, value for money and the risks that may affect future public finances.
WGA is also used by a wider set of external stakeholders, including analysts, academics, and the public, who want a comprehensive view of the government’s finances. It also complements other fiscal and economic statistical publications.
As with any set of accounts, WGA has limitations. Some significant long-term commitments and resources are not recognised in the financial statements under the applicable accounting framework, including the state pension liability and the government’s ability to raise future tax revenues. WGA should therefore be read as an important, but not exhaustive, source for understanding the government’s financial position, performance and exposure to risk, to be used in conjunction with other public information.
2.2 How is WGA Prepared?
The entities consolidated into WGA prepare their own annual financial statements and lay them in parliament or submit to relevant accountability institutions. The financial data they use to do so is then submitted to HMT, where assurance exercises are completed to ensure reliability of the data which has arrived.
The consolidated dataset is then adjusted to remove internal transactions and align accounting frameworks. This is completed within a recognised and agreed accounting framework, independent from political influence or management bias. The adjusted dataset is then used to prepare a consolidated set of accounts which provides high-level transparency on public sector financial trends.
Published alongside the financial statements, which are prepared in line with IFRS, is the performance report. This section provides strategic analysis of trends and risks that WGA presents and is less restricted by accounting standards, allowing HMT to include commentary which enhances readers’ understanding of public sector finances.
This year marks the final stage of the five-year WGA recovery plan, with all milestones delivered on time and the timeline successfully returning to a stable publication cycle. This is also the earliest publication since 2017-18, representing a clear step change in timeliness and a strong demonstration of delivery against our recovery plan.
2.3 2024-25 at a Glance
Restoring Local Government Accountability: £69 billion settlement agreed for restoration of local government financial stability, with a 6.8% cash increase in 2024-25. Increased funding and foundation of the Local Audit Authority is action taken by the public sector to build back assurance capacity in local government and place local authorities on sound financial footing.
Source: MHCLG annual report and accounts 2024-25
Investment in Young People: an additional £240 million pledged for supporting young people not in education or employment (NEET) and support a resilient labour market.
Source: HM Treasury annual report and accounts 2024-25
Support for the NHS: £187 billion spent towards delivering NHS England in 2024-25, supporting a health service fit for the future.
Source: DHSC annual report and accounts 2024-25
Tackling Homelessness: £800 million allocated in year for supporting those experiencing homelessness. Alongside a legislative programme to end no fault eviction.
Source: HM Treasury annual report and accounts 2024-25
Strengthening flood resilience: £2.7 billion committed over 2 years to building, maintaining and repairing UK flood defences. These measures are expected to provide better protection for 52,000 homes, with over 27,000 homes better protected in 2024-25.
Source: DEFRA annual report and accounts 2024-25
Getting a good deal for taxpayer: £33 billion spent by the Crown Commercial Service. These gross-government procurement experts maximise every pound of taxpayer resource and make sure spend is directed to where it’s needed most.
Source: Cabinet Office annual report and accounts 2024-25
Investing in workplaces: £227 million invested by the Government Property Agency in making public sector workplaces more effective and productive.
Source: Cabinet Office annual report and accounts 2024-25
National Wealth Fund commitments: £2.3 billion committed across 19 investments made by the NWF, creating or supporting 18,500 jobs
Source: National Wealth Fund annual report and accounts 2024-25
Reducing energy bills: £880 million spent on delivering affordable energy
Source: DESNZ annual report and accounts 2024-25
2.4 5 Years of WGA on a Page
The WGA presents the public sector’s income, expenditure, assets and liabilities for each financial year.
| £ Billion | 2020-21 | 2021-22 | 2022-23 | 2023-24 | 2024-25 | 5-Year Variance |
|---|---|---|---|---|---|---|
| Income | (731.5) | (881.6) | (974.5) | (1,019.9) | (1,082.4) | (350.9) |
| Expenditure | 1,135.9 | 1,241.2 | 959.9 | 1,166.5 | 1,290.1 | 154.2 |
| Assets | 2,206.7 | 2,414.3 | 2,554.3 | 2,651.3 | 2,785.4 | 578.7 |
| Liabilities | (5,533.0) | (6,289.2) | (4,943.4) | (5,024.5) | (5,331.9) | 201.1 |
| Net Expenditure | 404.4 | 359.6 | (14.6) | 146.8 | 207.7 | (196.7) |
| Net Liabilities | (3,326.3) | (3,874.9) | (2,389.1) | (2,373.2) | (2,546.5) | 779.8 |
| Gross Domestic Product, Nominal and Non-Seasonally Adjusted | 2,110 | 2,400 | 2,634 | 2,790 | 2,935 |
| As % of GDP | 2020-21 | 2021-22 | 2022-23 | 2023-24 | 2024-25 | 5-Year Variance |
|---|---|---|---|---|---|---|
| Income | (35)% | (37)% | (37)% | (37)% | (37)% | (2)% |
| Expenditure | 54% | 52% | 36% | 42% | 44% | (10)% |
| Assets | 105% | 101% | 97% | 95% | 95% | (10)% |
| Liabilities | (262)% | (262)% | (188)% | (180)% | (182)% | 80% |
| Net Expenditure | 19% | 15% | (1)% | 5% | 7% | (12)% |
| Net Liabilities | (157)% | (161)% | (91)% | (85)% | (87)% | 71% |
In 2024-25, total public sector income increased to £1,082 billion, up from £1,020 billion in the previous year. This growth was driven primarily by higher taxation receipts, which reached £927 billion, reflecting nominal economic growth and fiscal policy measures. Despite this increase, income remained relatively stable as a share of the economy at around 37% of GDP (nominal, non-seasonal),[footnote 1] indicating a broadly consistent revenue stream relative to the size of the UK economy.
Total expenditure increased to £1,290.1 billion, compared with £1,166.5 billion in 2023-24. Spending pressures remained concentrated in core public service areas. Social security benefits (£334.3 billion) continued to represent the single largest area of expenditure, while staff costs (£260.1 billion) and procurement of goods and services (£309.0 billion) reflected ongoing demands across health, defence, education and local services. Financing costs increased to £66.7 billion, underlining the continued impact of elevated interest rates on government borrowing.
At 31 March 2025, the public sector reported total assets of £2,785.4 billion, an increase of £134.1 billion on the prior year. The asset base remains dominated by property, plant and equipment (PPE), which accounted for £1,660.4 billion. Financial assets, including loans, investments, cash and gold reserves, provide additional resilience and liquidity or shadow an historic policy choice. Total liabilities rose to £5,331.9 billion, up from £5,024.5 billion in 2023-24. The most significant components continue to be government borrowings at £2,298 billion and the net public sector pension liability at £1,396 billion, the latter reflecting the scale of longterm commitments to current and former public sector employees. Provisions for future obligations, including nuclear decommissioning and clinical negligence, amounted to £283 billion.
The Data Quality in WGA section outlines the 2024-25 position of missing and unaudited data.
3. Performance Report
3.1 Analysis of Financial Statements
15-Year Analysis of Financial Statements
The Statement of Revenue and Expenditure and the Statement of Financial Position have expanded over the last 15 years as inflation has increased taxation revenue, the cost of delivering services, and amounts owed to/from the public sector. In 2023-24 as part of the 15-year retrospective, all analysis was in a 15-year timeframe. HMT has since reverted to the standard approach, except for a standalone section incorporating 15-year analysis.
Different balances and transactions consolidated into WGA have unique characteristics which mean that no single measure of inflation (for example, CPI) is appropriate for bringing all historic figures into today’s money. The approach taken in this 15- year analysis is to report numbers in the ‘nominal’ terms they were initially reported in (allowing for restatements in comparatives), and to make comparisons to nominal Gross Domestic Product (GDP) in that year. Showing balances as a percentage of nominal GDP allows comparability across the period as the economy expands, while not preparing overly complex real-terms adjustments which would sever data traceability to past WGAs.
The only year in the 15-year scope of this analysis where annual nominal GDP did not increase was 2020-21, when it contracted by £153.4 billion. In every other year, there were nominal increases in GDP. In real terms the GDP trend will differ from the above, flattening the significant increase over the last 15 years to a more stable pattern.
Statement of Revenue and Expenditure (SORE)
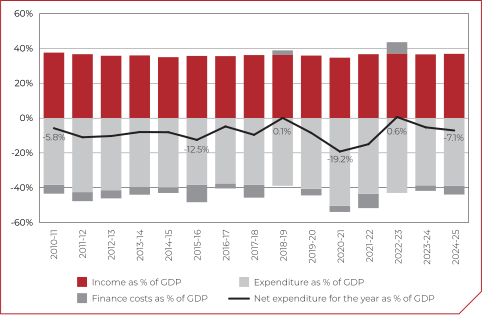
The SORE displays income, expenditure, and finance costs in the given year, including some revaluation gains/losses not recognised in the statement of other comprehensive income. Net expenditure as a percentage of GDP peaked in 2020-21 at 19.2%, after varying under 12.5% since 2010-11. Part of this peak in net expenditure was due to intentional policy responses to the Covid-19 pandemic, while part of it was due to upward revaluations of provisions in response to changing outlooks of inflation and cost of borrowing. Another influence was the contraction of GDP experienced that year. Reductions in cash spending in 2021-22 were offset by further losses on revaluation of provisions.
Figure 1: WGA Revenue, Expenditure and Finance Costs as % of GDP (Nominal, Non-Seasonally Adjusted)
Analysing cash and non-cash expenditure is another use of WGA figures. The WGA distinguishes between transactions that are expected to be cash-settled and those that reflect accounting transactions. Depreciation and amortisation recognise the consumption of assets over their useful life, and do not involve cash payments. Revaluations similarly remain non-cash until the relevant asset is disposed of. Excluding non-cash items from the SORE reveals a more stable pattern of performance over the 15-year period, reflecting strengthened financial control and adherence to fiscal frameworks.
Figure 2: Net Expenditure Before Non-Cash Charges (Net Expenditure Excl. Depreciation, Amortisation, Revaluations) as % of GDP (Nominal, Non-Seasonally Adjusted)
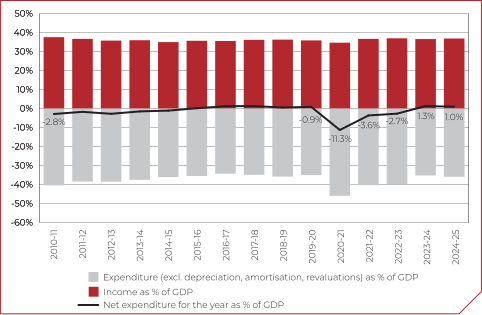
Net expenditure peaked in 2020-21 at 11.3% of GDP, reflecting the impact of policy responses to economic shocks, largely recognised in WGA as grants and subsidies. As these temporary measures were unwound, this metric returned to net income by 2023-24. Net expenditure before non-cash charges[footnote 2] frequently records small positive values, indicating modest net operating cash inflows. However, experience over the period demonstrates that this metric is sensitive to economic shocks and can readily turn negative during periods of economic strain.
Where net operating cash inflows have been generated, they have remained small in scale not exceeding 1.3% of GDP in any year over the 15-year period of WGA. These surpluses have been used to support investments in public services or to manage the size and profile of the government’s borrowing portfolio.
Economic circumstances in 2022-23 led to significant downward revaluations in long‑term liabilities, namely pensions, clinical negligence provisions and nuclear decommissioning provisions.[footnote 3] These revaluations led net expenditure to the lowest total since the inception of WGA at +0.6% of GDP. Changes to discount rate and inflation assumptions have since stabilised, and net expenditure as percentage of GDP was (7.1)% in 2024-25, below the 15-year average of (8.1)%.
Figure 3: Movement of Income as % of GDP (Nominal, Non-Seasonally Adjusted)
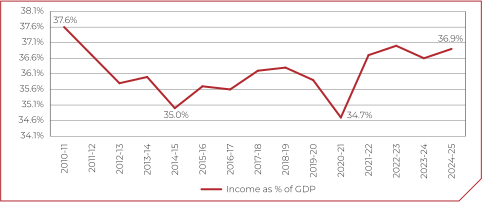
The 15-year average of WGA income as a percentage of GDP is 36.2%. Starting from a high of 37.6% in 2010-11, the trend unevenly declined through a series of tax policy changes, to a low in 2020-21 when GDP contraction that followed Covid-19 led to an outsized reduction in receipts that recovered in following years. WGA income as a percentage of GDP in 2024‑25 is 0.7% lower than the peak in 2010-11 at 36.9%. WGA revenue is not just taxation, though throughout the 15-years of this analysis, tax made up around 85.0% of total revenue, with a high point of 89.0% in 2020-21.
Figure 4: Movement of Expenditure as % of GDP (Nominal, Non-Seasonally Adjusted)
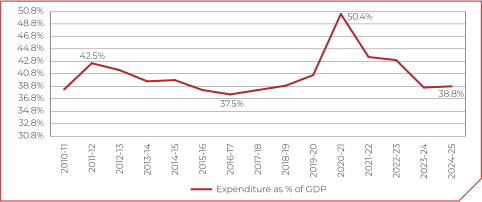
The 15-year expenditure trend broadly mirrored the income trend of early peak and gradual reduction until 2020-21, when policy responses to the Covid-19 pandemic resulted in higher cash expenditure in the form of household and business support. The contraction of revenues in the same year meant that these expenditures were funded by issuance of new government borrowings. Expenditure in 2024-25 returned to below the 15-year average of expenditure as a percentage of GDP of 40.6% (39.9% when excluding 2020-21).
Figure 5: Movement of Interest Cost on Government Borrowings as % of GDP (Nominal, Non-Seasonlly Adjusted)
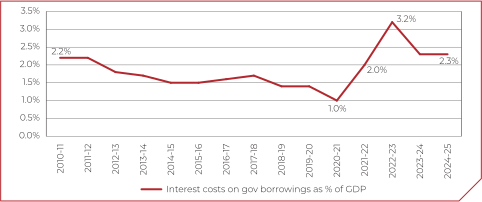
The cost of government borrowings, mainly payments relating to gilts or treasury bills, showed a similar trend to the overall expenditure pattern of a large spike and then convergence to a broadly average position in 2024-25. The spike in borrowing costs came in 2022-23 following market reactions to rising inflation. The 15-year average including 2022-23 is 1.8% and excluding 2022-23 is 1.7%, and interest payments remained elevated above the averages in 2024-25 at 2.3%. Analysis of the volume of government borrowing can be found in 15-year analysis of the Statement of Financial Position. Part of the affordability of the government debt portfolio is how much is spent on servicing the debt as a proportion of total expenditure, as interest payments on debt reduce funds available to fund other public services.
Figure 6: Interest Costs as a % of Total Expenditure
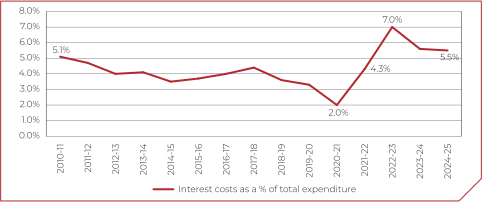
Interest payments on government borrowings as a percentage of WGA expenditure unevenly declined over the first 10 years of the analysis, reaching a low of 2.0% in 2020‑21. It followed a similar trend to the GDP proportional analysis, spiking in 2022-23 at 7.0% and remaining at a historically high level in 2024-25. Including the spike of 2022-23, the 15-year average is 4.3%, and excluding 2022-23 is 4.1%.
Statement of Financial Position
The Statement of Financial Position (SOFP) is the summary of assets and liabilities held by the public sector. It includes liquid and illiquid assets, which range from cash and short-term investments to long-term investments such as infrastructure assets, including the road and rail networks, for which there is no active market. Financial assets like student loans and equity investments are also consolidated. Liabilities range from the government borrowing portfolio and public sector pensions to short term payables arising in the course of day-to-day government business. Less visible liabilities like bank deposits held by the Bank of England are also consolidated into WGA, significantly impacting the net liability position.
Figure 7: Total Assets and Liabilities as % of GDP (Nominal, Non-Seasonally Adjusted)
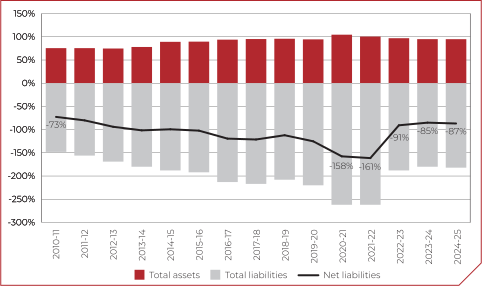
Net liabilities as a percentage of GDP in each year have gradually risen over the last 15 years until 2021-22, when they peaked at 161.4%. In 2022-23, primarily reflecting downward revaluations of liabilities driven by changes in discount rates, net liabilities fell sharply to 90.7% of GDP, and have remained broadly stable since, closing at 86.8% in 2024-25.
Asset values have proven less volatile over the last 15 years, which is consistent with the composition of public sector balance sheet, where the majority of non-current assets comprise of infrastructure assets that do not significantly fluctuate in valuation. By 2024‑25, total assets had increased to 94.9% of GDP, averaging about 90.3% over the period.
A significant driver of the increase in liabilities between 2010-11 and 2021-22 was growth in public sector pensions. Pension valuations are highly sensitive to changes in the discount rate applied to future cash. The methodology and impact of discounting on pension liabilities is discussed in detail in Note 25 and Discount Rate Sensitive Liabilities section of the performance report.
Figure 8: Public Sector Pensions as % of GDP (Nominal, Non-Seasonally Adjusted) and Applicable Perpetuity Discount Rate
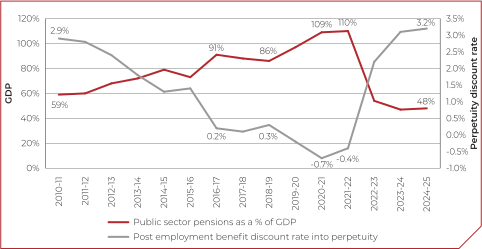
The chart above demonstrates the inverse relationship between the unfunded pensions liability and the discount rate applicable to future cash flows. The discount rates applicable gradually declined over the first 10 years of the period, resulting in an increase in the valuation of pension liabilities as a percentage of GDP. In 2019-20, effective discount rates became negative, as inflation expectations exceeded the discount rates set by HM Treasury, leading to a further increase in the reported liability.
In 2022-23, discount rates returned to being positive, resulting in significant downward revaluations of future pension obligations. In 2022-23, pensions liabilities fell by £1.2 trillion. Importantly, these valuation movements do not affect the cash amounts ultimately paid to settle pension obligations but instead reflect changes to the measurement of long-term liabilities.
By contrast, government borrowing is less sensitive to discount rate changes, reflecting a smoother trend over the 15-year period.
Figure 9: Government Borrowing as a % of GDP (Nominal, Non-Seasonally Adjusted)
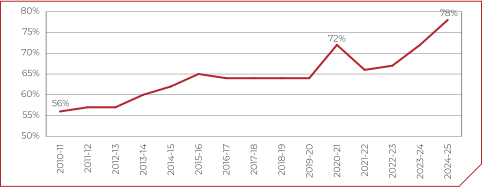
Government borrowing is the stock of gilts, treasury bills and National Savings & Investments (NS&I) products issued by the public sector to raise financing. This percentage measure will be lower than other published debt metrics as a percentage of GDP as there are elements of the government debt portfolio which are eliminated on consolidation of WGA; primarily amounts owed from the National Loans Fund to the Bank of England (held in the BoE asset purchase facility) which totalled £477.7 billion as of 28 February 2025. The elimination of this amount significantly reduces headline government borrowings in WGA.
Government borrowings as a percentage of GDP spiked in 2020-21, mostly driven by a decrease in nominal GDP in that year. In 2020-21, government borrowing increased by 5.2% or £74.9 billion. While an increased issuance of Gilts contributed to this rise, the reduction in nominal GDP amplified the impact when expressed as a proportion of GDP, reinforcing the spike in the chart above.
| Government Borrowings (£ Billion) | 2018-19 | 2019-20 | 2020-21 | 2021-22 |
|---|---|---|---|---|
| Current | 307.2 | 344.7 | 274.0 | 340.0 |
| Non-Current | 1,100.0 | 1,100.7 | 1,246.3 | 1,235.7 |
| Total | 1,407.2 | 1,445.4 | 1,520.3 | 1,575.7 |
| Year on Year Change (£ Billion) | 38.2 | 74.9 | 55.4 | |
| Year on Year Change (%) | 2.7% | 5.2% | 3.6% |
The next largest liability is deposits held by banks at the Bank of England. These are categorised on the Statement of Financial Position (SOFP) within ‘other financial liabilities’, and in 2024-25 had dropped to 21.9% of GDP at £644.2 billion. These deposits are repayable to their owners on demand and are recognised as a current liability of the public sector. They are held primarily to facilitate settlement between banks and other financial institutions, as well as other monetary policy purposes. More detail can be found in Bank of England’s Annual Report.[footnote 4]
The next most significant batch of liabilities on the SOFP is the provisions portfolio. Provisions are liabilities recognised where there is likely constructive obligation to make payments, but there is uncertainty as to the amounts and timing.
Figure 10: Provisions as a % of GDP (Nominal, Non-Seasonally Adjusted)
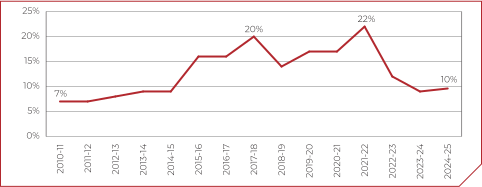
Provisions are made of a variety of expected costs which are uncertain in nature, but sufficiently likely to be recognised on the balance sheet. Provisions can crystallise or be extinguished depending on future events. The provisions trend as a percentage of GDP peaked in 2017-18 and 2021-22, before dropping to 9.6% in 2024-25. Both peaks were due to upward revisions of nuclear decommissioning liabilities as a result of discount rate changes. The upward revision for nuclear decommissioning made up the majority of the 2017-18 peak, while clinical negligence contributed more, though still a minority, to the peak in 2021-22. This shift towards larger swings in clinical negligence reflect ongoing movement to periodical payment orders (PPOs) rather than lump sums. More on nuclear decommissioning and clinical negligence can be found in the Discount Rate Sensitive Liabilities section.
Income
Taxation Income
Taxation revenue makes up 85.6% of total income in the WGA. The majority of taxes are collected centrally by HMRC, though WGA does include local government and public corporations, which collect revenues raised through other taxes such as Non-Domestic Rates (NNDR) and industry levies.
| 2024-25 | 2023-24 | Variance | Variance | |
|---|---|---|---|---|
| £ Billion | £ Billion | £ Billion | % | |
| Income Tax | 309.4 | 286.2 | 23.2 | 8.1% |
| National Insurance Contributions (NIC) | 149.9 | 157.6 | (7.7) | (4.9)% |
| Value Added Tax (VAT) | 178.5 | 165.5 | 13.0 | 7.9% |
| Corporation Tax | 89.4 | 89.6 | (0.2) | (0.2)% |
| Hydrocarbon Oils Duty | 24.7 | 24.9 | (0.2) | (0.8)% |
| Excise Duty | 34.0 | 33.9 | 0.1 | 0.3% |
| Stamp Taxes (incl. SDLT, SDRT and ATED)[footnote 5] | 19.9 | 16.1 | 3.8 | 23.6% |
| Capital Gains Tax | 13.8 | 14.3 | (0.5) | (3.5)% |
| Other Taxes and Duties | 44.0 | 45.9 | (1.9) | (4.1)% |
| Central Government Taxation Revenue | 863.6 | 834.0 | 29.6 | 3.5% |
| Nominal Non-Seasonally Adjusted GDP During Year | 2,935.3 | 2,790.2 | ||
| Central Government Taxation Revenues as % of GDP | 29.4% | 29.9% |
In 2024-25, central government taxation revenues increased by £29.6 billion, a 3.5% increase on 2023-24. Large increases were collected in income tax, VAT, and stamp taxes, offset by a decrease in NIC. Staff numbers increased in 2024-25, which drove down NIC collection as an internal transaction to WGA. There were no significant changes to income tax rules in 2024-25, and the increase in receipts was due to fiscal drag.[footnote 6] Stamp taxes saw the most dramatic increase in percentage terms at 23.6%. This was due to increases in the Stamp Duty Land Tax (SDLT) surcharge for second residential homes, which was introduced halfway through the fiscal year.
Despite the headline increase, central government taxation revenues as a percentage of GDP in the year declined by 0.5%, demonstrating that taxation remains within historical expectation. There was no missing data impact to central government taxation income as it is all reported by HMRC Trust Statement.[footnote 7] Local Government collects council tax and NNDR. There is no central administration of council tax and it is therefore more exposed to missing data issues. As a result, council tax increases in 2024-25 explained by the return of many English local governments to the WGA accounting boundary. NNDR is partially centrally administered and is therefore less impacted by the return of missing data, leading to more modest increase in 2024-25.
| 2024-25 | 2023-24 | Variance | Variance | |
|---|---|---|---|---|
| £ Billion | £ Billion | £ Billion | % | |
| Council Tax | 35.9 | 28.5 | 7.4 | 26.0% |
| National Non-Domestic Rates (NNDR) | 27.0 | 26.3 | 0.7 | 2.7% |
| Local Government Taxation Revenue | 62.9 | 54.8 | 8.1 | 14.8% |
| Non-Seasonally Adjusted GDP During Year | 2,935.3 | 2,790.2 | ||
| Local Government Taxation Revenues as % of GDP | 2.1% | 2.0% |
Measuring and Managing the Tax Gap
The tax gap is the difference between the amount of tax that should, in theory, be paid to HMRC (‘theoretical tax liability’), and the amount that is actually paid. There are a variety of reasons why the tax which should be paid is not, from error to aggressive avoidance.
Failure to collect taxes due represents a revenue risk from a WGA perspective and how HMRC manages that risk through compliance activities is an important facet to WGA analysis of revenue.
| 2023-24 estimation of tax gap (% of total theoretical liabilities) | 5.3% |
| 2023-24 estimation of tax gap (£ billion) | £46.8 |
The tax gap is estimated using a range of analytical techniques that draw on both internal data collected by HMRC and externally published data. gaps statistics are published annually, but due to the long timeframes which generally accompany the compliance activities of HMRC, and the filing/payment deadlines (often being 9 months after the relevant year-end), they are usually published one year in arrears.
Figure 11: Tax Gap by Behaviours (% of Total Theoretical Tax Liabilities)
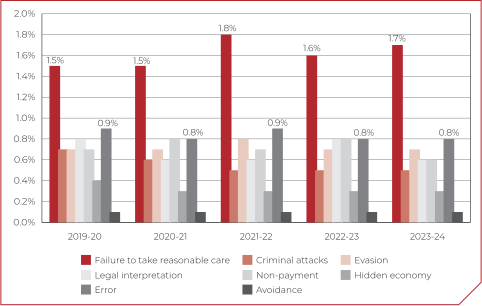
The largest behaviour leading to lost revenues to the exchequer is failure to take reasonable care when calculating tax liabilities. As the UK tax system generally relies on self-assessment, this is an inherent issue which requires active policing by HMRC. The estimate of lack of reasonable care losses peaked in 2021-22 at 1.8% of the total theoretical tax liability and the most recent estimate (for 2023-24) sits just below at 1.7%. The next most significant behaviour leading to losses was error, hovering around 0.8%.
Figure 12: Tax Gap by Customer Group (% of Total Theoretical Tax Liabilities)
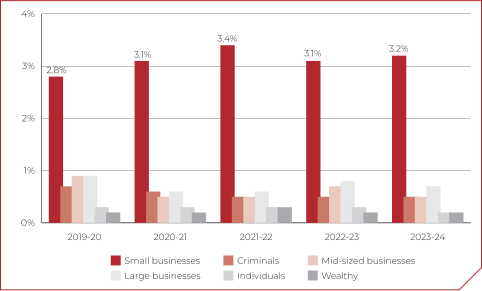
The most prevalent customer type contributing to the tax gap was small business, ranging from 2.8% to 3.4% over the last 5 years of available data. The peak for the small business tax gap was in 2021-22.
Figure 13: Tax Gap by Type of Tax (£ Billion)
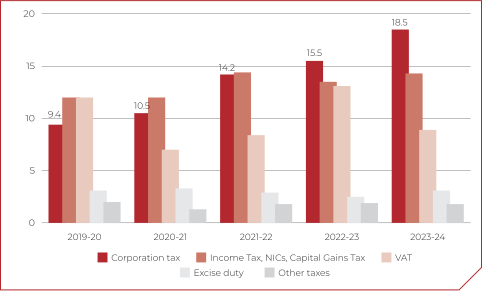
The type of tax contributing to the tax gap has undergone changes over the most recent 5 years of available data. Corporation tax gap in 2019-20 was the third largest contributor to the tax gap after VAT and personal tax (income tax, NIC and CGT in aggregate). It became the dominant type of tax 2022-23 and widened the lead in 2023‑24, when tax gap in corporations was estimated to be £18.5 billion.
The observed increase in non-compliance is likely to reflect a combination of genuine increases in non-compliance and better detection of non-compliance as a result of improvements to ways of analysing the Corporation Tax gap.
Figure 14: Compliance Yield (£ Billion, Excl. Accelerated Payments)
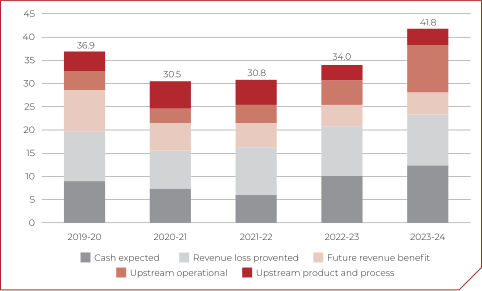
The benefit generated by HMRC compliance activities for each relevant tax year is also measured. This data relies less on estimation and can be robustly estimated by HMRC as amounts are more directly quantifiable, being directly tied to individual compliance cases. More detail on the tax gap and HMRC compliance activities can be found in tax gap statistics publications[footnote 8] and HMRC Annual Report and Accounts 2024-25.[footnote 9]
HMRC is tackling the tax gap by investing in people, technology and using preventative strategies to stop non-compliance from happening in the first place. The government has announced a series of measures to deliver £10 billion of additional tax revenue, per year, by 2030.
HMRC will do this by:
- preventing non-compliance before it happens through simplified policies, clearer guidance and user-friendly digital tools.
- upgrading IT and data systems to deliver digital nudges, pre-populate tax returns and better identify risks.
- recruiting and training an additional 5,500 compliance caseworkers over the next five years alongside lawyers, analysts, and policy experts.
- focusing on high-risk areas, such as offshore tax evasion, complex arrangements by large businesses and small businesses non-compliance.
- implementing Making Tax Digital (MTD) which will help businesses get their tax right the first time.
These efforts aim to provide long-term solutions that address the root causes of non-compliance.
Devolved Analysis of WGA Income
The majority of taxation revenue is payable directly to HMRC. However, council taxes, business rates and other fees for local services are recognised in local authority accounts. Equally, devolved governments recognise a variety of revenues in their own accounts which are not received from or remitted to UK Government. The tables below show the breakdown of total revenue recognised in WGA, split by the location of the entity which recognised them (subject to the usual adjustments actioned in preparation of WGA).
| Revenue (£ Billion) | 2024-25 | 2023-24 |
|---|---|---|
| England | 90.6 | 59.5 |
| Northern Ireland | 35.9 | 33.3 |
| Scotland | 75.3 | 76.7 |
| UK* | 844.7 | 816.8 |
| Wales | 35.9 | 33.6 |
| 1,082.4 | 1,019.9 |
| Revenue (% of total) | 2024-25 | 2023-24 |
|---|---|---|
| England | 8.4% | 5.8% |
| Northern Ireland | 3.3% | 3.3% |
| Scotland | 7.0% | 7.5% |
| UK* | 78.0% | 80.1% |
| Wales | 3.3% | 3.3% |
| 100.0% | 100.0% |
*UK central government refers to government activity that is planned, funded and accountable on a UK‑wide basis and therefore cannot be allocated to a specific nation
England local government percentage of total revenue increased from 5.8% to 8.4%, while Scotland’s dropped from 7.5% to 7.0%. This is in line with expectations considering the movements in missing data in 2024-25. Missing data was mostly neutral in Northern Ireland and Wales, which is reflected in the stability of the proportions.
Caution should be exercised when interpreting these figures, as income is highly impacted by intra-group eliminations in preparation of WGA. Notably, the block grants[footnote 10] are not included in the above figures as they are eliminated as an internal transaction. Taxes are only partially devolved and mostly collected centrally by HMRC, meaning that UK figures in the tables above are larger than if the collection of taxes was devolved. In this case, the UK would be more spread amount the individual nations.
Expenditure
Overview of Public Sector Expenditure
Public sector expenditure increased in 2024-25. This reflected a combination of higher service related spending, changes in workforce and input costs and higher financing related costs. The growth was concentrated in three structurally significant areas rather than being spread evenly across expenditure.
First, demand‑based expenditure, where spending responds to eligibility rather than fixed budgets, continued to increase, particularly in social security. Expenditure in these areas is sensitive to labour market conditions, demographic change and uprating mechanisms, meaning that spending volumes adjust automatically in response to economic and social factors. For example, expenditure on Jobseeker’s Allowance is linked to labour market conditions, while Universal Credit is primarily linked to claimant numbers. As a result, changes in eligibility and claimant volumes can have a material effect on overall expenditure and on movements reported in the WGA.
Second, service delivery costs increased, reflecting changes in pay, staffing and other input costs associated with delivering public services. These costs are linked to workforce capacity and operating models across government and may increase where additional staffing or resources are used to maintain service activity, including agency staff.
Third, higher financing‑related costs contributed to higher expenditure, reflecting the impact of inflation and interest rates on debt servicing costs and the valuation of long‑term liabilities. Expenditure in this area is highly sensitive to macroeconomic conditions, with changes in interest rates and inflation having a direct effect on reported costs from one year to the next.
These financing‑related movements are driven primarily by economic conditions, rather than by changes in public service activity. As a result, changes in government borrowing and long‑term liabilities can contribute to movements in reported expenditure through their impact on debt servicing costs and liability valuations.
Taken together, these factors show that expenditure growth in 2024-25 was concentrated in a small number of expenditure categories. Movements in these areas therefore had a proportionately greater effect on the overall expenditure position reported in the WGA.
Performance by Category
As discussed in the overview, growth in 2024-25 was driven by a small number of large and structurally significant factors, reflecting demand‑based pressures, public service delivery, and the impact of wider economic conditions. In this section we will explore individual components of expenditure.
Figure 15: Public Sector Expenditure (£ Billion)
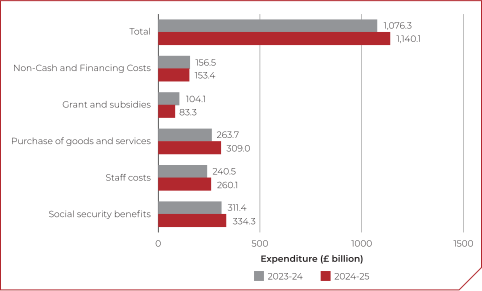
Social security benefits remained the largest area of expenditure and a principal driver of growth during the year, increasing by £22.9 billion in 2024-25. Increases were driven by underlying demographic trends, with population ageing shifting a greater proportion of the workforce into retirement, alongside statutory uprating under existing policy commitments, including the operation of the triple lock for the state pension.[footnote 11] Together, these factors reinforced social security as a key source of medium‑ and long‑term fiscal pressure, with expenditure responding automatically to demographic change and uprating mechanisms rather than discretionary in‑year decisions.
Expenditure on staff costs and other service delivery inputs rose during the year, the former increasing by £19.6 billion in 2024-25, reflecting pay settlements, and higher costs associated with delivering public services. Spending on goods and services also increased across several major service areas, particularly health and social care, as departments faced higher input prices and greater reliance on externally sourced capacity to maintain service levels.
Interest and other financing‑related costs also increased, with interest costs rising by £3.3 billion in 2024-25, reflecting higher interest rates and the exposure of government borrowing to changes in market conditions. As set out in the expenditure overview, movements in this category were driven by macroeconomic factors rather than changes in service provision, reinforcing the sensitivity of reported expenditure to inflation and interest rates.
Taken together, movements across these categories account for the majority of expenditure growth in 2024-25 and provide the context for the net expenditure position set out in the following section.
Expenditure by Sector
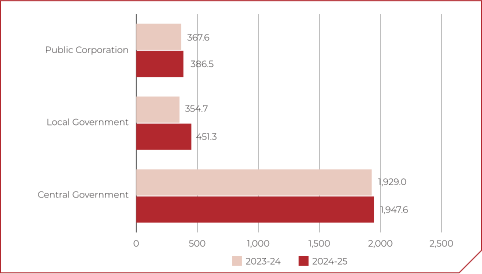
Expenditure on public services is largely concentrated within central and local government, reflecting their respective responsibilities for policy delivery and frontline service provision. The segmental split highlights how different parts of the public sector contribute to overall expenditure and where spending pressures are most concentrated.
Figure 16: Expenditure – Sectoral Split (£ Billion)
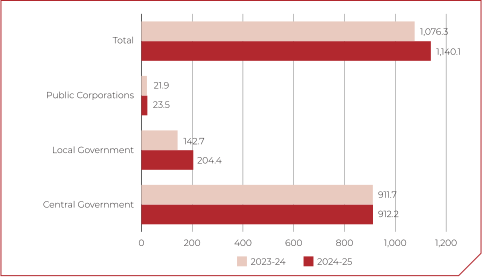
Central government remains the largest contributor to total public service expenditure, reflecting its role in delivering nationally administered programmes such as social security benefits, funding public services and servicing government borrowing. Central government expenditure also includes significant non‑cash costs, such as depreciation, impairment and movements in provisions, which reflect the scale and long‑term nature of government assets and liabilities.
Local government expenditure is primarily driven by the delivery of frontline services, including education, adult social care, children’s services and local infrastructure. Local government accounts for a substantial share of staffing costs and spending on goods and services, reflecting its operational role. While largely funded through central government grants and locally raised income, local government bears responsibility for service delivery and associated cost pressures.
The net expenditure impact of public corporations is limited, as operating costs are largely offset by commercial income.
The segmental split indicates that expenditure pressures are predominantly concentrated in central and local government, reflecting their statutory role in delivering public services. Consequently, changes in overall net expenditure are largely driven by movements in demand driven spending, alongside the costs of managing public sector assets and long‑term liabilities. As these sectors account for the majority of public spending, developments within them are the principal drivers of expenditure trends, fiscal risks and the long‑term sustainability of public finances.
Devolved Analysis of WGA Expenditure
Expenditure in WGA includes spending programs which are limited to nations, and which do not have a clear geographical extent. The below breakdown makes no adjustment for any individual spending items, instead relying on the WGA dataset after consolidation adjustments have been made.
| Expenditure (£ Billion) | 2024-25 | 2023-24 |
|---|---|---|
| England | 181.1 | 118.1 |
| Northern Ireland | 34.5 | 31.2 |
| Scotland | 180.4 | 183.8 |
| UK* | 861.5 | 803.4 |
| Wales | 32.6 | 30.0 |
| 1,290.1 | 1,166.5 |
| Expenditure (as % of Total) | 2024-25 | 2023-24 |
|---|---|---|
| England | 14.0% | 10.1% |
| Northern Ireland | 2.7% | 2.7% |
| Scotland | 14.0% | 15.8% |
| UK* | 66.8% | 68.9% |
| Wales | 2.5% | 2.6% |
| 100.0% | 100.0% |
*UK central government refers to government activity that is planned, funded and accountable on a UK‑wide basis and therefore cannot be allocated to a specific nation
Similar to the trend seen in income, expenditure in England increased largely as a result of missing data recovery. England percentage of total expenditure in year increased by 3.9% as data submission in English local government improved. Scotland share of total expenditure deteriorated in 2024-25 by 1.8%, which also reflects movement in missing data.
Expenditure in the UK category includes expenditure which, when remitted to a missing entity, would appear as an external transaction and therefore counted in total expenditure. When the missing entity submits data, and re-enters the WGA consolidation, the UK expenditures are eliminated as an internal transaction, while the newly re-entered body will record expenditures which are not eliminated as internal. Therefore, as missing data continues to recover in WGA, expenditures will transition from being reported in UK to the devolved sectors.
Implications for Fiscal Sustainability
Overall, expenditure patterns in 2024-25 point to the underlying structural factors shaping the sustainability of the public finances. With spending pressures concentrated in areas that are less responsive to short‑term control, expenditure remains closely linked to policy commitments, demographic change and prevailing economic conditions.
Against this backdrop, the interaction between expenditure, revenue and the Government’s financial position is central to understanding fiscal performance.
Assets
Overview of the Public Sector Asset Base
The public sector asset base increased in 2024-25, reinforcing both its scale and its role in supporting service delivery, long‑term policy objectives and fiscal resilience. Growth was evident across both non‑current and current assets, reflecting the different ways in which assets influence the Government’s underlying financial position over the short and long term. Analysis of individual movements are presented in the component overview below.
Figure 17: Non-Current Assets (£ Billion)
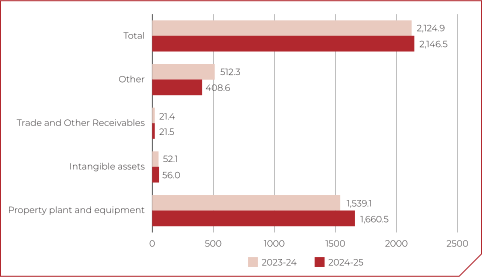
The asset base is predominantly non‑current, consistent with the long‑term nature of government activity and the sustained delivery of public services. Total non-current assets reported in the 2024-25 WGA increased by £21.6 billion relative to 2023-24, Property, Plant and Equipment (PPE) remained the largest component, underpinning service capacity across core public services and infrastructure, including schools, hospitals, transport networks and defence.
Other non‑current assets, including intangible assets and investment property, support day‑to‑day government operations and wider policy objectives, the former including software and IT systems which entities utilise to deliver services. Changes in these balances reflect ongoing investment, revaluations and movements in financial assets across the public sector. Given the scale and concentration of holdings within a relatively small number of large portfolios and sectors, changes in these asset balances can influence the aggregate position reported in the WGA.
Figure 18: Current Assets (£ Billion)
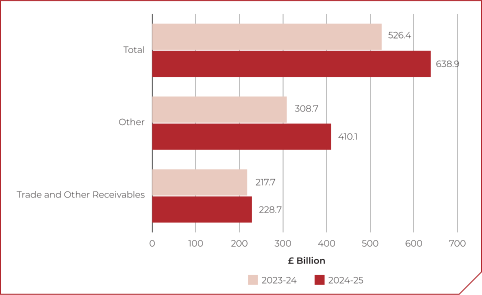
Current assets increased by £112.5 billion, totalling £638.9 billion in 2024-25, indicating higher short‑term financial exposure to economic conditions. These include receivables, short‑term loans and reserve assets such as cash and cash equivalents held for liquidity management.
Across the asset base, reported values are influenced by data quality and audit coverage. In some areas, the use of unaudited, disclaimed or incomplete information limits comparability across sectors and highlights the importance of robust supporting data at consolidation. Given the materiality of public sector assets, ongoing work to strengthen data quality will increase reliability of underlying data consolidated into the WGA and in doing so, support effective fiscal risk management and transparency for stakeholders
Component Overview
The asset balances reported in WGA 2024-25 reflect the long‑term nature of the public sector asset base, with the distribution weighted towards assets expected to provide economic benefits for more than one year. PPE remains the largest component, accounting for 60% of total assets, and is associated with the provision of public services. PPE balances are driven by sustained investment, maintenance and renewal rather than short‑term movements. Similarly, infrastructure assets and land and buildings continued to represent a substantial share of the public sector asset base, totalling £942.0 billion and £472.8 billion in 2024-25 respectively, highlighting their prominence within the public sector’s long‑term capital base.
Figure 19: Property, Plant and Equipment (£ Billion)
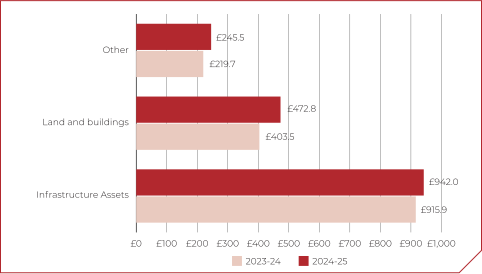
Among financial assets, student loans remain a material balance sheet item, with performance shaped by graduate earnings and repayment patterns over extended periods. In 2024-25, the total student loan balance increased by £9.0 billion, reflecting new lending exceeding repayments.
Intangible assets totalled £56.0 billion and mainly comprise software, IT systems and related technology held across government. These assets reflect investment in digital systems used in the administration and operation of public services. They are non‑current in nature and form part of the wider public sector asset base, with their reported balances influenced by initial investment and subsequent management over their useful lives.
Sectoral Split
Public sector assets are unevenly distributed across sectors, reflecting differences in the functions and activities carried out by each part of the public sector. This distribution is reflected in how asset balances are presented within the WGA.
Figure 20: Assets – Sectoral Split (£ Billion)
Central government holds around 70% of public sector assets, reflecting the concentration of nationally significant infrastructure, defence and long‑term financial assets within central government portfolios. It also accounts for the majority of PPE, supporting large‑scale public services and long‑term policy delivery. The scale of these holdings means central government assets have a significant influence on the overall financial position presented in the WGA.
Local government holds around 16% of the public sector asset base, largely concentrated in PPE that supports locally delivered services such as education, transport and housing. Local government remains the only sector reporting net assets overall, reflecting an asset base focused on long‑term service provision and an inconsistent application of accounting policies relating to different valuation methods by local government entities relative to central government entities and public corporations. Further information on valuation methods is available in Note 2. Given the number and diversity of entities involved, the introduction of audit backstop arrangements is expected to strengthen the comparability and accuracy of asset information in the consolidated WGA position over time, as reliance on unaudited and disclaimed submissions is reduced.
Public corporations hold a smaller share of total assets. They are often specialised and capital‑intensive, including rail and broadcasting infrastructure, with associated financing arrangements contributing to net liabilities at a sector level.
The concentration of assets within central and local government means that asset‑related considerations are reflected primarily within a limited number of portfolios that have a significant impact on the consolidated WGA position. Variations in asset composition across sectors influence how assets contribute to service delivery, long‑term objectives and fiscal resilience across the public sector.
Devolved Analysis of WGA Assets and Liabilities
| Assets (£ Billion) | 2024-25 | 2023-24 |
|---|---|---|
| England | 387.7 | 287.8 |
| Northern Ireland | 76.6 | 75.2 |
| Scotland | 225.0 | 224.2 |
| UK* | 2,029.0 | 1,996.2 |
| Wales | 67.1 | 67.9 |
| 2,785.4 | 2,651.3 |
| Assets (as % of total) | 2024-25 | 2023-24 |
|---|---|---|
| England | 13.9% | 10.9% |
| Northern Ireland | 2.8% | 2.8% |
| Scotland | 8.1% | 8.5% |
| UK* | 72.8% | 75.3% |
| Wales | 2.4% | 2.6% |
| 100.0% | 100.0% |
| Liabilities (£ Billion) | 2024-25 | 2023-24 |
|---|---|---|
| England | 172.2 | 134.7 |
| Northern Ireland | 66.6 | 51.7 |
| Scotland | 130.5 | 122.5 |
| UK* | 4,946.0 | 4,698.5 |
| Wales | 16.6 | 17.1 |
| 5,331.9 | 5,024.5 |
| Liabilities (as % of total) | 2024-25 | 2023-24 |
|---|---|---|
| England | 3.2% | 2.7% |
| Northern Ireland | 1.2% | 1.0% |
| Scotland | 2.4% | 2.4% |
| UK* | 92.8% | 93.5% |
| Wales | 0.3% | 0.3% |
| 100.0% | 100.0% |
*UK central government refers to government activity that is planned, funded and accountable on a UK‑wide basis and therefore cannot be allocated to a specific nation
The devolved split of the balance sheet reflects the structure in place by which many liabilities are held centrally, while the relevant assets financed by the liabilities are more dispersed in their holdings. The government borrowing portfolio, consisting of gilts, treasury bills and NS&I products, are accounted for in UK central government.
Recovery of missing data in English local government have driven proportional increases in the England category in both assets and liabilities, while deterioration of data submissions in Scotland has led to modest reductions. The primary reason for the increase in liabilities in Northern Ireland is the reinstatement of data for a pension scheme that was missing from the 2023-24 WGA.
Assets, Assurance and Fiscal Risk
The public sector asset base comprises assets used across a wide range of public sector activities and policies. At over £2.7 trillion, these assets represent a substantial component of the public sector balance sheet, with value largely concentrated in non‑current physical and financial assets held within a relatively small number of large portfolios.
Ongoing work led by the Ministry of Housing, Communities and Local Government (MHCLG) is supporting improvements in asset data, particularly in high‑value areas such as local government property, plant and equipment, through the Remediation Acceleration Plan. In parallel, progress in completing outstanding accounts through local government audit reforms, outlined in Unaudited and Disclaimed Data, has strengthened the quality and completeness of information feeding into the consolidated WGA, reflecting the scale of local government assets within the overall position.
Government Borrowing
Government borrowing underpins the financing of public sector investment and cash management throughout the year. Borrowing is concentrated within central government, reflecting the UK’s institutional arrangements for debt management. The scale of borrowing exposes the public finances to market risks, which are managed through the maturity profile of issuance, the balance between fixed‑rate and index‑linked debt, and the use of both short‑ and long‑term instruments.
Gilts
Gilts remain the principal source of borrowing and the main mechanism through which central government meets its financing requirement. Gilt issuance rose in 2024-25 in response to increased financing requirements and evolving fiscal forecasts. Green gilts, while a small component of overall issuance, continued to support the sustainable public sector objectives as part of the broader gilt programme.
| 2024-25 | 2023-24 | Variance | Variance | |
|---|---|---|---|---|
| £ Billion | £ Billion | £ Billion | % | |
| Current Gilts | 108.2 | 90.4 | 17.8 | 19.7% |
| Non-Current Gilts | 1,855.1 | 1,613.0 | 242.1 | 15.0% |
| Total gilts | 1,963.3 | 1,703.4 | 259.9 | 34.7% |
| Non-Seasonally Adjusted GDP During Year | 2,935.3 | 2,790.2 | ||
| Total Gilts as % of GDP | 66.9% | 61.1% |
The impact of gilts on public finances is reflected not only in balance sheet but also in debt servicing costs, which are sensitive to movements in interest rates and inflation. This sensitivity is particularly relevant given the continued role of index‑linked gilts within the debt portfolio and has implications for in‑year expenditure and fiscal planning.
| 2024-25 | 2023-24 | |
|---|---|---|
| £ Billion | £ Billion | |
| Total Gilts | 1,963.3 | 1,703.4 |
| Interest Costs on Gilts | 51.7 | 50.2 |
| Interest Cost as a % of Liability | 2.6% | 2.9% |
Total stock of gilts increased by 34.7% or £259.9 billion in 2024-25. Issuance of new gilts totalled 297.7 billion, which makes 2024-25 the second highest year of issuance executed by the Debt Management Office (DMO), only outsized by 2020-21 when gilt sales raised £485.8 billion. Gilts are primarily issued to the market in auctions by the DMO, with 78.0% of sales made by auction. The average bid/cover ratio for new issuance improved in 2024-25 to 3.18x, from 2.78x in 2023-24, indicating stronger investor demand relative to supply despite continuing volatility in market conditions. More information can be found in the DMO annual review for 2024-25.[footnote 12] A longer-term analysis of government borrowings and interest costs can be found in the 15-Year Analysis of Financial Statements.
A significant proportion of the gilt portfolio is held by the Bank of England Asset Purchase Facility (BoEAPF) and is eliminated from the WGA total as an internal balance. The size of the BoEAPF balance sheet started shrinking following an MPC decision in February 2022 to unwind previous quantitative easing measures in a process referred to quantitative tightening. Despite this active reduction in holdings, a material portion of the gilt assets remained on the BoEAPF balance sheet. A reconciliation between the WGA gilt liability and ONS gilt data is shown below.
| £ billion | % of GDP | |
|---|---|---|
| Total Gilt Liability per ONS [footnote 13] | 2,483.6 | 84.6% |
| Gilts Held by the BoEAPF (as at 28 February) [footnote 14] | (477.7) | (16.3%) |
| Timing and Other Consolidation Adjustments | (42.6) | (1.5)% |
| WGA Gilt Liability | 1,963.3 | 69.9% |
Other Borrowings
In addition to gilt issuance, the government finances its borrowing and manages shortterm cash needs using Treasury bills and National Savings & Investments (NS&I) products. Treasury bills provide a flexible, shortdated wholesale financing instrument used primarily for cash management, while NS&I offers retail savings products that raise funding directly from households and other savers.
Together, these instruments complement gilt issuance by diversifying the government’s investor base and maturity profile, and by providing additional levers to manage financing costs, refinancing risk and in year liquidity in line with the government’s debt management objectives.
| 2024-25 | 2023-24 | |
|---|---|---|
| £ Billion | £ Billion | |
| Total NS&I Products | 240.1 | 230.5 |
| Interest Costs on NS&I Products | 9.3 | 8.7 |
| Interest Cost as a % of Total Liability | 3.9% | 3.8% |
| 2024-25 | 2023-24 | |
|---|---|---|
| £ Billion | £ Billion | |
| Total Treasury Bills | 95.0 | 86.1 |
| Interest Cost on Treasury Bills | 5.0 | 3.8 |
| Interest Cost as a % of Total Liability | 5.3% | 4.4% |
Interest costs on NS&I products as a percentage of the total liability increased modestly by 0.1%. Treasury bills interest cost concentration increased more dramatically by 0.9% reflecting ongoing interest rate pressures and market risks which have a larger proportional impact on short term instruments.
Discount Rate Sensitive Liabilities
What is discounting and why do we do it?
Discounting future liabilities to ‘present value’ allows comparison of cash flows that arise at different points in time. A cash obligation due in the future is worth less than the same cash obligation today, reflecting the potential returns from investing cash in the interim.
Discounting converts future cashflows into their equivalent value today (a “present value”), allowing obligations that fall due at different points in time to be compared on a consistent basis. For pension liabilities, the relevant measure is the real discount rate – i.e. the nominal rate adjusted for both price inflation and earnings growth. This is because public sector pension payments are linked to both prices and earnings over time, so the liability cash flows themselves already incorporate inflation.
Applying a real discount rate to these cash flows produces a present value expressed in today’s terms, stripping out the effects of inflation. Discounting is a requirement under multiple accounting standards and is standard practice in investment appraisal and financial reporting, in both the public and private sectors.
What is the impact of discounting?
Changes in real discount rates can have a material impact on reported liabilities. When the real discount rate rises, the present value of future obligations falls – because each pound of future liability is discounted more heavily back to today’s value. Conversely, a falling real discount rate increases reported liabilities.
This effect can be large. For example, in the 2022-23 WGA, the reported public sector pensions liabilities decreased by £1.3 trillion, largely reflecting a reduction in real discount rate rather than any material change in underlying future cash flow projections – the actual future pension payments expected did not change significantly, but their present value fell sharply.
National Accounts Basis Discounting:
An alternative discounting method which holds the discounting element steady at 2% net of inflation assumptions. This method allows inflation assumptions to move, but then the discounting applied is flat, which stabilises changes in discounting assumptions when comparing figures.
For nuclear decommissioning, this analysis is already produced by the Nuclear Decommissioning Authority (NDA). For public sector pensions and clinical negligence, HM Treasury has commissioned the Government Actuary’s Department (GAD) to undertake equivalent analysis to ensure consistency across the major liabilities.
Specifically, GAD has recalculated the WGA pensions liabilities on a ‘National Accounts Basis’, using a 2% real discount rate net of any inflation assumption. GAD had also been asked to produce estimates on an undiscounted (0% real) position.
These alternative presentations help isolate movements in underlying cash flow assumptions from those driven by changes in discount rates, while allowing inflation expectations to evolve in line with market conditions. This analysis is detailed below under each of the three liabilities.
Presenting the undiscounted position, (or applying a 0% real discount rate), does not provide a reliable basis for decision making. While it implicitly allows for inflation by increasing nominal cash flows over time, it does not translate those costs into present values. This is particularly significant for long-term liabilities, where the effects of discounting compound over many years, and where liabilities do not have early redemption features.
Public Sector Pensions
Public sector pensions are generally unfunded, meaning that there are no assets generating returns held by the scheme. Instead, payments to retired members drawing on the pension are met by a combination of contributions from active members, their employers, and parliamentary funding. The large liabilities in these schemes are the forward projections of payment to members drawing from their pension, given a variety of assumptions such as wage growth and life expectancy.
Importantly, this presentation does not change the basis on which the HMT prepares Note 25: Pensions, as this is driven by the accounting framework for pensions. This analysis is presentational to aid the reader in understanding the scale of the pension’s liability and how it is affected by discounting. It also makes no difference to the amount which will ultimately be paid to settle these liabilities.
| £ Billion | Discount Rate applied in WGA | National Accounts Basis | Static 0% Real | |||
|---|---|---|---|---|---|---|
| 2024-25 | 2023-24 | 2024-25 | 2023-24 | 2024-25 | 2023-24 | |
| Real Discount Rate Applicable into Perpetuity (%) [footnote 15] | 2.40% | 2.45% | 2.00% | 2.00% | 0.00% | 0.00% |
| Unfunded Liabilities: | ||||||
| NHS | 531.4 | 500.8 | 571.7 | 559.1 | 868.4 | 847.9 |
| Teachers | 333.3 | 307.8 | 357.3 | 342.1 | 526.5 | 503.4 |
| Civil Cervice | 216.9 | 208.1 | 225.9 | 217.8 | 323.1 | 312.4 |
| Armed Forces | 150.3 | 144.6 | 161.4 | 161.0 | 238.2 | 237.9 |
| Other Schemes | 169.0 | 154.6 | 215.4 | 183.5 | 318.7 | 271.4 |
| Total Unfunded Pensions | 1,400.9 | 1,315.9 | 1,531.7 | 1,463.5 | 2,274.9 | 2,173.0 |
Analysis of the movements in WGA discounted pensions can be found in note 25. WGA unfunded liability was £130.8 billion lower than the national accounts basis, with a 0.40% difference in discount rate. In 2023-24 the discount rate difference was slightly larger at 0.45%, which resulted in a difference of £147.6 billion. The net movement as a result of 0.05% change in discount rate was £16.8 billion which highlights the sensitivity of long‑term liabilities to small changes in discount rate.
Sustainability and Management of Pensions Liabilities
The Government’s preferred measure for the affordability of Public Service Pension Schemes is the OBR’s projected cost of public service pensions as a share of GDP over the long term, as set out in the NAO’s 2021 report on Public Service Pensions. In its latest publication of September 2024, the OBR estimates that this will fall from 1.9% in 2023-24 to 1.4% in 2073-74. HMT considers this measure to provide the most helpful assessment of the affordability of public service pensions.
While the estimate of pension liabilities and accompanying information published in the WGA is helpful, it can be volatile, with significant changes often driven by changes in discount rates. Over the most recent publications, the WGA figure for public sector pension liability has varied significantly. While this is appropriate from an accountancy perspective, the unfunded nature of the main public service schemes means that changes in the discount rate do not directly impact their affordability for future taxpayers.
Public service pension costs are also managed via the Cost Control Mechanism (CCM), which is assessed at scheme valuations. The CCM is designed to ensure that the cost of providing pensions for current employees remains within a 3% corridor around target cost. Subject to an economic check, breaches of the CCM require scheme reforms to adjust the level of member benefits or contributions. To date, no CCM breach has led to changes in member benefits or contributions. While the CCM in its current form has only operated for one valuation cycle, this reflects that movements in the per member cost of the schemes have not been more volatile than anticipated.
Nuclear Decommissioning Provisions
Nuclear decommissioning provisions are liabilities for future costs relating to managing and decommissioning nuclear sites which have ceased production of energy and managing radioactive waste. These liabilities are recognised and paid by the Nuclear Decommissioning Authority (NDA). While there are some bodies which also report nuclear decommissioning liabilities, this analysis is focused on the NDA as the holder of the majority of the liability.
| £ Billion | Discount Rate applied in WGA | Static 2% Real | Static 0% Real | |||
|---|---|---|---|---|---|---|
| 2024-25 | 2023-24 | 2024-25 | 2023-24 | 2024-25 | 2023-24 | |
| Real Discount Rate Applicable into Perpetuity (%) | 2.55% | 2.40% | 2.00% | 2.00% | 0.00% | 0.00% |
| Nuclear Decommissioning Provisions | 110.1 | 105.3 | 125.3 | 117.0 | 215.9 | 198.9 |
The difference between the discounted nuclear decommissioning provision presented in the 2024-25 WGA and the 2% discounted provision increased to £(15.2) billion in 2024‑25 from £(11.7) billion in 2023-24. This is driven by the slight discount rate adjustment occurring between the years, represented in the perpetuity discount rate as a change of +0.15%, thus further discounting the 2024-25 provision. This £3.5 billion movement illustrates the sensitivity of long-term liabilities to even small changes in the discounting.
The underlying future estimation of required cashflows at the balance sheet date in 2024-25, with no adjustment for either inflation or the time value of money over the 60+ years redemption profile, is £215.9 billion, a £17.0 billion increase on 2023-24. A large part of the increase will be driven by the Sellafield cost factors discussed below.
Nuclear decommissioning provisions discounted at a static 2% increased by £8.3 billion. Further reconciliation of the ongoing decommissioning of Sellafield, based on NDA annual report and accounts further illustrates the movements.
| Sellafield | 2024-25 |
|---|---|
| £ Billion | |
| Opening Provision (Discounted) | 73.5 |
| Discount Rate Unwind | 1.8 |
| Released in Year | (3.0) |
| Discount Rate Change | (1.5) |
| Inflation Assumption Change | 2.4 |
| Changes in Underlying Cost Estimate | 4.9 |
| Closing Provision | 78.1 |
Changes in underlying cost estimate for Sellafield have been driven by a variety of factors including:
- Further downgrade of forecasted efficiency savings
- Ongoing review of expected future costs revealing shortfalls in some major projects
- Incorporation of revised cost estimates for the management of plutonium, reflecting a recent policy announcement made by UK government. This increased cost reflects the development of a new process for the transformation cans of plutonium residue into stable waste.
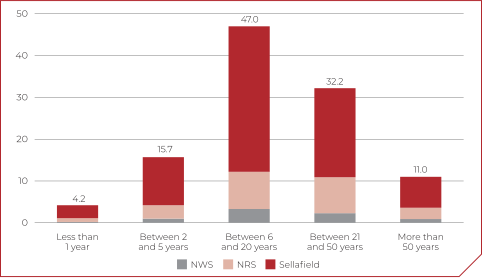
The chart below shows the redemption profile of the (discounted) provision. The largest parts of forecasted costs will fall between 6 and 50 years in the future,[footnote 16] by which both inflation and returns on cash invested in the interim will have had a significant impact.
Figure 21: Redemption Profile of Discounted Nuclear Decomissioning Provisions (£ Billion)
Sustainability and Management of Nuclear Decommissioning Provisions
The Nuclear Decommissioning Authority (NDA) manages the nuclear decommissioning liability and is responsible for delivering the longterm programme of decommissioning and waste management. The value of the nuclear provision, as reported in the NDA’s annual report and accounts, is inherently volatile, reflecting its sensitivity to changes in cost estimates, technical assumptions, discount rates and delivery plans.
The NDA’s approach to liability reduction is structured around a number of strategic programmes designed to improve certainty, reduce complexity and lower lifetime costs. Reprocessing activities ended in 2022, allowing greater focus on the management and disposal of spent fuel. The NDA’s ownership of plutonium and uranium inventories is being addressed through a policy decision in 2025 to immobilise plutonium, placing it beyond reach and enabling a downward revision to the liability as the disposition programme progresses. In parallel, the NDA is consolidating waste into regional facilities to avoid duplication of storage infrastructure and is close to completing the bulk vitrification of highlevel waste, marking a significant milestone in longterm waste management.
Site decommissioning and remediation continues to progress under the NDA’s 2026 Strategy, which introduced a rolling programme of reactor decommissioning, with initial implementation at the leadandlearn site at Trawsfynydd. Delivery is supported by robust governance and oversight arrangements, with DESNZ overseeing the NDA as sponsor department, drawing on UK Government Investments expertise. Monthly performance meetings, attended by HM Treasury, monitor progress against targets and focus on managing delivery risks. Major capital projects are subject to rigorous assurance and valueformoney assessment, ensuring that investment decisions are aligned with the most effective longterm reduction of the nuclear decommissioning liability.
Clinical Negligence Provisions
Clinical negligence provisions are liabilities relating to future costs arising from negligence claims made against the National Health Service (NHS). The costs include both direct and indirect costs in relation to the claims. These include settlement payments to claimants, as well as provisions for legal costs incidental to settling the claims. An analysis of clinical negligence provisions at a steady 2% real discount rate and on an undiscounted basis is set out below.
Clinical negligence cost inflation differs from general price (CPI) inflation and hence this projection is incorporated into the provision estimation. Applying a ‘fully’ undiscounted cash flow (i.e. not allowing for cost inflation above CPI) to such liabilities would understate their value, when expressed in present value terms, compared to other liabilities (such as nuclear decommissioning or pensions), which are assumed to increase in line with CPI.
| £ Billion | Discount Rate Applied in WGA | Static 2% Real | Static 0% Real | |||
|---|---|---|---|---|---|---|
| 2024-25 | 2023-24 | 2024-25 | 2023-24 | 2024-25 | 2023-24 | |
| Real Discount Rate Applicable into Perpetuity (%) | 2.55% | 2.40% | 2.00% | 2.00% | 0.00% | 0.00% |
| CNST Scheme | 55.6 | 54.0 | 62.0 | 58.6 | 99.6 | 92.1 |
| Other Clinical Schemes | 4.4 | 4.2 | 4.8 | 4.6 | 7.6 | 7.1 |
| Non-Clinical Schemes | 0.3 | 0.3 | 0.4 | 0.3 | 0.6 | 0.5 |
| Total NHS Resolution Clinical Negligence Provisions | 60.3 | 58.5 | 67.2 | 63.5 | 107.8 | 99.7 |
The difference between the discounted clinical negligence provision presented in the 2024-25 WGA and that calculated using a static 2% discount rate increased from £5.0 billion in 2023-24 to £6.9 billion in 2024-25. This is driven by the slight discount rate adjustment occurring between the years, represented in the perpetuity discount rate as a change of +0.15%, which reduced the 2024-25 provision on the WGA balance sheet.
Clinical negligence provisions discounted at a flat 2% increased by £3.7 billion. This is broadly comparable to the WGA balance sheet figure, which rose by a lower £1.8 billion, once the impact of being on a lower discount rate and the change in discount rate is removed. The movement will be driven by the same factors as the below breakdown of movements in the discounted provision below.
| £ Billion | Discount Rate Applied in WGA | Static 2% Real | Static 0% Real | |||
|---|---|---|---|---|---|---|
| 2024-25 | 2023-24 | 2024-25 | 2023-24 | 2024-25 | 2023-24 | |
| Real Discount Rate Applicable into Perpetuity (%) | 2.55% | 2.40% | 2.00% | 2.00% | 0.00% | 0.00% |
| CNST Scheme | 55.6 | 54.0 | 62.0 | 58.6 | 99.6 | 92.1 |
| Other Clinical Schemes | 4.4 | 4.2 | 4.8 | 4.6 | 7.6 | 7.1 |
| Non-Clinical Schemes | 0.3 | 0.3 | 0.4 | 0.3 | 0.6 | 0.5 |
| Total NHS Resolution Clinical Negligence Provisions | 60.3 | 58.5 | 67.2 | 63.5 | 107.8 | 99.7 |
| Known Claims | CNST | Non-CNST | Total |
|---|---|---|---|
| 2025 | 2025 | 2025 | |
| £ Billion | £ Billion | £ Billion | |
| Opening Provision (Discounted) | 31.6 | 3.1 | 34.7 |
| Provided In-Year | 6.7 | 0.8 | 7.5 |
| Not Required and Written Down | (3.3) | (0.4) | (3.7) |
| Unwind of Discount Rate | 1.2 | 0.1 | 1.3 |
| Change of Discount Rate | (0.5) | – | (0.5) |
| Utilised In- Year | (2.8) | (0.3) | (3.1) |
| Closing Provision | 32.9 | 3.3 | 36.2 |
| Incurred but not Reported (IBNR) | CNST | Non-CNST | Total |
|---|---|---|---|
| 2025 | 2025 | 2025 | |
| £ Billion | £ Billion | £ Billion | |
| Opening Provision (Discounted) | 22.4 | 1.4 | 23.8 |
| Change of Discount Rate | (0.5) | – | (0.5) |
| Net Provision Increase/(Decrease) In-Year | 0.8 | – | 0.8 |
| Closing Provision | 22.7 | 1.4 | 24.1 |
Sustainability and Management of Clinical Negligence Provisions
The Department of Health and Social Care (DHSC) and the devolved administrations provide for future costs in a number of cases where they or an NHS Trust, a General Practitioner or General Practice are the defendant in legal proceedings brought by claimants seeking damages for the effects of alleged clinical negligence. Most of the UK government’s clinical negligence claims are managed under indemnity schemes administered by NHS Resolution (NHSR), which handles both clinical and non-clinical claims relating to the NHS in England.
Over the past 20 years, claimants have increasingly preferred long-term annual payments over lump sum only payments. As annual payments remain a liability until they are paid, a portion of settlements can remain within the provision for decades. Consequently, NHSR and DHSC expect the size of the provision to grow until the level of payments made, which reduces the provision, matches the value of new incidents incurred, which drives it up. This equilibrium is not expected for several decades. Over the long term, the provision is also expected to grow due to inflationary pressures on health-related costs, which are usually higher than general inflation.
As of 31 March 2025, NHSR reported clinical negligence provisions totalling £60.3 billion, an increase from £58.5 billion. This represents an increase of £1.8 billion or 3%, primarily driven by natural growth of the provision – an additional year of exposure to new incidents exceeding the payments made, as well as growth due to inflation. This growth was partially offset by reductions following a new Personal Injury Discount Rate (PIDR) which is used to determine lump sum settlement amounts, as well as changes in PES discount rates.
Clinical negligence is DHSC’s largest provision and covers liabilities arising from incidents that occurred before 31 March 2025, including both incidents where a claim has been received and those that have been Incurred But Not Reported (IBNR). NHSR, supported by the Government Actuarys Department (GAD), sets a best estimate for the provision as at the balance sheet date, which is reviewed annually. There is significant uncertainty in the estimation of the provision due to the often lengthy lag between incidents occurring and claims being reported, the complexities in claim resolution and uncertainty over future inflationary pressures.
Discount rates also have a significant effect on how these estimated costs are presented in present value terms. The liability has fluctuated in recent years, largely driven by changes in discount rates. HMT has worked with NHSR to estimate the year-on-year change in the provision independent of changes in the discount rate. The tables above demonstrate the change in the provision for fixed discount rates of 2% and 0% net of health-related inflation.[footnote 17]
NHSR continues its work to manage clinical negligence and other claims against the NHS in England. It makes efforts to learn and act to prevent incidents of harm, to prevent the same harm happening to others and to avoid the need for compensation payments. NHSR is committed to helping the NHS learn from claims. It is working directly with providers of healthcare services, alongside other national and local bodies focussed on patient safety, to share learning and best practice across the NHS to drive safety improvement. In addition, DHSC and NHS England (NHSE) continue to prioritise patient safety and learning across the NHS so that harmful patient events are significantly reduced.
3.2 Data Quality in WGA
Missing Data
If a data submission is expected from an entity, but they do not submit any data to HMT, the entity is categorised as ‘missing data’. When this occurs, this body is removed from the WGA consolidation for the year. Transactions between submitting and non-submitting bodies, which would have been eliminated as an ‘internal’ transaction had the entity submitted data, are instead treated as an external transaction.
The table below details the number of entities missing from WGA in each sector over the last 5 years.
| 2020-21 | 2021-22 | 2022-23 | 2023-24 | 2024-25 | |
|---|---|---|---|---|---|
| UK Central Government* | 3 | – | – | 6 | 2 |
| Scottish Central Government | 17 | 14 | 10 | 5 | 11 |
| Northern Ireland Central Government | – | – | 1 | 1 | – |
| Public Corporations | 7 | 7 | 2 | 3 | 4 |
| Total Central Government Entities Missing | 27 | 21 | 13 | 15 | 17 |
| 2020-21 | 2021-22 | 2022-23 | 2023-24 | 2024-25 | |
|---|---|---|---|---|---|
| English Local Government | 118 | 146 | 187 | 167 | 107 |
| Scottish Local Government | 9 | 10 | 10 | 12 | 14 |
| Welsh Local Government | 1 | 1 | 1 | 7 | 7 |
| Total Local Government Entities Missing | 128 | 157 | 198 | 186 | 128 |
| Total Missing Entities | 155 | 178 | 211 | 201 | 145 |
*UK central government refers to government activity that is planned, funded and accountable on a UK‑wide basis and therefore cannot be allocated to a specific nation
Between 2020-21 and 2024-25, the sector with the most missing entities has been English local government. Missing data in English local government peaked in 2022-23, and by 2024-25 the number of missing bodies in English local government had dropped significantly to a 5-year low, following a more moderate improvement in 2023-24. HMT expects missing data to continue to recover in future in years.
The reduction in missing data was expected as part of a recovery plan for local government. A driving factor behind the increase in missing data was constraints in the local authority audit, which introduced significant difficulties in obtaining an audit opinion. A legislative programme was put in place to ensure accounts were published with an audit opinion, even if that opinion was disclaimed, in a timely manner. More detail on the unaudited and disclaimed data, and local authority audit market recovery legislation can be found in the Unaudited and Disclaimed Data section.
Central government and public corporation missing data position has been more varied throughout the same period and was not dominated by any one region in the same way as local government. The most prominent sector for central government and public corporation missing data was Scottish central government, which deteriorated in 2024‑25 after 4 years of improving submissions.
Returns are presented on a UK central government basis because UK Government departments and bodies operate across the whole of the United Kingdom and are managed, funded and accountable at a UK‑wide level. Central government activity cannot be meaningfully attributed to England alone, as England does not have a separate devolved central administration equivalent to Scotland, Wales or Northern Ireland. Devolved administrations are therefore shown separately within central government, reflecting their distinct accountability and reporting arrangements, while local government is reported by territory, consistent with its geographically defined structure.
Impact of Missing Data
TThe charts below demonstrate the impact of missing data on the Statement of Revenue and Expenditure (SORE) and the Statement of Financial Position (SOFP), constructing estimates using proxy data. The proxy data is generated using the most recent submission by an entity and using it as a reasonable estimate of the data missing from WGA in 2024-25.
Figure 22: Impact of Missing Income and Expenditure in WGA SORE (£ Billion)
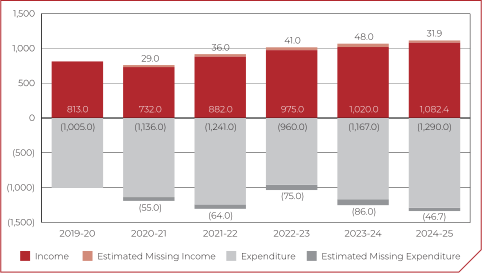
2019-20 to 2023-24 figures have been rounded to the nearest £billion
In 2024-25, the WGA SORE was missing an estimated £31.9 billion in income and £46.7 billion in expenditure. As the majority of the missing entities are local government, this will largely be an undercounting of locally administered taxes and expenditures, such as council tax and local housing benefit. The ongoing re-estimation of the proxy data inflates recent years, as proxy data is based on more recent information.
Figure 23: Impact of Missing Assets and Liabilities in WGA SOFP (£ Billion)
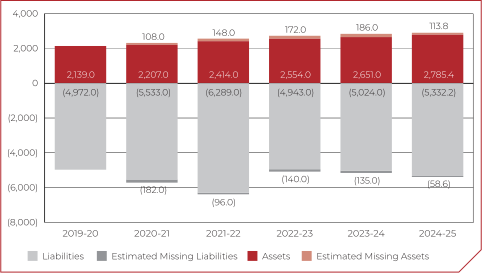
Assets and liabilities in WGA are generally more concentrated in central government, reducing SOFP exposure to missing data impacts as a proportion of the total. As the missing data population changes, and entities come in and out of consolidation, the proxy figures will likely fluctuate as more recent data is incorporated. This variation will generally present as an increase due to the impact of inflation, which cause newer proxy values to appear larger relative to the number of missing entities.
| Statement of Revenue and Expenditure | 2024-25 | Estimated Missing Data* | % of Total** | 2023-24 | Estimated Missing Data | % of Total |
|---|---|---|---|---|---|---|
| £ Billion | £ Billion | £ Billion | £ Billion | |||
| Taxation Revenue | (926.5) | (9.9) | 1.1% | (888.8) | (17.9) | 2.0% |
| Other Revenue | (155.9) | (22.0) | 14.1% | (131.1) | (30.1) | 23.0% |
| Total Public Services Revenue | (1,082.4) | -31.9 | 2.9% | (1,019.9) | (48.0) | 4.7% |
| Social Security Benefits | 334.3 | 5.0 | 1.5% | 311.4 | 8.4 | 2.7% |
| Staff Costs | 260.1 | 16.3 | 6.3% | 240.5 | 29.6 | 12.3% |
| Purchase of Goods and Services | 309.0 | 19.9 | 6.4% | 263.7 | 38.2 | 14.5% |
| Grants and Subsidies | 83.3 | 0.4 | 0.5% | 104.1 | 0.1 | 0.1% |
| Depreciation and Impairment | 63.9 | 3.1 | 4.9% | 64.2 | 5.5 | 8.6% |
| Interest Costs | 66.7 | 0.0 | 0.0% | 63.4 | 0.0 | 0.0% |
| Change in Provisions | 22.8 | 0.2 | 0.7% | 29.0 | 0.2 | 0.7% |
| Total Expenditure | 1,140.1 | 44.9 | 3.9% | 1,076.3 | 82.0 | 7.6% |
| Net Expenditure | 57.7 | 13.0 | 22.5% | 56.4 | 34.0 | 60.3% |
| Financing Costs | 142.0 | 1.7 | 1.2% | 82.9 | 3.5 | 4.2% |
| Revaluation | 8.0 | 0.1 | 1.6% | 7.3 | 0.2 | 2.7% |
| Net (Income)/Expenditure | 207.7 | 14.8 | 7.1% | 146.6 | 37.7 | 25.7% |
*Estimated data in the table is based on proxy data when entities last submitted, spread across multiple years 2019-20 to 2023-24
**Percentages in the above table are derived from unrounded underlying figures and may not correspond to calculations based on the rounded amounts presented.
The missing data impact on the SORE varies depending on how much of that line is accounted for in local government and therefore exposed to missing data issues. The majority of WGA taxation revenue is reported by HM Revenue and Customs, meaning that missing data is estimated to be approximately 1.1% in 2024-25. In contrast, other revenue estimated to be missing is 14.1% of the total, though has improved in line with submissions from local government from an estimated 23.0% in 2023-24.
Impact on expenditure is less concentrated in specific categories, reflecting the dispersed nature of public sector expenditure. Because expenditures are more widely dispersed around sectors exposed to missing data issues, it has also seen the most improvement in 2024-25. The total expenditure estimated to be missing went from 7.6% of the total in 2023-24 to 3.9% of the total in 2024-25.
Statement of Financial Position 2024-25 Estimated Missing Data* % of Total** 2023-24 Estimated Missing Data % of Total
| Statement of Financial Position | 2024-25 | Estimated Missing Data* | % of Total** | 2023-24 | Estimated Missing Data | % of Total |
|---|---|---|---|---|---|---|
| £ Billion | £ Billion | £ Billion | £ Billion | |||
| Non-current assets: | ||||||
| Property, Plant and Equipment | 1,660.4 | 86.1 | 5.2% | 1,539.1 | 145.0 | 9.4% |
| Right of Use Assets | 27.3 | 0.2 | 0.6% | 28.0 | 0.3 | 1.1% |
| Investment Properties | 15.5 | 8.3 | 54.0% | 14.3 | 10.0 | 69.9% |
| Intangible Assets | 56.0 | 0.3 | 0.5% | 52.1 | 1.5 | 2.9% |
| Trade and Other Receivables | 21.5 | 2.4 | 11.1% | 21.4 | 3.3 | 15.4% |
| Other Financial Assets | 365.8 | 1.9 | 0.5% | 470.0 | 2.9 | 0.6% |
| 2,146.5 | 99.2 | 4.6% | 2,124.9 | 163.0 | 7.7% | |
| Current Assets: | ||||||
| Inventories | 13.6 | 0.1 | 0.7% | 13.2 | 0.4 | 3.0% |
| Trade and Other Receivables | 228.7 | 4.8 | 2.1% | 217.7 | 7.8 | 3.6% |
| Other Financial Assets | 330.3 | 5.4 | 1.6% | 237.6 | 7.8 | 3.3% |
| Cash and Cash Equivalents | 40.7 | 4.1 | 10.1% | 39.5 | 6.4 | 16.2% |
| Gold Holdings | 24.1 | 0.0 | 0.0% | 17.5 | 0.0 | 0.0% |
| Assets Held for Sale | 1.5 | 0.2 | 10.5% | 0.9 | 0.5 | 55.6% |
| 638.9 | 14.6 | 2.3% | 526.4 | 22.9 | 4.4% | |
| Total Assets | 2,785.4 | 113.8 | 4.1% | 2,651.3 | 185.9 | 7.0% |
| Current Liabilities: | ||||||
| Trade and Other Payables | (180.1) | (6.8) | 3.8% | (175.0) | (12.0) | 6.9% |
| Government Borrowings | (443.3) | 0.0 | 0.0% | (407.0) | 0.0 | 0.0% |
| Other Financial Liabilities | (878.8) | (2.9) | 0.3% | (868.5) | (6.1) | 0.7% |
| Provisions | (26.7) | 0.0 | 0.0% | (22.2) | 0.0 | 0.0% |
| (1,528.9) | (9.7) | 0.6% | (1,472.7) | (18.1) | 1.20% | |
| Non-Current Liabilities | ||||||
| Trade and Other Payables | (57.2) | (6.7) | 11.6% | (53.3) | (9.6) | 18.0% |
| Government Borrowings | (1,855.1) | 0.0 | 0.0% | (1,613.0) | 0.0 | 0.0% |
| Other Financial Liabilities | (238.9) | (4.8) | 2.0% | (333.6) | (7.7) | 2.3% |
| Provisions | (256.0) | (0.9) | 0.4% | (240.0) | (1.6) | 0.7% |
| Public Sector Pensions | (1,395.8) | (32.5) | 2.3% | (1,311.9) | (98.3) | 7.5% |
| (3,803.0) | (44.9) | 1.2% | (3,551.8) | (117.2) | 3.3% | |
| Total Liabilities | (5,331.9) | (54.6) | 1.0% | (5,024.5) | (135.3) | 2.7% |
*Estimated data in the table is based on proxy data when entities last submitted, spread across multiple years 2019-20 to 2023-24 **Percentages in the above table are derived from unrounded underlying figures and may not correspond to calculations based on the rounded amounts presented.
Assets and liabilities in the WGA have recovered at similar rates. The estimated PPE missing from WGA has decreased by £58.9 billion but still makes up the majority of the missing assets. The missing data impact on liabilities was initially smaller, but saw a similar increase in pensions liabilities, which improved by £65.8 billion.
Recovery of Missing Data
2024-25 has seen a marked improvement in missing data.
The breakdown below demonstrates that missing data recovery is driving significant upward variances in 2024-25 in both income and expenditure. Details can be found in each of the notes to the financial statements regarding the impact of missing data in 2024-25.
Statement of Revenue and Expenditure Missing Data Recovery
| Note | Ins | Outs | Net Impact | |
|---|---|---|---|---|
| Taxation Revenue | 4 | (13.4) | 2.5 | (10.9) |
| Other Revenue | 5 | (30.0) | 9.4 | (20.6) |
| Change in Revenue as a Result of Missing Data | (43.4) | 11.9 | (31.5) | |
| Social Security Benefits | 6 | 6.1 | (1.3) | 4.8 |
| Staff Costs | 7 | 20.5 | (4.7) | 15.8 |
| Purchase of Goods and Services | 8 | 32.7 | (6.0) | 26.7 |
| Grants and Subsidies | 9 | 0.1 | (0.4) | (0.3) |
| Depreciation and Impairment | 10 | 5.4 | (1.2) | 4.2 |
| Finance Expense | 11 | 2.8 | (0.5) | 2.3 |
| Change in Expenditure as a Result of Missing Data | 67.6 | (14.1) | 53.5 | |
| Net SORE Impact of Missing Data Recovery | 24.2 | (2.2) | 22.0 |
Revenue increased by £31.5 billion in 2024-25 as a net result of entities re-entering the consolidation. This was offset by a net increase in expenditure of £53.5 billion, leading to net SORE impact of £22.0 billion expenditure.
Importantly, this does not mean that there is ‘new’ income or expenditure, only that the entities which record these transactions are once again being consolidated in WGA. These bodies have been conducting business as usual, but either failing to make WGA data submission or prepare accounts. However, this does indicate that, at a headline level, the entities re-entering the boundary are submitting larger expenditures than revenues.
Bodies previously outside the boundary would not have had transactions between them and bodies within the boundary eliminated as internal. Consequently, financial assistance from other bodies in the boundary (for example, central government providing grants to local government) would not be captured by this analysis as it would be eliminated on consolidation of WGA. This means that this analysis is a conservative ‘worst case’ estimate of the net expenditure increases.
Statement of Financial Position Missing Data Recovery
| Note | Ins | Outs | Net Impact | |
|---|---|---|---|---|
| Property, Plant, and Equipment | 12 | 101.1 | (29.3) | 71.8 |
| Right of Use Assets | 13 | 0.3 | (0.1) | 0.2 |
| Investment Properties | 14 | 3.7 | (2.5) | 1.2 |
| Intangible Assets | 15 | 1.6 | (0.1) | 1.5 |
| Trade and Other Receivables | 16 | 7.9 | (2.9) | 5.0 |
| Other Financial Assets | 17 | 5.8 | (2.3) | 3.5 |
| Inventories | 18 | 0.2 | 0.0 | 0.2 |
| Cash and Cash Equivalents | 19 | 4.0 | (1.4) | 2.6 |
| Change in Assets as a Result of Missing Data | 124.6 | (38.6) | 86.0 | |
| Trade and Other Payables | 20 | (15.7) | 5.4 | (10.3) |
| Other Financial Liabilities | 22 | (9.4) | 2.4 | (7.0) |
| Provisions | 23 | (1.4) | 0.2 | (1.2) |
| Public Sector Pensions | 25 | (45.2) | 5.3 | (39.9) |
| Change in Liabilities as a Result of Missing Data | (71.7) | 13.3 | (58.4) | |
| Net SOFP Impact of Missing Data Recovery | 52.9 | (25.3) | 27.6 |
The WGA balance sheet shows a significant increase in assets due to missing data recovery, which recovered by £86.0 billion as a result of entities re-entering the consolidation.
The largest asset class increase as a result of the recovery was PPE, with a net increase of £71.8 billion. This is consistent with the understanding that the missing data issue is largely concentrated in local government, which generally holds a higher proportion of their total assets in PPE. Other increases in assets were less material to WGA, but it is noteworthy that all asset classes experienced net increases as a result of missing data.
Liabilities consolidated in WGA increased by £58.4 billion as a result of missing data recovery. The class of liabilities with the largest increase due to missing data recovery was public sector pensions, which increased by £39.9 billion. More information on public-sector pensions can be found in Note 25 and in the Analysis of Financial Statements.
As will be analysed in the next section, this recovery has coincided with an expected, but material increase in the number of unaudited and disclaimed entities consolidated in WGA.
Trends in Missing Data in 2024-25
| Category | Status | Total |
|---|---|---|
| Not realistic to submit in 2024-25 due to incomplete 2023-24 accounts | Entities that were at least one full reporting cycle behind, having not finalised 2023-24 accounts by the WGA deadline. As a result, there was no realistic prospect of preparing and submitting 2024-25 data in time. | 11 |
| May have been possible to submit a WGA return for 2024-25, but did not | Entities that had finalised their 2023-24 accounts prior to the 2024-25 WGA deadline, so in theory should have been able to submit a 2024-25 WGA return. However, challenges may have been present, varying from one body to another. | 101 |
| Expected to submit but did not in 2024-25 | Entities that would have been expected to be able to submit at least draft 2024-25 data but did not do so. This group represents cases where at a minimum draft 2024-25 accounts were available at the WGA deadline, but a WGA submission was not made. | 33 |
| Total | 145 |
The 145 entities missing from the 2024-25 WGA can be broadly understood across three distinct groups.
Not realistic to submit in 2024-25 due to incomplete 2023-24 accounts
11 entities (8%) had no realistic possibility of submitting 2024-25 data. These bodies had not finalised their 2023-24 accounts by the 2024-25 WGA deadline, placing them at least one full WGA reporting cycle behind. Given this starting position, and the need to have finalised 2023-24 closing balances to prepare 2024-25 accounts; it would not have been feasible for these entities to prepare and submit 2024-25 returns in time.
Of these 11 entities, 9 are English local government bodies. This reflects wider disruption in the local authority audit system, where delays in audit completion have limited the ability to submit returns. The remaining entities comprise 1 Welsh local government body, 1 Scottish local government body.
May have been possible to submit a WGA return for 2024-25, but did not
The largest group, comprising 101 entities (70%), consists of bodies that may have been capable of submitting 2024-25 returns, in that they had audited 2023-24 accounts by the 2024-25 WGA deadline, but where submission was not achieved. Here, circumstances will vary between individual bodies, and these entities may not have felt that submission was practicable. Of these 101 entities, 84 are English local government bodies, where recovery from audit backlogs has been particularly challenging. Within this group, 70 entities did not submit a 2023-24 WGA return either, indicating that their underlying accounts production and audit timelines were already significantly delayed.
While individual circumstances will vary between individual bodies, in some cases submissions of at least draft data may have been achievable. WGA accepts draft data submissions, meaning entities are not required to have published 2024-25 accounts to contribute. Therefore, although submission for 2024-25 may have required changes to established reporting timetables or additional capacity, the ability to submit draft data means that full completion of audited accounts was not a prerequisite for submitting a WGA return so draft data may have been feasible to submit, depending on individual reporting lead times in individual bodies.
As such, this group represents entities where submission may have been feasible but not realised. Barriers may have also been linked to capacity, prioritisation, or engagement, as well as a requirement for acceleration of reporting timetables that may not have felt achievable.
Expected to submit but did not in 2024-25
The remaining 33 entities (23%) are those that should reasonably have been expected to be able to submit at least draft 2024-25 data but did not.
Of these 33 entities, 14 are Scottish local government, central government or public corporation entities. Scottish Government bodies are not subject to a statutory requirement to submit WGA returns in the same way as in England, Wales and Northern Ireland, where submission is underpinned by legislation. Instead, submissions are made through administrative arrangements agreed with Scottish Government, supported by collaborative working to encourage participation. The other main contribution to this group is 14 English local government bodies.
The absence of submissions from this group indicates that, notwithstanding the availability of draft data submissions, barriers such as capacity constraints or compliance issues remained. This group represents the most addressable portion of the overall gap. Overall, the analysis indicates that the majority of missing entities were either significantly behind in their reporting cycle or faced significant challenges to submission. Only a relatively small proportion fall into the category where submission would clearly have been expected but was not realised. This reinforces that the principal driver of missing data in 2024-25 remains underlying delays in local accounts production and audit, rather than more isolated instances of non-compliance.
Reasons for Non-Submission
The drivers of non-submission are varied and reflect both persistent behavioural issues and wider system pressures. A core group of 55 entities have never submitted across the period. Historically, the number of bodies failing to submit has been relatively low and broadly in line with normal changes to the WGA boundary, such as classification changes. This cohort therefore represents a relatively stable baseline of missing data, where further improvement is likely to depend on more targeted engagement.
A significant proportion of non-submission is attributable to more transient factors. The concentration of gaps in the middle years, particularly among entities that are otherwise compliant, align with disruption in the local authority audit system, where delays in audit completion limited the ability to submit returns.
The presence of isolated gaps across the period further demonstrates the movement entities in and out of compliance, as opposed to following a consistent pattern. For example, Scottish Government bodies are not subject to a statutory requirement to submit WGA returns in the same way as in England, Wales and Northern Ireland, where submission is underpinned by legislation. Instead, submissions are made through administrative arrangements agreed with Scottish Government, supported by collaborative working to encourage participation.
In addition, new instances of non-submission continue to arise each year, with 37 entities newly missing in 2024-25, demonstrating that non-submission is not limited to a fixed group. Finally, structural changes to the reporting population, such as entities being abolished, subsumed, or newly established, also contribute to the observed patterns and can overstate persistent non-compliance.
Further sectoral split of missing data for each financial year is presented in the Missing Data section.
While individual circumstances will vary between individual bodies, in some cases submissions of at least draft data may have been achievable. WGA accepts draft data submissions, meaning entities are not required to have published 2024-25 accounts to contribute. Therefore, although submission for 2024-25 may have required changes to established reporting timetables or additional capacity, the ability to submit draft data means that full completion of audited accounts was not a prerequisite for submitting a WGA return so draft data may have been feasible to submit, depending on individual reporting lead times in individual bodies. As such, this group represents entities where submission may have been feasible but not realised. Barriers may have also been linked to capacity, prioritisation, or engagement, as well as a requirement for acceleration of reporting timetables that may not have felt achievable.
Unaudited and Disclaimed Data
Financial data is collected annually from a wide range of entities through the Data Collection Tool (DCT) and is treated as audited for WGA consolidation purposes where either independent third party audit assurance has been provided over the DCT return itself, or the entity’s audited accounts were available and published prior to the latest DCT submission. Data that does not meet the definition of audited data relates to entities whose accounts have not been audited or where a disclaimed audit opinion has been issued.
| 2020-21 | 2021-22 | 2022-23 | 2023-24 | 2024-25 | |
|---|---|---|---|---|---|
| UK Central Government* | 1 | – | 3 | 9 | 7 |
| Scottish Central Government | 5 | – | 4 | 10 | 10 |
| Northern Ireland Central Government | 1 | 10 | 1 | 1 | 4 |
| Welsh Central Government | 11 | 1 | 1 | 3 | 5 |
| Public Corporations | 2 | 1 | 7 | 8 | 10 |
| Total Central Government | 20 | 12 | 16 | 31 | 36 |
| 2020-21 | 2021-22 | 2022-23 | 2023-24 | 2024-25 | |
|---|---|---|---|---|---|
| English Local Government | 97 | 192 | 196 | 224 | 280 |
| Scottish Local Government | 3 | – | 4 | 10 | 7 |
| Northern Ireland Local Government | – | – | – | 2 | 2 |
| Welsh Local Government | – | 7 | 11 | 13 | 13 |
| Total Local Government | 100 | 199 | 211 | 249 | 302 |
| 2020-21 | 2021-22 | 2022-23 | 2023-24 | 2024-25 | |
|---|---|---|---|---|---|
| Total Unaudited and Disclaimed Bodies | 120 | 211 | 227 | 280 | 338 |
| Total Population | 552 | 523 | 465 | 456 | 517 |
| % of Total Population | 22% | 40% | 49% | 61% | 65% |
*UK central government refers to government activity that is planned, funded and accountable on a UK wide basis and therefore cannot be allocated to a specific nation.
The proportion of unaudited and disclaimed submissions relative to the total reporting population has increased steadily between 2021‑22 and 2024‑25, as shown in the chart above. Over this period, unaudited and disclaimed returns have risen across both central and local government, with the largest concentration in the local government sector.
In absolute terms, the number of unaudited and disclaimed submissions increased from 211 in 2021‑22 to 338 in 2024‑25. This represents 65% of the total reporting population, an increase from 40% in 2021‑22. Due to the recovery in missing data, the percentage of unaudited and disclaimed of the total population has only increased marginally from 61% in 2023-24. Despite this, it continues to represent a relatively small proportion of WGA headline totals, as per the information presented in the next section.
The rise in unaudited and disclaimed submissions is primarily driven by pressures within the local government audit regime. A significant backlog of local authority audits has limited the ability of many entities to obtain audited opinions on submissions, even where draft accounts are complete and materially accurate. To meet statutory reporting timescales, these bodies have therefore submitted unaudited returns.
Audit capacity constraints have compounded this issue. In particular, the concentration of audit effort on clearing historic audit backlogs has reduced the capacity available to complete audits for more recent financial years, further increasing reliance on unaudited and disclaimed data submissions.
Financial Impact of Unaudited and Disclaimed Data
The table below sets out the proportion of the consolidated accounts based on unaudited and disclaimed information across assets, liabilities, income and expenditure.
| £ Billion | Assets | Liabilities | Income | Expenditure |
|---|---|---|---|---|
| Unaudited and Disclaimed | 668.8 | (687.6) | (207.7) | 284.4 |
| Total | 2,785.4 | (5,331.9) | (1,082.4) | 1,290.1 |
| Unaudited as % of Total | 24% | 13% | 19% | 22% |
While reliance on unaudited and disclaimed data has assurance implications, the increased use of this information in 2024‑25 was in line with expectations. It reflects improving coverage of the WGA as local government audit reform reduces levels of missing data, increasing completeness even where audits have not yet concluded.
From a sectoral perspective, the use of unaudited and disclaimed data is concentrated in local government. As audit reform has focused on restoring audit coverage and reducing gaps in financial information, a greater proportion of local government data is now incorporated into the WGA on this basis. In contrast, central government and public corporations continue to be underpinned predominantly by audited information. The breakdown by sector is set out in the table below.
| £ Billion | Assets | Liabilities | Income | Expenditure |
|---|---|---|---|---|
| Central Government | 304.4 | (523.6) | (84.1) | 95.9 |
| Local Government | 351.0 | (159.9) | (120.1) | 183.6 |
| Public Corporation | 13.4 | (4.1) | (3.5) | 4.9 |
| Total | 668.8 | (687.6) | (207.7) | 284.4 |
From a devolved perspective, reliance on unaudited and disclaimed data is concentrated in England, reflecting the scale and complexity of English local government and the uneven recovery of audit capacity. In contrast, Scotland, Wales and Northern Ireland have smaller local government populations and different audit frameworks, supporting higher levels of audit completion. Unaudited and disclaimed information attributed to the UK relates to UK‑wide central government bodies. The breakdown by administration is presented in the table below.
| £ Billion | UK* | England | Northern Ireland | Wales | Scotland |
|---|---|---|---|---|---|
| Assets | 265.0 | 324.7 | 8.5 | 56.1 | 14.5 |
| Liabilities | (397.7) | (150.6) | (35.7) | (14.2) | (89.2) |
| Income | (30.6) | (110.5) | (27.4) | (30.8) | (8.5) |
| Expenditure | 68.3 | 171.5 | 5.1 | 27.6 | 12.5 |
*UK central government refers to government activity that is planned, funded and accountable on a UK wide basis and therefore cannot be allocated to a specific nation.
Unaudited and Disclaimed Data – English Local Government Further Analysis
In 2024-25, of the 338 unaudited and disclaimed entities, 280 were English local government bodies. (2023-24: of the 280 unaudited and disclaimed entities in total, 224 were English local government bodies). The number of English local government bodies submitting unaudited and disclaimed data for WGA 2024-25 has increased by 56 compared with 2023-24.
Entities recorded as unaudited at the point of the WGA submission window closing would have subsequently completed their audits as they worked towards the English local government backstop plan. Using data collected by the Ministry of Housing, Communities and Local Government (MHCLG), the table below presents a breakdown of audit opinions of these entities at the point of the local government backstop date for 2023-24 and 2024-25.
At the point of the local government backstop date
| Opinion | 2024-25 | 2023-24 |
|---|---|---|
| Disclaimed audit opinion received by the local government backstop date | 127 | 108 |
| Qualified audit opinion received by the local government backstop date | 35 | 10 |
| Unmodified audit opinion received by the local government backstop date | 114 | 103 |
| Unaudited by the local government backstop date | 4 | 3 |
| Total Unaudited and Disclaimed English Local Government | 280 | 224 |
(The backstop date for 2024-25 was 27th February 2026; and 28th February 2025 for 23-24 accounts)
Recovery of Local Authority Audit Market Capacity
The Ministry of Housing, Communities and Local Government (MHCLG) is working to address pressures in the local government audit sector through a combination of short-term stabilisation measures and longer-term reform.
MHCLG has introduced the local audit backstop programme – a series of six statutory publication deadlines for audited opinions up to and including financial year 2027-28 – as they work to clear the local audit backlog and support the return to timely reporting. At the most recent backstop on 27 February 2026, 91% of opinions were published on time (compared with 84% at the first backstop and 87% at the second). A significant proportion of opinions continue to be disclaimed, and the focus will now shift to building audit assurance.
MHCLG is also in the process of establishing a new Local Audit Office (LAO) through the English Devolution and Community Empowerment Act. The purpose of the LAO will be to oversee local audit and simplify and streamline the current fragmented system so that there can be a return to timely financial reporting.
Audit Opinion
Disclaimed Audit Opinion
There are 4 primary types of audit opinions issued by auditors:
Unqualified Opinion: the financial statements present a true and fair view in all material respects, complying with relevant accounting standards. Qualified Opinion: material misstatements or limitations on scope are identified, but the issues are not pervasive – they are confined to specific areas and the rest of the accounts are reliable. Disclaimed Opinion: sufficient appropriate audit evidence is unobtainable to form an opinion, often due to a significant limitation on scope of the audit. Adverse Opinion: material misstatements are both significant and pervasive, meaning the financial statements do not give a true and fair view.
The WGA has received a disclaimed audit opinion for the third year running in 2024-25 due to the scale of missing, unaudited and disclaimed data. Though there has been significant improvement in the missing data position, the unaudited and disclaimed data position has deteriorated further in 2024-25. As outlined in the Unaudited and Disclaimed Data section and in line with HMT expectation, this was part of a legislative programme to recover local government audit capacity and restore local government to timely financial reporting.
Audit Qualifications
The 2024-25 WGA has been disclaimed, but if it had not been disclaimed, it would be qualified for the following reasons:
1) The boundary qualification arises as a result of WGA making a conscious policy choice to exclude certain bodies from consolidation.
In November 2022, the ONS reclassified English Further Education Colleges (FEC) to the public sector, with retrospective effect. HMT and DfE are continuing to work together on how the FECs can be consolidated in future.
The boundary qualification also reflects the treatment of Train Operating Companies (TOCs), which meet the criteria for inclusion within the WGA boundary for 2024-25. The financial information currently available for TOCs does not capture the full underlying economic position. In particular, assets and liabilities are either not consolidated into WGA or are recognised on a basis constrained by franchise agreements, whereby lease liabilities, right-of-use assets and pension obligations are reflected only over the remaining franchise term rather than at full value. As a result, the use of available financial data leads to an understatement of the scale of TOC activity within WGA.
2) WGA has also been qualified due to inconsistent application of accounting policies. The qualification mainly relates to different methods used in valuing infrastructure assets.
The largest difference remaining is the valuation of the local authority road network which will remain as a qualification in the medium term. This also includes Scottish Water infrastructure assets.
3) The non-coterminous year-ends qualification mainly relates to the inclusion of academy schools which have a year end of 31 August, as opposed to the 31 March date used by WGA. This has led to a long-standing qualification for WGA. HM Treasury has now developed a new methodology to assess the impact of this timing difference for the academies sector.
a) Following approval from NAO, this work demonstrates that the impact on the Statement of Comprehensive Net Expenditure is not material to WGA. As a result, the income element of the qualification has been successfully removed – representing a significant and tangible improvement. The element of the qualification relating to expenditure and the Statement of Financial Position will remain for 2024-25
Underlying Qualifications
WGA has historically been qualified where there are qualifications in component accounts which, individually or in aggregate, are material to WGA.
There were no material qualifications in any component bodies in 2024-25 in either the current year or comparative figures, and as such this qualification has been removed from WGA.
Economic and Fiscal Context
This section provides a forward-looking commentary on the Treasury’s overall approach to managing the financial position and fiscal risk, including information on the economic and fiscal outlook between 2026 and 2031 as published by the Office for Budget Responsibility (OBR) in its March 2026 Economic and Fiscal Outlook (EFO).
Fiscal Outlook
The government set out its fiscal strategy at the 2024 Budget, with an emphasis on improving the public finances while continuing to support investment. This approach includes measures aimed at reducing borrowing and providing greater predictability in fiscal policy, including the decision to hold one major fiscal event per year to support certainty for households and businesses.
The Office for Budget Responsibility’s (OBR) Spring Forecast indicated that the government remains on track to meet its fiscal rules. Headroom against the stability rule (the fiscal mandate) in 2029-30 increased from £21.7 billion to £23.6 billion, after taking account of additional policy pressures announced since the Budget, including funding for the Special Educational Needs (SEND) system. Headroom against the investment rule also increased, reaching £27.1 billion. The level of headroom provides capacity within the fiscal framework to absorb potential economic risks.
Figure 24: Public Sector Net Borrowing and Current Budget Deficit (£ Billion)
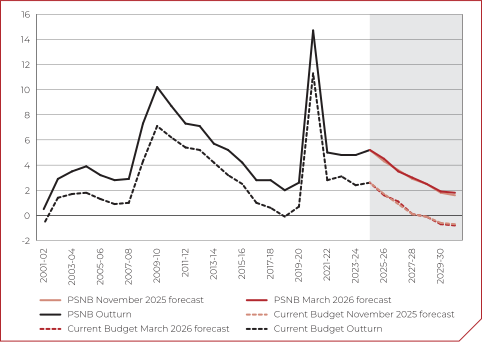
Source: Office for Budget Responsibility, Economic and Fiscal Outlook March 2026, page 76
In addition to meeting its fiscal rules, the government considers a wide range of metrics to inform a full assessment of the sustainability of the public finances. Public sector net debt as a share of GDP is lower every year compared to the Budget forecast and is forecast to fall in the final year of the forecast, from 96.3% of GDP in 2028-29 to 95.1% of GDP in 2030-31. Public sector net worth – the difference between the value of all public sector assets (financial and non-financial) and liabilities – is expected to strengthen from (64.2)% of GDP in 2025-26 to (59.6)% of GDP in 2030-31.
Economic Outlook
Inflationary pressure gradually eased over 2025-26, with CPI inflation remaining at 3.0% in January and February, before rising to 3.3% in March, reflecting higher oil prices following the recent Middle East conflict. In 2025-26 CPI inflation was 3.5%, compared to 2.4% in the previous financial year 2026. Despite this, easing inflation over 2025-26 allowed the independent Monetary Policy Committee to cut the Bank rate 3 times across 2025-26. At Budget 2025, the government took action to bear down on prices – estimated by the OBR to bring inflation down by 0.4 percentage points in 2026-27, with some of these impacts being reflected in April’s inflation data which showed a fall to 2.8%. However, the Middle East escalation has materially shifted the UK inflation outlook, with a return to target in 2026 now significantly less likely. The April Monetary Policy Report forecast 3 scenarios leading to a rise in inflation to between 3.3% and 4.5% in 2026.
While recent data has pointed to weakening demand in the labour market it remains strong by historical and international standards. The unemployment rate was 5.0% in Q1 2026, while youth unemployment was 16.2%. The government is tackling inherited long term structural issues such as youth employment, through a major youth employment drive including £2.5 billion total investment into the Youth Guarantee and the Growth and Skills Levy over the next 3 years. Looking ahead, the OBR expect the level of employment to rise in every year of the forecast, reaching 35.3m in 2030-31. The OBR forecasts unemployment will peak in 2026, before falling in every year of the forecast to reach 4.1% in 2030.
In this Parliament, real household disposable income (RHDI) per capita has grown by 2.1%. Expectations of labour market loosening and lower inflation have contributed to the OBR forecasting rising living standards between 2026 and 2030. Annual RHDI per person is now set to rise by £1,000 overall by the end of the Parliament. Real wages have grown more since the start of this Parliament than in the decade from May 2010 and the OBR now forecasts average annual real wage growth to be 0.7% between 2025 and 2030.
The economy is now 2.3% larger than it was at the beginning of this Parliament. GDP grew by 1.4% over 2025, below the OBR’s forecast (1.5%), but the fastest among European G7 countries over 2025. The latest GDP data has shown that the economy was in a stronger place before rising tensions in the Middle East, with growth of 0.6% in Q1 2026. Whole economy investment rose by 4.9% between Q1 2026 and the start of the Parliament (Q2 2024) driven by higher government investment and resilient private investment, which are now 12.5% and 3.6% above their pre-election levels respectively. The OBR forecasts growth will be slightly slower in 2026 at 1.1%, before increasing to 1.6% in 2027 and 2028, followed by a return to 1.5% in 2029 and 2030. Average annual real GDP growth over the OBR’s March 2026 forecast period (2026 and 2031) remains 1.5%.
Figure 25: Quarterly Real GDP Growth
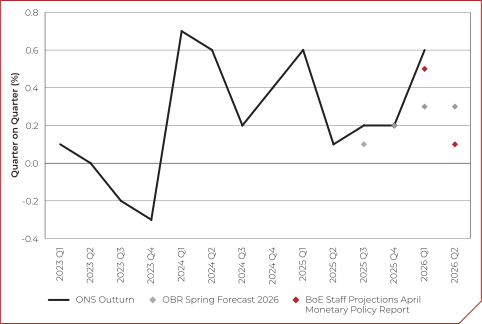
Source: Office for National Statistics, Office for Budget Responsibility, Bank of England
Public Sector Risk Management
Fiscal Risks and Sustainability
The government is committed to ensuring the public finances are sustainable for the long term. Fiscal sustainability is important because it reduces the burden passed on to future generations, allows the public sector to support households and businesses when economic shocks occur, supports lower government borrowing costs, and helps to drive economic growth by strengthening stability and confidence in the UK.
The OBR’s Fiscal Risks and Sustainability (FRS) report, published in July 2025, assessed risks to the public finances associated with the pensions system, the public sector balance sheet and climate change. The OBR also provided an update of its fiscal risk register.
At Autumn Budget 2025, sets out the actions the government is taking to improve fiscal sustainability over time and address long-term sustainability challenges, including:
- The government’s medium term fiscal strategy to reduce borrowing and debt: as set out in the section above, at the Spring Forecast the OBR forecast that the government has increased headroom against both its stability and investments rules.
- Setting non-negotiable fiscal rules: the rules keep debt on a sustainable path while supporting growth enhancing investment.
- Reforms to the fiscal framework: including legislating for a fiscal lock to ensure all fiscally significant measures are subject to independent OBR assessment, as well as requiring the OBR to report on the long-term economic impacts of capital investment and government policies.
- Maintaining public investment at its highest level in four decades: this is supported by over £120 billion of additional departmental capital spending in the short to medium term. The OBR estimates that sustaining this investment could raise the level of GDP by over 0.4% after 10 years and 1.4% over the long term.
- Strengthening balance sheet management: broadening the debt measure used in fiscal rules to capture all financial assets and liabilities recognised in the national accounts and establishing a new Financial Transaction Control Framework to manage the stock of financial assets. Budget 2025 went further on this by introducing further reforms to balance sheet management, including the new Balance Sheet Framework and updated guidance on managing the government’s implicit liabilities.
- Acting now to address long-term sustainability challenges: This includes, but is not limited to, areas examined by this year’s FRS. For example, the government has taken action to strengthen the tax base by introducing Electric Vehicle Excise Duty (eVED) to respond to the long-term decline in fuel duty receipts, which the OBR noted in the FRS is the “single-largest component of the fiscal cost of net zero across both tax and spending”.
Management of Departmental Risks
Risk Management in Government
Risk Management in government is largely devolved as part of broader governance and decision-making arrangements. Risks are managed in and across departments (and public bodies) with ownership, responsibility and escalation to ministers and Cabinet as an integral part of accounting officer, executive and non-executive board and ministerial accountability structures. Centrally, the Heads of Department Board, related boards and some specialist committees consider risk relating to items they address and the decisions they are making/ shaping. Risk-related support is provided locally and centrally by functions, professions and specialists teams led from the centre of government, who set functional standards, design cross-government frameworks and provide degrees of oversight over local capability and performance (of which risk-related aspects are integral). Internal and external auditors review risk considerations as part of their audit work and occasionally deliver audits specifically focused on risk management.
Government’s Risk Centre of Excellence (Risk COE)
The Risk COE supports risk management activity to different degrees in all the above areas in order that appropriate risk can be taken by others in pursuit of opportunity. It is not a function (it is housed in the Government Finance Function in HM Treasury) and has very limited management levers over local risk management and the central functions, teams and committees. The Head of the Government Risk Profession leads the Risk COE which has stewardship of the Orange Book and provides tools and advice to help others with practical implementation. It curates and creates training and runs networks, newsletters and events for a cross-government community of over 2,000 risk specialists.
The Risk COE has line of sight over the risk-related activities (and guidance) of functions, professions and specialist teams at the centre of government. It maintains the Central Government Assurance Directory which is intended to help accounting officers in departments and public bodies understand all the codes, guidance (including all coloured books) and functional standards issued from the centre of government, that they are expected to adhere to. The Risk COE provides consulting-style projects to individual departments to help them with their specific priorities in a time-boxed way. Where requested, the Risk COE also provides risk management services to the centre of government in support of specific government delivery priorities or specific requests from cross-government boards such as the Heads of Department Board.
Departmental Disclosure
Departments are required to disclose their approach to risk management, including having appropriate assurance, in their annual Governance Statements (part of Annual Accounts) where they confirm compliance with Orange Book (principles for the management of risk) or explain any departure from the principles.
Residual Public Sector Risks
The public sector has a constructive obligation to respond to a variety of acute risks occurring in the wider economy. These risks are scoped and measured in the National Risk Register, published by the Cabinet Office.[footnote 18] This document measures the impact of possible events in severity of financial impact and casualties. The management of these risks falls to the relevant departments in line with the risk management procedures outlined above.
Conrad Smewing
Accounting Officer
11 June 2026
Further Reading and Related Publications
Public Expenditure Statistical Analysis (HMT)
More detailed analyses of public expenditure than can be found in WGA, including spend per head in different regions of the UK.
Managing Public Money (HMT)
Guidelines for public sector entities regarding prudent management of taxpayer funds, informing the approach to broader governance and specific financial processes.
Office for Budget Responsibility (OBR) Publications
The public sectors fiscal activities are scrutinised by the OBR in a variety of publications, including the bi-annual ‘Economic and Fiscal Outlook’.
Parliamentary Accounts Committee (PAC) Reports
PAC scrutinises public sector finances directly in hearings and correspondence with relevant departments officials and issuing reports and recommendations.
National Audit Office (NAO) Value-For-Money Reports
Alongside issuing audit certificates, which verify that financial statements are free from material error, the NAO publishes reports on the efficiency of government spending.
4. Statement of Accounting Officer’s Responsibilities
Under section 9 of the Government Resources and Accounts Act 2000 (the GRAA), HM Treasury is required to prepare, for each financial year, a consolidated set of accounts for a group of entities, each of which appears to HM Treasury:
- To exercise functions of a public nature, or
- To be entirely or substantially funded from public money
The account is prepared on an accruals basis and in accordance with the GRAA and the 2024-25 Government Financial Reporting Manual (FReM) which applies International Financial Reporting Standards (IFRS) as adapted or interpreted for the public sector. The accounts must give a true and fair view of the whole of government’s finances.
In preparing the accounts, the Accounting Officer is required to comply with the requirements of the FReM, and in particular to:
- Observe the relevant accounting and disclosure requirements and apply suitable accounting policies on a consistent basis
- Make judgements and estimates on a reasonable basis, including those judgements involved in consolidating accounting information provided by different sectors
- State whether applicable accounting standards, as set out in the FReM, have been followed, and disclose and explain any material departures in the accounts
- Prepare the accounts on a going concern basis
In addition to these responsibilities, and specifically with regard to Whole of Government Accounts (WGA), the Accounting Officer is responsible for:
- Drawing up WGA in accordance with the GRAA
- Ensuring that WGA complies with the FReM and generally accepted accounting practice
- Agreeing the process of producing WGA and for ensuring that relevant data are collected and accurately and appropriately processed
- Ensuring that there is an appropriate control environment for the production of WGA
The responsibilities of an Accounting Officer are set out in Managing Public Money, published by HM Treasury and include the need for efficiency, economy, effectiveness, and prudence in the administration of public resources to deliver value for money.
The WGA Accounting Officer is responsible for signing the WGA Governance statement. This sets out the governance framework which supports the process of preparing and publishing the consolidated accounts, in line with the responsibilities outlined above. For each individual entity consolidated into WGA, the Accounting Officer or their equivalent retains responsibility for that entity’s governance arrangements, as documented through the Governance Statement for those bodies.
5. Governance Statement
5.1 Disclaimed Opinion in WGA 2024-25
For the third time in its 16-year history, WGA has received a disclaimed audit opinion from the C&AG. This means that, due to missing data not submitted by bodies within the boundary and data submitted which has not been audited, the C&AG has not been able to obtain sufficient appropriate audit evidence to provide a basis for an audit opinion on these financial statements. The details of the disclaimer are set out in the C&AG report. HMT recognises the severity of this matter and has taken action to limit the impact of missing and unaudited data on WGA.
HMT has limited direct influence on the issues faced by the local government accounting and audit sector, which is the thing that is primarily driving the data integrity issues in WGA. Non-submitting and unaudited entities are concentrated in English local government, where administrative pressures introduced by the Covid-19 pandemic and challenges in local authority financial reporting and audit have severely delayed the preparation of accounts and subsequent audits. Despite having limited direct influence, HMT is strongly supportive of, and working proactively with, stakeholders working towards the resolution of these issues, such as MHCLG, the NAO and others. HMT is confident that by working together with these bodies, an effective and sustainable solution can be found to prevent reoccurrence of these issues in future. More detail on the impact of missing data and several measures being taken to reverse this position in future WGAs, can be found in the missing data section.
In December 2024, MHCLG set out its strategy to overhaul the local audit system. The strategy outlined a clear purpose for local audit and its users, consultation on proposals for simplified and proportionate financial reporting, improvements to the market’s capacity and capability, and ways to build strong relationships between local bodies and auditors. Furthermore, in April 2025, it announced 16 further commitments to streamline and fix the fragmented system. The department is in the process of creating the Local Audit Office (LAO) by Autumn 2026 to oversee local audit, as recommended by the independent Kingman and Redmond Reviews. Strategic objectives for the LAO, underpinned by a clear remit, were introduced in the English Devolution Bill passed in April 2026. MHCLG’s strategy outlines the role of LAO to be the establishment of a statutory and independent LAO, with 5 strategic responsibilities – coordinating the system, contract management, ownership of the Code of Audit Practice, quality oversight and reporting.
Some measures being taken by MHCLG, supported by wider stakeholders, to address these issues include:
- A series of audit backstop dates, requiring non-NHS bodies to publish audited local government accounts by set deadlines. These are as follows: For 2024-25 accounts 27th February 2026. For 2025-26 accounts 31st January 2027. For 2026-27 accounts 30th November 2027. For 2027-28 accounts 30th November 2028.
- Additional funding to support backlog clearance and rebuilding assurance (notably £49m of grant support, delivered in stages and linked to conditions such as publication of accounts and payment of audit fees).
- Measures to improve audit market capacity and resilience, including reducing reliance on a small number of firms and considering options such as public provision to strengthen capacity.
Some measures being taken by HMT, supported by wider stakeholders, to address these issues include:
- Proactive engagement with submitting entities to ensure queries are addressed quickly and facilitate timely submission of WGA returns. This is evidenced by the significant reduction in missing entity returns to 145 in 2024-25.
- Engagement with MHCLG colleagues to mitigate the risks around non-submission of data and unaudited data.
The impact of missing data on specific balances has been highlighted in each of the Notes to the Financial Statements, as missing data has a varied impact on different types of balances and transactions. The estimated percentage missing data is assets 4.1%, liabilities 1.0%, income 2.9% and expenditure 3.6%. The reader is encouraged to review these paragraphs for their areas of interest in WGA to understand missing data impact.
Despite being disclaimed, HMT is confident that WGA remains a useful tool for management of public finances and for government transparency, and that WGA still fulfils its unique role. The disclaimed opinion does not indicate that WGA is no longer useful or of low quality, only that the NAO cannot form an audit opinion on the financial statements in line with International Standards on Auditing (ISAs).
5.2 Scope of Accounting Officer’s Responsibility
As Accounting Officer, I am responsible for maintaining a governance framework to support the efficient and effective production of the Whole of Government Accounts (WGA). The framework is designed to minimise the risks to the process of preparing and publishing the consolidated accounts. The accounts of individual entities consolidated within WGA are subject to their own governance frameworks including Accounting Officer or equivalent controls.
The framework is intended to manage risk to a reasonable level rather than to eliminate all risk of failure to the consolidation and preparation process. It provides reasonable, but not absolute, assurance of effectiveness. The governance framework is based on an ongoing process, designed to identify and prioritise the risks, to evaluate the likelihood of those risks being realised and the impact should they be realised, and to manage them efficiently.
Publication of WGA is managed within HM Treasury’s overall risk management framework, which is set out in the department’s annual report and accounts. The Deputy Director for Government Financial Reporting is responsible on a day-to-day basis for managing risk and for ensuring that the activities necessary for the production of these accounts are properly planned, resourced and performed.
HM Treasury has put in place a risk management framework to manage the key risks to the WGA consolidation and preparation process. This includes maintenance and regular review of a risk register to assist in identifying and implementing mitigating actions. HM Treasury also maintains a control and validation framework to define the controls over the preparation of the accounts and to monitor the effectiveness and completeness of the controls in place.
In producing WGA, I must rely on the Accounting Officer (or equivalent) of each entity to manage their own risks. In some instances, the risks from underlying accounts may have a significant impact on the WGA consolidation and preparation process. The key risks in the preparation of WGA, and any corresponding changes for 2024-25 are summarised below:
- Failure to provide data through submission of WGA returns or providing data which has not been audited
- A significant number of entities failed to submit consolidation data for WGA by the date on which consolidation work began, and submissions for 2024-25 were closed. Non submission of data remains a serious issue for WGA 2024-25, which has led, for the third time in WGA history, to a disclaimed audit opinion. Action taken to date means that missing data is reducing, and indeed has reduced significantly to 145 entities in 2024-25, but unaudited data is expected to keep rising while we work through resolving challenges in the local audit market.
- WGA 2024-25 and 2025-26 submission deadlines have returned to pre-recovery-plan timeframes.
- A number of entities also submitted consolidation data for WGA but the data was unaudited. These entities were primarily local government entities and systemic issues in the local government audit sector have led to a backlog of outstanding audits.
- HM Treasury continues to work closely with component entities to prioritise timely submission of data returns for 2025-26 and future years and will continue to look at how we can try to minimise the administrative burden of submitting data for WGA. There are systemic issues in the local government audit sector which have led to a backlog of outstanding audits, and this issue is expected to continue for WGA in future years. These issues are not due to a specific failure in HMT controls but are due to the systemic issues in the local government audit sector. For further details on the missing data issues, see Note 1.3 and the Performance Report.
- Quality of WGA impacted by qualifications in underlying accounts
- When a set of accounts is disclaimed, the auditor will not qualify the accounts in the same way as if it had not received a disclaimed opinion. Whilst there are qualifications in the underlying accounts of a number of entities in the WGA boundary, it is HMT’s opinion that no underlying qualifications, individually or in aggregate, are material to WGA for the current year.
As Accounting Officer I am responsible for maintaining the necessary controls and processes to support the IT systems that deliver WGA. WGA data is collected, processed and reported using the OSCAR system. I have maintained relevant controls to ensure this system is secure and data integrity is maintained. I am also responsible for ensuring there are processes in place to resolve issues and to improve the performance and usability of the system.
The WGA governance framework has been in place for the year ended 31 March 2025 which this account reports on and the full period of account preparation up to the date of approval. The governance framework accords with HM Treasury guidance, including the ‘Corporate Governance in Central Government: Code of Good Practice’, to the extent that it applies to WGA.
Where risks relevant to WGA preparation can be managed internally, HMT has developed robust procedures for doing so. The majority of historic qualifications in WGA, which would have remained in 2024-25 if not for the disclaimed opinion, are due to factors outside of the control of HMT. HMT does however engage with external stakeholders to understand how and when the drivers behind issues may be resolved.
5.3 The WGA Governance Framework
I receive support and assurance on the management of risks in a number of ways:
The HM Treasury Group Audit and Risk Committee, chaired by a non-executive member and supported by the Treasury’s internal audit function, reviews the department’s approach to internal control and provides independent advice, with oversight of financial reporting and risk management activities associated with WGA.
The Government Internal Audit Agency (GIAA) is available to provide support if the Audit and Risk Committee and I assess that the additional assurance provided by an internal audit engagement is required.
As well as the internal framework of governance and risk management, the WGA is subject to external audit provided by the Comptroller and Auditor General, supported by staff from the National Audit Office (NAO). The Comptroller and Auditor General is independent and reports his findings on the accounts to Parliament. The Comptroller & Auditor General does not provide assurance to me, but the work of his staff supports my assessment of risks. More information about the respective responsibility of the auditor and preparer can be found in the Comptroller and Auditor General’s audit certificate. The Comptroller and Auditor General and his staff have access to all HM Treasury papers and NAO staff attend HM Treasury’s Audit and Risk Committee.
5.4 How WGA is Prepared
WGA is a uniquely complex undertaking and is unlike accounts in most private sector organisations. This section provides more information on the stages of WGA preparation.
Data Collection
There are a wide range of entities consolidated into WGA. These include central government departments, local government bodies, entities in the devolved administrations of Scotland, Wales and Northern Ireland, and public corporations.
The data that makes up WGA is largely based on the information included in each entity’s audited financial statements, which are published at different times. Historically, central government departments aimed to publish their accounts prior to that year’s summer recess (summer closure of Parliament), English local government bodies aimed to publish their finalised accounts by July, and devolved administrations have their own reporting timetables, based on the requirements of local accountability and oversight bodies. It is not possible to prepare WGA until the vast majority of these entities have finalised their financial statements.
The format of financial statements varies across the UK public sector. In order to be consolidated into WGA, entities have to provide audited data in a standardised format using a data collection tool provided by the Treasury. The data collection tool covers the whole of an entity’s group. Over 10,000 entities were designated for inclusion in WGA, but due to group level consolidations required for WGA 2024-25, data collection returns were requested for 662 entities, of which returns were received for 517 entities.
Not every entity in the public sector is consolidated into WGA. There are some very small stand-alone entities (below £30 million) which are not consolidated and the Treasury publishes a list of these entities alongside WGA on gov.uk. Finally, there are some entities which are part of the public sector but are not answerable to the Executive function of government that are also excluded from WGA. These include entities such as the Crown Estate, the NAO and English Further Education Institutions. The Treasury also publishes a list of these entities alongside WGA on gov.uk.
Adjustments and Eliminations
In order to produce WGA, transactions between entities have to be eliminated. Individual entities may recognise income originating from other government entities, with the other entity recognising an expense of the same amount, both of which need to be removed from the WGA reporting. An example of this is government grants where a department may pay a grant to a local authority – the department will have an expense in their WGA return and the local authority will have income, both of which need to be eliminated. In doing so, HMT ensures that assets, liabilities, income, and expenditure are not overstated, and the only transactions and balances reported in WGA are between government and the external economy. There are a vast range of transactions within the public sector and the data collection tool asks entities to provide details of all their transactions with other WGA entities.
Many transactions can be quickly eliminated based on returns in the data collection tool. Others require investigation because the transactions reported by two entities do not match. Sometimes this is due to legitimate differences of opinion on how to treat a transaction, on some occasions it is due to incomplete information in one counterparty, or it can be because one counterparty has made an error in the data collection tool.
As part of the WGA preparation process, the Treasury reviews and adjusts transactions between WGA entities until the difference in what is reported by entities (known as the ‘eliminations error’) is at an acceptable level. There are four criteria by which we monitor the level of eliminations error. These criteria relate to the levels of both debit and credit transactions which remain uneliminated for both the Statement of Financial Position (SOFP) and the Statement of Revenue and Expenditure (SORE). Each are maximum possible impacts, i.e. levels of “uncertainty”, with the actual “error” being anywhere between zero and these figures. For the 2024-25 WGA the final elimination errors in the SOFP were £2.9 billion (2023-24: £1.7 billion) for debit transactions and -£3.5 billion (2023-24: -£2.1 billion) for credit transactions. The final elimination errors in the SORE were £2.9 billion (2023-24: £2.9 billion) for debit transactions and -£3.2 billion (2023-24: -£2.5 billion) for credit transactions.
| £ Billion | SOFP Debit | SOFP Credit | SORE Debit | SORE Credit |
|---|---|---|---|---|
| Starting Point | 251.4 | (224.7) | 327.8 | (117.3) |
| HM Treasury Journal Corrections | (248.5) | 221.2 | (324.9) | 114.1 |
| Eliminations ‘Error’ as per WGA | 2.9 | (3.5) | 2.9 | (3.2) |
Analytical Review
Once the intra-governmental transactions have been eliminated, the Treasury moves on to a process called ‘analytical review’. Analytical review is the process of analysing and interrogating the financial data to ensure its integrity and investigate variances and significant balances and transactions. In carrying out the analytical review the Treasury also focuses on ensuring that trends in the data are understood, which supports the analysis provided in the Performance Report and provides useful data that is shared with other bodies to support broader development of public policy and statistics.
5.5 How WGA is Being Used
The WGA is a long-established and internationally distinctive publication, providing a comprehensive view of the UK public sector’s financial position. Its longevity and consistency over time facilitate meaningful analysis of fiscal trends, offering a unique evidence base that supports transparency and informed decision making across government.
The WGA plays an important role in parliamentary scrutiny. The Public Accounts Committee (PAC) and other select committees use WGA to examine the sustainability of the public finances, assess the government’s management of assets and liabilities and challenge departments on financial risks. By bringing together data from across the public sector on a consistent basis, WGA supports Parliament in holding government to account and strengthens oversight of long- term fiscal pressures.
The value of WGA has been further enhanced in recent years through ongoing improvements to its accessibility, transparency and analytical depth. The introduction of the WGA Handbook has supported greater accessibility for users by providing an accurate summary of the public sector financial position whilst signposting readers to the detail in the full version. At the same time, developments in the performance report, namely the introduction of 5- year time series analysis alongside insights into new areas of the public sector balance sheet, have strengthened insights into trends over time, enabling a more robust understanding of changes in the government’s financial position.
Within HM Treasury, WGA data is used extensively to inform fiscal risk analysis and policy development. It underpins key publications, including the Managing Fiscal Risks report and the Balance Sheet Review (BSR), and is used internally by teams such as the Local Government Spending team to support analysis of sector-specific risks and trends.
The publication and its underlying dataset are also used more broadly across the public sector and by external stakeholders, including:
- The Office for National Statistics (ONS): The ONS uses WGA data in one-off analytical articles and to support the compilation of wider datasets, including the public sector finances dataset, ensuring consistency with the IMF’s Government Finance Statistics framework.
- The Office for Budget Responsibility (OBR): The OBR draws on WGA data in its Fiscal Sustainability Report and Fiscal Risks Report to independently assess the long-term sustainability of the public finances. The government, in turn, responds to these assessments through publications such as Managing Fiscal Risks.
- The Chartered Institute of Public Finance and Accountancy (CIPFA): As the professional body responsible for the local government accounting framework, CIPFA uses WGA data within its CIPFA Stats, providing an independent and comprehensive source of data on local government finances and services.
- Professional bodies: Organisations such as the Association of Chartered Certified Accountants (ACCA) and the Institute of Chartered Accountants in England and Wales (ICAEW) have used WGA data to produce independent analysis and commentary on public sector financial management.
- UK Government Investments (UKGI): WGA data has been used in their financial transactions report.
Through its breadth of coverage and consistency over time, WGA provides a shared evidence base that supports scrutiny by Parliament, informs decision-making within government and enables wider stakeholders to assess the long-term sustainability of the UK’s public finances.
5.6 Qualifications
The 2024-25 WGA audit opinion has been disclaimed, but if had not been disclaimed, it would be qualified as a result of issues relating to the boundary, non-coterminous year ends and accounting policies applied by the Treasury when carrying out the WGA consolidation.
Qualifications From the Consolidation Process
WGA 2024-25 would have received qualification arising from the consolidation process if it had not received a disclaimed opinion. Those qualifications relating to the boundary, accounting policies and non-coterminous year ends and are summarised below:
The Boundary Qualification arises as a result of WGA making a conscious policy choice to exclude certain bodies from the consolidation. Previously, the largest of the bodies to be excluded was NatWest. The scale and nature of NatWest’s activities would have distorted the picture of UK finances. NatWest was classified as in the private sector by the ONS effective from 1 July 2024 and this element of the qualification was removed in WGA 2023-24 as the government does not exercise control over NatWest. In November 2022, the ONS reclassified the further education (further education colleges, sixth form colleges and designated institutions) in England to the public sector, with retrospective effect. These entities may be consolidated into WGA at a future date.
The boundary qualification also reflects the treatment of Train Operating Companies (TOCs), which meet the criteria for inclusion within the WGA boundary for 2024-25. The financial information currently available for TOCs does not capture the full underlying economic position. In particular, assets and liabilities are either not consolidated into WGA or are recognised on a basis constrained by franchise agreements, whereby lease liabilities, right-of-use assets and pension obligations are reflected only over the remaining franchise term rather than at full value. As a result, the use of available financial data leads to an understatement of the scale of TOC activity within WGA. It is estimated that this results in an understatement of approximately £13.5 billion of assets, £11.7 billion of liabilities, £8.4 billion of income and £10.1 billion of expenditure. These estimates are high-level and based on currently available data.
The qualification on Inconsistent Accounting Policies mainly relates to different methods used in valuing infrastructure assets. The largest difference remaining is the valuation of the local authority road network which will remain as a qualification in the medium term. This also includes Scottish Water infrastructure assets. Note 1 to the accounts provides further details.
The Non-Coterminous Year Ends qualification mainly relates to the inclusion of academy schools which have a year end of 31 August, as opposed to the 31 March date used by WGA. HM Treasury has developed a new methodology to assess this impact, and – following NAO approval – has concluded that the effect on income in the Statement of Comprehensive Net Expenditure is not material. Consequently, this element of the qualification has been removed, although the qualification will remain for expenditure and the Statement of Financial Position in 2024-25.
In addition, both missing data and unaudited data would have remained qualifications had they not led to a disclaimed opinion. Further information is provided below:
A qualification due to the Number of Bodies For Which Consolidation Data Was Requested But Not Received. As a result, these bodies are not consolidated into WGA 2024-25. The majority of missing entities are English local government bodies. As noted above, this is a matter I am taking very seriously. Note 1 to the accounts provides further details. This was a new qualification in 2020-21.
The qualification on Consolidation of Components Whose Accounts Have Not Been Audited relates to the consolidation of draft accounts data for a number of local authorities whose statutory audits have not yet concluded. In the absence of a component audit opinion, the C&AG was unable to obtain sufficient assurance. This was a new qualification in 2019-20 and was the result of delays in local authority audits.
Further details on the boundary and accounting treatment of infrastructure assets are included in the critical accounting estimates and judgements in Note 2 to the accounts. Further details on the qualification arising from the academies sector are included below.
5.7 WGA and The Academies Sector
Academies have a financial year which aligns with the academic year. The Department for Education (DfE) has alternative reporting arrangements for the academies sector as agreed with the Treasury and Parliament. The DfE core department, its agencies and arm’s length bodies prepare one set of accounts to 31 March. The academies sector prepare a separate sector account, to a year end of 31 August (known as the Sector Annual Report and Accounts, or SARA). This data creates a non-coterminous year end misalignment with the rest of WGA, and this in turn leads to a qualification to WGA.
It is not currently practical to change the Academies year end to 31 March, as this will cause significant disruption to the sector, and cause misalignment between the internal activities of academies (which would normally be planned over the course of an academic year) and financial reporting and planning.
The key challenge in assessing the size of the non-coterminous year end misalignment is to determine how similar or different a 31 March balance would be to the 31 August balance from 7 months earlier, which is the balance consolidated into WGA. Balances such as property, plant and equipment tend not to fluctuate during the year. Where this type of balance has increased during the year, the value part-way through the year is likely to be somewhere between the balances at the beginning and end of the year. The total movement over the year as an estimate of the maximum error between the balances at 31 August and the following 31 March.
The balance as at 31 August 2023 was £68.4 billion and this was included in the 2023-24 WGA. From the 2023-24 SARA, we now know that the 31 August 2024 balance was £74.9 billion (which has been included in this 2024-25 WGA) and the restated balance as at 31 August 2023 was £67.5 billion. The balance as at 31 March 2024 is likely to be in between those two figures, giving an estimated maximum error of £7.4 billion on this year’s figure. In a similar manner we can estimate the maximum error for other balance sheet items at 31 March 2025.
Balances such as cash may vary more within a year. Given the size of these balances, a material difference between 31 August and 31 March balances is not anticipated.
Welsh and Scottish Further Education colleges are included in WGA but English Further Education colleges are not included. DfE ran a pilot through 2024-25 and 2025-26 to test an approach to data collection and financial reporting for FE colleges that meets agreed principles, including exploring consolidation within WGA. Ministers have also agreed that DfE will carry out a dry run of this approach for the 2026-27 financial year for implementation in 2027-28.
Comparing Balance Sheet Positions – 31 March 2024
| Item (£ Billion) | SARA balance 31 August 2024 (included in the 2024-25 WGA) | SARA balance 31 August 2023 (included in the 2023-24 WGA) | Estimated Maximum amount of variance between 31 August and 31 March |
|---|---|---|---|
| Property plant and equipment | 74.9 | 67.5 | 7.4 |
| Cash and cash equivalents | 6.6 | 6.9 | n/k |
| Other assets | 2.3 | 2.3 | – |
| Pension liability | (0.8) | (1.2) | n/k |
| Other liabilities | (4.0) | (3.8) | (0.2) |
Source: SARA 2023-24
5.8 Balancing Timeliness, Quality and Cost Effectiveness of Data
While there have been improvements in the quality of WGA over time, a number of qualifications would have remained in the absence of a disclaimed opinion being given.
In preparing WGA, I must balance the timeliness, cost effectiveness and quality of the accounts. This is not a simple task at the scale of WGA. Spending significant additional public money to provide changes to WGA reporting and disclosures has to be carefully considered. While I am committed to improving WGA, it is important to acknowledge that some of the issues outlined above may not have a cost-effective or practical solution. Where I determine this to be the case, I will consider how supplementary disclosures or information can be used to improve the quality of the accounts.
I have made a similar judgement regarding the balance between timeliness and quality when considering the cut-off point for data collection.
I have assessed that the recovery timetable submitted to the Parliamentary Accounts Committee (PAC) remains a viable schedule to return to regular yearly production of WGA, as can be assessed by the submission deadlines for data and publication dates for WGA. The recovery plan was a gradual return to ‘business as usual’ over five WGAs, all of which have now been delivered, with all milestones being met on time.
5.9 Assurance in Making This Judgement
I have assessed the WGA compliance with the Corporate Governance in Central Government Departments Code of Good Practice. I believe that we comply with the provisions of the Code that are relevant to my responsibilities to prepare WGA.
I am satisfied that there is no additional remedial action to improve the quality of the data at this present time. Some improvements are currently in progress. Because lessons are being learned after the accounts of the previous year have been completed, improvements may take several years to be implemented fully.
I have considered the evidence that supports this Governance Statement and I am assured that the Treasury has a strong framework of controls to support the production of WGA.
5.10 Information and Data Handling
In preparing WGA, HM Treasury does not collect any personal data from WGA entities. WGA data collected from WGA entities are held on HM Treasury’s Online System for Central Accounting and Reporting (OSCAR) database.
5.11 Disclosure of Information To Auditors
As Accounting Officer, I confirm that there is no relevant audit information of which the NAO is unaware. I have taken all the necessary steps to make myself aware of any relevant audit information and to establish that the NAO is aware of that information.
I confirm that this annual report and accounts 2024-25 is, as a whole, fair, balanced and understandable. I take personal responsibility for the annual report and accounts, including the judgements required for determining that it is fair, balanced and understandable.
Conrad Smewing
Accounting Officer
11 June 2026
6. Financial Statements
6.1 Statement of Revenue and Expenditure For the Year Ended 31 March 2025
| Note | 2024-25 | 2023-24 | |
|---|---|---|---|
| £bn | £bn | ||
| Taxation revenue | 4 | (926.5) | (888.8) |
| Other revenue | 5 | (155.9) | (131.1) |
| Total public services revenue | (1,082.4) | (1,019.9) | |
| Social security benefits | 6 | 334.3 | 311.4 |
| Staff costs | 7 | 260.1 | 240.5 |
| Purchase of goods and services | 8 | 309.0 | 263.7 |
| Grants and subsidies | 9 | 83.3 | 104.1 |
| Depreciation and impairment | 10 | 63.9 | 64.2 |
| Interest costs on government borrowing | 11 | 66.7 | 63.4 |
| Increase/(decrease) in provisions | 23 | 22.8 | 29.0 |
| Total expenditure on public services | 1,140.1 | 1,076.3 | |
| Net expenditure on public services | 57.7 | 56.4 | |
| Financing costs of long-term liabilities, including discounting | 11 | 142.0 | 82.9 |
| Revaluation of financial assets and liabilities | 8.0 | 7.3 | |
| Net (income)/expenditure for the year | 207.7 | 146.6 |
Notes 1 to 35 form part of these accounts.
6.2 Statement of Comprehensive Income and Expenditure For the Year Ended 31 March 2025
| 2024-25 | 2023-24 | |
|---|---|---|
| £bn | £bn | |
| Net (income)/expenditure for the year | 207.7 | 146.6 |
| Other comprehensive income and expenditure: | ||
| Net (gain)/loss on: | ||
| Revaluation of property, plant and equipment | (22.4) | (95.8) |
| Revaluation of intangible assets | (0.9) | (0.6) |
| Revaluation of assets measured at Fair Value through Other Comprehensive Income | (5.0) | 0.1 |
| Revaluation of pension scheme liabilities | (3.6) | (139.9) |
| Other comprehensive (income)/ and expenditure | (31.9) | (236.2) |
| Total comprehensive (income)/ expenditure for the year | 175.8 | (89.6) |
Notes 1 to 35 form part of these accounts.
6.3 Statement of Financial Position As at 31 March 2025
| Note | 2024-25 | 2023-24 | |
|---|---|---|---|
| £bn | £bn | ||
| Non-current assets | |||
| Property, plant and equipment | 12 | 1,660.4 | 1,539.1 |
| Right of use assets | 13 | 27.3 | 28.0 |
| Investment properties | 14 | 15.5 | 14.3 |
| Intangible assets | 15 | 56.0 | 52.1 |
| Trade and other receivables | 16 | 21.5 | 21.4 |
| Other financial assets | 17 | 365.8 | 470.0 |
| 2,146.5 | 2,124.9 | ||
| Current assets | |||
| Inventories | 18 | 13.6 | 13.2 |
| Trade and other receivables | 16 | 228.7 | 217.7 |
| Other financial assets | 17 | 330.3 | 237.6 |
| Cash and cash equivalents | 19 | 40.7 | 39.5 |
| Gold holdings | 34 | 24.1 | 17.5 |
| Assets held for sale | 1.5 | 0.9 | |
| 638.9 | 526.4 | ||
| Total assets | 2,785.4 | 2,651.3 | |
| Current liabilities | |||
| Trade and other payables | 20 | (180.1) | (175.0) |
| Government borrowings | 21 | (443.3) | (407.0) |
| Other financial liabilities | 22 | (878.8) | (868.5) |
| Provisions | 23 | (26.7) | (22.2) |
| (1,528.9) | (1,472.7) | ||
| Non-current liabilities | |||
| Trade and other payables | 20 | (57.2) | (53.3) |
| Government borrowings | 21 | (1,855.1) | (1,613.0) |
| Other financial liabilities | 22 | (238.9) | (333.6) |
| Provisions | 23 | (256.0) | (240.0) |
| Net public sector pension liability | 25 | (1,395.8) | (1,311.9) |
| Total non-current liabilities | (3,803.0) | (3,551.8) | |
| Total liabilities | (5,331.9) | (5,024.5) | |
| Net liabilities | (2,546.5) | (2,373.2) | |
| Financed by taxpayers’ equity: | |||
| General reserve | (3,401.4) | (3,229.0) | |
| Revaluation reserve | 848.2 | 849.9 | |
| Other reserves | 6.7 | 5.9 | |
| Total liabilities to be funded by future revenues | (2,546.5) | (2,373.2) |
Notes 1 to 35 form part of these accounts.
Conrad Smewing
Accounting Officer
11 June 2026
6.4 Statement of Changes in Taxpayers’ Equity For the Year Ended 31 March 2025
| General reserve | Revaluation reserve | Other reserves | Total | |
|---|---|---|---|---|
| £bn | £bn | £bn | £bn | |
| At 1 April 2023 | (3,154.0) | 759.7 | 5.2 | (2,389.1) |
| Restatements | (1.2) | (3.1) | – | (4.3) |
| Impact on opening balances – missing entities | (6.9) | – | – | (6.9) |
| Change in accounting policy(1) | (71.6) | – | – | (71.6) |
| Net income /(expenditure) for the year ended 31 March 2024 | (146.6) | – | – | (146.6) |
| Net gain/(loss) on: | ||||
| Revaluation of property, plant and equipment | – | 95.8 | – | 95.8 |
| Revaluation of intangible assets | – | 0.6 | – | 0.6 |
| Revaluation of assets measured at Fair Value through Other Comprehensive Income | – | (0.1) | – | (0.1) |
| Revaluation of pension scheme liabilities | 139.9 | – | – | 139.9 |
| Other reserves movements including transfers | 11.4 | (3.0) | 0.7 | 9.1 |
| Balance at 31 March 2024 | (3,229.0) | 849.9 | 5.9 | (2,373.2) |
| Restatements | 10.3 | (18.9) | – | (8.6) |
| Impact on opening balances – missing entities | (9.7) | 19.3 | (0.6) | 9.0 |
| Net income/(expenditure) for the year ended 31 March 2025 | (207.7) | – | – | (207.7) |
| Net gain/(loss) on: | ||||
| Revaluation of property, plant and equipment | – | 22.4 | – | 22.4 |
| Revaluation of intangible assets | – | 0.9 | – | 0.9 |
| Revaluation of assets measured at Fair Value through Other Comprehensive Income | – | 5.0 | – | 5.0 |
| Revaluation of pension scheme liabilities | 3.6 | – | – | 3.6 |
| Other reserves movements including transfers | 31.1 | (30.4) | 1.4 | 2.1 |
| Balance at 31 March 2025 | (3,401.4) | 848.2 | 6.7 | (2,546.5) |
Notes 1 to 35 form part of these accounts.
(1) Change in accounting policy comprises the impact on opening reserves from the change in accounting for Contracts for Difference by the Department for Energy Security and Net Zero (see note 22).
6.5 Statement of Cash Flows For the Year Ended 31 March 2025
| Note | 2024-25 | 2023-24 | |
|---|---|---|---|
| £bn | £bn | ||
| Cash flows from operating activities: | |||
| Net operating expenditure for public services | SoRE | (57.7) | (56.4) |
| Adjustments for non-cash transactions | 111.6 | 63.5 | |
| Impact of missing entities (boundary adjustment) | (74.7) | 11.4 | |
| Adjustment for non-operating transactions | 32.4 | (103.8) | |
| (Increase)/decrease in inventories | 18 | (0.4) | (1.1) |
| (Increase)/decrease in trade and other receivables | 16 | (11.1) | (6.2) |
| Increase/(decrease) in trade and other payables | 20 | 9.0 | 12.0 |
| Net cash movement for the provision of pensions | 15.9 | 6.9 | |
| Use of provisions | 23 | (21.4) | (27.9) |
| Increase/(decrease) in lease liabilities | 27 | (1.3) | 1.0 |
| Interest on lease liabilities | 0.7 | 0.4 | |
| Net cash inflow/(outflow) from operating activities | 3.0 | (100.2) | |
| Cash flows from capital expenditure and financial investment: | |||
| Purchase of non-financial assets | (95.1) | (81.2) | |
| Interest received | 5 | 22.9 | 23.2 |
| Proceeds from disposal of non-financial assets | 5.7 | 6.8 | |
| Net cash inflow/(outflow) from purchase and disposal of financial assets and liabilities | (72.2) | (36.5) | |
| Net cash inflow/(outflow) from capital expenditure and financial investment | (138.7) | (87.7) | |
| Cash flows from financing activities: | |||
| Payment of lease liabilities | 0.5 | 0.3 | |
| Financing costs of long-term liabilities | (101.0) | (36.7) | |
| Finance charges paid on finance leases and PFI contracts | (41.0) | (46.2) | |
| Net Borrowings | 278.4 | 266.1 | |
| Net cash inflow/(outflow) from financing activities | 136.9 | 183.5 | |
| Net increase/(decrease) in cash and cash equivalents | 19 | 1.2 | (4.4) |
| Cash and cash equivalents at the beginning of the year | 19 | 39.5 | 43.9 |
| Cash and cash equivalents at the end of the year | 19 | 40.7 | 39.5 |
Notes 1 to 35 form part of these accounts.
6.6 Notes to The Accounts
1. Statement of Accounting Policies
1.1 Basis of Preparation
The financial statements have been prepared in accordance with the ‘Government Resources and Accounts Act 2000’ (GRAA) and International Financial Reporting Standards (IFRS), as adapted and interpreted by the Financial Reporting Manual (FReM). Many public bodies consolidated into these financial statements do not follow the FReM. For example, local authorities follow the IFRS-based Code of Practice on Local Authority Accounting. Adjustments are made on consolidation to harmonise accounting policies where material and any exceptions are noted in these accounting policies.
In adopting the going concern basis for preparing the financial statements, the Accounting Officer has considered the government’s power to set tax rates to meet its funding requirements, as well as controls over public spending, which ensure that the government will continue to exercise its functions.
1.2 Accounting Convention
The financial statements have been prepared under the historical cost convention, modified where appropriate to account for the revaluation of certain assets and liabilities as set out in these accounting policies.
1.3 Basis of Consolidation
The GRAA requires WGA to consolidate a group of entities that appear to HM Treasury to exercise functions of a public nature, or to be entirely or substantially funded from public money. The FReM adapts IFRS in order to comply with this statutory requirement and specifies that the WGA consolidation boundary should be based on the national accounts classification of bodies to the public sector, as independently determined by the Office of National Statistics (ONS).
Bodies classified to the public sector by the ONS include:
- central government bodies including departments, arm’s length bodies, agencies and the NHS
- local government bodies such as councils, police and crime commissioners, combined authorities and transport bodies (such as Transport for London)
- public corporations
- the devolved administrations of Scotland, Wales and Northern Ireland
There are areas where the boundary diverges from the ONS classification and further details are provided in the critical accounting estimates and judgements in Note 2.
WGA also does not include minor bodies (those with assets, liabilities, income and expenditure all less than £30 million), and a small number of non-government entities that report directly to Parliament, such as the National Audit Office. These bodies are listed in Annexes 2 and 3, published alongside WGA on gov.uk.
WGA is prepared by consolidating financial data provided by components based on their own audited statutory accounts (or the best available draft accounts if the audit of their statutory accounts is not yet finalised), supplemented with additional information where required. For components with transactions and balances over a certain threshold, the financial data provided for consolidation is reviewed by the component’s own auditor to confirm consistency with the audited statutory accounts. The threshold is £2 billion, applicable to any of income, expenditure, assets excluding property, plant and equipment, or liabilities excluding pension liabilities. Pension scheme accounts do not exclude pension liabilities.
Missing Data
The list of components consolidated into WGA is not identical each year as bodies are created and dissolved, classified into and out of the public sector by ONS, and, in some cases, do not submit data for consolidation. The number of bodies which have failed to submit data has historically been low and was not disproportionate to other changes to the boundary. Previously, the net effect of all boundary changes on WGA was not material and therefore not separately presented in the financial statements.
In recent years, the number of missing bodies has increased, primarily due to audit backlogs in the English local government sector.
In WGA 2024-25, 145 bodies did not submit data for consolidation, with 128 of those being local authorities. 93 bodies did not submit in 2023-24 but then returned data for 2024-25, however 31 submitted in 2023-24 but not in 2024-25. There were six new entities in 2024-25 who did not submit in that year. The net impact was a reduction of missing entities by 56. The adjustment shown on the SoCTE is £9.0 billion, which represents the total net assets and net liabilities of bodies moving into and out of the WGA consolidation. For notes which present totals as at 31 March 2024 and 2025, material variances due to this missing data are discussed in the note narrative.
Annexes to WGA
Three annexes are published alongside WGA on gov.uk, which list the entities consolidated into WGA 2024-25 and also those which are within the WGA boundary but not consolidated in 2024-25:
- Annex 1: list of entities consolidated in the WGA
- Annex 2: entities that are not consolidated in the WGA. This annex includes non-government entities which report directly to Parliament, and those entities which did not submit consolidation data in 2024-25
- Annex 3: minor bodies excluded from the consolidation. This annex provides details of small bodies not consolidated due to their size
Bodies which are part of the public sector but not consolidated into WGA (as shown in Annex 2 section 2) are considered related parties to WGA. See Note 31 for further details.
1.4 Accounting Standards in Issue but Not Yet Effective
IFRS 17 ‘Insurance Contracts’ was issued in May 2017 and applies to annual reporting periods beginning on or after 1 January 2023. It will be adopted by central government bodies from 2025-26, and therefore WGA will adopt IFRS 17 in 2025-26. IFRS 17 establishes the principles for the recognition, measurement, presentation and disclosure of insurance contracts within the scope of the standard. The objective of IFRS 17 is to ensure that an entity provides relevant information that faithfully represents those contracts. This information gives a basis for users of financial statements to assess the effect that insurance contracts have on the entity’s financial position, financial performance and cash flows. Once effective, IFRS 17 will replace IFRS 4 Insurance Contracts. HMT does not anticipate adoption of IFRS 17 to have a material impact on WGA, though will continue to monitor adoption to ensure relevant disclosures are made where required.
IFRS 18 ‘Presentation and Disclosure in Financial Statements’ was issued in April 2024 and will apply to reporting periods beginning on or after 1 January 2027. This standard will partially replace IAS 1 and will provide more consistency in relation to categorisation of expenses on the SOCI. HMT is currently taking advice on implementation and adaptation for the public sector.
IFRS 19 ‘Subsidiaries Without Public Accountability: Disclosures’ was issued in April 2024 and will apply to reporting periods beginning on or after 1 January 2027. This standard introduces a simplified disclosure regime for subsidiaries without public accountability, which are consolidated into a parent which publishes group accounts. HMT is currently taking advice on implementation and adaptation for the public sector, though due to the nature of public sector reporting, does not anticipate significant public sector impact.
There are no other IFRS or International Financial Reporting Interpretations Committee (IFRIC) interpretations not yet effective that would be expected to have a material impact on WGA.
1.5 Foreign Currency
Transactions that are denominated in a foreign currency are translated into sterling at the rate of exchange ruling on the date of each transaction, except where rates do not fluctuate significantly. In this case, an average rate for the period is used. Monetary assets and liabilities denominated in foreign currency at the financial year end are translated at the rates ruling at that date. Foreign exchange gains and losses resulting from the settlement of such transactions, and from the translation at year-end exchange rates of monetary assets and liabilities denominated in foreign currencies, are recognised in the Statement of Revenue and Expenditure.
1.6 Revenue
Taxes and Duties
Taxes and duties are measured at the fair value of the consideration received or receivable net of repayments. Revenue is recognised when a taxable event has occurred, the revenue can be measured reliably, and it is probable that the associated economic benefits from the taxable event will flow to the government. Revenues are deemed to accrue evenly over the period for which they are due. Taxation that is retained by an entity, either by statute or approval from HM Treasury, is treated as revenue from contract and is under the scope of IFRS 15. No revenue is recognised if there are significant uncertainties regarding recovery of the taxes and duties due.
Taxes and duties are accounted for on an accruals basis, except for stamp duty and National Insurance Classes 1A and 1B. These are accounted for on a cash basis and the timing difference does not have a material impact on the accounts. In addition, some repayments are accounted for on a cash basis. The nature of tax legislation and HMRC associated systems, mean that some of the accrued revenue receivable figures and some other items are subject to statistical estimation or forecasts.
Taxable Events for Material Tax Streams are as follows:
| Revenue type | Revenue recognition point |
|---|---|
| Income tax | Earning of assessable income during the taxation period |
| Social security | Earning of income on which National Insurance is payable |
| Corporation tax | Earning of assessable profit during the taxation period |
| Value Added Tax | Undertaking of taxable activity during the taxation period |
| Other excise duties | Date of production, date of import or movement of goods out of a duty suspended regime |
| Stamp duty | When property or shares are purchased |
| Council Tax | Residency in, or ownership or tenancy of, a chargeable dwelling for any period in the financial year |
| National Non-Domestic Rates | Occupation or ownership of a relevant non-domestic property for any period in the financial year |
Income tax excludes tax credits which are recognised separately as an expense.
Amounts Collected on Behalf of The EU
Where the UK acts as an agent of the EU in collecting revenues on its behalf, and bears none of the risks and rewards, these amounts are excluded from WGA. This applies in the case of EU customs duties collected by HMRC.
Other Revenue
Revenue from the sale of goods and services is measured based on the consideration specified in a contract with a customer and excludes amounts collected on behalf of third parties. WGA recognises revenue based on the delivery of performance obligations and an assessment of the point where control over a product or service transfers to a customer. Income from the European Union (EU) in respect of supported projects is recognised at the point that the expenditure on those projects is recognised. Grants and similar financing for capital items, to the extent that they have not been eliminated on consolidation, are recognised immediately in the Statement of Revenue and Expenditure unless it is likely that the grant will need to be repaid, in which case the grant is deferred in the Statement of Financial Position.
1.7 Expenditure
Social Security Benefits
Social security benefits are statutory entitlements payable to private individuals and households and include the state pension. Social security benefits are generally accounted for as expenditure in the period of entitlement. Social security benefits include tax credits, which are recognised in the year in which claims are assessed and awards authorised. Where under or overpayments are identified, either during the award year or subsequently, most of this is recovered over time.
Staff Costs
Staff costs include salaries and wages, the costs of pensions and other employee benefits. Staff costs that can be attributed directly to the construction of an asset have been capitalised. Average staff numbers include staff engaged on capital projects. Public sector pension scheme costs include current service costs and past service costs, both of which are explained in further detail in accounting policy Note 1.19.
Grants and Subsidies
Grants and subsidies are recorded as expenditure during the period that the underlying event or activity giving entitlement to the grant occurs. Entitlement to a grant varies according to the details of individual schemes and the terms of the offers made. Obligations arising from, as yet, unpaid and unclaimed grants are charged to the Statement of Revenue and Expenditure on the basis of estimates of claims not received and are included in accruals in the Statement of Financial Position.
Interest Costs
Interest costs on government borrowing are determined using the effective interest rate method. The effective interest rate is the rate that discounts estimated future cash flows to the debt instrument’s initial carrying amount. Most government borrowings are at fixed interest rates. For variable rate or index-linked borrowings, the current rate applicable to each product is used. Gilts with the same maturity and coupon rate are sometimes issued in separate tranches and may have a different effective interest rate due to market conditions. However, once issued, gilts with the same maturity and coupon rate are indistinguishable from each other and so are treated as one issue using a weighted average effective interest rate.
1.8 Property, Plant and Equipment
Property, plant and equipment are initially recognised at cost and subsequently valued at current value in existing use. For non-specialised assets, such as offices, this is the market value based on its current use less depreciation. For specialised assets, including the road and rail network held by central government, this is replacement cost less depreciation.
Infrastructure assets are valued at replacement cost less depreciation. However, road network assets held by local government, Northern Ireland water infrastructure assets and some others are valued at historical cost less depreciation. Further details on the accounting estimates involved in valuing infrastructure assets are included in the critical accounting estimates and judgements in Note 2.
Land and buildings are usually professionally valued at 5-year intervals, or when material changes are known to have arisen, and are subject to annual internal reviews. Gains on revaluation are taken to the revaluation reserve. Losses on revaluation for a particular asset are debited to the revaluation reserve if gains for that asset have been previously recorded, otherwise the full amount is charged to the Statement of Revenue and Expenditure.
Assets under construction are measured at cost less any recognised impairment loss and are not depreciated.
Military equipment comprises non-current assets used by the military for which there is no civilian use. It includes items such as tanks, fighter aircraft and warships. It is initially recognised as a tangible non-current asset at its direct purchase or production cost and is then depreciated over its useful economic life. Development expenditure on military equipment, which meets the capitalisation criteria, is capitalised as an intangible asset.
Other assets including community assets are accounted for as property plant and equipment. Heritage assets are recognised at fair value or, if this information is not available, at cost. Some heritage assets are not recognised on the Statement of Financial Position, as the costs of valuing these unique assets are not commensurate with the benefits.
1.9 Investment Properties
Investment properties consists of land and buildings held for rental revenue or for capital appreciation. Investment properties are measured initially at cost and are subsequently measured at fair value. Gains or losses arising from a change in fair value or disposal are recognised in the Statement of Revenue and Expenditure.
1.10 Intangible Assets
Intangible assets are recognised if it is probable that they will result in future economic benefits to the government and if their cost can be measured reliably. Intangible assets are initially recognised at cost and subsequently valued based on current value in existing use. Where no active market exists, intangible assets are revalued using indices or another suitable model.
1.11 Depreciation and Amortisation
Depreciation or amortisation is charged to write down the cost or valuation of an asset to its residual value over its estimated useful economic life. Residual values and useful economic lives are reviewed annually. Assets acquired through finance leases or Private Finance Initiative (PFI) contracts are depreciated over the shorter of the lease term and the estimated useful life. Any impairment in value in addition to depreciation is recognised immediately in the Statement of Revenue and Expenditure.
The depreciation period varies based on the estimate made by each WGA entity of the useful economic life of their assets. Generally, property, plant and equipment are depreciated over the following timescales:
| Type | Period |
|---|---|
| Infrastructure Assets | |
| Scottish water infrastructure | Up to 150 years |
| Road and rail network | Up to 100 years |
| Land and Buildings | |
| Freehold land | Not depreciated |
| Buildings | Up to 60 years |
| Assets under construction | |
| Assets under construction | Not depreciated |
| Military equipment | |
| Military equipment | Up to 50 years |
| Other Assets | |
| Plant and machinery | Up to 30 years |
| Transport equipment | Up to 50 years |
| IT equipment | Up to 10 years |
| Furniture and fittings | Up to 20 years |
Intangible assets are usually amortised over the following timescales:
| Type | Period |
|---|---|
| Military equipment | Up to 60 years |
| Development expenditure | Up to 35 years |
| Software | Up to 20 years |
| Licenses and other | Up to 15 years |
1.12 Inventories
Inventories are valued at the lower of cost and net realisable value. Where there is no expectation of consumption or sale in the ordinary course of business, the value is impaired to reduce it to net realisable value.
1.13 Cash and Cash Equivalents
Cash and cash equivalents comprise cash in hand and current balances with banks and other financial institutions. They are readily convertible to known amounts of cash, are subject to insignificant risk of changes in value and have an original maturity of three months or less. The carrying amount of these assets approximates their fair value.
1.14 Gold Holdings
Gold is valued at fair value based on the sterling equivalent of the London Bullion Market Association dollar denominated spot bid price at the reporting date. Changes in fair value are recognised in the Statement of Revenue and Expenditure.
1.15 Trade and Other Receivables
Trade and other receivables are recognised initially at fair value and subsequently at amortised cost. IFRS 9 allows entities to apply a ‘simplified approach’ for trade receivables, contract assets and lease receivables, which allows entities to recognise lifetime expected credit losses on all these assets without the need to identify significant increases in credit risk. Most WGA bodies use this simplified approach. An entity may select its accounting policy for trade receivables, lease receivables and contract assets independently of each other. Expected credit losses are recognised in the Statement of Revenue and Expenditure.
1.16 Leases
WGA and central government entities adopted the new standard IFRS 16 ‘Leases’ from 2022-23 in line with the FReM, while the Code of Practice on Local Authority Accounting followed by local authorities deferred adoption until 2024-25, with early adoption allowed in 2022-23 or 2023-24. There is now no longer an inconsistent application of this accounting policy in WGA 2024-25.
IFRS 16
Leases previously classified as operating leases are recognised in the Statement of Financial Position as right of use assets and lease liabilities, with corresponding depreciation of right of use assets and interest on lease liabilities recognised in the Statement of Revenue and Expenditure. The cumulative effect of adopting IFRS 16 is reflected as an adjustment to the opening balances of taxpayers’ equity.
Leases include intra-UK government agreements where non-performance may not be legally enforceable, such as Memorandum of Terms of Occupation agreements, and arrangements with nominal consideration or lease payments significantly below market value, known as peppercorn leases. WGA has chosen not to recognise right of use assets and lease liabilities for the following types of leases:
- Intangible assets
- Non-lease components of contracts, where applicable
- Low-value assets
- Leases with a term of 12 months or less
Lease liabilities are initially measured present value of lease payments that are not paid at the commencement date, discounted using the interest rate implicit in the lease, or if that rate cannot be readily determined, the rate provided by HM Treasury. Lease liabilities are subsequently measured at amortised cost.
Right of use assets are initially measured at cost, except for peppercorn leases, which are initially measured either at fair value or current value in existing use. Subsequently, right of use assets are measured either at fair value or current value in existing use and depreciated on a straight-line basis from the commencement date to the earlier of the end of the useful life of the right of use asset or the end of the lease term.
1.17 Private Finance Initiatives (PFI)
PFI contracts in which the government controls or regulates the services that the private sector operator must provide with the assets and controls any significant residual interest in the asset at the end of the contract, are recorded on the government’s Statement of Financial Position as if they had been purchased. The corresponding liability to the PFI operator is recognised as a PFI liability and the accounts distinguish between payments of interest, capital, and charges for services.
If the above conditions are not met, the asset is not recognised and all payments are recognised as charges for services.
Several WGA entities have PFI contracts which should not be recognised on the Statement of Financial Position because, under IFRIC 12, the private sector contractor was, on balance, considered to have greater control over the use of the asset. WGA entities reported these off-balance sheet contracts in their accounts in different ways in 2024-25, as the accounting standards allowed flexibility as to how to present the information.
1.18 Provisions
Provisions are recognised when the government has a present obligation as a result of a past event and it is probable that the government will be required to settle that obligation. Provisions are measured at the best estimate of the expenditure required to settle the present obligation at the reporting date and are discounted to present value where the time value of money is material.
Discount rates for UK central government are set by HM Treasury which gives rates for short, medium, long-term, and very long-term general provisions. These are defined as follows:
- short-term rate: A nominal discount rate to be applied to the cash flows of general provisions in a time boundary between 0 and up to and including 5 years from the reporting date
- medium-term rate: A nominal discount rate to be applied to the cash flows of general provisions in a time boundary of after 5 and up to and including 10 years from the reporting date
- long-term rate: A nominal discount rate to be applied to the cash flows of general provisions in a time boundary of after 10 years and up to and including 40 years from the reporting date
- very long-term rate: A nominal discount rate to be applied to the cash flows of general provisions in a time boundary exceeding 40 years from the reporting date
Where some or all the expenditure required to settle a provision is expected to be recovered from a third party, the recoverable amount is treated as an asset. The net provision expense after deducting expected recoveries from third parties is recognised in the Statement of Revenue and Expenditure.
1.19 Pension Liabilities
The pension liability relates to public sector pension liabilities for current and former government employees, plus a small component for other approved organisations that qualify for membership of these government schemes. The government operates both defined benefit and defined contribution pension schemes. The defined benefit pension schemes are either funded (meaning that the scheme receives contributions and invests them to fund pension payments) or unfunded (meaning that contributions are not held in a separate fund and the government is directly liable to fund pension payments as they fall due). The pension liability excludes the state pension paid to the general public which is included within overall expenditure and recorded as welfare spend. The future liability to pay state pension is not recognised in the accounts, because the expenditure is reported to match the period of entitlement.
For defined benefit pension schemes, the difference between the fair value of scheme assets (if any) and the present value of the scheme liability is recognised as a net asset or net liability on the Statement of Financial Position. The scheme liability is calculated by discounting expected future benefit payments back to the reporting date using a discount rate based on high quality corporate bonds, usually interpreted as corporate bonds with a credit rating of AA. The expected future benefit payments are calculated allowing for pensionable service to the reporting date, future increases to benefits in accordance with scheme rules (known as the projected unit method) and projections of earnings for current employees up to the date of retirement, leaving service or early death. The pension liability is therefore an estimate of the amount of money that would need to be invested in high quality corporate bonds at the reporting date to cover all the expected future benefit payments accrued up to the reporting date.
Current service costs are the increase in the present value of the scheme liabilities arising from current members’ service over the year. They are determined by the individual scheme actuaries and are calculated using the discount rate at the start of the year. Past service costs are changes in the present value of the scheme liabilities related to employee service in prior periods arising in the current period as a result of the introduction, change, or improvement to retirement benefits. These also include any gains or losses in relation to events defined as settlements or curtailments.
Pension financing costs are the increase during the period in the present value of the scheme liabilities because the benefits are one period closer to settlement. The financing cost is based on the discount rate (including inflation) at the start of the year and is calculated on the gross liability of unfunded schemes (which is shown gross) and the net liability of funded schemes (i.e. net of assets).
The gains and losses on revaluation reflect three elements:
- the change in the underlying assumptions used by the actuaries to determine the value of scheme liabilities. This includes changes in the assumptions such as financial assumptions, mortality rates and projected salary increases
- where in-year experience differs from assumptions previously used to determine the liabilities. For example, relating to assumptions about general salary and pension increases
- differences between the asset returns experienced in-year and the interest on the assets included in the Statement of Revenue and Expenditure for funded schemes
- the current service costs, any past service costs, including those arising from settlements or curtailments, and pension financing costs are recognised as an increase in the pension liability and are charged to the Statement of Revenue and Expenditure. The gain or loss on revaluation of pension scheme assets and liabilities is recognised in the Statement of Other Comprehensive Income
Payments to defined contribution pension schemes are recognised in the Statement of Revenue and Expenditure as they fall due.
1.20 Financial Instruments
Financial Assets
Financial assets are categorised as one of the following:
1) Amortised cost for financial assets whose cash flows are solely payments of principal and interest and the business model is to hold those financial assets in order to collect contractual cash flows. They are initially recognised at fair value and thereafter at amortised cost using the effective interest method less any impairment. The effective interest rate method is a method of calculating the amortised cost of a financial asset and of recognising and allocating interest income over the relevant period.
2) Fair Value Through Other Comprehensive Income (FVTOCI) in the case of:
- debt instruments whose cash flows are the sole payments of principal and interest and held within the business model whose objective is achieved by both collecting contractual cash flows and selling the financial assets
- equity instruments that are neither held for trading nor contingent consideration recognised in a business combination
- regular purchases and sales of financial assets are recognised at the trade date, which is the date on which the entity commits to purchase or sell the asset, or, in the case of loans and advances to financial counterparties, at the settlement date. After initial recognition, these assets are subsequently carried at fair value. Gains and losses in fair value are recognised directly in equity. On de-recognition, the cumulative gain or loss previously recognised in equity is recognised in the Statement of Revenue and Expenditure
3) Fair value through profit or loss (FVTPL) for any financial assets that are not measured at amortised cost or FVTOCI. This category includes derivatives and investments in equity instruments, unless an irrevocable election is made on initial recognition to classify as FVTOCI. The election is only available to equity instruments that are not held for trading. Transactions costs and any subsequent movements in the valuation of assets held at FVTPL are recognised in the Statement of Revenue and Expenditure.
Financial assets other than equity instruments and those at FVTPL are assessed for impairment at each reporting date using the expected credit loss model as introduced by IFRS 9, and impairments are recognised in the Statement of Revenue and Expenditure. All equity investments, measured at either fair value through profit or loss (FVTPL) or fair value through other comprehensive income (FVTOCI), and other financial instruments measured at FVTPL, are outside the scope of IFRS 9’s impairment model.
Financial assets are derecognised when the rights to receive future cash flows have expired or are transferred and the risks and rewards of ownership have been substantially transferred.
IFRS 9 impairment requirements for financial assets apply to:
- debt instruments – loans, trade receivables and debt securities measured at amortised cost or fair value through other comprehensive income (FVTOCI)
- lease receivables
- contract assets within the scope of IFRS 15
- certain financial guarantees and loan commitments
Financial Liabilities
Most of the government’s financial liabilities are classified as amortised cost. The exceptions are derivatives and IMF Special Drawing Rights allocation which are classified as fair value through profit of loss. Deposits by banks can also be classified as fair value through profit or loss.
1.21 Contingent Liabilities and Contingent Assets
Contingent liabilities and contingent assets are not recognised as liabilities or assets in the Statement of Financial Position but are disclosed in the notes to the accounts. A contingent liability is a possible obligation arising either from past events whose existence will be confirmed only by uncertain future events, or a present obligation arising from past events which is not recognised because either an outflow of economic benefit is not probable or the amount of the obligation cannot be reliably measured. A contingent asset is a possible asset whose existence will be confirmed only by the occurrence of one or more uncertain future events not wholly within the control of the entity. Where the time value of money is material, the contingent liabilities and assets are stated at discounted amounts.
1.22 Events after The Reporting Period
The Government Financial Reporting Manual (the FReM) interprets financial reporting requirements for the purposes of WGA in that the requirement that the financial statements be adjusted for events that provide evidence of conditions that existed at the reporting date do not apply, and therefore all such events are non-adjusting.
2. Critical Accounting Estimates and Judgements
2.1 WGA Boundary
The Government Resources and Accounts Act (GRAA) 2000 requires WGA to consolidate a group of entities that appear to HM Treasury to exercise functions of a public nature, or to be entirely or substantially funded from public money. The FReM adapts IFRS in order to comply with this statutory requirement and specifies that the WGA consolidation boundary should be based on the national accounts classification of bodies to the public sector, as independently determined by the Office of National Statistics (ONS).
In applying this policy, HM Treasury has made a judgement to exclude certain bodies which the ONS classifies to the public sector from the WGA consolidation. These exceptions are:
- WGA excludes a small number of entities such as the National Audit Office, Crown Estate and Audit Scotland that are accountable to their respective parliaments or assemblies rather than to an executive arm of the government and therefore do not form part of government. The total impact of excluding these bodies from WGA is estimated to be £1.8 billion of gross expenditure and £19.4 billion of net assets. Some of these amounts would be eliminated on consolidation. £15.0 billion of the net assets not included in WGA are owned by the Crown Estate.
- Minor entities are excluded on the basis that they are too small to have any material impact on WGA. The criteria used for minor bodies in 2024-25 was that they had to have gross expenditure, income, assets and liabilities of less than £30 million. For example, this includes some district councils. The total impact of excluding minor bodies is estimated to be £0.6 billion of gross expenditure and £0.3 billion of net assets. Some of these amounts would be eliminated on consolidation.
- NatWest was not historically consolidated into WGA despite being classified in the public sector by ONS. NatWest was recognised as an investment of government, which was a consistent policy applied since the government took its holding. This decision was made to not distort the accounts and financial trends in the WGA. In line with government intention to dispose of all shares in NatWest by 2025-26, the government reduced its shareholding. The government no longer maintains control of NatWest under accounting standards.
2.2 Taxation Revenue
Taxation revenue is recognised in the period in which the event that generates the revenue occurs. Some of the accrued revenue receivable figures and other items are subject to statistical estimation of forecasts, as tax returns and tax payments can be filed later. Due to the areas of uncertainty involved, actual outcomes could differ from the estimates used. Each year HMRC reviews the performance of its estimation models.
2.3 Valuation of Infrastructure Assets
Infrastructure assets in central government are largely comprised of the strategic road and rail networks, which are managed by the Department for Transport. They are valued at replacement cost less depreciation. The valuation of infrastructure assets is subject to significant uncertainty, as determining the replacement cost requires certain assumptions including a modern equivalent asset (a network which is identical in function but constructed using modern methods) and instantaneous build on a greenfield site.
Road network assets held by local authorities are currently held at historical cost less depreciation, which is different from the valuation basis used by central government. Local authorities investigated a valuation based on replacement cost less deprecation. The accounting framework for local authorities is set by the Chartered Institute of Public Finance and Accountancy (CIPFA). CIPFA are considering the approach to be taken for the valuation of infrastructure assets in local government, and whilst this is underway, local authority infrastructure assets remain valued at historical cost less depreciation.
The best proxy currently available for depreciated replacement cost is the calculated asset value used by the ONS in the National Accounts. The National Accounts estimated the value of local government networked assets at £206.0 billion (2023-24: £197.0 billion (restated by £7bn)) as at 31 December 2024. Infrastructure assets are likely to be understated by at least £114.2 billion. The ONS figure excludes land, and therefore the total error is likely to be larger than the figure stated. Further information regarding this departure from the FReM can also be found in the Governance statement.
Rail Network
The strategic rail network owned by Network Rail is valued using a complex model. As at 31 March 2025 this asset is valued at £490.4 billion (2023-24: £471.9 billion). The following sensitivity analysis reflects the sources of estimation uncertainty, showing the impact of changes in assumptions at the reasonable boundaries of uncertainty.
| Sensitivity to change of: | Depreciated Replacement Cost | Change | Change |
|---|---|---|---|
| £bn | £bn | % | |
| Remaining asset lives | Up to 35 years | ||
| Decrease by 10% | 454.3 | -36.1 | -7.4% |
| Base assumptions | 490.4 | ||
| Increase by 10% | 526.5 | 36.1 | 7.4% |
| Land compensation adjustment | |||
| Decrease by 10% (to 55%) | 482.7 | -7.7 | -1.6% |
| Base assumption (65%) | 490.4 | ||
| Increase by 10% (to 75%) | 498.1 | 7.7 | 1.6% |
| Greenfield site adjustment | |||
| Decrease by 10% (to 22%) | 474.9 | -15.5 | -3.2% |
| Base assumption (32%) | 490.4 | ||
| Increase by 10% (to 42%) | 505.8 | 15.4 | 3.1% |
| Risk factor adjustment | |||
| Decrease by 10% (to 10%) | 460.3 | -30.1 | -6.1% |
| Base assumption (20%) | 490.4 | ||
| Increase by 10% (to 30%) | 520.5 | 30.1 | 6.1% |
The land valuation includes an assessment of land purchase compensation costs. As Network Rail rarely purchases large parcels of land, the estimate of (65%) shown above reflects the experience of Highways England.
The valuation model for infrastructure assets assumes instantaneous build on a greenfield site. Comparative costs for constructions on greenfield sites may be difficult to find, so it is sometimes necessary to start with a comparative cost for construction in a live operational environment, which is more expensive, and reduce to a greenfield cost by an estimate of 32%. This adjustment applies only to costing rates built up using a methodology not already reflecting greenfield build.
After allowing for known costs in constructing assets there remain unknown and localised costs that are captured using a risk factor of 20%.
Strategic Road Network
The strategic road network owned by Highways England is valued using a complex model. As at 31 March 2025 this asset is valued at £151.6 billion (2023-24: £159.7 billion (Restated)).
The valuation relies on accounting estimates and is subject to estimation uncertainties. The following sensitivity analysis reflects the sources of estimation uncertainty, showing the impact of changes in assumptions at the reasonable boundaries of uncertainty.
The Implied Output Price Index (IOPI) is an index which directly reflects the movement in prices experienced by Highways England. It is applied to roads and structures for the purposes of yearly revaluation.
| Sensitivity to change of: | Valuation | Change | Change |
|---|---|---|---|
| £bn | £bn | % | |
| Costing rates | |||
| Decrease costing rates by 10% | 137.0 | 14.6 | 10% |
| Base assumption | 151.6 | ||
| Increase costing rates by 10% | 166.2 | -14.6 | -10% |
| Sensitivity to Implied Output Price Index (IOPI) | |||
| Base assumption | 151.6 | ||
| Increase IOPI by 10 points | 163.7 | -12.1 | -8% |
2.4 Student Loans
Due to the implementation of IFRS 9, student loans are carried at fair value through profit or loss (FVTPL). The FReM requires that where future cash flows are discounted to measure fair value, the higher of the rate intrinsic to the financial instrument or HMT’s current discount rate should be used. The discount rate used to discount expected cash flows to calculate the fair value of student loans is the intrinsic rate of the loan for Master’s loans, and HMT’s standard cross-government discount rate of RPI-1.05% (2023‑24: RPI-1.3%) for the remainder of the loan books, as required by the FReM interpretation of IFRS 9.
The fair value calculation also takes into account an estimate of the value of student loans which will not be repaid because of the policy decisions made by the government for the loans to be written off in certain circumstances such as death, disability or the age of the student. This estimate is sensitive to assumptions on borrowers’ earnings which are based on latest forecasts from the Office for Budget Responsibility.
The method for determining the carrying value of the student loan book in the accounts is set by the FReM and is likely to be higher than the amount that they could be sold for. This is because the discount rate used by a market investor in valuing the future cash flows would likely be higher given that the investment is riskier than gilts.
2.5 Public Sector Pension Liability
The assessment of the pension liabilities requires various assumptions about future unknowns in order to determine the expected future benefit payments. These assumptions include life expectancy, employee turnover rates, projections of price inflation and projections of earnings for current employees. A discount rate is then required to discount the future benefit payments to produce a net present value. The local government pension schemes are managed individually and locally which means there is no single real discount rate. There is a single real discount rate provided by the Cabinet Office which is used by central government. More information on pensions is presented in Note 25 Pensions.
The key financial assumptions used by the actuaries of government pension schemes to determine 2024-25 and 2023-24 WGA pension liabilities are set out below:
| Unfunded central government | Unfunded local government | Funded local government | |
|---|---|---|---|
| % | % | % | |
| 2024-25 | 2024-25 | 2024-25 | |
| Rate of increase in salaries | 3.40 | 2.90-4.30 | 2.70-4.30 |
| Rate of increase of Pensions in Payment | 2.65 | 2.50-3.20 | 2.30-3.20 |
| Discount rate: real | 2.40 | ||
| Discount rate: nominal | 5.15 | 3.90-5.90 | 3.90-5.90 |
| Price inflation assumption | 2.65 | 2.50-5.80 | 2.50-5.80 |
| Unfunded central government | Unfunded local government | Funded local government | |
|---|---|---|---|
| % | % | % | |
| 2023-24 | 2023-24 | 2023-24 | |
| Rate of increase in salaries | 3.55 | 2.60-4.30 | 2.20-6.45 |
| Rate of increase of Pensions in Payment | 2.55 | 1.30-3.90 | 2.20-3.90 |
| Discount rate: real | 2.45 | ||
| Discount rate: nominal | 5.10 | 2.60-4.90 | 2.85-5.10 |
| Price inflation assumption | 2.55 | 2.60-4.90 | 2.20-4.90 |
2.6 Provision for Nuclear Decommissioning
The Nuclear Decommissioning Authority’s (NDA’s) nuclear decommissioning provision forms the bulk of the overall government provision for nuclear decommissioning and represents the best estimate of the costs of decommissioning plant and equipment on their designated nuclear licenced sites to return them to pre-agreed end states in accordance with the Authority’s published strategy. NDA’s programme of work will take until the year 2137.
The estimate is necessarily based on assumptions regarding processes and methods likely to be used to discharge the obligations, reflecting a combination of latest available technical knowledge, requirements of the existing regulatory regime, government policy and commercial agreements. Given the very long timescale involved and the complexity of the plants and material being handled, considerable uncertainty remains in the estimates of future costs, particularly in later years. The estimate is updated to reflect changed circumstances and more recent knowledge and changed assumptions; as a result, material adjustments could be made to the carrying amount of the nuclear decommissioning provision and related assets and liabilities in the future. The principal assumptions and sensitivities around the cost estimates were reviewed and updated by NDA management as at 31 March 2025.
| Sensitivity analysis | Change in discount rate | Provision |
|---|---|---|
| % | £bn | |
| Increase in discount rate | 0.5% | 99.4 |
| Decrease in discount rate | 0.5% | 121.6 |
Four different discount rates are used, according to the expected timing of cashflows (from short-term to very long-term); see Note 23 for details for the rates used each year. The change in discount rates in 2024-25 produced an increase of £6.1 billion (2023-24: £19.1 billion decrease). Analysis of expected timing of discounted cash flows for the NDA Nuclear Provision is as follows:
| Redemption profile of nuclear decommissioning | Sellafield | Magnox | Waste | Transport | 2024-25 | 2023-24 |
|---|---|---|---|---|---|---|
| £bn | £bn | £bn | £bn | £bn | £bn | |
| <1 yr | 3.1 | 1.0 | 0.2 | 0.0 | 4.3 | 4.0 |
| 2-5 yrs | 11.5 | 3.3 | 1.0 | 0.0 | 15.8 | 15.6 |
| 6-20 yrs | 34.8 | 8.9 | 3.2 | 0.1 | 47.0 | 43.6 |
| 21-50 yrs | 21.3 | 8.5 | 2.3 | 0.0 | 32.1 | 31.7 |
| >50 yrs | 7.4 | 2.6 | 0.9 | 0.0 | 10.9 | 10.3 |
| Total | 78.1 | 24.3 | 7.6 | 0.1 | 110.1 | 105.2 |
The table below shows how the sensitivities can result in a range of values that could be higher or lower than the base case assumption.
| Sensitivities can result in a range of values: | Waste | Research | Sellafield | Fuel M&G | 2024-25 | 2023-24 |
|---|---|---|---|---|---|---|
| £bn | £bn | £bn | £bn | £bn | £bn | |
| Increase | 8.8 | 2.4 | 43.0 | 0.0 | 54.2 | 52.4 |
| Reduction | -1.6 | -2.4 | -7.2 | 0.0 | -11.2 | -10.9 |
The NDA calculates its provision based on management’s best estimate of the future costs of the decommissioning programme, which is expected to take until 2137 to complete. The NDA also considers credible risks and opportunities which may increase or decrease the cost estimate, but which are deemed less probable than the best estimate. These are the basis of the sensitivities identified in the sensitivity increase and reduction lines above. The sensitivity increase line brings together NDA’s assessment of credible risks that may increase the cost estimate, and the reduction line shows the decrease in cost estimate that may arise from credible opportunities. Factors that feed into key sensitivities includes costs of constructing and operating facilities, the impact of timing on construction and operations, final decommissioning of assets and site clearance. The key sensitivities are as follows.
The key sensitivities for waste activities are in the timing and costs of constructing and operating the Geological Disposal Facility, which is expected to receive waste from 2045. Construction costs are dependent on the location and construction requirements of the facility.
Activities on the sites used primarily for research are concerned with final decommissioning of assets and site clearance. Key sensitivities are the cost and timing of site clearance.
Sellafield represents activities associated with the operation of the site, reprocessing and eventual decommissioning, and includes all site overheads. Principal sensitivities are around the cost of delivering the plan, particularly the costs of new construction, decommissioning, and post operational clean out work in the long term.
The generation programme of work includes defueling the generation stations and preparing for interim Care and Maintenance (complete by 2030), followed by a final site clearance phase around 2070 to 2107. The main cost risks in the final site clearance phase.
Further details are reported in the Annual Report and Accounts for Department for Energy Security & Net Zero and the Nuclear Decommissioning Authority.
2.7 Provision for Clinical Negligence
The clinical negligence provision requires the directors of the NHS Resolution to make judgements, estimates and assumptions to value the liability. The estimates and associated assumptions are based on historical experience and other factors that are relevant. They are reviewed annually by the NHS Resolution, supported by its actuaries, the Government Actuary’s Department. Known reported claims are individually valued using likely costs to resolve the claim and probability factors to take account of the potential of a successful defence, while Incurred But Not Reported (IBNR) claims are valued using actuarial models to predict likely values. Due to the long-term nature of the liabilities and the assumptions on which the estimate of the provision is based, some uncertainty about the value of the liability remains.
Revisions to accounting estimates are recognised in the period in which the estimate is revised if the revision affects only that period, or in the period of the revision and future periods if the revision affects both current and future periods.
The value of the provision is sensitive to changes in discount rates, and a sensitivity analysis is provided below (source: Department of Health and Social Care Annual Report and Accounts 2024/25)
Discount rates (all terms):
sensitivity to change Estimated IBNR provision Change to original
| Discount rates (all terms): sensitivity to change | Estimated IBNR provision | Change to original IBNR estimate | |
|---|---|---|---|
| £bn | £bn | % | |
| All discount rates -1 percentage point | 27.8 | 5.1 | 23% |
| Base assumptions | 22.7 | N/A | N/A |
| All discount rates +1 percentage point | 19.0 | (3.7) | (16%) |
Other key sensitivities are claims value inflation, average costs of claim and the probability of a successfully defended claim. A sensitivity analysis of these is shown below (source: Department of Health and Social Care Annual Report and Accounts 2024-25)
| Probability of a successfully defended claim: sensitivity to change | Estimated IBNR provision | Change to original IBNR estimate | |
|---|---|---|---|
| £bn | £bn | % | |
| All probabilities -5% | 24.6 | 2.0 | 9% |
| Base assumptions | 22.7 | N/A | N/A |
| All probabilities +5% | 20.7 | (2.0) | (9%) |
| Claims value inflation: sensitivity to change | Estimated IBNR provision | Change to original IBNR estimate | |
|---|---|---|---|
| £bn | £bn | % | |
| All rates -1.5 percentage point | 19.6 | (3.1) | (14%) |
| Base assumptions | 22.7 | N/A | N/A |
| All rates +1.5 percentage point | 26.4 | 3.7 | 16% |
| Average costs of claim: sensitivity to change | Estimated IBNR provision | Change to original IBNR estimate | |
|---|---|---|---|
| £bn | £bn | % | |
| Reduction in average claim values of 20% | 18.2 | (4.4) | (20%) |
| Base assumptions | 22.7 | N/A | N/A |
| Increase in average claim values of 20% | 27.1 | 4.4 | 20% |
Life expectancy assumptions determine the expected period over which liabilities will be paid and so also affect the value of the provision.
2.8 Non-coterminous Year Ends
WGA consolidates a wide variety of organisations. All bodies, barring the exceptions discussed below, use a year end to 31 March. Where the impact of different year ends is material, HM Treasury is required by the accounting standards to make adjustments to align the component’s submission to the WGA year end.
The following WGA components have different financial year ends where the impact is judged by HM Treasury to be immaterial:
- British International Investment – year end to 31 December
- Northern Ireland and Scottish FE colleges – year end to 31 July
- Channel 4 – year end to 31 December
- Bank of England – year end to 28 February
- National Physics Laboratory – year end to 31 December
- Post Office Ltd – year end to 27 March
- Northern Ireland Transport Holding Company – 52 weeks ending 30 March 2025
- British Nuclear Fuels – year end to 30 June
The following WGA components have different financial year ends where the impact is judged by HM Treasury to be material:
Academies Sector
The Academies sector annual report and accounts has a year end to 31 August 2024. The account is compiled and published by the Department for Education. The Department was unable to estimate, to a material level of accuracy, the adjustments required to reflect their financial position and performance to 31 March. WGA therefore reflects the Academies sector to 31 August 2024, with no adjustments made.
The material balance impacted by this misalignment is property, plant and equipment (where academies report net book value of £76.0 billion). See the Governance Statement estimates of the maximum amount of variance between 31 August and 31 March.
2.9 Contracts for Difference (CfDs)
WGA includes several CfDs on the Statement of Financial Position. CfDs are a mechanism used to support investment in UK low-carbon electricity generation projects. CfD contracts do this by agreeing with a generator a strike price for electricity supplied, thereby providing the certainty needed for private investment, while protecting consumers from having to continue to pay higher support costs when electricity prices are high. The support payments paid (or repaid) in future will be calculated from the difference between the strike price and the average market price.
During 2019-20, changes to the forecast models used by BEIS meant it became possible to reliably estimate the valuation of Hinkley Point C (HPC) CfD. As a result of this, BEIS considered the recognition criteria for HPC CfD to have been met, and the HPC CfD was recognised in the BEIS Annual Report and Accounts 2019-20 and subsequent years.
Long term forecasts are not generally seen as a single most likely outcome with degrees of uncertainty either side. Rather there are multiple sets of inputs that are internally consistent and credible. A set of these inputs is usually used as a ‘scenario’ and multiple deliberately different scenarios are used to illustrate different possible futures when undertaking long term forecasting. Therefore, individual forecasts may use a very different set of assumptions such as generation mix, carbon and fuel costs, electricity demand and interconnector capacity, but still be within what we would describe as the ‘universe of reasonableness’.
The following table shows the impact on the fair value of CfDs by applying reasonably possible alternative assumptions to the valuation obtained using the forecasting model. Due to the significance and uniqueness of Hinkley Point C (HPC) CfD the impact (and certain assumptions) has been shown separately.
| Change in FV of CfDs if: | Favourable / (Unfavourable) changes | ||
|---|---|---|---|
| HPC | Other | Total | |
| £bn | £bn | £bn | |
| High Case | 17.8 | 48.7 | 66.5 |
| Low Case | (19.2) | (28.7) | (47.9) |
| Discount rate 3.5% | 12.0 | 3.8 | 15.8 |
The fair value is highly dependent upon the actual capacity generated once the plant is built and the electricity prices which will prevail at the time of generation. The favourable and unfavourable changes show how the impact of changes in capacity and prevailing electricity prices will affect the fair value of the CfDs due to the change in the level of cash flows. As the sensitivity analysis illustrates, the overall fair value movements are subject to material uncertainty.
Further details on the assumptions can be found in the accounts of the Department for Energy Security & Net Zero.
3. Segmental Reporting
Segmental Reporting 2024-25
| Central government | Local government | Public corporations | Whole of Government | |
|---|---|---|---|---|
| £bn | £bn | £bn | £bn | |
| Taxation revenue | (863.2) | (63.2) | (0.1) | (926.5) |
| Other revenue | (76.9) | (52.6) | (26.4) | (155.9) |
| Total public services revenue | (940.1) | (115.8) | (26.5) | (1,082.4) |
| Social security benefits | 317.6 | 16.7 | – | 334.3 |
| Staff costs | 187.9 | 64.5 | 7.7 | 260.1 |
| Purchase of goods and services | 192.2 | 103.2 | 13.6 | 309.0 |
| Interest cost on government borrowing | 66.7 | – | – | 66.7 |
| Increase/(decrease) in provisions | 22.2 | 0.9 | (0.3) | 22.8 |
| Grants and subsidies | 82.2 | 1.0 | 0.1 | 83.3 |
| Depreciation and impairment | 43.4 | 18.1 | 2.4 | 63.9 |
| Total expenditure on public services | 912.2 | 204.4 | 23.5 | 1,140.1 |
| Net (revenue)/expenditure on public services | (27.9) | 88.6 | (3.0) | 57.7 |
| Financing costs of long‑term liabilities, including discounting | 91.6 | 11.2 | 39.2 | 142.0 |
| Net loss/(gain) on revaluations and disposals of assets and liabilities | 7.7 | (0.1) | 0.4 | 8.0 |
| Net expenditure/(revenue) for the year | 71.4 | 99.7 | 36.6 | 207.7 |
| Property, plant and equipment | 1,156.0 | 371.3 | 133.1 | 1,660.4 |
| Right of use assets | 15.8 | 9.0 | 2.5 | 27.3 |
| Other non-current assets | 356.6 | 28.9 | 73.3 | 458.8 |
| Current assets | 419.2 | 42.1 | 177.6 | 638.9 |
| Total assets | 1,947.6 | 451.3 | 386.5 | 2,785.4 |
| Current government borrowings | (443.3) | – | – | (443.3) |
| Other current liabilities | (274.0) | (38.7) | (772.9) | (1,085.6) |
| Non-current government borrowings | (1,855.1) | – | – | (1,855.1) |
| Provisions non-current | (237.8) | (2.1) | (16.1) | (256.0) |
| Net public sector pension asset/(liability) | (1,292.0) | (105.8) | 2.0 | (1,395.8) |
| Other non-current liabilities | (192.5) | (42.4) | (61.2) | (296.1) |
| Total liabilities | (4,294.7) | (189.0) | (848.2) | (5,331.9) |
| Net assets/(liabilities) | (2,347.1) | 262.3 | (461.7) | (2,546.5) |
WGA uses the same classification of sectors of government as the Office for National Statistics (ONS).
The overall impact of missing data on the SoRE and SoFP is analysed in the Performance Report on a line-by-line basis as well as detailing the number of missing returns by sector.
Central government comprises government departments, the devolved administrations of Scotland, Wales and Northern Ireland, non-departmental public bodies, entities in the National Health Service, the pension liability for all teachers included within the Teachers’ Pension Scheme and certain local government functions in Northern Ireland and Scotland, such as police, education and social services, which are carried out by central departments. Central government also includes academy schools. The share of central government expenditure has been increasing over time as schools convert and transfer out of the local government sector.
Local government comprises all local authorities, police and crime commissioners, fire and rescue authorities, national park authorities and waste disposal authorities in England and Wales and local authorities in Northern Ireland and Scotland.
Public corporations comprise a range of publicly owned companies, many of which provide services to the general public, including the BBC, Channel 4, Bank of England and Scottish Water.
Note 7 provides a breakdown of staff numbers by sector.
Segmental Reporting 2023-24
| Central government | Local government | Public corporations | Whole of Government | |
|---|---|---|---|---|
| £bn | £bn | £bn | £bn | |
| Taxation revenue | (837.7) | (51.0) | (0.1) | (888.8) |
| Other revenue | (73.1) | (33.5) | (24.5) | (131.1) |
| Total public services revenue | (910.8) | (84.5) | (24.6) | (1,019.9) |
| Social security benefits | 299.9 | 11.5 | – | 311.4 |
| Staff costs | 182.7 | 50.7 | 7.1 | 240.5 |
| Purchase of goods and services | 185.1 | 66.8 | 11.8 | 263.7 |
| Interest cost on government borrowing | 63.4 | – | – | 63.4 |
| Increase/(decrease) in provisions | 27.9 | 0.6 | 0.5 | 29.0 |
| Grants and subsidies | 103.7 | 0.4 | – | 104.1 |
| Depreciation and impairment | 49.0 | 12.7 | 2.5 | 64.2 |
| Total expenditure on public services | 911.7 | 142.7 | 21.9 | 1,076.3 |
| Net (revenue)/expenditure on public services | 0.9 | 58.2 | (2.7) | 56.4 |
| Financing costs of long‑term liabilities, including discounting | 33.7 | 6.4 | 42.8 | 82.9 |
| Net loss/(gain) on revaluations and disposals of assets and liabilities | 6.7 | 0.4 | 0.2 | 7.3 |
| Net expenditure/(revenue) for the year | 41.3 | 65.0 | 40.3 | 146.6 |
| Property, plant and equipment Right of use assets | 1,115.8 24.1 | 292.8 2.0 | 130.5 1.9 | 1,539.1 28.0 |
| Other non-current assets | 365.6 | 25.5 | 166.7 | 557.8 |
| Current assets | 423.5 | 34.4 | 68.5 | 526.4 |
| Total assets | 1,929.0 | 354.7 | 367.6 | 2,651.3 |
| Current government borrowings | (407.0) | – | – | (407.0) |
| Other current liabilities | (288.4) | (27.7) | (749.6) | (1,065.7) |
| Non-current government borrowings | (1,613.0) | – | – | (1,613.0) |
| Provisions non-current | (219.6) | (1.8) | (18.6) | (240.0) |
| Net public sector pension asset/(liability) | (1,220.2) | (92.6) | 0.9 | (1,311.9) |
| Other non-current liabilities | (197.4) | (32.0) | (157.5) | (386.9) |
| Total liabilities | (3,945.6) | (154.1) | (924.8) | (5,024.5) |
| Net assets/(liabilities) | (2,016.6) | 200.6 | (557.2) | (2,373.2) |
4. Taxation Revenue
| 2024-25 | % of total | 2023-24 | % of total | |
|---|---|---|---|---|
| £bn | £bn | |||
| Income tax | 309.4 | 33% | 286.2 | 32% |
| National Insurance Contributions (NIC) | 149.9 | 16% | 157.6 | 18% |
| Value added tax (VAT) | 178.5 | 19% | 165.5 | 19% |
| Corporation tax | 89.4 | 10% | 89.6 | 10% |
| Hydrocarbon oils duty | 24.7 | 3% | 24.9 | 3% |
| Excise Duty | 34.0 | 4% | 33.9 | 4% |
| Stamp taxes | 19.9 | 2% | 16.1 | 2% |
| Capital gains tax | 13.8 | 1% | 14.3 | 1% |
| Other taxes and duties | 44.0 | 5% | 45.9 | 5% |
| Central government taxation revenue | 863.6 | 93% | 834.0 | 94% |
| Council Tax | 35.9 | 4% | 28.5 | 3% |
| National Non-Domestic rates (NNDR) | 27.0 | 3% | 26.3 | 3% |
| Local government taxation revenue | 62.9 | 7% | 54.8 | 6% |
| Total taxation revenue | 926.5 | 100% | 888.8 | 100% |
Most government expenditure is financed through taxation revenue. Most taxation income is from individuals, with income tax and National Insurance levied on salaries, wages and employers, and VAT and certain duties levied on consumption. Local taxes comprise of council taxes and business rates. The figures in the table above may not agree exactly to the HMRC published accounts due to intra-governmental eliminations postings.
There were several entities which contributed to the note total through their data submissions in 2023-24, but which did not make a submission to the WGA this year. These entities contributed a total of £2.5 billion to this note’s total last year. Similarly, there were also several entities which made contributions to the note this year but did not make a submission in 2023-24. These entities contributed a total of £13.4 billion to the note this year, giving a net increase in overall income recognised in this note of £10.9 billion due to missing data.
Total taxation revenue increased by £37.7 billion (4.2%) in 2024-25, mainly driven by economic factors such as growth in wages, profits and inflation as well as continued growth in the number of taxpayers within the tax system.
The main contributors to this overall increase of £37.7 billion were increases of £23.2 billion (8.1%) in Income tax, £13.0 billion (7.9%) in Value added tax and the net increase due to the impact of missing data of £10.9 billion, partly offset by a decrease of £7.7 billion (4.9%) in National Insurance Contributions.
Despite the decrease in National Insurance contributions, combined receipts from Income tax and National Insurance contributions increased by £15.5 billion (3.5%) compared to 2023-24 largely reflecting growing employment and average earnings growth. The Office for Budget Responsibility noted that policy changes, including the decision to freeze some tax allowances and thresholds, boosted revenues.
Corporation Tax (CT) revenues were static compared to 2023-24.
The taxable event for Stamp Duty Land Tax (SDLT) is the purchase of property. Stamp duties revenues increased by £3.8 billion (23.6%), reflecting increases in the number of property transactions.
The taxable event for Capital gains tax is the disposal of a chargeable asset leading to a taxable gain. Revenues were static compared to 2023-24.
The taxable event for Value Added Tax (VAT) is the supply of goods and services that attract VAT during the taxation period by the taxpayer. VAT revenues increased by £13.0 billion (7.9%) compared to 2023-24, reflecting increased spending.
The taxable event for Hydrocarbon Oils Duty is the date of production, date of import or movement of relevant goods out of a duty suspended regime (a regime where, under UK legislation, certain goods benefit from a temporary suspension or reduction of import duties). Hydrocarbon Oils Duty revenues were static compared to 2023-24.
Excise Duty accounts for £34.0 billion, and is comprised of Alcohol, Tobacco, Vehicle, and Custom Duties. The main contributors are Vehicle Excise Duty of £8.4 billion and Tobacco Duties of £7.9 billion.
The main contributors to Other taxes and duties of £44.0 billion are Insurance Premium Tax of £9.3 billion (2023-24: £8.1 billion), Inheritance Tax of £8.2 billion (2023-24: £7.4 billion), Student Loans Income of £4.7 billion (2023-24: £4.4 billion), Air Passenger Duty of £4.2 billion (2023-24: £3.9 billion), and Broadcast Licence fees of £3.8 billion (2023-24: £3.7 billion). Other taxes and duties also includes Apprenticeship Levy, Betting and Gaming duties, Energy Profits Levy, Lottery Income, Climate Change Levy, Bank Levy, Landfill Tax, Soft Drinks Industry Levy, Aggregates Levy, Regulatory Fees, Digital Services Tax, Diverted Profits Tax, and Petroleum Revenue Tax. The overall decrease in Other taxes and duties revenue was £1.9 billion (4.1%) year on year.
Local government taxation revenue increased by £8.1 billion (14.8%), as National Non-Domestic Rates (NNDR) increased by £0.7 billion and Council Tax increased by £7.4 billion. This was largely due to the impact of missing data and the number of entities included in WGA increasing.
5. Other Revenue
| 2024-25 | 2023-24 | |
|---|---|---|
| £bn | £bn | |
| Revenue from contracts: | ||
| Sales of goods and services (excluding the NHS) | 47.8 | 31.6 |
| Levies | 2.9 | 2.8 |
| Court fines and penalties | 1.0 | 1.1 |
| Passenger transport and income from train operating companies | 7.7 | 10.0 |
| Other fees and charges | 7.5 | 6.8 |
| Rental income | 8.9 | 6.9 |
| EU income | 1.1 | 2.5 |
| License income | 0.6 | 0.5 |
| Revenue from contracts | 77.5 | 62.2 |
| NHS Income: | ||
| Sales of goods and services | 6.6 | 6.3 |
| NHS fees and charges (dental, prescription and other) | 2.1 | 2.0 |
| Other income from the NHS | 1.9 | 1.9 |
| NHS Income | 10.6 | 10.2 |
| Other income: | ||
| Interest income | 22.9 | 23.2 |
| Private sector contributions to local services | 6.3 | 2.9 |
| Pension scheme income | 8.6 | 7.3 |
| CRC allowance sales and EU emissions trading scheme | 2.6 | 3.5 |
| Grants from private sector | 2.3 | 1.7 |
| Miscellaneous operating revenue | 25.1 | 20.1 |
| Other Income | 67.8 | 58.7 |
| Total Other Revenue | 155.9 | 131.1 |
Other revenue has increased overall by £24.8 billion in 2024-25.
This increase primarily relates to the net impact of entities which submitted data to the WGA in one but not both of this year and last year, which contributed a net increase of £20.6 billion
Several entities made contributions to the note this year but did not submit last year. These entities contributed £30.0 billion to this year’s note total.
Conversely, several entities contributed to the note total through their data submissions in 2023-24 but did not make a submission to the WGA this year. These entities contributed a total of £9.4 billion to last year’s note total.
Sales of goods and services (excluding the NHS) includes goods and services provided by local authorities of £24.2 billion (2023-24: £13.0 billion); this figure includes a wide range of goods and services, including income from schools and adult social care provision. The increase is largely a reflection of the impact of missing data as referred to above, as the vast majority of entities which submitted data to the WGA this year but not last year were from the Local Government sector.
In addition, £14.4 billion (2023-24: £10.4 billion) is from central government, which includes a wide range of income streams. The remaining £9.2 billion (2023-24: £8.2 billion) of the total is goods and services from Public Corporations, including Royal Mint, BBC, Channel 4, Scottish Water and the Post Office.
Levies totalled £2.9 billion (2023-24: £2.8 billion), including £0.6 billion (2023-24: £0.7 billion) from the Immigration Skills Charge, collected via Tier 2 visa applications. Introduced in 2017 under the Immigration Act 2016, the charge applies to employers hiring skilled migrants. Other levy income arises from bodies including the Pension Protection Fund, Financial Services Compensation Scheme, Bank of England, and DEFRA. Unlike taxes, which fund general public services, levies are raised for specific purposes.
Passenger transport and train operating companies’ income of £7.7 billion (2023‑24: £10.0 billion) is predominantly made up of passenger income from Transport for London (TfL) of £5.0 billion (2023-24: £4.8 billion), and from the DfT Operator Limited of £2.5 billion (2023-24: £2.2 billion).
Rental income of £8.9 billion (2023-24: £6.9 billion) includes rents and related costs collected from local government council tenants.
EU income of £1.1 billion (2023-24: £2.5 billion) is primarily income received by the Ministry of Housing, Communities and Local Government (MHCLG) of £0.4 billion (2023‑24: £1.0 billion), and by the Department for Work and Pensions of £0.5 billion (2023-24: £0.5 billion).
Licence income of £0.6 billion (2023-24: £0.5 billion) is largely made up of income from the Office of Communications (OFCOM). The BBC licence fee is classified as a tax in Note 4.
NHS income of £10.6 billion (2023-24: £10.2 billion) is made up of a variety of sources and increased by a net £0.4 billion.
Interest income of £22.9 billion (2023-24: £23.2 billion) includes interest and dividend income received from the private sector of £21.6 billion (2023-24: £21.9 billion). The Bank of England contributed £8.1 billion to this total (2023-24: £8.3 billion). The other main contributor was the Exchange Equalisation Account which contributed £6.2 billion (2023-24: £6.0 billion).
Pension scheme income of £8.6 billion (2023-24: £7.3 billion) relates to employer contributions from organisations which participate in public sector pension schemes but are not themselves consolidated within the WGA boundary. Examples include GPs and charity hospices that contribute to the NHS pension scheme, and higher and further education institutions and independent teaching establishments that contributed to the Teachers’ Pension Scheme. It also includes non-WGA entities such as the National Audit Office, Audit Wales and Electoral Commission that contribute to the Principal Civil Service Pension Scheme.
Miscellaneous operating revenue has increased by £5.0 billion, from £20.1 billion in 2023-24 to £25.1 billion this year. There is no outstanding entity or issue which has caused this increase. This note line was impacted by missing data, as referred to above. For example, Birmingham City Council contributed £1.9 billion to this note line this year, and the Greater Manchester Combined Authority contributed £1.0 billion. Neither entity had contributed to the WGA in 2023-24.
6. Social Security Benefits
| 2024-25 | % of total | 2023-24 | % of total | |
|---|---|---|---|---|
| £bn | £bn | |||
| State pension | 141.1 | 42% | 127.3 | 41% |
| Pension credit | 6.3 | 2% | 5.7 | 2% |
| Pensioner benefits | 147.4 | 44% | 133.0 | 43% |
| Universal Credit | 68.2 | 21% | 53.1 | 17% |
| Personal Independence Payment | 27.6 | 8% | 23.2 | 8% |
| Miscellaneous benefits | 9.2 | 3% | 21.5 | 7% |
| Tax credits | 12.6 | 4% | 19.4 | 6% |
| Employment and Support Allowance | 13.1 | 4% | 13.4 | 4% |
| Child Benefit | 13.3 | 4% | 12.5 | 4% |
| Housing Benefit | 17.1 | 5% | 11.9 | 4% |
| Disability Living Allowance | 8.2 | 2% | 7.3 | 2% |
| Attendance allowance | 8.1 | 2% | 7.0 | 2% |
| Carer’s allowance | 4.5 | 1% | 3.9 | 1% |
| Statutory sick pay and maternity pay | 3.2 | 1% | 3.0 | 1% |
| Other working age benefits | 1.2 | 1% | 1.2 | 1% |
| Income support | 0.3 | 0% | 0.7 | 0% |
| Jobseeker’s Allowance | 0.3 | 0% | 0.3 | 0% |
| Disability, working and other benefits | 186.9 | 56% | 178.4 | 57% |
| Total social security benefits | 334.3 | 100% | 311.4 | 100% |
Social Security benefits are public funds paid by government to individuals and households to provide financial support when incomes are low or circumstances change, such as unemployment, sickness or disability, caring responsibilities, or retirement. Their core purpose is to reduce poverty and hardship, help people meet basic living costs, and provide a safety net that stabilises incomes during periods of need, while supporting wider social and economic objectives such as wellbeing, participation in work where possible, and social cohesion.
The State Pension (including New State Pension) for 2024-25, at £141.1 billion, is the largest benefit paid, accounting for 42% of the benefit spending total. State pension expenditure increased by £13.8 billion. This represents an increase of 10.8%, largely due to the annual uprating of pensions by 8.5%.
Disability, working, and other benefits amounted to £186.9 billion, reflecting a £8.5 billion increase from the previous year. A significant contributor to this rise was Universal Credit, which saw an increase of £15.1 billion compared to 2023-24. This increase is attributed to the ongoing expansion of Universal Credit as well as the annual uprating of benefits by 6.7%, which is replacing several legacy benefits and now encompasses payments previously issued through personal tax credits by HMRC.
Similarly, Personal Independent Payment increased by £4.4 billion. This is in line with inflation and rising caseloads year on year. Conversely, Tax Credits fell by £6.8 billion, reflecting the continued migration of claimants receiving personal Tax Credits to Universal Credit. Miscellaneous benefits showed a large decrease of £12.3 billion due to no cost of living payments being made in 2024-25 (£7.7 billion decrease), and a reduction of Social Fund payments made (£4.6 billion decrease) due to changes in the eligibility criteria for Winter Fuel payments.
Housing Benefit increased by £5.2 billion compared to 2023-24, largely due to the impact of missing data (see below).
Several entities that contributed to the note’s total through their data submissions in 2023-24 did not submit data for the WGA this year. Last year, these entities accounted for £1.3 billion of the total, primarily related to Housing Benefits. Conversely, this year, some entities that did not contribute in 2023-24 provided data, contributing £6.1 billion, almost all of which was related to Housing Benefits. As a result, the net increase due to missing data was £4.8 billion.
7. Staff Costs
| Permanently employed staff | 2024-25 | 2023-24 | ||
|---|---|---|---|---|
| £bn | £bn | £bn | £bn | |
| Salaries and wages | 209.9 | 16.0 | 225.9 | 199.1 |
| Pension scheme costs: current service costs (net of employees’ contributions) | 32.0 | – | 32.0 | 37.5 |
| Pension scheme costs: past service costs and enhancements | 0.6 | – | 0.6 | 0.3 |
| Pension scheme costs: losses on settlements and curtailments | (0.5) | – | (0.5) | (0.2) |
| Expenditure on external pension schemes | 2.1 | – | 2.1 | 3.8 |
| Total staff costs | 244.1 | 16.0 | 260.1 | 240.5 |
Overall staff costs increased by £19.6 billion in 2024-25, an increase of 8.1%.
The primary factor contributing to this increase was continued recovery of the missing data position. Several entities that submitted data in 2023-24, contributing £4.7 billion to last year’s total, did not make submission to the WGA this year. Conversely, new entities contributed £20.5 billion to this year’s note total despite not having submitted last year. This shift resulted in a net increase of £15.8 billion due to missing data. A split of staff costs by sector between central government, local government and public corporations can be found in the segmental analysis in Note 3.
Salaries and wages increased by £26.8 billion to £225.9 billion, an increase of 13.5% on the prior year. The largest single contributor to this increase was with the Department of Health and Social Care (DHSC) which increased by £5.4 billion to £75.5 billion (2023‑24: £70.1 billion). Additionally, average staff numbers for DHSC increased by 31,551 to 1,566,417.
Pension scheme current service costs decreased by £5.5 billion to £32.0 billion, a decrease of 14.7% on the prior year. The single largest contributor to the change was the NHS Pensions Scheme, with a year-on-year reduction of £2.5 billion. This was due to lower current service costs on the scheme in 2024-25. Further detail can be found in the NHS Pension Scheme Annual Report and Accounts for 2024-25.
Average Number of Employers Persons FTE
| Permanently Employed Staff | Others | 2024-25 | 2023-24 | |
|---|---|---|---|---|
| Health Sector | 1,733,363 | 160,251 | 1,893,614 | 1,859,476 |
| Academy Schools* | 525,427 | 41,290 | 566,717 | 597,618 |
| Other | 907,382 | 62,215 | 969,597 | 912,386 |
| Total Central Government (including Health) | 3,166,172 | 263,756 | 3,429,928 | 3,369,480 |
| Local government | 1,064,711 | 34,577 | 1,099,288 | 971,905 |
| Public corporations | 98,111 | 30,227 | 128,338 | 128,720 |
| TOTAL | 4,328,994 | 328,560 | 4,657,554 | 4,470,105 |
*for missing data and materiality purposes, the ‘Northern Ireland and Scottish FE colleges’ line presented in previous years’ staff numbers tables have been consolidated into ‘Academy Schools’.
In addition to permanently employed staff, ‘other’ includes ministers, special advisers, temporary and contract staff. The cost of the salaries of ministers was £6.5 million (2023‑24: £5.5 million) and the cost of special advisers was £11.9 million (2023-24: £8.1 million). The ministerial salary only includes the additional element on top of the basic salary of an MP.
Civil Service Exit Packages for Central Government 2024-25
| Exit package cost band | Number of compulsory redundancies | Number of other departures agreed | Total number of exit packages by cost band | Total Cost of exit packages £bn |
|---|---|---|---|---|
| <£10,000 | 1,800 | 5,170 | 6,970 | – |
| £10,000 – £50,000 | 2,063 | 3,771 | 5,834 | 0.1 |
| £50,000 – £100,000 | 523 | 1,653 | 2,176 | 0.2 |
| >£100,000 | 198 | 636 | 834 | 0.1 |
| TOTAL | 4,584 | 11,230 | 15,814 | 0.4 |
Civil Service Exit Packages for Local Government 2024-25
| Exit package cost band | Number of compulsory redundancies | Number of other departures agreed | Total number of exit packages by cost band | Total Cost of exit packages £bn |
|---|---|---|---|---|
| <£40,000 | 2,778 | 5,317 | 8,095 | 0.1 |
| £40,000 – £60,000 | 210 | 499 | 709 | – |
| £60,000 – £100,000 | 187 | 476 | 663 | 0.1 |
| >£100,000 | 161 | 400 | 561 | 0.1 |
| TOTAL | 3,336 | 6,692 | 10,028 | 0.3 |
Civil Service Exit Packages for Central Government 2023-24 (*restated)
| Exit package cost band | Number of compulsory redundancies | Number of other departures agreed | Total number of exit packages by cost band | Total Cost of exit packages £bn |
|---|---|---|---|---|
| <£10,000 | 1,440 | 4,730 | 6,170 | 0.1 |
| £10,000 – £50,000 | 1,568 | 4,151 | 5,719 | 0.2* |
| £50,000 – £100,000 | 268 | 2,135 | 2,403 | 0.2* |
| >£100,000 | 141 | 607 | 748 | 0.1* |
| TOTAL | 3,417 | 11,623 | 15,040 | 0.6 |
Civil Service Exit Packages for Local Government 2023-24 (*restated)
| Exit package cost band | Number of compulsory redundancies | Number of other departures agreed | Total number of exit packages by cost band | Total Cost of exit packages £bn |
|---|---|---|---|---|
| <£40,000 | 1,667 | 3,860 | 5,527 | 0.1* |
| £40,000 – £60,000 | 107 | 333 | 440 | – |
| £60,000 – £100,000 | 94 | 344 | 438 | – |
| >£100,000 | 66 | 299 | 365 | – |
| TOTAL | 1,934 | 4,836 | 6,770 | 0.1 |
*Denomination errors were found in 2023-24 figures which have been restated in 2024-25
8. Purchase of Goods, Services and Other Expenditure
| 2024-25 | 2023-24 | |
|---|---|---|
| £bn | £bn | |
| Central government: | ||
| Department of Health and Social Care | 94.8 | 90.4 |
| Ministry of Defence | 28.6 | 25.0 |
| Academies | 8.9 | 9.2 |
| Scottish Government | 9.6 | 11.2 |
| Department for Energy Security and Net Zero | 1.4 | 1.7 |
| Department for Science, Innovation and Technology | 3.6 | 2.3 |
| Department for Business and Trade | 0.6 | 0.6 |
| Department for Transport | 7.7 | 9.1 |
| Welsh Government | 5.9 | 5.0 |
| Ministry of Justice | 3.9 | 3.7 |
| Home Office | 6.7 | 7.4 |
| Department for Education | 3.1 | 3.4 |
| Other | 17.4 | 16.1 |
| Total Central government | 192.2 | 185.1 |
| Local government | 103.2 | 66.8 |
| Public Corporations | ||
| British Broadcasting Corporation | 3.7 | 3.2 |
| Other | 9.9 | 8.6 |
| Total Public Corporations | 13.6 | 11.8 |
| Total purchases of goods, services and other expenditure | 309.0 | 263.7 |
Total purchases of goods and services increased by £45.3 billion (17.2%) in 2024-25 compared with 2023-24, from £263.7 billion to £309.0 billion.
The key categories of expenditure are shown in the table below:
| 2024-25 | 2023-24 | |
|---|---|---|
| £bn | £bn | |
| Facilities costs | 10.0 | 8.1 |
| Accommodation costs | 14.1 | 14.6 |
| Medical goods and services | 72.5 | 70.7 |
| ICT outsourcing and support | 3.7 | 7.1 |
| Travel costs | 4.4 | 3.0 |
| Other goods and services | 75.1 | 53.4 |
| Other expenses | 86.0 | 72.9 |
| Rental and PFI costs | 6.7 | 6.2 |
| Audit costs | 0.3 | 0.3 |
| Loss on disposal of assets | 2.6 | 2.3 |
Central government purchases of goods and services increased by £7.1 billion in 2024‑25. The Department of Health and Social Care (DHSC) recorded the largest increase, up £4.4 billion compared with 2023-24. This was driven primarily by clinical and medical expenditure which rose by £4.4 billion between 2023-24 and 2024-25. The increase in DHSC purchases in 2024-25 mainly reflects inflationary pressures on clinical supplies and outsourced services, increased commissioning of non-NHS healthcare services, higher activity levels, and increased spending on drugs, diagnostics and medical technologies relative to 2023-24.
Local government purchases of goods and services increased by £36.4 billion in 2024‑25. Most of this increase relates to non-submitting entities in 2023-24 who submitted in 2024-25.
Public corporation purchases of goods and services increased by £1.8 billion in 2024-25. The British Broadcasting Corporation (BBC) was the largest individually identified public corporation, reporting £3.7 billion in 2024-25, an increase of £0.5 billion compared with 2023-24.
In terms of coverage, the total impact of entities that did not submit a return in 2024‑25 but did submit in 2023-24 was £6.0 billion. The total impact of entities that did not submit a return in 2023-24 but did submit in 2024-25 was £32.7 billion. Overall, this represents a net increase of £26.7 billion.
9. Grants and Subsidies
| 2024-25 | 2023-24 | |
|---|---|---|
| £bn | £bn | |
| Capital grants | 23.1 | 22.6 |
| Current grants | 55.4 | 73.9 |
| EU grants | 0.8 | 1.9 |
| Other grants | 4.0 | 5.7 |
| Total grants and subsidies | 83.3 | 104.1 |
There was an overall decrease in grants and subsidies of £20.8 billion.
Current grants decreased by £18.5 billion during 2024-25. The most significant falls in current grants were reported by MHCLG and Scottish Government, with £3.8 billion and £3.5 billion reductions relative to prior year respectively.
The components detailed in the table below detail significant elements of entity contributions to the current grants total of £55.4 billion, though do not provide an exhaustive list of all such contributions:
| Entity | Grant | 2024-25 | 2023-24 |
|---|---|---|---|
| £bn | £bn | ||
| Department for Education (DfE) | DfE administer further and higher education grants to colleges and universities. This covers activities such as college condition improvement; post-16 capacity funding and the Skills Teach Grant. | 18.5 | 21.7 |
| Department for Science, Innovation and Technology (DSIT) | DSIT’s grant expenditure supports a wide range of activities, including UK research and innovation, programmes that drive scientific and technological productivity, the development of digital infrastructure, enhancements to cybersecurity and digital government capability and the advancement of emerging technologies such as artificial intelligence and quantum computing. | 9.6 | 8.3 |
| Scottish Government | The Scottish Government provides a range of grants to deliver their policies as reported in the portfolio outturn statements in their consolidated accounts. | 11.5 | 11.3 |
| Department for Work and Pensions (DWP) | Grants awarded to organisations included Kickstart, Household Support Fund and Access to Work schemes. DWP is also responsible for the Social Fund, which is used to make grants to individuals. This includes regulated payments of Funeral Expenses Payments, Sure Start Maternity Grants, Winter Fuel Payments, and Cold Weather Payments. | 5.3 | 7.6 |
| Ministry of Housing, Communities and Local Government (MHCLG) | Grants administered by MHCLG comprise of a variety of programmes including Levelling Up Domestic Grants, Social Care Grants, and the Revenue Support Grant which finances revenue expenditure for local services delivery. | 3.0 | 6.5 |
Capital grants increased by £0.5 billion. A significant contributor was HM Treasury who reported £1.7 billion relating to the Extraordinary Revenue Acceleration (ERA) initiative.
EU grants fell by £1.1 billion in 2024-25 relative to prior year. MHCLG reported the most significant movement, with a fall of £0.7 billion relative to 2023-24.
Other grants also fell by £1.7 billion. This movement is made up of balances that are trivial to WGA.
The total impact of entities who did not submit a return in 2023-24 but who did submit a return in 2024-25 is £0.1 billion, whilst the impact of those who submitted in 2023-24 and did not submit in 2024-25 totalled £0.4 billion. The net impact of missing data is -£0.3 billion.
10. Depreciation and Impairment
| 2024-25 | 2023-24 | |
|---|---|---|
| £bn | £bn | |
| Depreciation of property, plant and equipment | 42.5 | 38.7 |
| Amortisation of intangible assets | 5.0 | 4.4 |
| Impairments and revaluations | 16.4 | 21.1 |
| Total depreciation and impairment | 63.9 | 64.2 |
Impairments refer to the impairment of property, plant and equipment (PPE), inventories, intangible assets, trade receivables, financial assets and losses on revaluation.
Total deprecation and impairment decreased by £0.3 billion between 2023-24 and 2024-25. Depreciation increased by £3.8 billion, and amortisation of intangible assets increased by £0.6 billion in 2024-25 relative to 2023-24, whilst impairments and revaluations decreased by £4.7 billion. Significant contributors to the overall decrease in impairments include a £5.3 billion decrease related to HMRC in impairments on other financial assets, offset by an increase in impairments of £1.6 billion at the Ministry of Defence.
There were a number of entities which contributed to the note total through their data submissions in 2023-24, but which did not make a submission to the WGA this year. These entities contributed a total of £1.2 billion to this note’s total last year. Similarly, there were also a number of entities which made contributions to the note this year but did not make a submission in 2023-24. These entities contributed a total of £5.4 billion to the note this year, yielding a net increase of £4.2 billion overall.
11. Finance Expense
Interest Costs on Government Borrowing
| 2024-25 | 2023-24 | |
|---|---|---|
| £bn | £bn | |
| Interest on gilts | 51.7 | 50.2 |
| National Savings and Investment products | 9.3 | 8.7 |
| Treasury bills | 5.0 | 3.8 |
| Bank deposits and other | 0.7 | 0.7 |
| Total interest costs on government borrowing | 66.7 | 63.4 |
The UK’s government borrowing costs increased from £63.4 billion in 2023-24 to £66.7 billion in 2024-25. Interest cost on Gilts, the largest portion of the public sector borrowing, increased slightly from £50.2 billion in 2023-24 to £51.7 billion, representing an increase of 3.0%.
Gilts are the main vehicle by which the government borrows money. The Debt Management Office purchases newly created bonds (so named ‘Gilts’ for their historic gilded edges) from the National Loans Fund and sells them on to the market in auctions. HM Treasury is responsible for setting the Gilt financing remit, which determines the overall issuance of Gilts. The National Loans Fund is responsible for paying the Gilt coupons and redeeming the debt on maturity.
In 2024-25, Gilt finance costs totalled £51.7 billion. The increase in the gilt interest cost was because of an expanded portfolio of gilts throughout the year, offset somewhat by a reduction of inflation measures, which exert a downward pressure on interest payable on the index-linked gilt book.
Nations Savings & Investment (NS&I) is a government-owned savings institution through which savers can effectively lend money to the government. One of the products offered by NS&I are Premium bonds, which carry a small chance of winning cash prizes of up to £1 million. The interest and prize payments made to savers are recorded as part of the government’s borrowing costs. In 2024-25, these costs increased to £5.0 billion from £3.8 billion in 2023-24.
Treasury Bills (T-bills) are short term debt securities issued by the UK Debt Management Office on behalf of the government, which usually mature within one year. Instead of paying interest, T-bills are issued at a discount to their face value and then redeemed at the full face-value. The difference between the purchase price and the amount repaid represents a gain to the investor and the financing cost to the government. Investors in T-bills are usually institutions, such as banks and pension funds
Financing Cost of Long-Term Liabilities
| Note | 2024-25 | 2023-24 | |
|---|---|---|---|
| £bn | £bn | ||
| Pension financing costs | 25 | 82.3 | 72.0 |
| Provision financing costs | 23 | 8.7 | (44.9) |
| Other finance expense | 51.0 | 55.8 | |
| Total financing costs of long-term liabilities | 142.0 | 82.9 |
Financing costs for long-term liabilities increased significantly from £82.9 billion in 2023‑24 to £142.0 billion in 2024-25.
The increase was largely driven by movements in provision financing costs. In 2023‑24, changes in discount rates applied to long-term provisions resulted in a significant reduction in reported financing costs, reducing the total by £44.9 billion. This effect was partially offset by the normal unwinding of the discount, which increased costs by £2.6 billion. In 2024-25, discount rate changes were much less significant. As a result, provision financing costs returned to a more typical cost level of £8.7 billion.
More details on discount rates for provisions and be found in note 23 and in the performance report.
The financing costs in the table above generally represent non-cash expenses, such as discount rate changes and changes in actuarial assumptions. The public sector holds liabilities which have long redemption timescales, and as such are sensitive to changes in financial assumptions. This can lead to significant movements in reported finance costs from one year to the next, with underlying cash flows remaining relatively stable.
Other financing costs include financing costs for PFI leases of £41.0 billion and IFRS 16 leases of £0.7 billion. Further detail on pensions financing can be found in Note 25 and IFRS 16 leases in Notes 13 and 27.
Several entities contributed to the note total through their data submissions in 2023-24 but did not make a submission to the WGA this year. These entities contributed a total of £0.5 billion to 2023-24. Conversely, several entities made contributions to the note this year but did not submit last year. These entities contributed £2.8 billion to this year’s note total, resulting in a net increase of £2.3 billion due to missing data.
12. Property, Plant and Equipment
| Infrastructure assets | Land and buildings | Assets under construction | Military equipment | Other assets | Total | |
|---|---|---|---|---|---|---|
| £bn | £bn | £bn | £bn | £bn | £bn | |
| Cost or valuation: | ||||||
| At 1 April 2024 | 1,236.9 | 464.8 | 114.0 | 97.1 | 122.9 | 2,035.7 |
| Boundary adjustment | 17.0 | 55.3 | 2.8 | – | 5.1 | 80.2 |
| Restatements | (3.1) | 3.2 | (1.6) | – | (0.5) | (2.0) |
| Additions | 14.9 | 13.7 | 41.9 | 0.6 | 6.4 | 77.5 |
| Revaluations | 8.7 | 4.6 | (0.1) | 6.2 | 0.6 | 20.0 |
| Impairments | (0.6) | (5.5) | (0.8) | (0.9) | (0.7) | (8.5) |
| Reclassifications and transfers | 2.1 | 24.7 | (25.2) | 4.1 | 2.5 | 8.2 |
| Disposals | (0.9) | (5.9) | (0.5) | (3.5) | (6.5) | (17.3) |
| At 31 March 2025 | 1,275.0 | 554.9 | 130.5 | 103.6 | 129.8 | 2,193.8 |
| Depreciation: | ||||||
| At 1 April 2024 | (321.0) | (61.3) | – | (50.6) | (63.7) | (496.6) |
| Boundary adjustment | (5.0) | (1.7) | – | – | (1.7) | (8.4) |
| Restatements | 1.9 | (8.4) | – | – | 0.5 | (6.0) |
| Charged in year | (14.5) | (12.6) | – | (3.7) | (7.8) | (38.6) |
| Revaluations | 4.6 | 2.4 | – | (2.0) | (0.3) | 4.7 |
| Impairments | – | 0.1 | – | 0.5 | 0.2 | 0.8 |
| Reclassifications and transfers | 0.2 | (2.7) | – | – | 0.7 | (1.8) |
| Disposals | 0.8 | 2.1 | – | 3.8 | 5.8 | 12.5 |
| At 31 March 2025 | (333.0) | (82.1) | – | (52.0) | (66.3) | (533.4) |
| Carrying amount at 31 March 2024 | 915.9 | 403.5 | 114.0 | 46.5 | 59.2 | 1,539.1 |
| Carrying amount at 31 March 2025 | 942.0 | 472.8 | 130.5 | 51.6 | 63.5 | 1,660.4 |
| Asset financing: | ||||||
| Owned | 904.5 | 442.1 | 130.5 | 51.6 | 61.0 | 1,589.7 |
| Finance leased | – | – | – | – | – | – |
| PFI reversionary interest | – | 0.2 | – | – | – | 0.2 |
| On balance sheet PFI contracts | 37.5 | 30.5 | – | – | 2.5 | 70.5 |
| Carrying amount at 31 March 2025 | 942.0 | 472.8 | 130.5 | 51.6 | 63.5 | 1,660.4 |
Infrastructure assets include the following:
| 2024-25 | 2023-24 | |
|---|---|---|
| £bn | £bn | |
| Rail network as reported by the Department for Transport and managed by Network Rail | 490.4 | 471.9 |
| Strategic road network assets as reported by the Department for Transport and managed by Highways England | 151.6 | 159.7 |
| Road network assets held by the Scottish Government | 27.2 | 27.4 |
| Networked assets held by Scottish Water | 106.4 | 103.3 |
| Infrastructure assets held by the Department for Infrastructure – Northern Ireland | 36.6 | 36.2 |
| Networked assets held by the Welsh Government | 23.3 | 23.9 |
| Networked assets held by local authorities | 91.8 | 77.8 |
| Networked assets held by Transport for London (included in local authorities total above) | 37.3 | 37.5 |
The carrying value of infrastructure assets increased by £26.1 billion during 2024-25. The Department for Transport is the most significant contributor to this increase and had an increase of £10.4 billion on the prior year (2023-24: £634.2 billion). This included £18.9 billion in revaluation gains at cost in the rail network, offset by £8.6 of revaluation losses at cost in the strategic road network. Networked assets held by Scottish Water are the second largest contributor to the value of infrastructure assets. Scottish Water saw an increase in value of £3.1 billion during 2024-25. Networked assets held by local authorities increased by £14.0 billion. This came mainly from entities who had not submitted data in 2023-24 but did submit data in 2024-25. Further information on the valuation of infrastructure assets is included in the critical accounting estimates and judgements in Note 2.4. Further information on depreciation charges across the accounts is provided in Note 10.
Land and Buildings saw an increase in carrying value of £69.3 billion during 2024-25. The biggest holders of Land and Buildings are the Academies sector, the Department of Health and Social Care and the Ministry of Defence. The biggest change experienced during 2024-25 was an £11.6 billion increase for the Ministry of Defence attributed to reclassification of right of use assets to owned buildings. The other main driver for the increase is the boundary adjustment of £53.6 billion (net impact) due to missing data (see below).
Assets under construction saw an increase in carrying value of £16.5 billion during 2024-25. The Department for Transport increased by £6.7 billion to £37.8 billion (2023‑24 £31.1 billion) and the Ministry of Defence assets under construction increased by £4.6 billion to £48.3 billion (2023-24 £43.7 billion).
Other assets consist of:
| Plant and machinery | Transport equipment | IT equipment | Furniture, fittings and other | Total other assets | |
|---|---|---|---|---|---|
| £bn | £bn | £bn | £bn | £bn | |
| Carrying amount at 31 March 2024 | 20.8 | 12.8 | 6.1 | 19.5 | 59.2 |
| Carrying amount at 31 March 2025 | 22.5 | 12.3 | 6.1 | 22.6 | 63.5 |
Some heritage assets are not recognised on the Statement of Financial Position or in this note because the cost of valuing these unique assets outweighs the benefits.
Other assets saw an increase of £4.3 billion during 2024-25, £1.0 billion of which was an increase in Furniture, fittings and other for the Department of Culture, Media and Sport.
Entities submitting data in 2023-24 but not in 2024-25 contributed £2.0 billion to other assets in 2023-24. Conversely entities contributed £5.3 billion to other assets in 2024-25 who did not submit in 2023-24.
The boundary adjustment line above reflects a net increase of £71.8 billion due to entities that submitted data to WGA in either the current or prior year, but not both.
Several entities contributed a total of £29.3 billion to this note in 2023-24 but did not submit data to the WGA in 2024-25. Conversely, several entities contributed a total of £101.1 billion to this note this year but did not submit data in 2023-24. This results in a net increase due to missing data of £71.8 billion.
Property, Plant and Equipment 2023-24
| Infrastructure assets | Land and buildings | Assets under construction | Military equipment | Other assets | Total | |
|---|---|---|---|---|---|---|
| £bn | £bn | £bn | £bn | £bn | £bn | |
| Cost or valuation: | ||||||
| At 1 April 2023 | 1,122.9 | 463.5 | 97.3 | 94.6 | 121.3 | 1,899.6 |
| Boundary adjustment | (3.9) | (10.5) | (0.5) | – | (1.2) | (16.1) |
| Restatements | (0.8) | (0.3) | (0.2) | – | 0.1 | (1.2) |
| Additions | 14.1 | 9.2 | 40.1 | 0.5 | 5.1 | 69.0 |
| Revaluations | 104.5 | 3.6 | (0.2) | 2.1 | 0.4 | 110.4 |
| Impairments | (0.2) | (5.6) | (1.7) | 0.1 | (0.1) | (7.5) |
| Reclassifications and transfers | 1.5 | 10.5 | (20.2) | 3.2 | 3.2 | (1.8) |
| Disposals | (1.2) | (5.6) | (0.6) | (3.4) | (5.9) | (16.7) |
| At 31 March 2024 | 1,236.9 | 464.8 | 114.0 | 97.1 | 122.9 | 2,035.7 |
| Depreciation: | ||||||
| At 1 April 2023 | (291.9) | (60.0) | – | (49.8) | (62.6) | (464.3) |
| Boundary adjustment | 1.4 | 2.3 | – | – | 0.3 | 4.0 |
| Restatements | 0.4 | 0.6 | – | – | 0.1 | 1.1 |
| Charged in year | (13.5) | (11.0) | – | (3.6) | (7.2) | (35.3) |
| Revaluations | (17.9) | 3.8 | – | (0.7) | – | (14.8) |
| Impairments | (0.1) | 0.1 | – | – | (0.1) | (0.1) |
| Reclassifications and transfers | – | 1.0 | – | 0.3 | 0.3 | 1.6 |
| Disposals | 0.6 | 1.9 | – | 3.2 | 5.5 | 11.2 |
| At 31 March 2024 | (321.0) | (61.3) | – | (50.6) | (63.7) | (496.6) |
| Carrying amount at 31 March 2023 | 831.0 | 403.5 | 97.3 | 44.8 | 58.7 | 1,435.3 |
| Carrying amount at 31 March 2024 | 915.9 | 403.5 | 114.0 | 46.5 | 59.2 | 1,539.1 |
| Asset financing: | ||||||
| Owned | 879.6 | 371.8 | 113.5 | 46.5 | 56.4 | 1,467.8 |
| Finance leased | – | 2.2 | – | – | 0.2 | 2.4 |
| PFI reversionary interest | – | – | – | – | – | – |
| On balance sheet PFI contracts | 36.3 | 29.5 | 0.5 | – | 2.6 | 68.9 |
| Carrying amount at 31 March 2024 | 915.9 | 403.5 | 114.0 | 46.5 | 59.2 | 1,539.1 |
13. Right of Use Assets
| Land and buildings | Other assets | Total | |
|---|---|---|---|
| £bn | £bn | £bn | |
| Cost or valuation: | |||
| At 1 April 2024 | 32.9 | 9.6 | 42.5 |
| Boundary Adjustments | 0.2 | – | 0.2 |
| Restatements | 0.4 | 0.1 | 0.5 |
| Cumulative Catch up | 4.2 | 0.6 | 4.8 |
| Additions | 2.4 | 1.7 | 4.1 |
| Revaluations and impairments | 0.5 | 0.8 | 1.3 |
| Reclassifications and transfers | (11.5) | 0.5 | (11.0) |
| Disposals | (1.1) | (0.3) | (1.4) |
| At 31 March 2025 | 28.0 | 13.0 | 41.0 |
| Depreciation: | |||
| At 1 April 2024 | (9.3) | (5.2) | (14.5) |
| Charged in year | (2.3) | (1.6) | (3.9) |
| Revaluations and impairments | (0.1) | – | (0.1) |
| Reclassifications and transfers | 3.9 | (0.1) | 3.8 |
| Disposals | 0.7 | 0.3 | 1.0 |
| As at 31 March 2025 | (7.1) | (6.6) | (13.7) |
| Carrying amount at 31 March 2024 | 23.6 | 4.4 | 28.0 |
| Carrying amount at 31 March 2025 | 20.9 | 6.4 | 27.3 |
IFRS 16 has been adopted by central government and local government for the 2024-25 WGA. Central government departments and NHS bodies adopted IFRS 16 from 1 April 2022 (financial year 2022-23) under the FReM, generally using a modified retrospective approach. Local government bodies adopted from 1 April 2024 (financial year 2024-25) under the CIPFA/LASAAC Code. As a result, the 2022-23 and 2023-24 WGAs were prepared on a mixed basis: most central government and NHS components reported under IFRS 16, while local government components continued to report under IAS 17. 2024-25 WGA is the first prepared on a fully consistent IFRS 16 basis across all major sectors.
Land and buildings include £4.9 billion (2023-24: £4.7 billion) of rightofuse assets held by the Department of Health and Social Care (DHSC). The Ministry of Defence (MoD) rightofuse assets decreased from £10.5 billion in 2023-24 to £0.2 billion in 2024-25 due to the reclassification of certain assets to property, plant and equipment (PPE). In 2024‑25, these transfers included accommodation for Service Personnel previously leased. The MoD purchased these properties, notably accommodation for Service Personnel and their families, terminating the previous lease; this was accounted for as exercising a purchase option under IFRS 16. On payment to extinguish the lease liability and obtain legal ownership, the properties were reclassified from rightofuse assets to PPE. The total value reclassified from rightofuse assets to PPE was £9.0 billion.
Other assets consist of:
| Transport equipment | Plant and machinery | IT equipment | Furniture, fittings and other | Total other assets | |
|---|---|---|---|---|---|
| £bn | £bn | £bn | £bn | £bn | |
| Carrying amount at 31 March 2024 | 2.2 | 1.9 | 0.2 | 0.1 | 4.4 |
| Carrying amount at 31 March 2025 | 2.7 | 2.3 | 0.2 | 1.2 | 6.4 |
Boundary adjustments comprise entities that did not submit data in 2024-25 but did submit data in 2023-24 and vice-versa. There was a net increase of £0.2 billion, comprising £0.3 billion relating to entities that submitted in 2024-25 but not in 2023‑24 and £0.1 billion relating to entities that submitted in 2023-24 but not submitted in 2024‑25.
Right of Use Assets 2023-24
| Land and buildings | Other assets | Total | |
|---|---|---|---|
| £bn | £bn | £bn | |
| Cost or valuation: | |||
| At 1 April 2023 | 26.1 | 6.5 | 32.6 |
| Boundary adjustments | (0.3) | – | (0.3) |
| Restatements | 4.8 | 2.1 | 6.9 |
| Cumulative catch up | 0.2 | (0.4) | (0.2) |
| Additions | 2.6 | 1.3 | 3.9 |
| Revaluations and impairments | 0.8 | 0.2 | 1.0 |
| Reclassifications and transfers | – | – | – |
| Disposals | (1.3) | (0.1) | (1.4) |
| At 31 March 2024 | 32.9 | 9.6 | 42.5 |
| Depreciation: | |||
| At 1 April 2023 | (2.1) | (1.7) | (3.8) |
| Boundary adjustments | 0.1 | – | 0.1 |
| Restatements | (4.9) | (2.3) | (7.2) |
| Charged in year | (2.0) | (1.4) | (3.4) |
| Revaluations and impairments | (0.7) | – | (0.7) |
| Reclassifications and transfers | – | 0.1 | 0.1 |
| Disposals | 0.3 | 0.1 | 0.4 |
| At 31 March 2024 | (9.3) | (5.2) | (14.5) |
| Carrying amount at 31 March 2023 | 24.0 | 4.8 | 28.8 |
| Carrying amount at 31 March 2024 | 23.6 | 4.4 | 28.0 |
14. Investment Properties
| 2024-25 | 2023-24 | |
|---|---|---|
| £bn | £bn | |
| Balance at 1 April | 14.3 | 14.2 |
| Boundary adjustment | 1.2 | 0.9 |
| Restatements | – | (0.4) |
| Additions | 0.4 | 0.3 |
| Revaluations and impairments | – | (0.5) |
| Disposals | (0.4) | (0.2) |
| Balance at 31 March | 15.5 | 14.3 |
Investment properties are comprised mainly of land and buildings owned by local authorities. These assets are held to generate rental income and/or capital appreciation and form part of local authorities’ wider financial strategies to support service funding and reduce reliance on general reserves to meet ongoing expenditure.
The total balance of investment properties was £15.5 billion (2023-24: £14.3 billion). Of this, £14.7 billion (2023-24: £13.1 billion) is held within the local government sector and £0.8 billion (2023-24: £1.2 billion) is held within the central government sector.
Transport for London (TfL) is the largest contributor to the investment properties balance in 2024-25. During the year, TfL identified and transferred properties held for rental income or capital appreciation into a designated investment portfolio, alongside existing investment properties, to support the consolidation of its commercial property holdings. The introduction of new lease structures also enabled the recognition, for the first time, of newly separable investment property assets. These assets have been brought together within a vehicle intended to support delivery of homes under the Mayor’s Transport Strategy, generate a growing sustainable income stream, and facilitate the raising of debt and equity to fund capital requirements Assets such as car parks and other property interests are also classified as investment property.
Boundary adjustments reflect entities that submitted data in one year but not the other. Entities that contributed £2.5 billion to the note total in 2023-24 did not submit in 2024‑25, while entities contributing £3.7 billion in 2024-25 did not submit in 2023-24. Overall, this results in a net increase due to missing-data movements of £1.2 billion.
15. Intangible Assets
Intangible Assets 2024-25
| Military equipment | Development expenditure | Software | Licences and other | Total | |
|---|---|---|---|---|---|
| £bn | £bn | £bn | £bn | £bn | |
| Cost or valuation: | |||||
| At 1 April 2024 | 46.0 | 15.7 | 17.3 | 14.4 | 93.4 |
| Boundary Adjustment | – | – | 2.4 | 0.6 | 3.0 |
| Restatements | – | 0.1 | (1.5) | (0.1) | (1.5) |
| Additions | 2.6 | 2.8 | 1.2 | 1.7 | 8.3 |
| Revaluations and impairments | – | 0.1 | 0.2 | – | 0.3 |
| Reclassifications and transfers | (0.1) | (1.4) | 1.6 | 0.2 | 0.3 |
| Disposals | (1.5) | (0.4) | (1.3) | (0.9) | (4.1) |
| At 31 March 2025 | 47.0 | 16.9 | 19.9 | 15.9 | 99.7 |
| Amortisation: | |||||
| At 1 April 2024 | (15.0) | (7.1) | (10.8) | (8.4) | (41.3) |
| Boundary Adjustment | – | – | (1.1) | (0.4) | (1.5) |
| Restatements | – | (0.1) | 0.9 | (0.3) | 0.5 |
| Charged in year | (1.0) | (0.7) | (1.9) | (1.4) | (5.0) |
| Revaluations and impairments | (0.1) | (0.2) | (0.1) | – | (0.4) |
| Reclassifications and transfers | – | – | – | – | – |
| Disposals | 1.5 | 0.3 | 1.3 | 0.9 | 4.0 |
| At 31 March 2025 | (14.6) | (7.8) | (11.7) | (9.6) | (43.7) |
| Carrying amount at 31 March 2024 | 31.0 | 8.6 | 6.5 | 6.0 | 52.1 |
| Carrying amount at 31 March 2025 | 32.4 | 9.1 | 8.2 | 6.3 | 56.0 |
Intangible assets have risen by £3.9 billion, from £52.1 billion in 2023-24 to £56.0 billion in 2024-25. Growth was seen in all asset classes with the largest increase in the carrying amount of software assets of £1.7 billion.
The increase in Software Assets is partly due to the inclusion of previously missing opening balances. £2.4 billion of cost and £1.1 billion of accumulated amortisation have been recognised in 2024-25 that were not included in 2023-24, increasing the opening carrying value by £1.3 billion.
There were no missing data adjustments in 2024-25 for either Military Equipment or Development Expenditure. Capital additions in the year were £2.6 billion for Military Equipment and £2.8 billion for Development Expenditure. The Military Equipment balance of £32.4 billion (2023-24: £31.0 billion) relates to assets held within the Ministry of Defence and is made up of Single Use Military Equipment and Assets Under Construction (AUC) as per the Ministry of Defence published accounts (see Ministry of Defence Annual Reports and Accounts 2024-25). The largest contributor to Development Expenditure is also the Ministry of Defence.
Several entities contributed to the note total through their data submissions in 2023-24 but did not make a submission to the WGA this year, collectively adding £0.1 billion to last year’s note total. Similarly, several entities made contributions to the note this year but did not submit data in 2023-24, contributing £1.6 billion to this year’s total. This has been split in the above table between cost and accumulated amortisation..
Intangible Assets 2023-24
| Military equipment | Development expenditure | Software | Licences and other | Total | |
|---|---|---|---|---|---|
| £bn | £bn | £bn | £bn | £bn | |
| Cost or valuation: | |||||
| At 1 April 2023 | 43.7 | 14.5 | 16.4 | 13.6 | 88.2 |
| Boundary Adjustment | – | – | – | (0.2) | (0.2) |
| Restatements | – | 0.1 | – | (0.2) | (0.1) |
| Additions | 2.6 | 2.5 | 1.1 | 2.0 | 8.2 |
| Revaluations and impairments | 0.4 | 0.1 | 0.5 | – | 1.0 |
| Reclassifications and transfers | – | (1.1) | 1.1 | 0.2 | 0.2 |
| Disposals | (0.7) | (0.4) | (1.8) | (1.0) | (3.9) |
| At 31 March 2024 | 46.0 | 15.7 | 17.3 | 14.4 | 93.4 |
| Amortisation: | |||||
| At 1 April 2023 | (14.4) | (6.8) | (10.5) | (8.6) | (40.3) |
| Boundary Adjustment | – | – | – | 0.2 | 0.2 |
| Restatements | – | (0.1) | – | 0.2 | 0.1 |
| Charged in year | (1.0) | (0.6) | (1.7) | (1.1) | (4.4) |
| Revaluations and impairments | (0.2) | (0.1) | (0.4) | (0.1) | (0.8) |
| Reclassifications and transfers | – | 0.1 | – | – | 0.1 |
| Disposals | 0.6 | 0.4 | 1.8 | 1.0 | 3.8 |
| At 31 March 2024 | (15.0) | (7.1) | (10.8) | (8.4) | (41.3) |
| Carrying amount at 31 March 2023 | 29.3 | 7.7 | 5.9 | 5.0 | 47.9 |
| Carrying amount at 31 March 2024 | 31.0 | 8.6 | 6.5 | 6.0 | 52.1 |
16. Trade and Other Receivables
| 2024-25 | 2023-24 | |
|---|---|---|
| £bn | £bn | |
| Non-current: | ||
| Taxation and duties due | 3.0 | 3.8 |
| Trade receivables | 2.3 | 1.0 |
| Other receivables | 10.5 | 11.3 |
| EU receivables | 2.0 | 2.6 |
| Prepayments and accrued revenue | 1.7 | 1.5 |
| Welfare overpayments | 4.7 | 4.1 |
| Contract assets | 0.9 | 0.8 |
| Total before impairment | 25.1 | 25.1 |
| Less: provision for impairment of receivables | (3.6) | (3.7) |
| Total non-current trade and other receivables | 21.5 | 21.4 |
| Current: | ||
| Accrued tax revenue receivable | 148.2 | 146.5 |
| Taxation and duties receivable | 66.6 | 56.7 |
| Trade receivables | 13.7 | 11.1 |
| Other receivables | 17.4 | 17.4 |
| EU Receivables | 1.0 | 1.9 |
| Prepayments and accrued revenue | 16.4 | 14.0 |
| Welfare overpayments | 1.1 | 1.0 |
| Court fines | 4.7 | 4.4 |
| Contract assets | 5.2 | 5.2 |
| Total before impairment | 274.3 | 258.2 |
| Less: provision for impairment of receivables | (45.6) | (40.5) |
| Total current trade and other receivables | 228.7 | 217.7 |
| Total trade and other receivables | 250.2 | 239.1 |
Non-Current
There was a £0.1 billion increase in non-current receivables in 2024-25 relative to prior year. The area that saw the most significant change was ‘Trade Receivables’, which increased by £1.3 billion.
There were a number of entities which contributed to the non-current receivables total through their data submissions in 2023-24 but did not make a submission to the WGA this year. These entities contributed a total of £0.8 billion to the 2023-24 total. Similarly, there were also a number of entities which made contributions to the non-current total this year but did not make a submission in 2023-24. These entities contributed a total of £1.7 billion of non-current receivables in 2024-25, yielding a net increase of £0.8 billion due to missing data.
Current
Accrued tax revenue receivable represents amounts of taxes and duties relating to 2024-25 that were not yet due or received from taxpayers at year end, where these have not been included in taxation and duties due and collection is reasonably certain. This figure is an estimated valuation, supported by tax returns received after the year end.
Taxation and duties receivable represents all taxpayer liabilities that have been established, irrespective of whether due or overdue, for which payments have not been received by HMRC.
The £11.0 billion increase in total current receivables is primarily the result of an increase in ‘Taxation and Duties Receivable’ of £9.9 billion relative to prior year. The key driver of this was income tax receivable, which increased by £5.6 billion as a result of a combination of factors including fiscal drag and wage growth throughout the period.
There were a number of entities which contributed to the current receivables total through their data submissions in 2023-24, but which did not make a submission to the WGA this year. These entities contributed a total of £2.1 billion to the total last year. Similarly, there were also a number of entities which made contributions to the total this year but did not make a submission in 2023-24. These entities contributed a total of £6.2 billion of current receivables to the note this year, giving a net increase of £4.1 billion, as a result of missing data.
The provision for impairment of receivables is analysed below:
| Current | Non-current | 2024-25 | 2023-24 | |
|---|---|---|---|---|
| £bn | £bn | £bn | £bn | |
| Taxation and duties due | 31.5 | 1.5 | 33.0 | 30.7 |
| Welfare payments | 0.3 | 2.0 | 2.3 | 2.0 |
| Court fines | 4.0 | – | 4.0 | 3.7 |
| Other trade and other receivables | 9.8 | 0.1 | 9.9 | 7.8 |
| Total provision for impairment of receivables | 45.6 | 3.6 | 49.2 | 44.2 |
17. Other Financial Assets
| 2024-25 | 2023-24 | |
|---|---|---|
| £bn | £bn | |
| Non-current: | ||
| Loans and deposits | 80.3 | 188.8 |
| Student loans | 172.1 | 164.6 |
| Equity investments | 51.8 | 52.1 |
| IMF quota subscription | 20.7 | 21.1 |
| Derivatives and other financial assets | 40.9 | 43.4 |
| Total non-current other financial assets | 365.8 | 470.0 |
| Current: | ||
| Debt securities | 108.9 | 96.5 |
| Loans and deposits | 171.9 | 85.3 |
| Student loans | 6.0 | 4.5 |
| Equity investments | 1.1 | 1.2 |
| IMF Special drawing rights | 34.5 | 35.8 |
| Derivatives and other financial assets | 7.9 | 14.3 |
| Total current other financial assets | 330.3 | 237.6 |
| Total other financial assets | 696.1 | 707.6 |
Non-current Loans and deposits decreased by £108.5 billion between 2023-24 and 2024-25. The primary driver of this movement continued to be the reclassification of Term Funding Scheme Small and Medium Sized Entities (TFSME) loans that are now due to mature within 12 months, alongside terminations in year. The impact of this was a £91.7 billion reduction to TFSME loans due to mature in over 12 months, falling to £41.9 billion.
The TFSME was launched in March 2020, the Bank of England’s Policy Committees announced a comprehensive package of measures to help UK businesses and households manage the economic disruption caused by Covid-19 . The scheme closed to new drawdowns on 31 October 2021. Each transaction has a contractual term of four years from the date of drawdown, with some extensions applied.
Current loans and deposits increased by £86.6 billion during 2024-25. Whilst £37.1 billion of the increase reflects an increase in TFSME loans maturing within 12 months, the primary driver was an increase in secured lending agreements, which increased by £61.2 billion between 2023-24 and 2024-25. This is reflected in the ‘repurchase agreements’ line in the ‘loans and deposits’ table, below.
Loans and deposits comprise:
| Non-current | Current | 2024-25 | 2023-24 | |
|---|---|---|---|---|
| £bn | £bn | £bn | £bn | |
| Loans | 77.1 | 61.8 | 138.9 | 214.2 |
| Deposits | 3.2 | 7.0 | 10.2 | 11.3 |
| Repurchase agreements | – | 103.1 | 103.1 | 48.6 |
| Total loans and deposits | 80.3 | 171.9 | 252.2 | 274.1 |
Repurchase agreements are funds advanced to banks under reverse repurchase agreements, where securities are held as collateral and returned when the funds are repaid.
The £54.5 billion increase between 2023-24 and 2024-25 was driven by higher demand for open market operations, associated with a reduction in reserves as the Bank of England reduces the size of its balance sheet. Methods to do so include unwinding of the TFSME and quantitative tightening through reducing the number of bonds reissued after maturity.
Student loans. A summary of changes for 2024-25 is shown below:
| 2024-25 | 2023-24 | |
|---|---|---|
| £bn | £bn | |
| As at 1 April | 169.1 | 154.5 |
| New loans issued (net of impairment) | 23.4 | 22.3 |
| Repayments | (5.3) | (4.9) |
| Fair value movement | (0.8) | (2.9) |
| Impairment adjustments | (8.3) | 0.1 |
| Fair value movement as at 31 March | 178.1 | 169.1 |
Student loan balances increased by £9.0 billion, rising to £178.1 billion in 2024-25 (2023‑24: £169.1 billion). The increase was primarily driven by £23.4 billion of new loans issued during the year.
Within this total increase, loans issued under Plan 5 and Plan 2 in England totalled £10.2 billion and £9.7 billion respectively. The movements reflect a £6.6 billion increase in Plan 5 lending, largely offset by a £6.1 billion reduction in Plan 2 lending between 2023‑24 and 2024-25. Plan 5 loans were introduced for new entrants from 2023-24 and differ from Plan 2 through revised repayment terms, including a lower earnings threshold and a longer repayment period.
Under IFRS 9, student loans are recognised at fair value. In determining the fair value of student loans, a discounted cash flow model has been used (see table below) which includes all expected cash flows, including the interest that is expected to be received. As a result, a single fair value movement is recognised in the statement of revenue and expenditure and the Department for Education’s statement of comprehensive net expenditure.
| 2024-25 | 2023-24 | |
|---|---|---|
| £bn | £bn | |
| Deferral of the difference in fair value and amount advanced to students on new loans | (6.0) | (5.7) |
| Changes made to student loan valuation model | 0.2 | (2.9) |
| Interest | 4.0 | 5.4 |
| Operational costs | (0.1) | (0.1) |
| Other fair value movement | (6.7) | 0.8 |
| As at 31 March | (8.6) | (2.5) |
The equity investments held by the government comprise:
| 2024-25 | 2023-24 | |
|---|---|---|
| £bn | £bn | |
| NatWest (formerly RBS) | 1.3 | 6.8 |
| Other | 51.6 | 46.5 |
| Total equity investments | 52.9 | 53.3 |
Equity investments reduced to £52.9 billion (2023-24: £53.3 billion). This reflects a £5.5 billion reduction in the value of NatWest ordinary shares (formerly Royal Bank of Scotland) held by HM Treasury.
HM Treasury has continued to dispose of NatWest shares. As a result, the shareholding of HM Treasury has reduced from 2,556 million shares representing 29.3% of the ordinary share capital of NatWest Group at 31 March 2024, to 291 million shares, representing approximately 3.6% of the ordinary share capital at 31 March 2025.
The three largest contributors to ‘Other’ equity include: Scottish Government £8.1 billion (2023-24: £7.8 billion), Foreign and Commonwealth Development Office investment portfolio at £5.5 billion (2023-24: £5.2 billion) and British International Investment at £5.3 billion (2023-24: £5.3 billion).
The IMF quota subscription and Special Drawing Rights (SDRs) relate to the UK’s investments in the IMF. On becoming a member of IMF in 1944, the UK was required to pay a quota subscription to the IMF in a mixture of SDRs, the IMF’s unit of account, and other widely accepted currencies.
The UK’s quota subscription of 20.2 billion SDRs was equivalent to £20.7 billion at 31 March 2025, a decrease of £0.4 billion compared to the prior year. The valuation change is driven by the Great British Pound: Special Drawing Rights exchange rate. The value of the latter is based on spot exchange rates of a weighted basket of 5 major currencies, namely GBP, USD, RMB, JPY and EUR.
The £12.4 billion increase in debt securities in 2024-25 includes £6.2 billion in money market instruments, reflecting increased demand for commercial paper issuances.
The overall value of derivatives and other financial assets decreased by £8.9 billion to £48.8 billion (2023-24: £57.7 billion), driven primarily by a fall in demand deposits with the Debt Management Account.
Several entities that contributed to the note total through their data submissions in 2023-24 did not make a submission to the WGA this year. These entities accounted for £2.3 billion of the note’s total last year. Conversely, some entities made contributions this year but did not submit data last year, contributing £5.8 billion to the note this year. This results in a net increase of £3.5 billion due to missing data.
18. Inventories
| Raw materials and consumables | Other | 2024-25 Total | 2023-24 Total | |
|---|---|---|---|---|
| £bn | £bn | £bn | £bn | |
| As at 1 April | 8.1 | 5.1 | 13.2 | 13.2 |
| Boundary Adjustments | 0.1 | 0.1 | 0.2 | – |
| Additions | 19.7 | 5.4 | 25.1 | 24.3 |
| Disposals | (18.2) | (5.5) | (23.7) | (23.2) |
| Write on / (offs) | (0.8) | (0.3) | (1.1) | (0.9) |
| Revaluation and reclassification | – | (0.1) | (0.1) | (0.2) |
| As at 31 March | 8.9 | 4.7 | 13.6 | 13.2 |
The bulk of raw materials and consumables are managed by two government departments: the Department of Health and Social Care (DHSC) and the Ministry of Defence (MoD). DHSC holds inventories valued at £2.3 billion (2023-24: £2.2 billion), primarily related to consumables, drugs, adult and childhood vaccines, and Covid-19 related stock.
The MoD’s figure of £5.1 billion (2023-24: £4.6 billion) primarily comprises engineering and technical stock (£2.6 billion) and munitions (£1.7 billion). The inventory includes items such as Guided Weapons, Missiles and Bombs (GWMB), significant equipment spares (e.g. engines), as well as Raw Materials and Consumables (RMC).
The Other inventories of £4.7 billion (2023-24: £5.1 billion) encompass a diverse array of stocks and supplies across the public sector. The most substantial portion consists of assets in property and development land held by the Ministry of Housing, Communities and Local Government (MHCLG) totalling £1.2 billion (2023-24: £1.3 billion) and programme-related assets by the British Broadcasting Corporation (BBC) of £1.2 billion (2023-24: £1.2 billion).
Boundary adjustments reflect entities that submitted data in one year but not the other. There was no impact on the note total in 2023-24. However, entities that contributed £0.2 billion in 2024-25 did not submit in 2023-24. Overall, this results in a net increase of £0.2 billion due to boundary changes.
19. Cash and Cash Equivalents
| 2024-25 | 2023-24 | |
|---|---|---|
| £bn | £bn | |
| Balance at 1 April | 39.5 | 43.9 |
| Boundary adjustment | 2.6 | (0.9) |
| Change in cash and cash equivalent balances | (1.4) | (3.5) |
| Balance at 31 March | 40.7 | 39.5 |
| The following balances at 31 March were held at: | ||
| Government Banking Service | (3.5) | (4.1) |
| Commercial banks and cash in hand | 21.1 | 22.4 |
| Short term investments | 23.1 | 21.2 |
| Balance at 31 March | 40.7 | 39.5 |
Cash and Cash Equivalents increased by £1.2 billion to £40.7 billion (2023-24: £39.5 billion).
Cash held at the Government Banking Service shows a balance of (£3.5) billion (2023‑24: (£4.1) billion). This is a combination of positive balances held by government departments as part of the Government Banking Scheme, offset by (£49.1) billion (2023‑24: (£44.4) billion) held by the National Loans Fund. The National Loans Fund cash balance held with the Government Banking Service (GBS) decreased by £4.7 billion (11%). The overall balance is negative due to the government’s cash management practices.
The Department of Health and Social Care is the largest owner of cash held at the GBS. Its asset decreased by £0.9 billion to £13.0 billion (2023-24: £13.9 billion).
Cash held by commercial banks decreased by £1.3 billion to £21.1 billion (2023-24: £22.4 billion) with the school Academy sector being the largest holder of cash in commercial and other bank accounts holding £6.0 billion. This makes up 28% of the £21.1 billion WGA total 2024-25.
There was a £1.9 billion increase in short-term investments. The largest element relates to The Bank of England holding £11.4 billion (2023-24: £6.4 billion) which makes up 49% of the total short-term investments in 2024-25. The £5.0 billion increase is a result of them increasing their loans and advances to banks and other financial institutions by £5.2 billion offset by a reduction in cash and balances with other central banks and securities held at fair value through profit and loss.
The Exchange Equalisation Fund saw its cash and cash equivalents decrease by £2.7 billion (38%) to £4.4 billion (2023-24: £7.1 billion). This was mostly due to liquid deposits decreasing by £1.8 billion (95%) to £0.1 billion (2023-24: £1.9 billion) alongside commercial banks and cash in hand also decreasing by £1.2 billion to £1.8 billion (2023‑24: £4.0 billion). This was minimally offset by an increase in government banking service increasing.
Some entities included in 2023-24 did not submit data in 2024-25, contributing £1.4 billion to last year’s total. Entities included in 2024-25 but not in 2023-24 contributed £4.0 billion. This resulted in a net increase of £2.6 billion between years, arising from non-submission (missing returns) in 2024-25 and the inclusion of new entities.
20. Trade and Other Payables
| 2024-25 | 2023-24 | |
|---|---|---|
| £bn | £bn | |
| Non-current: | ||
| Trade and other payables | 7.3 | 6.3 |
| Accruals and deferred income | 11.8 | 10.5 |
| Imputed finance lease element of on-balance sheet PFI contracts | 36.4 | 34.0 |
| Obligations under finance leases | – | 0.9 |
| Contract liabilities | 1.7 | 1.6 |
| Total non-current trade and other payables | 57.2 | 53.3 |
| Current: | ||
| Trade and other payables | 39.8 | 36.4 |
| Accruals and deferred income | 82.6 | 81.6 |
| Refunds of taxation and duties payable | 52.4 | 51.6 |
| Imputed finance lease element of on-balance sheet PFI contracts | 2.3 | 1.9 |
| Obligations under finance leases | – | 0.1 |
| Contract liabilities | 3.0 | 3.4 |
| Total current trade and other payables | 180.1 | 175.0 |
| Total trade and other payables | 237.3 | 228.3 |
Total trade and other payables increased by £9.0 billion to a total of £237.3 billion in 2024-25, from £228.3 billion in 2023-24. The above categories are regular liabilities which arise in the normal course of public sector business. The increase in payables was driven by the recovery of the missing data position, offset by a small decrease in other entities’ submissions.
Adoption of IFRS 16 has continued to reduce the liabilities reported here for obligations under finance leases. In 2024-25 local government entities in the WGA accounting boundary adopted IFRS 16. This was the last sector consolidated into WGA yet to adopt. As a result, some finance leases will be de-recognised, while some will be reported elsewhere in WGA, in line with the recognition requirements of IFRS 16. Further information on Obligations under leases can be found in Note 27. Further information on PFI commitments can be found in Note 28.
Trade and other payables, accruals, and deferred income are held across a wide range of public sector entities and relate to both day-to-day business delivery costs and other financial obligations. Refunds of taxation and other duties payable relates mainly to council tax and business rates owed to the taxpayer, amounts due to VAT traders where their claim was received after the end of the year and amounts in respect of Corporation Tax, Income Tax and other small taxes expected to be repayable by HMRC pending finalisation of taxpayer liabilities.
Contract liabilities are recognised where an entity has received consideration from a customer prior to the transfer of goods and services.
There were a number of entities which contributed to the note total through their DCT submissions in 2023-24, but which did not make DCT submissions to the WGA this year. These entities contributed a total of £5.4 billion to this note’s total last year. There were also a number of entities which made contributions to the note this year but did not make DCT submissions last year. These entities contributed a total of £15.7 billion to the note this year. This resulted in an overall 10.3 billion net increase.
21. Government Borrowings
| 2024-25 | 2023-24 | |
|---|---|---|
| £bn | £bn | |
| Non-current: | ||
| Gilts | 1,855.1 | 1,613.0 |
| Total non-current government borrowings | 1,855.1 | 1,613.0 |
| Current: | ||
| National Savings and Investment products (NS&I) | 240.1 | 230.5 |
| Treasury bills | 95.0 | 86.1 |
| Gilts | 108.2 | 90.4 |
| Total current government borrowings | 443.3 | 407.0 |
| Total government borrowings | 2,298.4 | 2,020.0 |
The government borrows to finance the shortfall between its income and expenditure (including capital expenditure). The National Accounts provide a comprehensive measure of government borrowing for deficit financing; further detail is set out in Annex 1.
Gilts are UK Government sterling-denominated marketable bonds, issued as either fixed-rate or index-linked securities, with index-linked gilts providing returns linked to movements in the Retail Prices Index (RPI). As the Government’s debt manager, the Debt Management Office (DMO) issues gilts to ensure sufficient funding is available to meet the Government’s financing requirements. Gilts held by public sector entities are eliminated on consolidation and therefore removed from the balance above, except where gilts are held as assets of funded public sector pension schemes. Under IAS 19 Employee Benefits, plan assets exclude non-transferable financial instruments issued by the reporting entity; accordingly, transferable instruments such as gilts may be recognised as plan assets. Further information on funded public sector pension schemes is provided in Note 25, Public Sector Pensions.
2024-25 was another challenging year for the DMO, with continued volatility in international financial markets. The Government’s gilt financing requirement increased during the year, resulting in total gilt sales of £297.7 billion. The initial gilt financing remit for 2024-25 was announced on 6 March 2024, with planned gilt sales of £265.3 billion (including planned green gilt sales of £10.0 billion). Following publication of the outturn for the 2023-24 financing requirement on 23 April 2024, planned gilt sales for 2024-25 were increased by £12.4 billion to £277.7 billion. At Autumn Budget 2024, alongside publication of the Office for Budget Responsibility’s Economic and Fiscal Outlook on 30 October 2024, planned gilt sales were increased by a further £19.2 billion to £296.9 billion. In addition, the net contribution of Treasury bills to debt financing increased to £3.0 billion from nil. Total gilt sales in 2024-25 were £32.4 billion higher than the initial remit announced in March and represented a 24.5% increase on the DMO’s £239.1 billion gilt remit in 2023-24. The outturn included green gilt sales of £10.0 billion. Further information is available in the DMO’s Debt Management Report 2024-25 and the 2024‑25 accounts of the National Loans Fund.
National Savings and Investments (NS&I) products are a range of secure savings and investment offered to the public that are backed by the Exchequer. During 2024-25, the NS&I liability increased to £240.1 billion (2023-24: £230.5 billion), reflecting changes in customer holdings, including increased investment in Premium Bonds administered by NS&I. The principal liability comprises the initial investment plus any capitalised interest added to the holding, where applicable. Accrued interest and prizes comprise interest and prizes earned but not yet paid out or capitalised. Products are generally repayable on demand; exceptions include Savings Certificates issued on or after 23 July 2023, Guaranteed Bonds issued from 1 May 2019 onwards and Green Savings Bonds, which are repayable at maturity. Further information is available on the NS&I website and in NS&I’s 2024-25 accounts.
Treasury bills are issued by the DMO and, together with other money market operations, are used to meet the Government’s daily cash requirements and manage short-term liquidity risk. During the year, the DMO issued Treasury bills by weekly tender with a nominal value of £284.0 billion (2023-24: £250.0 billion). Treasury bills in issue at 31 March 2025 had a carrying value of £95.0 billion (2023-24: £86.1 billion). The change in Treasury bills in issue was planned to support delivery of the DMO’s debt and cash management remit for 2024-25. Further information is available in the DMO’s Debt Management Report 2024-25.
Further information on the Government’s financial risk, including liquidity and funding risk, is included in Note 24.
There is no impact on the note total from entities that made data submissions in 2023‑24 but did not submit to the WGA in 2024-25, nor from entities that submitted in 2024-25 but did not submit in 2023-24.
22. Other Financial Liabilities
| 2024-25 | 2023-24 | |
|---|---|---|
| £bn | £bn | |
| Non-current: | ||
| Deposits by banks | – | 0.4 |
| Bank and other borrowings | 67.8 | 70.2 |
| Debt securities | 5.1 | 4.7 |
| Derivatives | 100.1 | 101.2 |
| Financial guarantees | 1.3 | 1.0 |
| IFRS 16 Liabilities | 20.1 | 21.9 |
| Other financial liabilities | 44.5 | 134.2 |
| Total non-current other financial liabilities | 238.9 | 333.6 |
| Current: | ||
| Deposits by banks | 644.2 | 681.8 |
| Banknotes in circulation | 90.6 | 87.0 |
| Bank and other borrowings | 9.5 | 7.0 |
| IMF Special drawing rights liability | 30.3 | 30.9 |
| Debt securities | 36.9 | 7.8 |
| Derivatives | 4.0 | 1.9 |
| Financial guarantees | 3.4 | 6.4 |
| IFRS 16 Liabilities | 3.9 | 3.4 |
| Other financial liabilities | 56.0 | 42.3 |
| Total current other financial liabilities | 878.8 | 868.5 |
| Total other financial liabilities | 1,117.7 | 1,202.1 |
Total other financial liabilities decreased to £1,117.7 billion (2023-24: £1,202.1 billion). Non-current other financial liabilities decreased to £238.9 billion (2023-24: £333.6 billion), while current other financial liabilities increased slightly to £878.8 billion (2023-24: £868.5 billion).
Banknotes in Circulation
Banknotes are issued by the Bank of England. The value of banknotes in circulation increased by £3.6 billion to £90.6 billion (2023-24: £87.0 billion). There has been an increase in notes in circulation throughout the year and in June 2024, banknotes featuring a portrait of King Charles III entered circulation. The increase has also been mainly driven by strong foreign demand from UK tourism with the £20 notes and higher use in ATMs with the £50 notes.
Deposits by Banks (Current and Non-Current)
Current deposits by banks (reserve accounts held at the Bank of England, repayable on demand and used for settlement) decreased to £644.2 billion (2023-24: £681.8 billion). Non-current deposits by banks were nil (2023-24: £0.4 billion).
Bank and Other Borrowings (Current and Non-Current)
Bank and other borrowings totalled £77.3 billion (2023-24: £77.2 billion), comprising £67.8 billion non-current (2023-24: £70.2 billion) and £9.5 billion current (2023-24: £7.0 billion). Bank and other borrowings include loans and overdrafts. The largest element is Network Rail outstanding debt of £29.3 billion (2023-24: £28.4 billion), as reported by the Department for Transport. Other material balances include £15.9 billion (2023‑24: £15.5 billion) of securities held by the National Loans Fund that are classified as noninterestbearing within the WGA.
IMF Special Drawing Rights (SDR) Liability
The IMF SDR liability was £30.3 billion (2023-24: £30.9 billion). A corresponding asset for the UK’s SDR holdings is included in Note 17.
Debt Securities (Current and Non-Current)
Debt securities increased to £42.0 billion (2023-24: £12.5 billion), comprising £5.1 billion non-current (2023-24: £4.7 billion) and £36.9 billion current (2023-24: £7.8 billion). Debt securities comprise securitised notes and covered bonds issued by the HM Treasury group and the Bank of England to securitise loans to customers and raise unsecured medium-term funding.
Derivatives (Current and Non-Current)
Derivatives totalled £104.1 billion (2023-24: £103.1 billion), comprising £100.1 billion non-current (2023-24: £101.2 billion) and £4.0 billion current (2023-24: £1.9 billion). The Department for Energy Security and Net Zero is the largest contributor to this balance, mainly reflecting Contracts for Difference and Low Carbon Hydrogen Agreements. Net Zero North Sea Storage Ltd also uses an interest rate swap with a commercial bank to manage the risk of changes in interest rates on its borrowing; the value of this swap is updated each year and recorded in the accounts.
Financial Guarantees (Current and Non-Current)
Financial guarantees totalled £4.7 billion (2023-24: £7.4 billion), comprising £1.3 billion non-current (2023-24: £1.0 billion) and £3.4 billion current (2023-24: £6.4 billion). Biggest movement was the Department for Business and Trade’s estimated liability for loan guarantees which fell markedly between 31 March 2024 and 31 March 2025. The year-on-year reduction was driven primarily by a decrease in the expected cost of guarantees under the Covid-19 business support schemes, particularly the Bounce Back Loan Scheme and the Coronavirus Business Interruption Loan Scheme, as these portfolios continue to run down following closure to new lending. Partly offsetting this, the estimated liability increased under the Growth Guarantee Scheme, reflecting its growing portfolio, while the Recovery Loan Scheme and other legacy schemes reduced further as they continued to wind down.
IFRS 16 Lease Liabilities (Current and Non-Current)
IFRS 16 liabilities decreased to £24.0 billion (2023-24: £25.3 billion), comprising £20.1 billion non-current (2023-24: £21.9 billion) and £3.9 billion current (2023-24: £3.4 billion). The Ministry of Defence (MoD) accounts for the largest year-on-year movement in IFRS 16 liabilities. This reflects the reclassification of certain assets to property, plant and equipment (PPE) following the purchase of previously leased accommodation for Service Personnel and their families. The termination of the leases was treated as the exercise of a purchase option under IFRS 16; on payment to extinguish the lease liability and obtain legal ownership, the properties were reclassified from right-of-use assets to PPE.
Other Financial Liabilities (Current and Non-Current)
Other financial liabilities decreased to £100.5 billion (2023-24: £176.5 billion), comprising £44.5 billion non-current (2023-24: £134.2 billion) and £56.0 billion current (2023-24: £42.3 billion). This includes liabilities arising from the Bank of England’s Term Funding Scheme with additional incentives for SMEs (TFSME). The balance of the TFSME decreased to £96.7bn from £151.3bn primarily driven by early part and full terminations from participants of the scheme.
Several entities submitted data in 2024-25 but did not submit in 2023-24, contributing £9.4 billion to the 2024-25 total. Conversely, some entities submitted data in 2023-24 but did not submit in 2024-25, contributing £2.4 billion to the 2023-24 total. Overall, there was a net increase of £7.0 billion attributable to changes in the set of reporting entities.
23. Provisions for Liabilities and Charges
| ND* | Clinical negligence | EU liabilities | PPF** | Other | 2024-25 | 2023-24 | |
|---|---|---|---|---|---|---|---|
| Total | Total | ||||||
| £bn | £bn | £bn | £bn | £bn | £bn | £bn | |
| At 1 April | 125.5 | 61.7 | 10.6 | 19.1 | 45.3 | 262.2 | 306.9 |
| Boundary adjustments | 0.0 | 0.0 | 0.0 | 0.0 | 1.2 | 1.2 | (0.3) |
| Restatements | 0.0 | 0.0 | 0.0 | 0.0 | 4.8 | 4.8 | 0.6 |
| Provisions utilised in year | (4.7) | (3.4) | (1.8) | (1.3) | (10.2) | (21.4) | (27.9) |
| New provisions or increase in expected future pay-outs | 0.8 | 8.9 | 0.3 | (0.6) | 22.9 | 32.3 | 27.2 |
| Change in discount rate | 1.4 | (1.1) | 0.0 | 0.0 | (0.1) | 0.2 | (47.5) |
| Discount rate unwind | 6.1 | 1.3 | 0.4 | 0.0 | 0.7 | 8.5 | 2.6 |
| Provisions not required written back | 5.6 | (3.8) | 0.0 | 0.0 | (6.3) | (4.5) | 2.7 |
| Transfers to/from payables and other movements | 0.0 | 0.0 | 0.0 | 0.0 | (0.6) | (0.6) | (2.1) |
| At 31 March | 134.7 | 63.6 | 9.5 | 17.2 | 57.7 | 282.7 | 262.2 |
*Nuclear Decommissioning ** Pension Protection Fund
Provisions Movement
| 2024-25 | 2023-24 | |
|---|---|---|
| £bn | £bn | |
| Provision movement | ||
| Amounts included in the Statement of Revenue and Expenditure: | ||
| Increase in provisions | 22.8 | 29.0 |
| Provision expense in cost to public services | 22.8 | 29.0 |
| Discount rate changes | 0.2 | (47.5) |
| Discount rate unwind | 8.5 | 2.6 |
| Provision financing costs | 8.7 | (44.9) |
| Total expenditure recognised in the Statement of Revenue and Expenditure | 31.5 | (15.9) |
| Amounts included in the Statement of Financial Position | 10.4 | (0.9) |
| Pay-outs made in year | (21.4) | (27.9) |
| Total provision movement | 20.5 | (44.7) |
Provision Profile
| ND* | Clinical negligence | EU liabilities | PPF** | Other | 2024-25 | 2023-24 | |
|---|---|---|---|---|---|---|---|
| Total | Total | ||||||
| £bn | £bn | £bn | £bn | £bn | £bn | £bn | |
| Within one year | 4.8 | 4.7 | 1.2 | 1.5 | 14.5 | 26.7 | 22.2 |
| Between one and five years | 21.3 | 13.4 | 2.6 | 4.7 | 26.3 | 68.3 | 66.0 |
| Thereafter | 108.6 | 45.5 | 5.7 | 11.0 | 16.9 | 187.7 | 174.0 |
| Total provision liability | 134.7 | 63.6 | 9.5 | 17.2 | 57.7 | 282.7 | 262.2 |
| Current provisions | 4.8 | 4.7 | 1.2 | 1.5 | 14.5 | 26.7 | 22.2 |
| Non-current provisions | 129.9 | 58.9 | 8.3 | 15.7 | 43.2 | 256.0 | 240.0 |
*Nuclear Decommissioning **Pension Protection Fund
Provisions are recognised when an entity has a present legal or constructive obligation because of a past event, it is probable that the entity will be required to settle the obligation, and a reliable estimate can be made of the amount of the obligation. The amount recognised as a provision is the best estimate of the expenditure required to settle the obligation at the end of the reporting period, considering the risks and uncertainties.
The total provision liability increased by £20.5 billion to £282.7 billion, as of 31 March 2025. £9.6 billion of this increase is due to provisions for infected blood compensation. Further details are provided below.
Use of Discount Rates
Discount rates are used in accounting and financial reporting to assess provisions by calculating the present value of future cash flows linked to a liability. Provisions are recognised when a business has a current obligation, the settlement of which is expected to lead to an outflow of resources embodying economic benefits. Discount rates are necessary to ensure that liabilities in the future are reflected at current values as at the balance sheet date. They are required by the relevant accounting standards where the effect of discounting is material.
Discount rate is applied to future cash flows to determine their present value, considering the time value of money. This is crucial because money available today is generally more valuable than the same amount in the future due to its potential earning capacity. The rate should mirror current market evaluations of the time value of money and the risks specific to the liability. Typically, a risk-free rate is adjusted to account for the risk associated with the liability. Discount rates are frequently applied to long-term provisions, such as environmental restoration, decommissioning costs, or other long-term liabilities.
The use of discount rates influences the reported amount of provisions on the balance sheet and the related expense on the income statement. A higher discount rate reduces the present value of the provision, whereas a lower rate increases it.
Impact of Changes in Discount Rate
Some government priorities entail long-term obligations that will require expenditure over decades. The ultimate costs of these long-term projects are uncertain, yet entities are required to present a single figure in the annual accounts. This figure is based on the best estimate of costs, technology, and other relevant factors, adjusted to reflect the changing value of money over time. The value of future cash flows is calculated at present value in line with accounting standards. Provision discount rates set by HM Treasury are updated annually and significantly impact liabilities.
Previously, HM Treasury issued real rates based on the real yield of UK index-linked gilts. From 2018-19 onwards, HM Treasury has issued nominal rates that do not account for inflation, unlike real rates. Using these nominal rates, the cash flows are inflated using inflation rates provided by HM Treasury, unless a more appropriate forecast has been identified for specific provisions.
The most significant changes in provisions are driven by alterations in the interest rates used to discount future cash flows. Higher interest rates in 2023-24 led to an overall reduction in provisions in that year. In 2024-25 and beyond, decreases in interest rates will result in a likely increase in provisions.
Inflation Assumptions
When using nominal discount rates, it is necessary to inflate cash flows because nominal rates do not account for inflation, unlike real discount rates, which do.
Nominal rates exclude inflation, so cash flows must be adjusted for inflation to reflect their true value over time. Real rates, on the other hand, inherently account for inflation. HM Treasury provides the Consumer Price Index (CPI) forecasted inflation rates from the Office for Budget Responsibility (OBR) to be applied to expected cash flows. These forecasts are considered a reliable measure of inflation. While the OBR’s CPI forecast is the standard, entities may use alternative inflation rates if there is a justified and reasoned basis for doing so. This allows for flexibility if specific circumstances warrant a different approach.
Overall, the process ensures that cash flows are accurately inflated to reflect expected economic conditions, thereby maintaining the integrity of financial reporting.
Nuclear Decommissioning Provisions
The Department for Energy Security and Net Zero (DESNZ) £112.0 billion (2023-24: £106.9 billion)
The Department for Energy Security and Net Zero (DESNZ) is a UK government department focused on energy security, reducing emissions, and achieving net zero.
The nuclear provision represents the best estimate of the costs associated with the Nuclear Decommissioning Authority’s (NDA) objective of decommissioning plant and equipment at each designated nuclear licensed site, returning them to pre-agreed end states in line with the published strategy.
In developing the cost estimates for decommissioning the designated sites, the Nuclear Decommissioning Authority (NDA) has focused particularly on the first 20 years.
The estimates are based on assumptions about the processes and methods likely to be used to discharge the obligations and reflect the latest technical knowledge, existing regulatory requirements, U K government policy and commercial agreements. This extensive programme is expected to continue until 2137. Given the very long timescale and the complexity of the plants and material being handled, considerable uncertainty remains in the cost estimate, particularly in the later years. Discounting of the forward cash flow estimates to present value also has a significant impact on the liability reported in the Statement of Financial Position of £110.0 billion at 31 March 2025 (31 March 2024: £105.0 billion). The undiscounted equivalent of this reported liability is £216.0 billion at 31 March 2025 (31 March 2024: £199.0 billion).
The nuclear provision estimate for each reporting segment is initially based on the lifetime plan for each site or programme of work managed within the segment, with specific adjustments made as required by the nature of each site or programme to ensure the estimate remains current and compliant with accounting requirements. The site lifetime plans, and equivalent figures are based on P50 estimates, indicating a 50% probability of the outcome being either under or over the estimate. While alternative bases of estimate could be used, management believes the P50 basis provides a representative single-point estimate for disclosure in the financial statements. Alternative calculation techniques may yield materially different results. The Authority completes a sensitivity analysis which found that they estimate could vary by the following amounts as a result of variations in cost assumptions.
| £ billion | Sellafield | Nuclear Restoration Services | Nuclear Waste Services | Nuclear Transport Solutions |
|---|---|---|---|---|
| Increase | 43.0 | 2.4 | 8.6 | – |
| Reduction | (7.2) | (2.4) | (1.4) | – |
The nuclear provision estimate is stated in monetary values as of the reporting date. The site lifetime plans are stated in mid-year monetary values (specifically, the September preceding the reporting date). The Authority applies an inflationary adjustment to produce the estimate as of the reporting date, based on changes in price levels specific to each component of the estimate where known or reasonably estimated. The nuclear provision estimate is discounted using discount rates published annually by HM Treasury. The Authority applies discounting on a mid-year basis to reflect the nature of its expenditure, which occurs throughout each reporting period rather than at the end.
Summary table of general provisions discount rates applied for the last five years 2024-25
| Summary table of general provisions discount rates applied for the last five years | 2024-25 Nominal rate | 2023-24 Nominal rate | 2022-23 Nominal rate | 2021-22 Nominal rate |
|---|---|---|---|---|
| Short-term | 4.03% | 4.26% | 3.27% | 0.47% |
| Medium-term | 4.07% | 4.03% | 3.27% | 0.47% |
| Long-term | 4.81% | 4.72% | 3.20% | 0.70% |
| Very long-term | 4.55% | 4.40% | 3.08% | 0.71% |
Sellafield is the largest area of expenditure for the NDA due to its complexity, historical significance, high-risk facilities, and stringent regulatory requirements. As one of the UK’s most challenging nuclear sites, it contains diverse facilities and legacy waste from operations dating back to the 1940s, including the nation’s first nuclear reactors. Decommissioning high-risk structures like the Magnox Swarf Storage Silo is critical for reducing risks. Strict regulations demand significant investment to ensure safety and environmental compliance. Sellafield’s decommissioning is vital for achieving the NDA’s mission to manage nuclear liabilities, making it a central focus of their resources and budget.
During 2024-25, general provisions were evaluated based on four different discount rates outlined by HM Treasury. These rates are specified by HM Treasury and are intended to reflect the time value of money and the risk associated with future cash flows over different time horizons. They help ensure that provisions are accurately assessed and reported in financial statements.
Real Discount Rates 2024-25 2023-24 2022-23 Period from consolidated position
| Real Discount Rates | 2024-25 | 2023-24 | 2022-23 | Period from consolidated position |
|---|---|---|---|---|
| Short-term | 1.39% | 0.64% | -3.85% | 0 to 5 years |
| Medium-term | 1.73% | 2.19% | 1.59% | 5 to 10 years |
| Long-term | 2.45% | 2.87% | 1.18% | 10 to 40 years |
| Very long-term | 2.50% | 2.35% | 1.06% | Over 40 years |
The effect of the revised discounting approach is reflected under the “Change in discount rate” movement within provisions. When expenditure to settle a provision is anticipated to be reimbursed by a third party, the recoverable amount is recorded as a separate asset. Provision charges in the Statement of Comprehensive Net Expenditure are shown net of changes in these recoverable amounts.
Ministry of Defence (MOD) £12.8 billion (2023-24: £9.1 billion)
Provisions have been recognised to cover the costs associated with treating, storing, and disposing of nuclear materials, irradiated fuel, and radioactive waste from the Defence Nuclear Programme. This also includes decommissioning sites, facilities, and submarines, both operational and out of service, for which the MOD holds responsibility. The comprehensive decommissioning programme is anticipated to span 114 years, addressing the MOD’s current commitments.
However, estimating the value of these provisions comes with substantial uncertainty due to future cost predictions and assumptions. Key factors influencing this uncertainty include the timing and infrastructure required for decommissioning activities, interdependencies with other programmes like the Geological Disposal Facility (GDF) managed by the NDA, potential shifts in government policies and regulatory frameworks, and advancements in technology that could alter approaches to decommissioning and site cleanup. Changes in these areas could lead to significant adjustments in the value of nuclear decommissioning provisions and related assets.
At the end of 2023-24, the discounted nuclear provision was £9.1 billion. Adjustments since then include accounting changes (£3.7 billion), effects of discount rate changes (£0.2 billion), and utilisation costs (£0.2 billion). These movements resulted in a revised provision estimate of £12.8 billion for 2024-25. Prior to discounting, the provision balance stood at £22.6 billion as of 31 March 2025, but discounting reduced it to £12.8 billion.
Nuclear Liabilities Fund (NLF) £9.9 billion (2023-24: £9.6 billion)
The primary role of Nuclear Liabilities Fund Limited is to manage funding for the decommissioning of nuclear power stations and address costs and liabilities related to the handling, storage, retrieval, and disposal of unirradiated, operational, or spent nuclear fuel and associated waste. Its principal purpose is to secure and hold funds, investments, and assets to ensure the financial resources needed to discharge liabilities tied to the decommissioning of eight nuclear power stations currently operated by EDF Energy. Payments to EDF Energy are made in line with the provisions outlined in the Nuclear Liabilities Fund Agreement (NLFA).
Based on liability cashflows from the Annual Funding Review, projected expenditure for decommissioning liabilities over the next three years is approximately £2.8 billion. Nuclear Liabilities Fund Limited is well-equipped to meet these obligations due to its substantial cash resources. In the event that the Fund’s assets are insufficient, the UK Government has committed to cover any remaining costs and liabilities as stipulated in the NLFA. Directors have determined it is appropriate to prepare the annual report and accounts under a going concern basis.
Under the Contribution Agreement, EDF Energy provides fixed quarterly contributions of £2 million (adjusted to March 2003 monetary values and indexed to the Retail Price Index, RPI) along with an additional £150,000 per tonne of fuel loaded into the Sizewell B reactor power station, also indexed to RPI. The Fund also receives an annual contribution for administration costs from EDF Energy, amounting to £1 million (adjusted for RPI), following deductions for the attributable administration costs of DESNZ and NLA.
In accordance with the NLFA, Nuclear Liabilities Fund Limited assumes responsibility for funding EDF Energy’s relevant liabilities, except in specific circumstances. The relevant liabilities provision reflects the Fund’s future potential obligations to EDF Energy as of the date of the statement of financial position. This liability remains limited to the assets available within the Fund. The Secretary of State for the Department for Energy Security and Net Zero has ensured that HM Government will be responsible for covering these liabilities in case the Fund’s assets are insufficient. The provision for relevant liabilities is calculated to match the total provisions with the Fund’s net assets, excluding current liabilities and share capital.
Clinical Negligence Provisions
Department of Health and Social Care (DHSC) £60.0 billion (2023-24: £58.2 billion)
As of 31 March 2025, the Department of Health and Social Care (DHSC) reported clinical negligence provisions totalling £60.0 billion, an increase from £58.2 billion at 31 March 2024.
Clinical negligence is DHSC’s largest provision, requiring significant estimation due to complexities in claim resolution. Factors such as settlement delays and new evidence can impact valuation. NHS Resolution, supported by the Government Actuary’s Department (GAD), regularly reviews estimates, with revisions recognised either in the current period or spanning future periods, depending on their scope. The provision covers liabilities arising from incidents that occurred before 31 March 2025, including both received claims and those estimated to be incurred but not reported (IBNR).
In 2024-25, the total estimated cost of clinical negligence claims under the Clinical Negligence Scheme for Trusts (CNST) was £3.1 billion, down from £4.8 billion the previous year.
Through NHS Resolution, DHSC administers several schemes, most notably CNST, accounting for £55.2 billion of the total provision in 2024-25 (£54.0 billion in 2023-24). These provisions represent DHSC’s best estimate of obligations resulting from incidents up to 31 March 2025, categorised into known claims, settled claims with ongoing payments, and incurred but not reported (IBNR) claims based on actuarial predictions.
Effect of Change in Discount Rate
One of the key assumptions used in calculating the provisions is the discount rate used to place a present value on projected future cashflows. The clinical negligence provision is particularly sensitive to the long-term and very long-term discount rates. This reflects the long-term nature of the liabilities, driven by reporting and settlement delays, as well as the fact that many high-value claims are settled as periodical payment orders (PPOs) with payments provided over the remaining lifetime of the claimant. This update decreased the clinical negligence provision by £75 billion. In 2023-24, there was an increase in the discount rates prescribed by HM Treasury which led to a decrease of £15 billion. In 2024-25, the discount rates remained fairly static, resulting in minimal impact.
Although the change in discount rates prescribed by HM Treasury has a material effect on the value of the provisions, it does not alter the cost of settling claims, which is driven by the frequency and severity of claims and the legal environment in which the claims are settled (for example, the personal injury discount rate).
Clinical negligence costs are managed through schemes run by NHS Resolution. NHS Resolution contracts actuarial advisers, the Government Actuary’s Department (GAD), to assist with the preparation of financial statements through analysis and modelling of claims data. This is combined with information provided by management on the current economic and claims environment to provide estimates in relation to determining the valuation of the liabilities for the accounts. NHS Resolution’s Reserving and Pricing Committee is responsible for making decisions on the key judgements and estimates, drawing on advice from the Government Actuary’s Department. The Reserving and Pricing Committee keeps all factors affecting the calculation of provisions under review to ensure that the final provisions reflect the experience of the organisation and are adjusted in a timely manner.
A significant proportion of the provision relates to claims expected to be settled over the longer term. Consequently, increases in the long-term and very long-term discount rates have had a considerable impact on the value of the provision. However, this is an accounting estimate that does not change the underlying future payments that will be incurred in meeting the obligations arising from claims when they fall due in the short term. In other words, the change in the discount rates does not reflect changes in the fundamental drivers of clinical negligence, such as the number of claims that result in damages being paid, the cost of paying these claims, the legal costs involved in handling them, and the rate at which any payments might increase in the future.
Existing Liabilities Scheme for General Practice (ELSGP) : The ELSGP is a state indemnity scheme covering historical liabilities of general practice staff in England. It complements the Clinical Negligence Scheme for General Practice (CNSGP), which covers liabilities from 1 April 2019 onward. ELSGP provides indemnity for NHS clinical negligence claims against GP members of medical defence organisations (MDOs) for liabilities incurred before 1 April 2019.Administered by NHS Resolution, it applies to members of MDDUS and MPS, covering incidents during their membership while providing NHS services in England. The scheme covered MDDUS members from 6 April 2020 and was extended to MPS members from 1 April 2021.
The English element of the clinical negligence provision represents the present value, in today’s prices, of the expenses related to claims stemming from harm that occurred up to 31 March 2025.
Scottish Government Clinical Negligence £1.1 billion (2023-24: £1.1 billion)
Within the provisions, an amount of £1.1 billion (2023-24: £1.1 billion) is allocated to the Clinical Negligence and Other Risk Indemnity Scheme (CNORIS). The Scottish Government’s CNORIS provision reflects the national liability, with individual claims accounting by Boards being excluded. In 2024-25, £0.1 billion (2023-24: £0.1 billion) of the estimated settlement value for medical and clinical negligence claims was added to the provision. Additionally, £0.1 billion (2023-24: £0.1 billion) in claims were settled in 2024-25.
Welsh Government Clinical Negligence £1.9 billion (2023-24: £1.8 billion)
The Welsh Government has health related provisions, for the Wales Infected Blood Support Scheme (WIBSS) and expected future re-imbursements of the Welsh Risk Pool (WRP).
WIBSS provides a single, streamlined scheme of ex gratia support payments for individuals and their families affected by hepatitis C and HIV through treatment with contaminated blood in Wales. On 25 March 2021 additional financial support arrangements backdated to April 2019 (to achieve parity across the four UK schemes) were announced for existing beneficiaries. The balance on the WIBSS provision, as of 31 March 2025, is £0.2 billion (2023-24: £0.1 billion).
WRP assists Welsh NHS bodies with risk management and settlement of disputed claims for alleged medical or employer negligence. WRP balance as of 31 March 2025 is £1.7 billion (2023-24: £1.7 billion). NHS Wales bodies provide for legal or constructive obligations for clinical negligence, personal injury and defence costs that are of uncertain timing or amount at the balance sheet date on the basis of the best estimate of the expenditure required to settle the obligation. Claims are funded via the Welsh Risk Pool Services (WRPS) which receives an annual top-slice allocation from Welsh Government to cover the cost of reimbursement requests submitted to the bi-monthly WRPS Committee. Any shortfall is met directly from members on an agreed risk sharing basis.
Provision for EU Liabilities Funding
HM Treasury (HMT) £9.5 billion (2023-24: £10.6 billion)
EU Financial Settlement: Article 140 – Reste a Liquider (RAL)
Under Article 140 of the Withdrawal Agreement, the UK is responsible for its share of the European Union (EU) Budget commitments made during the 2014-2020 Multiannual Financial Framework (MFF), which concluded in December 2020. The “Outstanding Commitments” or Reste à Liquider (RAL) represents EU budgetary commitments expected to result in future payments. If any budgetary commitments are decommitted, such as when a programme does not proceed, they are removed from the RAL. The UK is liable for a share of the RAL as of the end of 2020, but only to the extent that these commitments crystallise as payments by the EU. The UK’s liability will be reduced by factors such as net financial corrections, proceeds from Member State Making Available Resources infringements, and adjustments to Traditional Own Resources.
EU Financial Settlement: Article 142 – Union Liabilities at End 2020
Under Article 142 of the Withdrawal Agreement, the UK is obligated to pay a share of the European Union’s (EU) payments for employment and related benefits accrued by EU employees up to the end of 2020. These benefits primarily consist of pension schemes and the Joint Sickness Insurance Scheme (JSIS). The expenditure to settle in-year benefits is incurred by the EU and shared among all Member States through budget contributions. However, following the UK’s departure from the EU, the Withdrawal Agreement established a specific liability for the UK. Consequently, HM Treasury must make provisions for the future cash outflows associated with these commitments, which last to 2064.
Pension Protection Fund (PPF) £17.2 billion (2023-24: £19.1 billion)
The Pension Protection Fund (PPF) holds funds to ensure it can fulfil its obligations to pay compensation to members of defined benefit pension schemes that have been transferred to the PPF. The PPF protects members of these schemes if their employers become insolvent and the schemes are unable to meet promised pension benefits.
The funds managed by the PPF are used for the following purposes:
- Compensation Payments: Ensuring members receive compensation closely aligned with the benefits promised by their original schemes.
- Investment Purposes: Investing the funds to generate returns that will support long-term liabilities, utilising a diversified portfolio to balance risk and return.
- Operational Costs: Covering the costs of administering the PPF and managing compensation payments.
As of 31 March 2025, PPF’s provisions consist of the following: liabilities to pay compensation to members amounting to £17.0 billion, and provisions and contingent liabilities of £0.2 billion for potential claims related to schemes entering the PPF and for schemes to be compensated by the Fraud Compensation Fund (FCF) for losses caused by dishonesty.
During the 2024-25 financial year, the PPF paid out £1.2 billion in compensation to members. Following the actuarial valuation as of 31 March 2025, a net gain of £0.8 billion was recognised in the Consolidated Statement of Comprehensive Net Income, reducing the estimated liabilities. The actuarial liabilities, calculated by the Appointed Actuary, are influenced by factors such as changes in assumptions, discount rates, operating expenses, and benefits paid during the period.
The provisions also include “Schemes in Assessment” (SIA), calculated as the present value of estimated future compensation payments less the value of existing scheme assets. The claims activities disclosed in the Consolidated Statement of Comprehensive Net Income are impacted by new claims received and reassessments of previously reported claims. For claims involving fraud, the FCF maintains provisions where fraud is deemed probable, and the loss amount is reliably estimable.
The decrease in PPF provisions from 2023-24 to 2024-25 is attributed to various factors, including:
- Changes in Assumptions: Updates to key actuarial assumptions, such as discount rates, mortality rates, and inflation expectations, significantly impacting liability valuations.
- Reduction in Claims: A decrease in the number or size of claims, potentially due to fewer schemes entering the PPF or successful restructuring efforts.
Actuarial assumptions, such as the discount rate, inflation, and life expectancy of members, are critical in valuing liabilities. Applying a discount rate expresses future payments and expenses in present value terms without altering their actual cost. Without discounting, the actuarial liabilities would be approximately 88% higher than the reported figures. These provisions underscore the complexities involved in managing long-term liabilities within the PPF framework.
Other Provisions
The public sector’s provisions cover a wide array of allocations, including those for infected blood compensation (see below), injury benefits, medical expenses, compensation for criminal injuries, legal costs, compulsory acquisitions, concessionary fuel allowances for former miners, mine water treatment, public safety and subsidence, subsidence pumping stations, and tip management. Additionally, they address claims concerning structural damage and the depreciation of property values due to transportation projects, as well as compensation for job terminations.
Other provisions have increased this year by £12.4 billion from £45.3 billion to £57.7 billion. Infected blood compensation accounts for £9.6 billion of the increase (see below).
Infected Blood Compensation £9.6 billion (2023-24: £nil billion)
The Infected Blood Compensation Authority (IBCA) was established to deliver compensation to those eligible to claim, as established by the Victims and Prisoners Act 2024. The legislation establishes entitlement to compensation for individuals who have suffered as a result of infected blood and infected blood products. While there is a high degree of uncertainty relating to the number of people eligible to make a claim, IBCA holds an estimate based on reasonable assumptions available and, as a result, IBCA can make an estimate as to the value of compensation payable to those eligible to make a claim.
In accordance with ministerial statements and the legislation, IBCA has a present obligation under ‘IAS 37: Provisions, Contingent Liabilities and Contingent Assets’. IBCA therefore has made a provision for the best estimate at 31 March 2025 of the total compensation payable by IBCA under the Infected Blood Compensation Scheme.
HMRC Oil and Gas Field Decommissioning Costs £5.8 billion (2023-24: £5.7 billion)
The Exchequer’s liabilities related to oil and gas infrastructure involve two main taxes on companies operating in the UK Continental Shelf (UKCS): Petroleum Revenue Tax (PRT) and offshore Corporation Tax (CT). Offshore CT includes Ring-fenced Corporation Tax, Supplementary Charge, and the Energy Profits Levy. The Oil Taxation Act 1975 allows companies liable for PRT to carry back decommissioning losses against past profits, potentially resulting in PRT repayments. Similarly, the Corporation Tax Act 2010 permits companies to carry back decommissioning losses against historical profits since April 2002, which may lead to offshore CT repayments.
For the fiscal year 2024-25, HMRC has reported a provision of £5.8 billion for tax repayments due to decommissioning losses, with £1.9 billion for PRT and £3.9 billion for offshore CT. This represents a £0.1 billion increase from the previous year. The provision is based on forecasts of decommissioning repayments over the expected lifetime of North Sea oil and gas fields, derived from HMRC’s North Sea Forecasting Model. Key determinants include future decommissioning costs, oil and gas prices, discount rates, and the US Dollar/Sterling exchange rate.
There is significant uncertainty in estimating the provision, particularly regarding future decommissioning costs and oil and gas prices. A 10% increase in decommissioning costs would raise the provision to £6.1 billion, while a 10% decrease would lower it to £5.4 billion. Changes in oil and gas prices also impact the provision, with a 10% increase (decrease) reducing (increasing) it by approximately £0.4 billion (£0.5 billion). Additionally, shifts in discount rates and exchange rates affect the provision’s present value, with a 50 basis point change in discount rates altering it by £0.2 billion to £0.3 billion, and a 10‑cent change in the US Dollar affecting it by £0.2 billion to £0.3 billion.
Boundary Adjustment
Several entities that submitted data in 2023-24 and contributed £0.2 billion to the total did not make a submission to the WGA this year. Conversely, a number of entities that did not contribute in 2023-24 made submissions this year, adding £1.4 billion to the total. This resulted in a net increase of £1.2 billion due to missing data.
24. Financial Instruments
This note provides information on the classification and measurement of financial instruments and the nature and extent of risks arising from them, along with the government’s strategies for managing and mitigating those risks, in accordance with IFRS 7 Financial Instruments: Disclosures and IFRS 9 Financial Instruments.
Financial assets and liabilities are classified and measured at amortised cost, fair value through profit or loss (FVTPL), or fair value through other comprehensive income (FVTOCI), depending on their contractual characteristics and the business model in which they are held.
Financial Assets by Category 2024-25
| Note | Cash and cash equivalents | Amortised Cost | FVTPL* | FVTOCI* | 2024-25 Total | 2023-24 Total | |
|---|---|---|---|---|---|---|---|
| £bn | £bn | £bn | £bn | £bn | £bn | ||
| Cash and cash equivalents | 19 | 40.7 | – | – | – | 40.7 | 39.5 |
| Trade and other receivables | 16 | – | 250.2 | – | – | 250.2 | 239.1 |
| Debt securities | 17 | – | – | 108.9 | – | 108.9 | 96.5 |
| Loans and deposits (including REPOS) | 17 | – | 238.2 | 12.3 | 1.7 | 252.2 | 274.1 |
| Student loans | 17 | – | – | 178.1 | – | 178.1 | 169.1 |
| Equity investments | 17 | – | 0.8 | 27.7 | 24.4 | 52.9 | 53.3 |
| IMF quota subscription | 17 | – | – | 20.7 | – | 20.7 | 21.1 |
| IMF Special Drawing Rights | 17 | – | – | 34.5 | – | 34.5 | 35.8 |
| Other | 17 | – | 1.4 | 46.6 | 0.8 | 48.8 | 57.7 |
| Total financial assets | 40.7 | 490.6 | 428.8 | 26.9 | 987.0 | 986.2 |
*FVTPL: Fair Value Through Profit or Loss *FVTOCI: Fair Value Through Other Comprehensive Income
Cash and cash equivalents are measured at amortised cost
Most debt securities (£77.2 billion, 2023-24: £73.1 billion) are held in the Exchange Equalisation Account (EEA), and comprise the UK’s official holding of international reserves. The government holds foreign currency reserves on a precautionary basis to meet current policy objectives to regulate the exchange value of sterling and any potential future changes in policy.
Balances with the IMF are made up of the IMF quota subscription (£20.7 billion, 2023‑24: £21.1 billion) and IMF Special Drawing Rights (SDRs) (£34.5 billion, 2023-24: £35.8 billion). SDRs are an international reserve asset created by the IMF. SDRs represent a claim to currency held by IMF member countries for which they may be exchanged. The government’s holdings result from SDR allocations made by the IMF, any subsequent purchases and sales of SDRs from or to other IMF members and fair value changes.
A significant balance within other financial instruments are derivatives (£14.1 billion, 2023-24: £14.3 billion). Of the derivatives balance the largest individual material balances are with the Pension Protection Fund (PPF) (£6.3 billion, 2023-24: £7.1 billion), and EEA (£3.5 billion, 2023-24: £4.5 billion). The PPF manage the risks associated with this by using counterparties rated at least A- (or subject to increased collateral) and are subject to overall exposure limits. The EEA manage the risks associated with this by counterparty and issuer limits and collateralisation. Further details can be found in the PPF and EEA accounts.
Other significant balances (£16.0 billion, 2023-24: £17.4 billion) include investments in Help to Buy; this represents an entitlement to future income from the assistance provided to homebuyers by Department for Levelling Up, Housing and Communities.
Financial Liabilities by Category 2024-25
| Note | Carried at amortised cost | FVTPL* | 2024-25 Total | 2023-24 Total | |
|---|---|---|---|---|---|
| £bn | £bn | £bn | £bn | ||
| Trade and other payables | 20 | 237.3 | – | 237.3 | 228.3 |
| Government borrowings | 21 | 2,298.4 | – | 2,298.4 | 2,020.0 |
| Deposits by banks | 22 | 644.2 | – | 644.2 | 682.2 |
| Banknotes in circulation | 22 | 90.6 | – | 90.6 | 87.0 |
| Bank and other borrowings | 22 | 77.3 | – | 77.3 | 77.2 |
| Derivatives | 22 | – | 104.1 | 104.1 | 103.1 |
| Debt securities | 22 | 42.0 | – | 42.0 | 12.5 |
| IMF Special Drawing Rights liability | 22 | – | 30.3 | 30.3 | 30.9 |
| IFRS 16 Liabilities | 22 | 24.0 | – | 24.0 | 25.3 |
| Financial guarantees | 22 | 0.2 | 4.5 | 4.7 | 7.4 |
| Other | 22 | 89.4 | 11.1 | 100.5 | 176.5 |
| Total financial liabilities | 3,503.4 | 150.0 | 3,653.4 | 3,450.4 |
*FVTPL: Fair Value Through Profit or Loss
In most cases, the carrying value of financial assets and financial liabilities presented in the Statement of Financial Position is a reasonable approximation of fair value. This reflects the short-term nature of certain instruments or the application of market-based measurement techniques.
A key exception is government borrowing, where instruments such as gilt-edged securities are measured at amortised cost rather than fair value and can therefore differ materially from fair value due to movements in market interest rates.
Following the prior year FReM adaptation, Contracts for Difference (CfDs) are recognised at fair value from initial recognition, with movements reflected in the Statement of Revenue and Expenditure.
Gilt-edged securities have a carrying amount of £1,973.0 billion (2023-24: £1,703.4 billion) and a fair value of £1,314.4 billion (2023-24: £1,463.1 billion), with the difference primarily reflecting changes in market interest rates since issuance.
Other financial liabilities include £96.7 billion (2023-24: £151.3 billion) of TFSME funding.
Fair Value Hierarchy
Financial instruments measured at fair value are classified within a fair value hierarchy in accordance with IFRS 13 Fair Value Measurement.
The valuations of financial instruments have been classified into three levels according to the quality and reliability of information used to determine the fair values:
Level 1 – using unadjusted quoted prices in active markets for identical financial instruments.
Level 2 – using techniques that rely upon relevant observable market data curves. This category of instruments comprised derivatives, repo transactions, commercial paper and deposits.
Level 3 – using techniques where at least one input that could have a significant impact on the valuation is not based on observable market data
Level 3 valuations typically include discounted cash flow models and, where relevant, the use of net asset values for unquoted equity investments.
The table below summarises asset and liability fair values based on the valuation technique used.
Fair Value Hierarchy 2024-25
| Level 1 | Level 2 | Level 3 | 2024-25 Total | 2023-24 Total | |
|---|---|---|---|---|---|
| £bn | £bn | £bn | £bn | £bn | |
| Financial assets at fair value: | |||||
| Debt securities | 87.8 | 16.4 | 4.7 | 108.9 | 96.5 |
| Equity investments | 25.4 | 13.4 | 13.3 | 52.1 | 52.6 |
| IMF quota | – | 20.7 | – | 20.7 | 21.1 |
| IMF Special Drawing Rights | – | 34.5 | – | 34.5 | 35.8 |
| Loans and deposits (including REPO) | 2.1 | 11.6 | 0.3 | 14.0 | 23.5 |
| Student loans | – | – | 178.1 | 178.1 | 169.1 |
| Other | 3.1 | 18.9 | 25.4 | 47.4 | 51.1 |
| Financial liabilities at fair value: | |||||
| Deposits by banks | – | – | – | – | (0.4) |
| IMF SDR Allocation | – | (30.3) | – | (30.3) | (30.9) |
| Financial Guarantees | (3.4) | – | (1.1) | (4.5) | (7.1) |
| Derivatives and Other | (0.9) | (18.0) | (96.3) | (115.2) | (123.1) |
The most significant Level 3 financial asset is student loans (£178.1 billion), which are valued using discounted cash flow models and are not based on observable market data.
Other Level 3 balances include Contracts for Difference, which are also valued using discounted cash flow techniques
The most significant individual level 3 assets balance is student loans which has no observable market data. Further details can be found in the annual report and accounts of the Department for Education. Second is the CfD contracts which use a discounted cash flow methodology, further details can be found in the annual report and accounts of DENZ.
Liquidity Risk
The government’s objective when funding its activities is to minimise, over the long term, the costs of meeting the government’s financing needs considering risk, while ensuring that debt management policy is consistent with the aims of monetary policy.
Each year, the government assesses the costs and risks associated with different possible patterns of debt issuance, considering the most up-to-date evidence and information about market conditions and demand for debt instruments. This information is used to set the Debt Management Office’s (DMO’s) financing remit which is published alongside the Budget and updated during the year to reflect changes to the government’s cash requirements.
There is a risk that the government will need to roll over high levels of debt continuously, or redemptions will be concentrated in particular years; this risk is mitigated by taking decisions which spread gilt issuance along a maturity spectrum.
DMO’s issuance profile used in 2024-25 is summarised below:
| Short conventional (0-7 years) | Medium conventional (7-15 years) | Long conventional (over 15 years) | Index linked | Unallocated | |
|---|---|---|---|---|---|
| 2024-25 debt issuance % | 36% | 32% | 21% | 12% | 0% |
Local authorities adopt independent liquidity risk management, and this is done within a statutory framework. Local authorities are required by the Local Government Finance Act 1992 to provide a balanced budget, which ensures enough funds are raised to cover annual expenditure. Medium term plans generally set targets for liquidity ratios, which are approved as part of the annual budget setting process. To manage liquidity risk, local authorities can access borrowings from the money markets to cover any day-to-day cash flow need and can access longer term funds from financial institutions or from the government’s Public Works Loan Board (PWLB). Balances between the Public Works Loan Board and local authorities are eliminated on consolidation within WGA . If the local authority does not make a submission to the WGA, the loan is not eliminated.
In 2024-25 PWLB identified £99.5 billion of assets relating to other public sector entities. Of this total, £26.9 billion related to Local Government entities which did not make a submission to the WGA in 2024-25. As non-submitting entities are deemed to be external to the WGA boundary, this £26.9 billion is included in the asset totals reported in the 2024-25 WGA.
Interest Rate Risk
The government manages refinancing and interest rate risk through its debt issuance strategy, which aims to minimise long-term financing costs while maintaining an acceptable level of risk. This includes spreading gilt issuance across a range of maturities, maintaining a relatively long average maturity profile, and issuing a mix of conventional and index-linked gilts to balance exposure to interest rate and inflation risk.
The government is exposed to cash flow interest rate risk on its remaining floating-rate investments and borrowings.
The most significant floating rate investments and borrowings are index-linked gilts and National Savings & Investments (NS&I) products, debt issued by Network Rail and student loans. Other central government departments do not invest or access funds from commercial sources, so have negligible exposure to interest rate risk. Deposits from banks and other financial institutions held by the Bank of England was £717.2 billion (2023-24: £788.4 billion).
Index-linked gilts expose the government to both interest rate risk and inflation risk whereby interest and redemption amounts paid on index-linked gilts vary monthly in line with changes in RPI. If interest rates were to increase by 100 basis points, then this would increase the government’s borrowing costs by £3.8 billion (2023-24: £2.8 billion) and if RPI were to increase by 100 basis points then the government’s borrowing costs would rise by £6.9 billion (2023-24: £6.6 billion). Some of this would be eliminated within the government boundary.
Network Rail has a combination of fixed, floating and index-linked debt issuances. As with the government’s gilt portfolio, this gives rise to interest rate risk and inflation risk. Considering the impact on fair-valued debt issuances and the derivatives Network Rail uses to manage interest rate risk, if interest rates were to increase by 100 basis points, then this would decrease Network Rail’s net expenditure by £0.1 billion (2023-24: £0.1 billion decrease) and if the RPI were to increase by 100 basis points then Network Rail’s net expenditure would increase by £0.2 billion (2023-24: £0.2 billion increase).
Student Loans – RPI and Bank of England Base Rate
Sensitivity analysis of RPI:
| 2024-25 | |
|---|---|
| £bn | |
| Carrying value | 157.9 |
| Increase RPI by 1% | (22.6) |
| Decrease RPI by 1% | 27.8 |
| Increase RPI by 2% | (45.1) |
| Decrease RPI by 2% | 52.6 |
*Department for Education – Students Loan only
RPI inflation has been elevated and more volatile in recent years, following a period of relative stability (around 2-4%) prior to 2020. After falling to 0.5% in August 2020, RPI rose sharply from late 2021, remaining above 5% through much of 2022 and 2023 and reaching approximately 7.5% at March 2024.
RPI has since eased during 2024-25, with the annual rate at approximately 4.3% at March 2025, but remains above its longer-term historical range. Inflation is expected to continue to moderate over 2025-26 and beyond, moving closer towards historical levels as earlier inflationary pressures unwind.
An increase in RPI leads to:
- a higher discount rate, which will lower the carrying value of loan books.
- increased interest on borrowers’ balances in the following year for Plan 2, 3 and 5 loans
- increased interest for Plan 1 loans, unless RPI is higher than the base rate +1%, in which case RPI does not determine the interest rate.
- increased repayment threshold for Plan 1 loans, which results in lower repayments.
The outturn for March 2025 RPI is 3.3% and is forecast to increase to 4.2% next year before increasing marginally throughout the remainder of the forecast period (prior year: 7.5% and was forecast to fall to 2.2% in 2025-26). Long-term is considered to be 30 years for these purposes. The table shows the impact of a 1% or 2% change to each RPI forecast in each of the forecast cash flow years. An increase in RPI reduces the valuation of the loan book, and a decrease in RPI increases the valuation. The amounts are significant due to the impact that RPI has on the discount rate, as explained above and as seen last year, changes to the discount rate can have a significant impact on the carrying value of the loan book.
The percentage movements above are not against the year end RPI value. The +/- margins are against the OBR’s central forecast of RPI which was used in the year end valuation modelling across the full 30-year life of the loans.
Credit Risk
The categories of financial assets with inherent significant credit risks are loans and deposits (£252.2 billion) and student loans (£178.1 billion).
New Term Funding scheme for small to medium enterprises Term Funding Scheme with additional incentives for SMEs was £96.7 billion (2023-24: £151.3 billion). In March 2020, the Bank’s policy committees announced a comprehensive package of measures to help UK businesses and households manage the economic disruption caused by the Covid virus. Part of this package involved the launch of the Term Funding Scheme with additional incentives for SMEs (TFSME).
The drawdown period ran until 31 October 2021, or 30 April 2021 for participants which opted out of the TFSME extension. The term of each transaction is for four years from the date of drawdown. Participants in a TFSME Group that contains one or more accredited lenders under the British Business Bank’s Bounce Back Loan Scheme (BBLS) will be able to extend the term of some transactions to align with the term of loans made through the BBLS. Participants may terminate any transaction, in part or in full, before its maturity date. The Bank charges interest on TFSME transactions equal to Bank Rate plus a Scheme fee (TFSME Fee). The fee is determined based on the net lending of each participant over the reference period of the scheme. This fee ranges from 0 basis points to 25 basis points. The reference period ran from 31 December 2019 to 30 June 2021, or 31 December 2020 Bank of England for participants which opted out of the TFSME extension. TFSME scheme fees arising on lending are recognised as income on an accruals basis. TFSME income reflects Bank Rate on TFSME loans and £0.3 million (2023-24: £1.3 million) scheme fees receivable in the year. TFSME scheme fees are retained by the Bank as income.
A further £103.1 billion (2023-24: £48.5 billion) of loans and deposits arise from reverse sale and repurchase agreements (REPOS). These agreements are mainly entered into by the Bank of England, DMA, and EEA. Exposures to credit risk are fully collateralised and assets held as collateral are revalued daily. The government returns collateral to the provider of collateral, or requests additional collateral, depending on whether the value of collateral has risen or fallen. Details on collateral held under these agreements can be found in the accounts of the Bank of England, the DMA and the EEA.
Student loans are a source of a credit risk. Eligible students can get loans regardless of their credit rating to support the policy aim of encouraging students to enter higher and further education. There is no obligation to repay the loan until the borrower’s income reaches a certain income threshold and there are other circumstances when the loan will be written off, for example based on the age of the student. Therefore, even though most repayments are collected by HMRC as part of the tax collection process, not all the loans will be repaid.
The total balance sheet value of student loans provided by government, including those via the devolved administrations, is £178.1 billion (2023-24: £169.1 billion). The Department for Education, representing English students, holds £157.9 billion (2023-24: £151.0 billion). The face value of the Department for Education’s loan book was £264.6 billion (2023-24: £234.1 billion face value).
Changes in the Modelling Assumptions
Note 14.3.2 of the DfE 2024-25 financial statements provides details on the modelling assumptions used to calculate the closing value of student loans.
The key macroeconomic assumptions that affect the value of the student loan books are earnings growth, RPI inflation (all Plans), and the Bank of England base rate (Plan 1 only). These macroeconomic assumptions are based on OBR forecasts as they are considered the most reliable and span the length of time required for consideration for student loan repayments. Other assumptions, for example, that future graduate earnings will mimic the available data on historical graduate earnings cannot be easily verified.
Student Loan Plans
Loans for students in higher education and further education are originated and recognised by the Department. Student loans can be split into different repayment plans depending upon which education sector the borrowers are members of and when the loans were taken out. Depending on circumstances it is possible for borrowers to have loans across different plans.
The plans are as follows:
- Plan 1 loans – loans taken out for undergraduate courses that started before 1 September 2012
- Plan 2 loans – loans taken out for new undergraduate courses that started on or after 1 September 2012 until 31 August 2023, including advanced learner loans
- Plan 3 loans – loans for postgraduate master’s courses starting on or after 1 August 2016 and postgraduate doctoral courses starting on or after 1 August 2018
- Plan 5 loans – loans taken out for new undergraduate courses that started on or after 1 August 2023, including advanced learner loans
Plan 2 will continue to be a live plan until existing borrowers who started their undergraduate courses on Plan 2 finish their courses.
Plan 4 loans are issued solely by Student Awards Agency Scotland so do not form part of the Group’s activities.
The impact of credit risk and policy decisions on repayment conditions on all Department for Education student loans are shown by the following table of fair value assets:
| 2024-25 Balance sheet value | 2024-25 Face Value | 2023-24 Balance sheet value | 2023-24 Face Value | |
|---|---|---|---|---|
| £bn | £bn | £bn | £bn | |
| Undergraduate Plan 1 | 11.6 | 27.8 | 13.2 | 28.1 |
| Undergraduate Plan 2 | 128.9 | 215.8 | 127.8 | 196.4 |
| Postgraduate Plan 3 | 6.1 | 6.6 | 6.2 | 5.8 |
| Plan 5 | 11.3 | 14.4 | 3.8 | 3.7 |
| Total student loans held by Department for Education | 157.9 | 264.6 | 151.0 | 234.0 |
Under IFRS 9, student loans are recognised at fair value. In determining the fair value of student loans, the Department has used a discounted cash flow model, and this includes all expected cash flows, including the interest that is expected to be received. As a result, a single fair value movement is recognised in the SoCNE. The face value is made up of the opening face value, plus additions and capitalised interest, and less repayments and write-offs. Face value excludes fair value adjustments.
Following the adoption of IFRS 9 expected credit loss (ECL) “forward-looking model”, it is no longer necessary for a loss event to have occurred before credit losses are recognised. WGA entities are required to recognise either a 12-month or lifetime ECL, depending on whether there has been a significant increase in credit risk since initial recognition. The ECL model applies to both debt instruments accounted for at amortised cost and at FVTOCI. The figures below do not include financial assets with an ECL of zero and therefore do not match those presented elsewhere in this note.
| Financial assets impaired | Expected Credit Loss for assets held at amortised cost | |||||
|---|---|---|---|---|---|---|
| Gross financial assets | Stage 1 | Stage 2 | Stage 3 | Simplified Impairment rule | Net financial assets | |
| £bn | £bn | £bn | £bn | £bn | £bn | |
| Trade and other receivables | 56.2 | – | – | – | (49.2) | 7.0 |
| Loans held at amortised costs | 146.4 | – | – | – | – | 146.4 |
| Total financial assets | 202.6 | – | – | – | (49.2) | 153.4 |
Stage 1: all ECLs relating to loans held at amortised cost are classified as Stage 1 which means these assets have no significant increase in credit risk since the asset’s origination.
Stage 2: assets for which there has been a significant increase in credit risk since the asset’s origination the impairment provision reflected full lifetime ECL.
Stage 3: assets which are in default, interest income is recognised only in respect of the balance net of impairment.
The above table illustrates:
- The WGA note most affected by the changes to the impairment of financial assets, under IFRS 9, is Note 16 (Trade and other receivables).
- Entities should apply the simplified expected credit loss model approach to trade receivables. Contract assets and lease receivables, when they meet certain criteria, shall always measure the loss allowance at an amount equal to lifetime expected credit loss. WGA entities can select their own accounting policy for trade receivables, lease receivables and contract assets independently. In 2024-25, WGA entities have £49.3 billion expected credit loss under trade and other receivables.
Most of loans held at amortised cost consist of £96.7 billion for the new TFS for small and medium enterprises.
- The Bank of England manages credit risk associated with these loans by ensuring that exposures are fully backed by collateral.
Foreign currency assets inevitably carry some element of credit risk. To keep this risk at a low level, the government predominantly invests in securities issued, or guaranteed by, the national governments of the United States, Euro area countries and Japan. The EEA debt securities are held at an equivalent external rating of AA and above (£68.1 billion, 2023-24: £66.4 billion) and A to AA (£9.1 billion, 2023-4: £6.7 billion) and were held within Europe (£25.3 billion, 2023-24: £24.5 billion), North America (£41.9 billion, 2023-24: £41.7 billion), and Asia-Pacific (£9.9 billion, 2023-24: £6.8 billion). Further details on the government’s credit risk management of foreign currency reserves can be found in the 2024-25 Exchange Equalisation Account.
Foreign Exchange Rate Risk
The government is mainly exposed to foreign exchange risk on the UK’s official holdings of international reserves (‘the Official Reserves’). Foreign currency reserves are held on a precautionary basis that could be used, when necessary, to regulate the exchange value of sterling, and is the mechanism through which any UK government exchange rate intervention would be conducted, for example in the event of any unexpected shocks.
The Official Reserves comprise two components: reserves that are hedged for currency and interest rate risk (‘the hedged reserves’), and the remaining reserves which are unhedged for currency and interest rate risk (‘the unhedged reserves’). The Official Reserves comprises assets held by the Exchange Equalisation Account (EEA) consisting of the UK’s reserves of gold, foreign currency assets, and IMF SDRs, and assets held in the National Loan Fund (NLF) comprising the UK’s Reserve Tranche Position at the IMF and lending to the IMF.
The Treasury has appointed the Bank of England to act as its agent in the day-to-day management of the EEA in accordance with an agreed framework and to manage the foreign currency assets and liabilities associated with the reserves of the NLF. The Bank of England monitors and controls market risk primarily by using a Value at Risk (VaR) model. This estimates a loss level that will not be exceeded at a specified confidence level, over a defined period, so that losses will not exceed the VaR figure in 99 out of 100 two-week periods.
The Bank calculates the VaR on benchmark reserve on an annual basis. The values of the benchmark reserves are based on market-to-market prices at the end of the period.
Benchmark Reserves
| 2025 | 2024 | |
|---|---|---|
| $ Million | $ Million | |
| Hedged reserves | ||
| Value at Risk (VaR) as at 31 March | 60 | 75 |
| Unhedged Reserves | ||
| Value at Risk (VaR) as at 31 March | 3,283 | 3,623 |
In addition to foreign currency reserves, the government is exposed to foreign exchange risk through the UK’s transactions with the IMF. The UK’s quota subscription and lending to the IMF are both denominated in SDR and are subject to valuation adjustments by the IMF. The UK’s liabilities to the IMF, although denominated in sterling, are also subject to valuation adjustments by the IMF.
In 2018-19, investments in financial institutions primarily related to the value of the UK’s capital investment in the European Investment Bank (EIB) of £9.9 billion as based on the UK’s share of the EIB’s net assets in euros. Therefore, the government was exposed to foreign exchange rate risk on the fair value of this equity investment. On 31 January 2020 the UK left the EU under the terms of the Withdrawal Agreement. Article 150 of the Withdrawal Agreement provides for the return of the UK’s paid-in capital in the EIB, as it stood at the point of withdrawal. The resulting asset is recognised as a receivable. As a result, the EIB asset has been reclassified from non-current investment to receivable. This has also led to a change in the measurement basis of the asset, reflecting that the UK ‘s interest is no longer in the performance of the net assets of the EIB but rather in the reimbursement of historic contributions.
Article 150 of the Withdrawal Agreement provides for the return of the UK’s paid-in capital in the EIB, as it stood at the point of withdrawal. The first instalment (£272 million) one of twelve instalments was received in October 2020. In accordance with the clear line of sight principle, the EIB asset was transferred from the Consolidated Fund to HM Treasury in 2020-21 with the effective date of 31 March 2021. HM Treasury’s estimate of the fair value of the receipts under Article 150 is £1.48 billion (2023-24: £1.71 billion).
Price Risk
The government is exposed to price risk on its shareholding in NatWest. The fair value of these UK listed shares fluctuates because of changes in market prices. Market prices for a share may fluctuate due to factors specific to the individual share or its issuer, or factors affecting all shares traded in the market. UK Government Investments (UKGI – a wholly owned subsidiary of HM Treasury) is responsible for the development and execution of an investment strategy for disposing of the investments in NatWest in an orderly and active way, within the context of protecting and creating value for the taxpayer.
25. Public Sector Pensions
Pension Liabilities
The public sector pension liabilities are summarised in the following table with figures separated out for each of the workforces. The table also shows the percentage change in the net liabilities between 2023-24 and 2024-25.
| Scheme liabilities | Scheme assets | 2024-25 Net liabilities | 2023-24 Net liabilities | Change in Net scheme liabilities | |
|---|---|---|---|---|---|
| £bn | £bn | £bn | £bn | % | |
| Unfunded schemes: | |||||
| NHS | 531.4 | – | 531.4 | 500.8 | 6.1 |
| Teachers | 333.3 | – | 333.3 | 307.8 | 8.3 |
| Civil Service | 216.9 | – | 216.9 | 208.1 | 4.2 |
| Armed Forces | 150.3 | – | 150.3 | 144.6 | 3.9 |
| Police | 92.4 | – | 92.4 | 93.9 | (1.6) |
| Royal Mail | 28.2 | – | 28.2 | 28.7 | (1.7) |
| Fire | 20.5 | – | 20.5 | 17.6 | 16.5 |
| Other unfunded | 27.9 | – | 27.9 | 14.4 | 93.8 |
| 1,400.9 | – | 1,400.9 | 1,315.9 | 6.5 | |
| Funded schemes: | |||||
| Local government | 242.5 | (244.2) | (1.7) | (2.8) | (39.3) |
| Other funded | 84.5 | (87.9) | (3.4) | (1.2) | 183.3 |
| 327.0 | (332.1) | (5.1) | (4.0) | 27.5 | |
| Total | 1,727.9 | (332.1) | 1,395.8 | 1,311.9 | 6.4 |
The Local Government Pensions Scheme (LGPS) is the largest funded scheme. There are 98 LGPS funds across the UK with 86 funds in England and Wales, 11 in Scotland and 1 in Northern Ireland. The individual employers that contributed to these funds recognised their proportion of the scheme liabilities in their statement of accounts. The local government funded schemes balance disclosed above includes the portion of the pension liability of the LGPS that was reported in the financial accounts of the individual local authority employers.
For the note overall, there has been a year-on-year increase in the net liability of £83.9 billion, which is the combined effect of an increase in total liabilities of £111.6 billion, partially offset by an increase in assets of £27.7 billion.
The year-on-year increase in the net liability of £83.9 billion is made up of increases to liabilities values of unfunded schemes of £85.0 billion and funded schemes of £26.6 billion, partially offset by an increase to the value of funded scheme assets of £27.7 billion.
Pension scheme liabilities are valued based on actuarial calculations. The results of any actuarial calculation are inherently uncertain because of the assumptions which must be made. The most significant financial assumptions are generally the discount rate, general earnings increases and pension increases (currently based on CPI), inflation, and where applicable returns on corporate bonds. A key demographic assumption is pensioner mortality. Individual pension scheme accounts outline the key assumptions in play for their specific pension scheme, and sensitivity analyses estimating what the impact on the liabilities would be if the most significant assumptions were to be inaccurate.
The principal reasons for the £83.9 billion increase in net liabilities in this year’s WGA were the net impact of entities which submitted data to the WGA in one but not both of 2024-25 and 2023-24 (£39.9 billion), and changes in actuarial assumptions (£36.9 billion). Falling long‑term interest rates and gilt yields reduced the rate used for accounting valuations. As a result, public‑sector pension liabilities increased significantly, even though the underlying pension promises did not change.
The most significant contributor to this overall net increase is the National Health Service Pension Scheme (NHSPS), whose unfunded pensions liability balance increased by £26.2 billion year on year. For this scheme 2024-25 service costs and enhancements, as well as financing costs, outweighed benefits paid by £20.2 billion. There was also an actuarial loss of £6.0 billion. While the discount rate increased slightly (from 5.10% in 2023-24 to 5.15% in 2024-25), which would decrease the liability, this was more than offset by other factors including inflation and an increase in expected long term earnings.
Other significant contributors to the overall £83.9 billion increase in net liabilities include The Teachers’ Pension Scheme (England & Wales), with an increase of £11.9 billion, and Cabinet Office: Civil Superannuation with an increase of £8.2 billion. As for the NHSPS Scheme above, these two schemes also state that the increases in the net liability were mainly due to a combination of service costs and enhancements and financing costs outweighing benefits paid, as well as the impact of actuarial losses.
The combined liabilities total for the NHS Pension Schemes is £531.4 billion (2023‑24: £500.8 billion). The contributors to this total are the England/Wales NHS Pension Scheme (£457.2 billion, 2023-24: £431.0 billion), the Scottish NHS Pension Scheme (£53.7 billion, 2023-24: 50.6 billion), and the Health and Social Care Pension Scheme in Northern Ireland (£20.5 billion, 2023-24: 19.3 billion). There is no impact from missing data in this category.
The combined liabilities total for the Teachers’ Pension Schemes is £333.3 billion (2023‑24: £307.8 billion). The contributors to this total are the Teachers’ Pension Scheme (England & Wales) with £290.7 billion (2023-24: £278.8 billion), the Scottish Teachers’ Pension Scheme (£30.2 billion, 2023-24: £29.1 billion), and the Teachers Superannuation Scheme Northern Ireland (£12.4 billion, 2023-24: did not submit data to the WGA). Please note that these are closing balances, so for the Northern Ireland scheme this is different to the opening balance of £12.0 billion quoted as part of the missing data disclosures above.
The combined liabilities total of the Civil Service Pension Schemes is £231.1 billion (2023‑24: £223.7 billion). This is made up of the unfunded liabilities total of £216.9 billion (2023-24: £208.1 billion) as shown in the table above, as well as £14.2 billion (2023-24: £15.6 billion) of liabilities relating to funded pension schemes. The main contributor is the Civil Service Pension Scheme (Great Britain) with £200.9 billion (2023-24: £192.7 billion) of liabilities. These amounts relate entirely to unfunded liabilities. There is no impact from missing data in this category.
The liabilities total of the Armed Forces Pension Scheme is £150.3 billion (2023-24: £144.6 billion). There is only one scheme in this category. The main reasons for the £5.7 billion increase in the scheme’s net liabilities were in year costs of £9.5 billion and an actuarial loss of £2.3 billion, partly offset by the impact of in year payments of £6.1 billion.
The combined liabilities total of the Police Pension Schemes is £104.7 billion (2023-24: £104.8 billion). This is made up of the unfunded liabilities total of £92.4 billion (2023-24: £93.9 billion) as shown in the table above, as well as £12.3 billion (2023-24: £10.9 billion) of liabilities relating to funded pension schemes. The most significant contributors to the unfunded liabilities total are the Mayor’s Office for Policing and Crime (Mayor of London £20.3 billion, 2023-24: £24.2 billion), Scottish Police Authority (£12.7 billion, 2023-24: £12.4 billion), Department of Justice – Northern Ireland (£7.3 billion, 2023-24: £7.2 billion), and West Midlands Police and Crime Commissioner (£5.5 billion, 2023-24: £6.1 billion).
There is a significant net impact of £9.0 billion from missing data in the Police Pension Schemes category, due to the fact that a number of schemes in this category submitted data to the WGA this year which had not done so in the previous year. This is the net impact of the increase in the reported liabilities totals due to entities which made submissions to the WGA this year but had not done so in 2023-24 of £12.6 billion, partially offset by the impact of entities which submitted last year but not this year of £3.6 billion.
There were six entities impacting on this category which made submissions to the WGA in 2024-25 but not in 2023-24 . These were The Police and Crime Commissioner for Merseyside & The Chief Constable of Merseyside (2024-25: £3.8 billion), The Police and Crime Commissioner for Lancashire & The Chief Constable of Lancashire (2024-25: £2.8 billion), The Police and Crime Commissioner for Essex & The Chief Constable of Essex (2024-25: £2.3 billion), The Police and Crime Commissioner for Norfolk & The Chief Constable of Norfolk (2024-25: £1.4 billion), The Police and Crime Commissioner for Cambridgeshire & The Chief Constable of Cambridgeshire (2024-25: £1.2 billion), and The Police and Crime Commissioner for Suffolk & The Chief Constable of Suffolk (2024‑25: £1.1 billion). Please note, where applicable, that these figures are different to totals disclosed for these entities under missing data above as the figures disclosed in this paragraph relate to liabilities only so exclude scheme assets.
There were also two entities impacting on this category which made submissions to the WGA in 2023-24 but did not this year. These were The Police and Crime Commissioner for South Yorkshire & The Chief Constable of South Yorkshire (2023-24: £2.4 billion), and The Police and Crime Commissioner for Gwent & The Chief Constable of Gwent (2023-24: £1.2 billion).
Other unfunded schemes include the Greater Manchester Combined Authority of £6.9 billion (2023-24: did not submit data to the WGA), the UK Atomic Energy Authority Pension Scheme of £5.4 billion (2023-24: £5.4 billion), and the Research Councils Pension Scheme (RCPS) of £4.2 billion (2023-24: £4.1 billion).
Other Funded schemes’ net assets of £3.4 billion (2023-24: £1.2 billion) are made up of a number of schemes.
It also includes other pension scheme liabilities for bodies within the WGA boundary which are not local authorities. Please note that the Academy Schools net liability (2024‑25: 0.7 billion, 2023-24: less than £0.1 billion) could be significantly different if the liability had been calculated as at 31 March 2025 instead of 31 August 2024.
In addition to updates provided in annual accounts, public sector pension schemes carry out periodic full actuarial valuations which are used to set employer contribution rates. The last full actuarial valuations for the unfunded pension schemes which contribute the majority of the total value as per the WGA were carried out as at 31 March 2020. Most schemes are expected to complete valuations as at 31 March 2024 during the financial year ending 31 March 2027.
Increase in Pension Liabilities
The table below breaks down the changes in the present value of gross scheme liabilities over the financial year.
| Unfunded | Funded | Total 2024-25 | Total 2023-24 | |
|---|---|---|---|---|
| £bn | £bn | £bn | £bn | |
| Gross liability at 1 April | 1,315.9 | 300.4 | 1,616.3 | 1,722.5 |
| Restatements | 1.1 | 0.7 | 1.8 | (3.3) |
| Boundary adjustment | 38.3 | 47.9 | 86.2 | (21.7) |
| Current service costs (net of participants’ contribution) | 23.8 | 8.2 | 32.0 | 37.5 |
| Past service costs | 0.4 | 0.2 | 0.6 | 0.3 |
| Settlements/curtailments | (0.1) | (0.4) | (0.5) | (0.2) |
| Interest on scheme liabilities | 65.6 | 16.7 | 82.3 | 72.0 |
| Contribution by scheme participants | 16.8 | 2.7 | 19.5 | 15.0 |
| (Gains)/Losses on revaluation: | ||||
| Experience (gains) and losses arising on liabilities | 3.1 | (1.7) | 1.4 | 49.0 |
| Changes in assumptions underlying the value of liabilities | (3.5) | (33.4) | (36.9) | (190.7) |
| Benefits paid | (60.4) | (13.5) | (73.9) | (64.8) |
| Transfers in/(out) | (0.1) | (0.8) | (0.9) | 0.7 |
| Gross liability at 31 March | 1,400.9 | 327.0 | 1,727.9 | 1,616.3 |
The boundary adjustment reflects the net impact of entities which submitted data for one but not both of 2024-25 and 2023-24 (see below).
Overall, the net public sector pension liability increased by £83.9 billion during the year. This is broken down as follows:
| 2024-25 | 2023-24 | |
|---|---|---|
| £bn | £bn | |
| Net liability at 1 April | 1,311.9 | 1,415.0 |
| Boundary adjustment | 39.9 | (11.5) |
| Restatement | 3.1 | 1.2 |
| Net (gains)/losses on revaluation | (6.8) | (137.2) |
| Current service costs (net of participants’ contributions) | 32.0 | 37.5 |
| Net interest costs | 67.9 | 55.9 |
| Unfunded schemes benefits paid | (60.4) | (53.7) |
| Past service costs | 0.6 | 0.3 |
| Net settlements/curtailments | (0.1) | (0.2) |
| Contribution by unfunded scheme participants | 16.8 | 12.7 |
| Contribution by funded scheme employers | (9.1) | (8.3) |
| Net transfers in/(out) | – | 0.2 |
| Net liability at 31 March | 1,395.8 | 1,311.9 |
As summarised in the above tables, the change in the net pension liability is largely dictated by four factors:
- the revaluation gain or loss, which at this year-end decreases the liability as a gain was recognised.
- the current service costs which increase the liability.
- the net interest costs which increase the liability.
- the benefits paid from the unfunded schemes which reduce the liability.
This volatility in the revaluation gain or loss is predominantly due to the change in assumptions, in particular the discount rate net of inflation and demographic assumptions. The discount rate for central government unfunded schemes is based on yields of high quality (AA) corporate bonds. The return on corporate bonds is only used to discount the future benefit payments to the present day, therefore whilst movement in the assumption has a significant impact on the liability figure in the accounts from year to year, as shown by the sensitivity analysis, it does not influence the level of benefits received by the members.
Boundary Adjustments
There were a number of entities which contributed to the note total through their data submissions in 2023-24, but which did not make a submission to the WGA this year. The impact of these entities on this note’s closing balance was £5.3 billion.
Of those entities, the most significant are The Police and Crime Commissioner for South Yorkshire & The Chief Constable of South Yorkshire, which contributed £2.5 billion in net pension liabilities to the WGA last year, and the Police and Crime Commissioner for Gwent & The Chief Constable of Gwent which contributed £1.2 billion of net assets last year.
Similarly, there were also a number of entities which made contributions to the note this year but did not make a submission last year. In terms of the net impact on this note’s opening balances, these entities contributed a total of £45.2 billion this year.
The major contributors were The Teachers Superannuation Scheme Northern Ireland (£12.0 billion), Greater Manchester Combined Authority (£7.6 billion), The West Yorkshire Combined Authority (£4.3 billion), and The Police and Crime Commissioner for Merseyside & The Chief Constable of Merseyside (£3.7 billion).
The net increase in the closing balance as a result of missing data is therefore £39.9 billion.
Sensitivity Analysis
The key financial assumptions are shown in Note 2.5 and show that, for the central government unfunded schemes, the (net of CPI) discount rate decreased from 2.45% on 31 March 2024 to 2.40% on 31 March 2025. The decrease in discount rate increases the present value of liabilities. This actuarial loss from the discount rate is recognised in other comprehensive expenditure rather than against net income. The increase in liability from the change in discount rate was accompanied by other changes in other assumptions, leading to an overall revaluation loss for liabilities that increased the liability.
The table below shows the approximate sensitivity of the unfunded liability to changes in key assumptions. Opposite changes in the assumptions will produce approximately equal and opposite changes in the liability. The sensitivity will be similar for the gross liability of the funded schemes.
| % change in value of unfunded liability | £bn change in unfunded liability | |
|---|---|---|
| Increasing the assumption by 0.5% a year: | ||
| Discount rate | -8% | -112.0 |
| Rate of increase in pensions | 8% | 112.0 |
| Rate of increase in Salaries | 1% | 14.0 |
| Increasing assumed life expectancy in retirement by 1 year | 3% | 42.0 |
The current service cost is an estimate made by scheme actuaries of the benefits earned by employees in the year.
The net interest cost reflects the increase in the present value of the pension liability during the year because the benefits are one period closer to settlement. The financing cost is based on the discount rate (including inflation) at the start of the year and is calculated on the net liability. The expense from unwinding the discount rate is recognised against net expenditure.
Past service costs reflect changes in the present value of scheme liabilities related to employee service in prior periods that arise in the current period as a result of changes to retirement benefits.
Pension Assets
Funded pension schemes hold the following assets:
| Local government | Other funded | 2024-25 Total | 2023-24 Total | |
|---|---|---|---|---|
| £bn | £bn | £bn | £bn | |
| Equity investments | 130.7 | 30.7 | 161.4 | 146.4 |
| Bonds | 40.8 | 25.8 | 66.6 | 59.5 |
| Other | 72.9 | 31.2 | 104.1 | 98.5 |
| Total market value | 244.4 | 87.7 | 332.1 | 304.4 |
The ‘other’ balance consisted of property, cash and other alternative assets, such as hedge funds and private equity, diversified growth funds, or infrastructure investments, which have varying levels of performance.
Change in Pension Assets
The table below breaks down the changes in the fair value of funded scheme assets over the financial year.
| 2024-25 | 2023-24 | |
|---|---|---|
| £bn | £bn | |
| Gross assets at 1 April | 304.4 | 307.5 |
| Boundary Adjustment | 46.3 | (10.1) |
| Restatements | (1.3) | (4.6) |
| Interest on scheme assets | 14.4 | 16.1 |
| Actual return less interest on scheme assets | (28.7) | (4.5) |
| Contributions by employers | 9.1 | 8.3 |
| Contributions by scheme participants | 2.7 | 2.3 |
| Benefits paid | (13.5) | (11.1) |
| Assets distributed on settlements | (0.4) | - |
| Transfers in/out | (0.9) | 0.5 |
| Gross assets at 31 March | 332.1 | 304.4 |
Total Pension Assets increased by £27.7 billion, from £304.4 billion in 2023-24 to £332.1 billion in 2024-25. The biggest impact on this increase was missing data, with a net increase of £46.3 billion due to more entities submitting data to the WGA in 2024‑25 than 2023-24. This was partially offset by overall net decreases across the entities which submitted data to the WGA both this year and last year. While not the case for all entities, many experienced year-on-year decreases in asset totals due to a number of factors such as increased expenditure on benefits and reduced employer contributions.
Amounts Recognised in the Financial Statements
Amounts recognised in the Statement of Revenue and Expenditure are as follows:
| Unfunded | Funded (net) | 2024-25 Total | 2023-24 Total | |
|---|---|---|---|---|
| £bn | £bn | £bn | £bn | |
| Current service cost | 23.8 | 8.2 | 32.0 | 37.5 |
| Past service cost | 0.4 | 0.2 | 0.6 | 0.3 |
| Settlements/curtailments | (0.1) | (0.4) | (0.5) | (0.2) |
| Net financing cost | 65.6 | 16.7 | 82.3 | 72.0 |
| Total recognised in the Statement of Revenue and Expenditure | 89.7 | 24.7 | 114.4 | 109.6 |
26. Capital Commitments
| 2024-25 | 2023-24 | |
|---|---|---|
| £bn | £bn | |
| Capital commitments at year end | 75.2 | 63.6 |
| Total capital commitments | 75.2 | 63.6 |
Capital commitments represent forthcoming commitments to capital expenditure that have been contracted but are not yet reflected in the financial statements. On 31 March 2025, total capital commitments stood at £75.2 billion (2023-24: £63.6 billion), an increase of £11.6billion (18.2%) on the previous year.
As in 2023-24, the most notable capital commitments in 2024-25 were reported by the Ministry of Defence, amounting to £36.7 billion (2023-24: £34.2 billion), and the Department for Transport with £6.9 billion (2023-24: £7.9 billion). The most significant contributor to the increase in capital commitments was the Ministry of Defence, contributing £2.5 billion to the increase.
There were a number of entities which contributed to the note total through their data submissions in 2023-24 but did not make a submission to the WGA in 2024-25. These entities contributed £ 1.7 billion to the note total last year. Similarly, there were a number of entities which contributed to the note total in 2024-25, which did not in 2023-24. These entities submitted a total of £4.1 billion in 2024-25. This resulted in an increase due to missing data movements of £2.4 billion.
27. Commitments Under Leases
Lease liabilities are the present value of future payments due under lease contracts over the lease term, discounted in accordance with IFRS 16 and recognised alongside rightofuse assets. The maturity analysis below shows an undiscounted timeband analysis of contractual cash outflows for lease liabilities, with a reconciliation to the discounted lease liability in the Statement of Financial Position.
IFRS 16 has been adopted by central government and local government for the 2024-25 WGA. Central government departments and NHS bodies adopted IFRS 16 from 1 April 2022 (financial year 2022-23) under the FReM, generally using a modified retrospective approach. Local government bodies adopted from 1 April 2024 (financial year 2024‑25) under the CIPFA/LASAAC Code. As a result, the 2022-23 and 2023-24 WGAs were prepared on a mixed basis: most central government and NHS components reported under IFRS 16, while local government components continued to report under IAS 17.
The 2024-25 WGA is the first prepared on a fully consistent IFRS 16 basis across all major sectors. Lease balances are recognised as lease liabilities with corresponding rightofuse assets, with shortterm and lowvalue exemptions applied.
IFRS 16 – Operating Leases as a Lessor
| 2024-25 | 2023-24 | |
|---|---|---|
| £bn | £bn | |
| Obligations under operating leases comprised: | ||
| Total payments within one year | 1.3 | 0.9 |
| Total payments between one and five years | 3.6 | 2.5 |
| Total payments thereafter | 11.6 | 6.4 |
| Total operating leases as a lessor | 16.5 | 9.8 |
A small number of entities contributed to the operating leases as a lessor total through data submission in 2023-24 but did not make a submission to the WGA this year. Similarly, a small number of entities made contributions to the note this year but did not submit data in 2023-24. However, changes in reporting entities between 2024-25 and 2023-24 had no net impact on Operating leases as a lessor this year.
IFRS I6 – Lease Liabilities
| 2024-25 | 2023-24 | |
|---|---|---|
| £bn | £bn | |
| Infrastructure | ||
| Total payments within 1 year | 0.1 | – |
| Total payments between 1 and 5 years | 0.4 | – |
| Total payments thereafter | 1.3 | 0.1 |
| Subtotal – Infrastructure | 1.8 | 0.1 |
| Less interest element | (0.6) | – |
| Present value obligation | 1.2 | 0.1 |
| Land and buildings | ||
| Total payments within 1 year | 2.8 | 2.7 |
| Total payments between 1 and 5 years | 8.4 | 9.0 |
| Total payments thereafter | 12.6 | 50.4 |
| Subtotal – Land and buildings | 23.8 | 62.1 |
| Less interest element | (4.7) | (41.0) |
| Present value obligation | 19.1 | 21.1 |
| Other | ||
| Total payments within 1 year | 0.3 | 2.3 |
| Total payments between 1 and 5 years | 1.3 | 2.9 |
| Total payments thereafter | 2.4 | 0.4 |
| Subtotal – Other | 4.0 | 5.6 |
| Less interest element | (0.3) | (1.5) |
| Present value obligation | 3.7 | 4.1 |
| Current (before interest deduction) | 3.2 | 5.0 |
| Non-current (before interest deduction) | 26.4 | 62.8 |
Central government departments adopted IFRS 16 from 1 April 2022 and, as permitted by HM Treasury, applied transitional arrangements without restating prioryear figures. Most leases recognised as operating leases until 31 March 2022 are now recognised as rightofuse assets with associated lease liabilities. The most significant balances are Department of Health and Social Care £5.1 billion (2023-24: £4.3 billion) and Ministry of Defence (MoD) £1.9 billion (2023-24: £44.6 billion).
The MoD’s main leases relate to land and buildings, equipment and vehicles. In 2024‑25 it purchased previously leased Service accommodation; under IFRS 16 this is treated as exercising a purchase option. As a result, the lease liability was remeasured to the £6.0 billion purchase price (with a corresponding adjustment to the revaluation reserve) and, on settlement and transfer of legal title, £9.0 billion was reclassified from right-of-use assets to property, plant and equipment. Amounts due greater than five years fell from £41.9 billion to £0.8 billion (down £41.1 billion, 98.1%), while the associated interest element reduced from £38.4 billion to £0.4 billion (down £38.0 billion, 99.1%). Overall, this reflects a substantial contraction in the long-dated lease liability and related future finance charge profile following the purchase of previously leased accommodation.
A small number of entities contributed to the operating leases as a lessor total through data submission in 2023-24 but did not make a submission to the WGA this year. Similarly, a small number of entities made contributions to the note this year but did not submit data in 2023-24. However, changes in reporting entities between 2024-25 and 2023-24 had no net impact on lease liabilities this year.
Amounts Recognised in the Financial Statements
Amounts recognised in the Statement of Revenue and Expenditure are as follows:
| 2024-25 Total | 2023-24 Total | |
|---|---|---|
| £bn | £bn | |
| IFRS 16 interest on lease liabilities – finance costs | 0.7 | 0.4 |
| Income of sub-leasing ROU assets | (0.7) | – |
| Expenses relating to short term liabilities | (0.1) | 0.2 |
| Expenses relating to leases of low-value assets, excluding short-term leases of low-value assets | – | – |
| Variable lease payments not included in measurement of lease liabilities | 0.1 | 0.1 |
| Total | 0.0 | 0.7 |
28. Commitments Under Private Finance Initiative (PFI) Contracts
PFI Contracts Recognised on The Statement of Financial Position
The substance of PFI/service concession arrangements is the unitary charge comprises of three components: service charges, interest on the service concession liability, and repayments of the principal element of that liability.
Government policy ended the use of PFI contracts from 2018, so the number of schemes have been declining as they reach the end of their terms . However, as shown in Note 12, the net book value of PFI assets increased in 2024-25 (see Note 12), reflecting assets becoming operational under previously signed projects, revaluation and indexation movements, and capital enhancements or lifecycle additions.
PFI assets are recognised on the Statement of Financial Position where the government controls or regulates the services, to whom they are provided, the price, and any significant residual interest in the asset at the end of the contract. The net book value of PFI assets included in the Statement of Financial Position was £70.5 billion (2023‑24: £68.9 billion) as at 31 March 2025. The PFI liability for the present value of capital amounts payable was £38.7 billion (2023-24: £35.9 billion). The net present value of PFI obligations is recognised as a liability on the Statement of Financial Position as £38.7 billion whereas in the table below £37.4 billion has been reported. This is because interest charges and annual service charges are not recognised as liabilities in the Statement of Financial Position and are disclosed as commitments. These amounts will be recognised in the Statement of Revenue and Expenditure in the year they become due.
The overall net present value of obligations has increased by £2.7 billion during the 2024‑25 financial year. The most significant net present value of future service concession obligations balance of £17.2 billion (2023-24: £17.3 billion) are held by the Department of Health and Social Care and £3.4 billion (2023-24: £3.6 billion) are held by the Ministry of Defence.
The overall service charge balance has decreased by £0.4 billion with the most significant total annual service charge balance of £19.5 billion (2023-24: £20.2 billion) held by the Department of Health and Social Care, £9.0 billion (2023-24: £8.7 billion) held by the Ministry of Defence and £6.7 billion (2023-24: £7.3 billion) held by the Department for Transport.
Details of the underlying service concession liabilities are given in the table below:
| 2024-25 | 2023-24 | |
|---|---|---|
| £bn | £bn | |
| No later than one year | 1.6 | 4.2 |
| Later than one year and not later than five years | 20.7 | 16.0 |
| Later than five years | 34.5 | 35.1 |
| Present value (carrying amount) of the service concession (PFI) liability | 56.8 | 55.3 |
| Less interest charges allocated to future periods | (19.4) | (20.6) |
| Present value (carrying amount) of the service concession (PFI) liability | 37.4 | 34.7 |
Details of the minimum annual service elements are given in the table below:
| 2024-25 | 2023-24 | |
|---|---|---|
| £bn | £bn | |
| No later than one year | 5.4 | 5.0 |
| Later than one year and not later than five years | 19.0 | 18.2 |
| Later than five years | 33.3 | 34.9 |
| Total annual service elements | 57.7 | 58.1 |
The PFI obligations by segment of government where:
| 2024-25 | 2023-24 | |
|---|---|---|
| £bn | £bn | |
| Local authorities | 15.8 | 12.0 |
| Public corporations | 0.4 | 0.4 |
| Present value (carrying amount) of the service concession (PFI) liability | 56.8 | 55.3 |
Several entities that submitted data for this note in 2023-24 did not make a submission to the WGA this year. Last year, these entities contributed £2.4 billion in service concession liabilities and £2.7 billion in annual service charge obligations. Conversely, some entities made contributions this year but did not submit data in 2023-24. This year, these entities contributed £3.0 billion in service concession liabilities and £3.7 billion in annual service charge obligations. This results in a net increase of £0.6 billion in service concession liabilities and £1.0 billion in annual service charge obligations.
PFI Contracts Not Recognised on The Statement of Financial Position
During the 2024-25 financial year, some WGA entities had PFI contracts which were not recognised on the Statement of Financial Position. This is because the private sector contractor was, on balance, considered to have greater control over the use of the asset.
HM Treasury has considered whether assets not recognised on the Statement of Financial Position of any one entity should be consolidated as a shared ownership asset. It concluded that there are none with a significant value that should be included in the 2024-25 WGA that are not already consolidated.
29. Other Financial Commitments
Commitments from other non-cancellable contracts that are not leases or PFI contracts are as follows:
| 2024-25 | 2023-24 | |
|---|---|---|
| £bn | £bn Restated* | |
| Financial commitments expiring in future years: | ||
| No later than one year | 29.7 | 31.1 |
| Later than one year and not later than five years | 44.3 | 48.5 |
| Later than five years | 9.1 | 10.2 |
| Boundary Adjustments | – | – |
| Restatements | – | – |
| Total other financial commitments | 83.1 | 89.8 |
The prior year figures have been restated due to a combination of misstated and excluded information from entities for the 2023-24 consolidation.
Other Financial Commitments refer to obligations that government departments have entered into through non-cancellable contracts, which do not fall under leases, Private Finance Initiative (PFI) contracts, or other service concession arrangements. These commitments typically involve agreements where the government is contractually bound to make payments or provide funding, often for long-term projects or essential services.
The commitments are grouped in terms the number of years they are due to expire in. Financial commitments expiring in no later than one year fell between 2023-24 and 2024-25, from £31.1 billion to £29.7 billion. Those expiring between one and five years also decreased by £4.2 billion over the same period. Finally, financial commitments due to expire in five years or more decreased by £1.1 billion.
The most significant contribution to the under one year category was from DSIT, who reported a figure of £8.1 billion. They were also the most significant contributors to the one-to-five year category, reporting £12.2 billion. A significant element of both of these relates to payments due under non-cancellable contracts, of which the majority relates to UKRI (UK Research and Innovation), the UK’s largest public research funder, for the purposes of distributing research and innovation funding.
For commitments later than five years, the most significant contribution was from Department for Health and Social Care, with £2.0 billion. The majority of this relates again to non-cancellable contracts relating to the procurement of vaccines and milestone payments relating to the Moderna Strategic Partnership, a 10-year partnership aimed at strengthening UK vaccine resilience through, such as through the expansion of messenger ribonucleic acid (mRNA research).
Several entities that submitted data in 2023-24 and contributed £0.4 billion to the total did not make a submission to the WGA this year. Conversely, a number of entities that did not contribute in 2023-24 made submissions this year, adding £1.8 billion to the total. This resulted in a net increase of £1.4 billion due to missing data.
30. Contingent Liabilities Disclosed Under IAS 37
Quantifiable Contingent Liabilities
| 2024-25 | 2023-24 | |
|---|---|---|
| £bn | £bn | |
| Clinical negligence | 26.2 | 25.7 |
| Nuclear decommissioning | 22.6 | 17.8 |
| Transport infrastructure projects | 1.7 | 1.7 |
| EU related | – | 0.1 |
| Other | 11.2 | 6.7 |
| Total quantifiable contingent liabilities | 61.7 | 52.0 |
Contingent liabilities increased from £52.0 billion in 2023-24 to £61.7 billion in 2024‑25, an increase of £9.7 billion. The main drivers were the Department of Health and Social Care (DHSC) and the Welsh Government: total quantifiable clinical negligence contingent liabilities rose to £26.2 billion in 2024-25 (£25.0 billion for DHSC and £1.2 billion for the Welsh Government), compared with £25.7 billion in 2023-24 (£25.4 billion for DHSC and £1.3 billion for the Welsh Government). There were also significant increases in nuclear decommissioning contingent liabilities, which rose to £22.6 billion in 2024-25 (from £17.8 billion in 2023-24), and in other contingent liabilities, which increased to £11.2 billion (from £6.7 billion).
Individually significant quantifiable contingent liabilities within the other category include:
- Department for Transport (DfT) – £1.7 billion (2023-24: £1.7 billion, no change): These contingent liabilities predominantly relate to guarantees or indemnities entered into by the Department, where there are currently no significant indications that these will be drawn upon.
- Ministry of Defence (MoD) – £3.5 billion (2023-24: £1.4 billion): MoD’s contingent liabilities total £3.5 billion, up from £1.4 billion in 2023-24. MoD’s key contingent exposures include indemnities for Defence Marine Services towing operations (injury, loss or damage involving towed vessels; probability and scale of claims cannot be reliably estimated).
- Potential decontamination costs at contaminated sites and unquantified interventions related to environmental and safety responsibilities for shipwrecks in UK and overseas waters.
- A payment guarantee under the Government Records Management and Archive Service (Restore plc) if another department fails to settle invoices.
- An indemnity to AWE plc for nuclear risks under the Nuclear Installations Act 1965 (covering property damage and thirdparty death or personal injury).
- Residual contingent obligations under the Colchester Garrison PFI, including liabilities arising from qualifying changes in law, environmental damage, latent defects and uninsurable events.
Individually Significant Quantifiable Contingent Liabilities are as follows:
Clinical Negligence – £26.2 billion (2023-24: £25.7 billion)
In 2024-25, DHSC reported clinical negligence contingent liabilities of £25.0 billion (2023‑24: £24.6 billion).
DHSC is the actual or potential defendant in a number of claims relating to alleged clinical negligence, as well as liabilities relating to NHS property or third parties. While some costs have been provided for or otherwise charged to the accounts, other cases remain subject to significant uncertainty regarding both liability and the amounts involved. The contingent liability therefore reflects the possible total expenditure on the basis that damages were awarded on all claims, rather than being adjusted for the probability of payments being made. Further information is available in Note 23.
Nuclear Decommissioning – £22.6 billion (2023-24: £17.8 billion)
On 23 June 2021, the Nuclear Decommissioning Authority (NDA), UK Government and EDF Energy entered into new decommissioning arrangements for seven Advanced Gas-cooled Reactor (AGR) stations, under which the UK Government has directed the NDA to take on the future ownership of the stations for decommissioning. The work will be undertaken by the NDA subsidiary Nuclear Restoration Services Ltd.
The NDA will recognise the estimated future decommissioning liability in its financial statements for each of the stations at the point at which it takes ownership. Until then, the NDA recognises a contingent liability for the future decommissioning costs of the stations. These costs have been estimated at £22.6 billion (undiscounted) in EDF Energy’s most recently published financial statements, as the current owner of the stations.
Non-quantifiable Contingent Liabilities
Certain contingent liabilities cannot be quantified due to a high degree of uncertainty. This may arise because:
- there are multiple possible scenarios and permutations, particularly where complex or evolving technology is involved
- the events that might trigger an obligation are varied and uncertain
- in some cases, there is insufficient objective evidence to support a reliable valuation
As a result, these liabilities are disclosed but not measured. This approach supports transparency while acknowledging the inherent uncertainty.
Individually Significant Non-quantifiable Contingent Liabilities are set out below.
Government entities face a range of non-quantifiable contingent liabilities beyond those commonly discussed, such as loan guarantees or standard legal claims. These are non-quantifiable because both the timing and the potential amount of any outflow of resources cannot be estimated with sufficient reliability.
- Legal claims – Several WGA entities have legal, compensation and tribunal claims against them. Given the uncertainty over outcomes and potential settlement values, it is not possible to provide a reliable estimate of the related liabilities.
- Commitments in relation to pension scheme deficits – Some WGA entities have committed to fund pension scheme liabilities where deficits arise. Future funding requirements depend on factors such as investment performance, longevity and salary trends. As a result, these commitments remain non-quantifiable contingent liabilities.
Ministry of Defence
The Ministry of Defence holds a number of contingent liabilities that are assessed as remote and are considered non-quantifiable. These potential obligations typically arise from complex arrangements, often involving advanced and evolving technologies, where any liability would depend on multiple unlikely scenarios and permutations. The extent of uncertainty over whether, how and when such events might occur means it is not feasible to produce reliable estimates of their potential financial impact. In many cases, there is also insufficient objective evidence to support a robust valuation. As a result, these liabilities cannot be measured with sufficient reliability for quantification.
The Department keeps these remote and non-quantified liabilities under regular review, and will reassess them if circumstances change or new evidence emerges that would support quantification.
This category includes a range of indemnities, including those associated with the Strategic Weapons System Activities Future Delivery Project and an overall cap on contractor liability under the future submarine design phase contract with Devonport Royal Dockyard Limited. The Department also retains residual employee disease liabilities and residual public liabilities arising from the disbanding of DERA, as well as indemnities granted to Serco under the Continuous Provision of Marine Services contract.
Further indemnities cover environmental losses incurred by QinetiQ in respect of certain defined materials at specified properties prior to its formation on 1 July 2001, and an indemnity relating to the disposal of Gruinard Island in the event of claims linked to outbreaks of specific strains of anthrax on the island.
The Ministry of Defence has also provided indemnities to several companies—including Rolls-Royce, BAE Systems and Babcock Group—in relation to the handling of fissile materials, nuclear risks and risks under the Nuclear Installations Act 1965. These exposures, together with an indemnity issued to Rolls-Royce Submarines for the non-insurance of the Rolls-Royce Core Manufacturing Facility and the Neptune Test Reactor facility in respect of death or personal injury to third parties, are regarded as non-quantifiable.
In addition, there are potential liabilities arising from the use of standard Private Finance Initiative (PFI) terms and conditions. These relate to a wide range of possible events, such as qualifying changes in law, environmental damage, latent defects and uninsurable events. Given the breadth, variability and inherent uncertainty of these risks, it is not possible to estimate their financial impact reliably, and they are therefore disclosed as non-quantifiable contingent liabilities.
Department of Health and Social Care (DHSC)
DHSC holds several non-quantifiable contingent liabilities due to the complexity and uncertainty surrounding potential obligations.
DHSC assumes professional indemnity risks for the Human Tissue Authority and for clinical trials conducted by NHS Blood and Transplant, covering associated legal costs and damages. It has also issued indemnities to members of advisory committees focused on carcinogenicity, mutagenesis, radiation, air pollution and radioactive substances.
DHSC also faces potential litigation costs arising from actions taken by the Medicines and Healthcare products Regulatory Agency (MHRA). In addition, the Department holds an exemption certificate for the National Institute of Biological Standards and Control (NIBSC) under the Employers’ Liability (Compulsory Insurance) Act 1969.
Furthermore, DHSC is responsible for compensation payments arising from injury claims linked to voluntary donor immunisation using specialised immunoglobulin. It also has potential liabilities related to Employment Tribunal cases, redundancy payments and commercial contract obligations, including indemnities issued as part of the COVID-19 response.
Department for Work and Pensions (DWP)
Benefit Provisions and Underpayments
Benefit provisions and underpayments arise from ongoing legal cases against DWP or are identified through internal processes, such as Legal Entitlements and Administrative Practice (LEAP) exercises. These provisions are estimated using analytical data based on sampling, provided by DWP analysts. Estimates are regularly reviewed and updated to reflect the latest available information. DWP does not recognise benefit provisions or underpayments below a specified de minimis threshold.
Benefit Underpayments
In addition to legal cases, DWP recognises that administrative mistakes (official errors) can occasionally result in benefit underpayments. When such errors are identified, DWP pays any arrears in full as soon as practicable.
Through its annual review of fraud and error statistics, DWP estimates the incidence of official error for the current year and for previous years, drawing on similar exercises. As these estimates are based on statistical sampling, DWP does not hold a complete case-by-case record of all underpaid benefits that could be corrected. Furthermore, data limitations mean it is not possible to determine the total historic liability. Therefore, a contingent liability exists in respect of underpayments that have not yet been identified and corrected.
The measures presented in the Incorrect Payments notes provide an estimate of underpayments made in the reporting year. However, DWP currently has no mechanism to determine the value of historic official errors that were corrected during the year, and therefore cannot fully quantify the outstanding liability. DWP is reviewing its processes and data sources with a view to improving future liability estimates.
Legal Cases
Ongoing legal cases, including judicial reviews and appeals, may give rise to potential obligations for DWP. These cases involve legal challenges to the policies underpinning existing legislation, with any resulting obligations dependent on the outcome of court decisions.
At early stages, such legal challenges often raise multiple issues that require judicial determination. Until further rulings are made, it may not be possible to provide a reliable estimate of the potential obligation. Nonetheless, DWP undertakes analytical assessments to inform a range of estimates under different possible outcomes.
Quantifiable Contingent Assets under IAS 37
Under IAS 37 Provisions, Contingent Liabilities and Contingent Assets, a contingent asset is a possible asset that arises from past events and whose existence will be confirmed only by the occurrence or non-occurrence of uncertain future events that are not wholly within the entity’s control.
A quantifiable contingent asset is one for which a reliable estimate can be made of the potential inflow of economic benefits. However, in accordance with IAS 37, contingent assets are not recognised in the financial statements until receipt of the related income is virtually certain.
Where an inflow of economic benefits is probable (i.e. more likely than not) and can be measured reliably, the entity must disclose, in the notes to the accounts, the nature of the contingent asset and, where practicable, an estimate of its financial effect.
There were no contingent assets individually material to WGA.
There was no impact on this note arising from missing data in either 2024-25 or 2023-24.
31. Remote Contingent Liabilities Reported to Parliament
In addition to the contingent liabilities reported in Note 30, government departments additionally disclose contingent liabilities where the risk of the liability crystallising is remote. These remote contingent liabilities are not required to be disclosed under accounting standards but are reported here on the basis that guarantees, indemnities and letters of comfort are a source of financial risk.
Quantifiable Remote Contingent Liabilities
The potential costs of the government’s quantifiable remote contingent liabilities are as follows:
| 1 April 2024 | Increase/ (decrease) in year | Liabilities crystallised in year | Obligations expired in year | At 31 March 2025 | |
|---|---|---|---|---|---|
| £bn | £bn | £bn | £bn | £bn | |
| Pension Protection Fund (PPF) remote contingent liabilities | 5.0 | 12.5 | (0.1) | (1.3) | 16.1 |
| Guarantees (excluding European Investment Bank) | 29.0 | 3.5 | – | (0.2) | 32.3 |
| Indemnities* | 31.1 | 4.5 | – | (3.0) | 32.6 |
| Letters of comfort | 34.8 | - | – | (4.5) | 30.3 |
| EIB Guarantees | 31.6 | – | – | (0.5) | 31.1 |
| Total | 131.5 | 20.5 | (0.1) | (9.5) | 142.4 |
The increase of £10.9 billion in this note’s total is primarily driven by an increase in year of £12.4 bn for the Pension Protection Fund remote contingent liabilities, and a change in guarantee obligations expired in year from -£16.1 billion in 2023-24 (attributed to the HM Treasury) to -£0.2 billion in 2024-25. Please see further details on the government’s remote contingent liabilities in the sections below.
There is no impact to this note of entities which made submissions to the WGA in only one but not both 2024-25 and 2023-24 financial years.
Individually significant remote contingent liabilities are detailed below:
Non-quantifiable Remote Contingent Liabilities
Remote contingent liabilities can also be unquantifiable. The most significant liabilities are detailed below:
EU Withdrawal Agreement
The United Kingdom officially exited the European Union on January 31, 2020. HM Treasury continues to manage the financial settlement as outlined in the Withdrawal Agreement. This settlement addresses the financial obligations between the UK and the EU, stemming from the UK’s participation in the EU budget and other commitments from its former membership.
HM Treasury has disclosed quantifiable contingent liabilities related to the European Investment Bank (EIB). This is valued at £31.1bn at 31 March 2025 (2023-24: £31.6bn). Additionally, it has noted an unquantifiable remote contingent liability for any other potential liabilities that may arise from the implementation of the Withdrawal Agreement.
Environmental Clean-up – Oil and Gas Industry
The government has established agreements with oil and gas companies to ensure the availability of tax relief for decommissioning activities. Under the terms of participating in a licence within the UK or UK Continental Shelf, companies are legally required to properly decommission their operations once oil and gas production ends.
These agreements, known as Deeds, have been signed by the government and eligible companies, providing greater certainty regarding decommissioning tax relief. This supports the government’s goal of maximizing the economic production of oil and gas reserves in the UK Continental Shelf. The Deeds are designed to release capital that companies would otherwise reserve against potential changes in tax regulations.
As of March 31, 2025, 109 Deeds were in effect (2023-24: 108). These Deeds indemnify companies against changes in tax legislation or the default of joint-venture partners concerning their decommissioning activities. HM Treasury has not disclosed the potential financial value of these Deeds, as it is unquantifiable due to the lack of comparable data for calculation.
Environmental Clean-up – Nuclear
The Department for Energy Security and Net Zero (DESNZ) has the following remote contingent liabilities in place in relation to potential nuclear related environmental clean-up costs.
The Nuclear Liabilities Fund was established in 1996 to meet certain costs of decommissioning eight nuclear power plants in the UK that have been owned and operated by EDF Energy Nuclear Generation Limited since 2009. A constructive obligation was created in 2002 when the government undertook to underwrite the Fund in respect of these liabilities to the extent that the assets of the Fund might fall short; any surplus generated by the Fund would be paid over to the government once the liabilities have been met. The total undiscounted estimated liability as at 31 March 2025 of £27.2 billion (2023-24: £26.7 billion) has a present value of £13.6 billion (2023‑24: £13.5 billion) which includes an allowance for future inflation. The value of the Fund as at 31 March 2025 is £20.5 billion (2023-24: £20.7 billion). It is not possible to quantify the extent to which the government may be obliged to contribute to the Fund, nor of any surplus that may arise, given the high level of uncertainty relating to estimation of decommissioning costs and investment returns on Fund assets over a future period exceeding 100 years.
A contingent liability exists in relation to the costs of retrieving and disposing of sealed radioactive sources under the Environmental Permitting (England and Wales) Regulations 2016 in the event that a company keeping such sources becomes insolvent.
A contingent liability arises in relation to the remediation of land contaminated by a nuclear occurrence as it is deemed appropriate for DESNZ to bear responsibility under section 9 of the Radioactive Contaminated Land (Modification of Enactments) (England) (Amendment) Regulations 2007 SI 2007/3245.
Other Nuclear
The Department for Energy Security and Net Zero has provided indemnities to the UK Atomic Energy Authority to cover indemnities given to carriers and British Nuclear Fuels plc against certain claims for damage caused by nuclear material during transportation. Additionally, DESNZ holds statutory liability under the Nuclear Installations Act 1965 (as amended by the Nuclear Installations (Liability for Damage) Order 2016) for third-party claims exceeding the operator’s liability in the event of a nuclear accident in the UK. DESNZ also has a contingent liability for potential claims arising from exposure to ionising radiation due to the fusion activities of the UK Atomic Energy Authority. Furthermore, DESNZ offers protections in specific scenarios where the Hinkley Point C nuclear plant is shut down due to political reasons or certain changes in law and insurance contracts.
Contingent Liabilities for Reinsurance Arising from Acts of Terrorism
Pool Re and Pool Re (Nuclear) are mutual reinsurance companies providing terrorism cover for damage to industrial and commercial property or nuclear facilities and consequential business interruption in Great Britain who pay a portion of their income to HM Treasury. In the event of losses exceeding their available resources, HM Treasury would extend them a repayable loan.
The total reserves of Pool Re and of Pool Re (Nuclear) as at the date of their latest management accounts are £6.7 billion as at March 2025 (2023-24: £6.5 billion) and £34m as at December 2024 (December 2023: £33m) respectively.
The maximum potential liabilities under this arrangement are deemed unquantifiable due to the lack of historical data for estimation and the unpredictable nature of potential terrorist incidents. It is also considered unlikely that circumstances would necessitate financial assistance from HM Treasury. These arrangements are authorized under the Reinsurance (Acts of Terrorism) Act 1993. For more details on terrorism reinsurance and the retrocession agreement between Pool Re and HM Treasury, please refer to the Pool Re Annual Report and Accounts.
Regional Development Banks and Funds
The Foreign, Commonwealth and Development Office (FCDO) has assumed unquantifiable contingent liabilities to maintain the value of subscriptions paid to the capital stock of regional development banks and funds. However, the FCDO does not anticipate any liabilities arising from these contingent liabilities. The FCDO has remote contingent liabilities disclosed to Parliament of £15.3 billion (2023-24: £15.8 billion) in respect of callable capital on investments in International Financial Institutions (IFIs). These are subject to call only when required and to the extent necessary to meet the obligations of the IFIs on borrowings of funds or guarantees.
Department for Transport
The Department for Transport is part of a North Atlantic Treaty Organisation (NATO) agreement that involves indemnifying civil aircraft used for NATO tasks during crises and wars. Additionally, the department has a statutory responsibility for maintaining all railway structures. This contingent liability applies to legacy structures sold to and controlled by third parties. There have been no claims, and there is no reasonable basis to quantify this risk. There are also unquantifiable more than remote contingent liabilities relating to the potential compensation obligations in the HS1 Concession Agreement.
DfT has quantifiable remote contingent liabilities valued at £5.9 billion (2023-24: £5.9 billion) under the Inter City Express Rolling Stock contracts with Agility Consortium and previously with Network Rail, covering the termination of the contract due to force majeure events and unavailability of commercial insurance. They expire in 2044.
Department for Education
Student Loan Sales: Each sale of student loans requires separate but similar warranties and indemnities to secure investor interest and ensure value for money in securitisation transactions. Each set of obligations is independent, meaning a failure in one sale does not trigger failures in others. Further details can be found in the Department for Education’s accounts.
Schools and Academies: Due to entering directly into a PFI arrangement for building schools (PF2), the Department for Education (DfE) has several contracts with clauses that could potentially create liabilities for the DfE. These are considered remote and unquantifiable as they relate to breaches of contractual conditions. Additionally, the DfE has contracts for academy and free school site purchases, including several overage clauses, which are also considered remote and unquantifiable due to potential breaches or changes in contractual conditions.
DfE reported one remote contingent liability to Parliament in November 2024 to provide a Local Government Pension Scheme guarantee to Further Education providers operating in the statutory sector.
The Department for Education Further Education Local Government Pension Scheme (LGPS) Guarantee is a government commitment to fund pension deficits in the event of a closure and where the provider’s reserves are insufficient to fund their own LGPS deficit upon closure.
National Health Service
The Department of Health and Social Care (DHSC) has entered into several unquantifiable or unlimited contingent liabilities with various health bodies and private companies. As of 31 March 2025, entities within the DHSC group reported a number of unquantifiable indemnities. However, none of these qualify as contingent liabilities under IAS 37, as the likelihood of an economic benefit transfer in settlement is considered too remote. Further details can be found in the DHSC accounts.
UK Space Agency
The UK Space Agency has an unquantifiable contingent liability arising from an international United Nations convention, which mandates that the UK government is ultimately liable for third-party costs resulting from accidental damage caused by UK space activities.
Ministry of Defence
Under contract terms, the Ministry of Defence (MOD) may indemnify or limit a contractor’s liability in specific areas, including damage to government property, damage to issued property, default, deferment, termination, and indirect and consequential losses. Some of these liabilities are unquantifiable. Unquantified remote contingent liabilities can be categorised under Contract Terms, Environmental, Nuclear and Private Finance Initiative (PFI).
Indemnities have been provided to several companies for handling fissile materials, nuclear risks, and risks under the Nuclear Installations Act 1965. An unquantifiable indemnity has also been issued to Rolls-Royce Submarines for the non-insurance of the Rolls-Royce Core Manufacturing Facility and the Neptune Test Reactor facility, covering death and personal injury to third parties.
The MOD has other liabilities, details of which are not disclosed due to commercial and/or national security reasons. Some of these liabilities are unquantifiable. Quantified remote contingent liabilities and financial guarantees not disclosed due to sensitive nature at March 2025 are valued at £1.4 billion (2023-24: £1 billion).
UK Coins in Circulation
The Consolidated Fund has one contingent liability, relating to UK coins in circulation that falls outside the scope of IAS 37 as the possibility of an outflow of resources is remote. As at 31 March 2025 the estimated total face value of coins in circulation was £4.5 billion (2023-24 £4.6 billion).
Legal Claims
Non-quantifiable remote contingent liabilities have arisen from legal claims, compensation claims, and tribunal cases made against various WGA entities, for which no reliable estimate of liability could be made.
32. Related Party Transactions
Related parties in the context of Whole of Government Accounts, as per the FReM, are any public sector entities that are not consolidated into the 2024-25 WGA. Further information regarding non-consolidated entities can be found in Annex 2 (section 2) and Annex 3 to the account.
Missing data: Following on from the 2023-24 financial year 145 bodies did not submit their financial data for consolidation in time for WGA 2024-25, of which 128 were local authorities (see Notes 1 and 2 for details). As these bodies are part of the public sector but not consolidated into WGA, they are considered to be related parties. They had transactions and balances with consolidated entities which are material in aggregate.
The most significant related party balance is between the missing local government entities who did not submit data to the WGA and the Public Works Loan Board (PWLB). As entities which do not submit DCTs are treated as external to WGA, the related assets held by PWLB are not eliminated and therefore remain in the reported WGA totals. The 2024-25 PWLB receivables totalled £26.9 billion as at 31 March 2025, with the largest balance of £2.1 billion relating to Woking Borough Council.
Aside from the PWLB, other bodies consolidated into WGA reported assets totalling £3.0 billion and liabilities totalling £2.9 billion where the counterparty did not submit data and is a related party of WGA. WGA also recognises expenditure of £31.5 billion relating to public sector bodies which did not submit data. £28.5 billion of this expenditure consisted of grants to local government entities. The largest contributors being the Scottish Government (£8.0 billion) and the Department for Education (£7.0 billion).
The English further education (FE) sector (including FE colleges and sixth form colleges) was reclassified to the public sector by the Office for National Statistics in late 2022, with effect backdated to the start of the relevant financial year. These bodies are not currently consolidated into the Whole of Government Accounts (WGA), primarily for practical and data reasons, but may be included in a future WGA. We do not currently have sufficient data to quantify the impact of their exclusion from WGA, although it could be material.
Local government entities consolidated into WGA had transactions with municipal ports, airports, and parish councils, primarily through the provision of funding. They also had transactions with local government pension schemes and record their share of the schemes’ assets and liabilities in their accounts.
Fourteen train operating companies (12 English and 2 Scottish) were reclassified by the ONS from central government to public corporations in response to the impact of Covid-19 on public transport. The Department for Transport (DfT) and Scottish Government implemented Emergency Measures Agreements (EMAs), now Emergency Recovery Measure Agreements (ERMAs). This implementation passed substantially all cost and revenue risk from the train companies to DfT and Scottish Government who obtained control for accounting purposes, but without legal control. These companies remain privately-owned but are considered to be controlled through contracts with DfT and Scottish Government.
DfT Operator Limited (DFTO) was set up by DfT to act as the immediate parent to publicly owned companies in the rail sector. Its active subsidiaries during the year are LNER Limited, Northern Trains Limited, SE Trains Limited and TransPennine Trains Limited.
The four state-owned rail companies operate the following contracts under services agreements:
| Company name | Operating contract |
|---|---|
| LNER Limited | East Coast Mainline |
| Northern Trains Limited | Northern |
| SE Trains Limited | South Eastern |
| TransPennine Trains Limited | TransPennine Express Railways |
| Contract type with DfT in 2022-23 | Expenditure for 2024-25 | Expenditure for 2023-24 |
|---|---|---|
| (£bn) | (£bn) | |
| EMA and ERMA | 1.0 | 1.2 |
| State-owned | 1.4 | 1.2 |
| Total | 2.4 | 2.4 |
Train Operating Companies are included within the boundary qualification for 2024-25, reflecting limitations in the available financial information used for consolidation. Please see further detail in the Governance Statement.
33. Events after The Reporting period
Reduction of The Bank of England Asset Purchase Facility
On 13 May 2025 the Chancellor and the Governor of the Bank of England agreed to further reduce the authorised maximum size of the BEAPFF from £654.5 billion to £619.7 billion, entirely composed of government gilts. The reduction reflects the continuing reduction in assets supported by the BEAPFF as part of the Bank’s continuing programme to unwind the BEAPFF.
Disposal of NatWest
On 30 May 2025 HM Treasury announced the exit of its remaining shareholding in NatWest Group. HM Treasury has continued to operate the trading plan through April and May 2025, generating a further £1.4 billion of sales and reducing the government’s shareholding to zero.
Extraordinary Revenue Acceleration Payments
On 14 April 2025 HM Treasury made a £753 million tranche payment to Ukraine under the Extraordinary Revenue Acceleration scheme.
Vaccine Alliance Payment
In June 2025, the Government announced an investment package worth £1.25 billion over five years, from 2026 to 2030, in support of Gavi, the Vaccine Alliance. This will support the immunisation of 62.5 million children, saving around 1.25 million lives.
Infrastructure and Projects Authority
In a Prime Ministerial statement on 17 January 2025, it was announced that the National Infrastructure and Service Transformation Authority (NISTA) will be a joint unit of HM Treasury and the Cabinet Office. This change will bring infrastructure strategy and delivery together to address systemic challenges to growth, and combine the expertise and functions of the Infrastructure and Projects Authority and the National Infrastructure Commission.
To support this, responsibility for all of the Infrastructure and Project Authority’s functions and responsibilities, including the government’s project delivery expertise and functions, and assurance reviews for the government’s largest projects, will move from the Cabinet Office to HM Treasury.
Ethics and Integrity Commission Announced
In a written ministerial statement on 21 July 2025, it was announced that the government will establish an Ethics and Integrity Commission to strengthen probity in public life, delivering on a key manifesto commitment. Our new commission will sit at the heart of our standards system. It will:
- promote the Seven Principles of Public Life
- support public bodies developing codes of conduct
- enable the sharing of best practice across the public sector
- report to government on specific areas in need of improvement
Health and Social Care system Reform
On 3 July 2025, the 10 Year Health Plan for England announced that the Health Services Safety Investigations Body’s functions will be transferred to the Care Quality Commission as part of a wider effort to simplify the regulatory landscape.
PPE Medpro High Court Order for Repayment to Government
In October 2025 the High Court ordered PPE Medpro to repay £122 million to the government for supplying faulty, non-sterile surgical gowns during the Covid pandemic.
Legal Aid Agency (LAA) Cyber Attack
On 23 April 2025, LAA became aware of a cyber attack on its online digital services, through which legal aid providers log their work and make claims for payment. On discovery of the attack, external experts were appointed to carry out an investigation into the incident. Evidence of data exfiltration activities was identified, but no evidence of data modification activities was found. LAA has carried out extensive work to assure itself that the data underlying its financial statements is unaffected by the incident.
Rail Companies or Operations Brought into Public Control or Ownership
On 1 April 2025 the shareholding in LCR Ltd was transferred from the Secretary of State to Network Rail Infrastructure Ltd at its carrying value, as a capital grant in kind. On 25 May 2025 South Western Railway transferred to public ownership and is being managed by DFTO. On July 2025 Trenitalia c2c Limited transferred to public ownership and is being managed by DFTO.
Cancellation of Road Projects
Following the June 2025 Spending Review, the government took the decision to cancel two of National Highways’ planned schemes: the A12 to A120 widening scheme and the A47 Wansford to Sutton dualling scheme. National Highways expects to recognise a write-off of approximately £250 million in the 2025-26 financial statements in relation to capital costs incurred on these schemes up to the end of 2024-25.
Middle East
Since 31st March 2025, geopolitical tensions in the Middle East, including developments involving Iran, have escalated. These are considered non adjusting events under IAS 10 for 2024-25, as they relate to conditions arising after the reporting period, and no adjustments have been made to the financial statements. The situation has increased global economic uncertainty, and any financial impacts will be reflected in future reporting periods as appropriate.
34. Gold Holdings
| 2024-25 | 2023-24 | |
|---|---|---|
| £bn | £bn | |
| Opening balance | 17.5 | 16.0 |
| Additions | – | – |
| Impairments | – | – |
| Revaluations | 6.6 | 1.5 |
| Disposals | – | – |
| Total gold | 24.1 | 17.5 |
The Exchange Equalisation Account (EEA) is an account that holds the UK’s reserves of gold, foreign currencies and IMF Special Drawing Rights. During the 2024-25 financial year, the price of gold rose from £1,754 to £2,419 per ounce, a 38% increase. This has in turn given rise to a £6.6 billion revaluation increase, raising the value of total gold holdings to £24.1 billion.
There is no impact on the note total from entities which made data submissions in 2023‑24, but which did not make a submission to the WGA this year, and also no impact from entities which submitted this year but not in 2023-24.
35. Date Authorised for Issue
The financial statements were authorised for issue on the date of the Comptroller and Auditor General’s report.
7. Certificate and Report of the Comptroller and Auditor General to The House of Commons
7.1 Disclaimer of opinion on financial statements
I was appointed to audit the financial statements of the Whole of Government Accounts (WGA) for the year ended 31 March 2025 in accordance with the Government Resources and Accounts Act 2000.
The financial statements comprise the consolidated:
- Statement of Financial Position as at 31 March 2025;
- Statement of Revenue and Expenditure, Statement of Comprehensive Income and Expenditure, Statement of Cash Flows and Statement of Changes in Taxpayers’ Equity for the year then ended; and
- the related notes, including the significant accounting policies.
The financial reporting framework that has been applied in the preparation of the financial statements is applicable law and UK adopted international accounting standards.
I do not express an opinion on the financial statements of the WGA. Because of the significance of the matters described in the basis for Disclaimer of Opinions section of my certificate, I have not been able to obtain sufficient appropriate audit evidence to provide a basis for an audit opinion on these financial statements.
Basis for disclaimer of opinion
I have been unable to obtain sufficient appropriate audit evidence in respect of material transactions and balances within the WGA owing to the following:
HM Treasury has included within the WGA draft accounts data for 338 entities (280 entities in 2023-24). Due to the number of entities consolidated based upon unaudited data, the level of outstanding work from component auditors and the unconfirmed impact of uncorrected misstatements within this unaudited data, I am unable to determine whether the financial information provided by these entities is free from material misstatement to the WGA. The majority of unaudited entities are English local government bodies.
HM Treasury have not consolidated 145 entities which they identified should have been consolidated but which did not submit data in 2024-25. There is an improved level of non-submission this year to the previous (201 entities in 2023‑24) however the estimated impact of entities which did not submit data is becoming increasingly unreliable as the number of years since their last submission increases. Based on information available to us from the latest submissions from these entities, I expect that this will be material to the WGA, but in the absence of submissions it is not possible to reach a conclusion on the non-consolidation of information from these entities. The majority of missing entities are English local government bodies.
The absence of consolidation data and completed component audits has meant that I was unable to obtain sufficient appropriate audit evidence that the financial statements are free from material misstatement. It was not practicable to obtain audit evidence from alternative sources.
Other matters which would have led to a modification to my opinion had it not been disclaimed
As per ISA (UK) 705 I am required to report any other matters of which I am aware that would have required a modification to the opinion, and the effects thereof. In my opinion, based on the work undertaken in the course of the audit, the following matters would have been raised:
- the definition and application of the accounting boundary: HM Treasury’s accounting policy regarding the basis of consolidation has not been applied consistently in the WGA. Significant bodies, including the English Further Education Institutions and Train Operating Companies and associated balances, have not been included in the accounts, even though they are classified by the Office for National Statistics as being in the public sector. I consider that these bodies should be included in the accounts in line with applicable accounting standards.
- the inconsistent application of accounting policies: The financial reporting framework that the WGA must follow is set out in the Government Financial Reporting Manual which applies UK adopted International Accounting Standards (IAS), as adapted for the public sector context. However, a number of bodies consolidated in the WGA do not adopt the same framework. Accounting standards require that where the effect of such inconsistent accounting policies is material, adjustments should be made upon consolidation. HM Treasury has not provided a full analysis of these differences and has not been able to quantify fully the impact of the different accounting frameworks or accounting policies on the WGA, but that impact is known to be material. The most significant example is infrastructure assets held by local authorities.
- the consolidation of components with non-coterminous year ends: International Financial Reporting Standard 10 ‘Consolidated financial statements’ (IFRS 10) presumes that, in order to present a true and fair view, the accounting reference date for component bodies consolidated into group accounts should be no more than three months different from the date of the group accounts. HM Treasury has not complied with the requirements of IFRS 10 in consolidating the Academy Schools in 2024-25 or for the 2023-24 comparatives and has not been able to sufficiently demonstrate that the impact of the non-coterminous year end is immaterial.
Matters on which I report by exception
In respect solely of the matters referred to in the Basis for Disclaimer of Opinions section above:
- Returns adequate for my audit have not been received; and
- I have not received all of the information and explanations I require for my audit;
I have nothing to report in respect of the following matters which I report to you if, in my opinion:
- the financial statements are not in agreement with the accounting records and returns; and
- the Governance Statement does not reflect compliance with HM Treasury’s guidance.
Responsibilities of the Accounting Officer for the financial statements
As explained more fully in the Statement of Accounting Officer’s Responsibilities, the Accounting Officer is responsible for:
- maintaining proper accounting records;
- providing the C&AG with access to all information of which management is aware that is relevant to the preparation of the financial statements such as records, documentation and other matters;
- providing the C&AG with additional information and explanations needed for his audit;
- providing the C&AG with unrestricted access to persons within the WGA from whom the auditor determines it necessary to obtain audit evidence;
- ensuring such internal controls are in place as deemed necessary to enable the preparation of financial statements to be free from material misstatement, whether due to fraud or error;
- preparing financial statements which give a true and fair view, in accordance with HM Treasury directions issued under the Government Resources and Accounts Act 2000;
- preparing the annual report in accordance with HM Treasury directions issued under the Government Resources and Accounts Act 2000; and
- assessing the WGA’s ability to continue as a going concern, disclosing, as applicable, matters related to going concern and using the going concern basis of accounting unless the Accounting Officer anticipates that the services provided by the WGA will not continue to be provided in the future.
Auditor’s responsibilities for the audit of the financial statements
I was appointed to audit, certify and report on the financial statements in accordance with the Government Resources and Accounts Act 2000.
I conducted my audit in accordance with International Standards on Auditing (UK), applicable law and Practice Note 10: Audit of Financial Statements and Regularity of Public Sector Entities in the United Kingdom (2022). However, because of the matters described in the Basis of Disclaimer of Opinion section of my certificate, I was not able to obtain sufficient appropriate audit evidence to provide a basis for an opinion on these financial statements.
Those standards require me and my staff to comply with the Financial Reporting Council’s Revised Ethical Standard 2024. I am independent of HM Treasury, the preparer of WGA, in accordance with the ethical requirements that are relevant to my audit of the financial statements in the UK. In applying the Ethical Standards, I have considered the potential implications for my audit arising from the extension of a loan staff arrangement with the Office for Value for Money within HM Treasury, to November 2025. The loan staff arrangement concerned one of my directors (unconnected with our audit of the Whole of Government Accounts prepared by HM Treasury) and was for an initial period of 12 months from September 2024. The arrangement was extended by a further two months so that the secondee was able to support the completion of the Office for Value for Money’s work. I am satisfied that appropriate safeguards have been implemented to protect my and the NAO team’s independence and objectivity throughout the audit. My staff and I have fulfilled our other ethical responsibilities in accordance with these requirements.
Gareth Davies
Comptroller and Auditor General
12 June 2026
National Audit Office
157-197 Buckingham Palace Road Victoria
London
SW1W 9SP
7.2 Report of the Comptroller and Auditor General to the House of Commons
Introduction
In this report I set out my findings from my audit of the Whole of Government Accounts (WGA) 2024-25 Annual Report and Accounts and explain why I have disclaimed my opinion on the financial statements.
The WGA is prepared under the Government Resources and Accounts Act 2000. The financial reporting framework that has been applied is applicable law and UK adopted international accounting standards.
As set out in my certificate, I have been appointed to provide an opinion on whether the state of the Whole of Government’s affairs as at 31 March 2025 and its net expenditure for 2024-25 give a true and fair view and have been properly prepared in accordance with the Government Resources and Accounts Act 2000 and HM Treasury directions issued thereunder.
During my audit, I have not been able to obtain sufficient, appropriate evidence upon which to form an opinion. It is possible that the impact of undetected misstatements is both material and pervasive to the financial statements. Accordingly, I have disclaimed my ‘true and fair’ opinion on the financial statements.
Missing and unaudited data submissions
In 2022-23 I disclaimed my WGA opinion for the first time, because of the level of both missing data and unaudited data, primarily relating to English local authorities.
Although progress is being made in the number of entities submitting accounts to the WGA, there is still a significant number of entities who have not submitted a return. In 2022-23, 211 out of 676 (31%) entities did not submit data for the WGA, 187 of which were English local authorities. In 2023-24, 201 out of 657 (31%) entities did not submit data for the WGA, 167 of which were English local authorities. For 2024-25, this has reduced to 145 out of 662 (22%) entities, 107 of which were English local authorities.
HM Treasury estimates that the impact of this missing data on the 2024-25 accounts is that net liabilities are overstated by £59.2bn (£50.6bn in 2023-24) and net expenditure is understated by £14.8bn (£37.7bn in 2023-24).
Although there has been improvement in the number of entities not consolidated in 2024-25 the reliability of the estimated impact has diminished. HM Treasury uses a component’s last submission to calculate the impact of their omission and consequently, as some components are now persistently missing, the use of their last submitted data as a proxy for their missing data is becoming progressively less precise. In light of inflationary pressures these estimates are also likely to understate the true position. In 2024-25 HM Treasury reports that 55 entities have not submitted a return in any year from 2020-21 to 2024-25.
As such I have assessed that the impact of missing data is both material and pervasive to the 2024-25 financial statements.
Whilst progress is being made in the number of components who are submitting returns to the WGA, there is an increasing number of entities basing their submissions on unaudited data.
In 2022-23, 227 out of 676 (34%) entities were consolidated using draft (unaudited) accounts,196 of which were English local authorities. In 2023-24, 280 out of 657 (43%) entities were consolidated using data from draft (unaudited) accounts, 224 of which were English local authorities. In 2024-25, the number of entities submitting data that was unaudited at the time of WGA consolidation increased to 338 out of 662 (51%).
HM Treasury estimates that the figures based on unaudited information for 2024-25 represent £668.8bn of total assets (£482.3bn in 2023-24), £687.6bn of total liabilities (£613.6bn in 202324), £207.7bn of total income (£140.5bn in 2023-24) and £284.4bn of total expenditure (£213.7bn in 2023-24).
As such I have assessed the impact of unaudited data as being both material and pervasive to the 2024-25 financial statements.
Summarising the English Local Authority position, of the 408 English Local Authorities that should have submitted audited data to the WGA, 107 (26%) did not submit data and are therefore missing from the accounts, 280 (69%) submitted data that was unaudited. Only 21 (5%) of English Local Authorities are therefore included in the 2024-25 WGA based on audited data.
Since July 2024, the Government has implemented a programme of legislative and structural reforms to address the backlog in local authority audits. This included the introduction of statutory “backstop” dates setting statutory deadlines by which Local Authorities must publish their audited financial statements. The backstop date for the publication of 2024-25 financial statements was 27 February 2026. Of the 280 English Local Authorities that submitted unaudited data for the 2024-25 WGA when HM Treasury commenced their consolidation process, 127 went on to later receive disclaimed opinions from their auditors.
In addition to announcing backstop dates, the government published its Local Audit Reform Strategy on 18 December 2024 and made further commitments in April 2025. These reforms have since been reinforced through the English Devolution and Community Empowerment Act, which received Royal Assent on 29 April 2026 and provides for the establishment of a new Local Audit Office, intended to deliver system leadership and support the rebuilding of audit capacity and assurance.
While these measures are expected to support the restoration of a sustainable audit framework over time, the scale of existing issues means that rebuilding sufficient assurance across the system will likely take a number of audit cycles. This may make it necessary for me to continue to disclaim or qualify my opinion on the WGA until adequate levels of audit assurance become available from a restored local audit system.
While unaudited and disclaimed data continues to be most prevalent within English local authorities, 2024-25 saw an increase in the consolidation of unaudited data across all three sectors: local government, central government and public corporations. Notably, the Welsh Government was consolidated on the basis of unaudited data, and the Department for the Economy- Northern Ireland was consolidated based on accounts that received a disclaimed audit opinion which meant they were both classified as unaudited within WGA. Both entities ultimately received modified opinions on their underlying statutory accounts in relation to the valuation of student loan assets, the aggregate value of which is material to the 2024-25 WGA. This demonstrates that issues within unaudited components may give rise to audit qualifications in the WGA if they are not resolved in line with audit timeliness and the submission of audited accounts in future.
Progress in addressing prior year qualifications
As per ISA (UK) 705 I am required to report any other matters of which I am aware that would have required a modification to the opinion. Based on the work undertaken in the course of my audit, the following matters would have been raised as a qualification had my opinion not already been disclaimed on the issues outlined above.
Historically I have qualified my opinion on the WGA accounting boundary and in 2024-25 I would have continued to raise the accounting boundary as a qualification issue had my opinion not been disclaimed.
In 2023-24 I would have raised this qualification on the basis of the non-inclusion of English Further Education Institutions. In 2024-25 the omission of these Institutions has an estimated impact of a £14.2bn (2023-24: £14.3bn) understatement of gross assets and a £1.8bn (202324: £2.0bn) understatement of gross liabilities. In 2024-25 I would therefore have continued to qualify my opinion.
In 2024-25 I would have further added Train Operating Companies (TOCs) to this qualification. The underlying values of TOCs are either not consolidated into WGA or consolidated based on their reporting of lease liabilities, right-of-use assets, and pension assets and liabilities to the remaining duration of their franchise agreement rather than at their full value. Whilst it is appropriate for the TOCs to restrict the recognition of assets and liabilities to reflect the remaining period of the service agreement, since the passing of the Passenger Railway Services (Public Ownership) Act in November 2024, I do not consider that it is appropriate to do so within the WGA. I am unable to calculate the full impact of these omissions from the WGA however it is highly likely that the full extent of these assets and liabilities is material.
In 2023-24 I would have continued to qualify my opinion on the WGA due to inconsistent accounting policies on the basis of the valuation of local government infrastructure assets, valuation of non-privatised water infrastructure in Scotland and IFRS 16 implementation. In 2024-25 I would have continued to raise this qualification. However, as local government adopted IFRS 16 in 2024-25 there is no longer a difference in accounting policies between the two sectors, and consequently this part of my qualification in 2024-25 would have been removed.
Local authorities value infrastructure in accordance with the Code of Practice on Local Authority Accounting which mandates the historical cost method. Central government entities adopt the FReM which requires the valuation of infrastructure assets using depreciated replacement cost methodology. In 2024-25 this inconsistency remains, and HM Treasury has made no adjustment for this difference. I estimate the impact that assets are understated by at least £114.2bn (£112.2bn in 2023-24). However, this estimation is itself likely to be significantly understated as it is based on an estimate from the Office for National Statistics that does not include the value of land associated with the infrastructure.
My qualification would also have continued to include the valuation of non-privatised water infrastructure in Scotland where the component values infrastructure assets on a historic cost basis whereas the WGA values infrastructure assets on a depreciated replacement cost basis. HM Treasury has continued to use regulatory information to adjust the component valuation to depreciated replacement cost in the WGA, but this information is produced with the express caveat that it is not suitable for audit. I can therefore place no reliance on this information.
From 2016-17, to the first year in which a disclaimer of opinion was issued, I have qualified my opinion on the WGA due to the inclusion of significant bodies with non-coterminous year ends and specifically the misalignment relating to the consolidation of the Academies’ Sector Annual Report and Accounts (SARA). In 2024–25, HM Treasury prepared a working paper setting out the rationale that the resulting misstatement is not material. The analysis represented a constructive attempt to address the issue and would have sufficiently justified income being removed from my qualification had I not issued a disclaimer of opinion. However, further work would be needed to remove the qualification for expenditure, assets and liabilities. Accordingly, while progress has been made, I remain unable to confirm that the impact of the misalignment is not material and would have continued to raise this qualification in 2024-25.
In 2023-24 I would have qualified my opinion on WGA due to qualifications in the opening balances of the underlying Department for Health and Social Care (DHSC) accounts. In 202425 DHSC received an unqualified audit opinion, and I did not identify any modifications to the audit opinions of underlying components that are material at a WGA group level. As a result, I would have removed this qualification in 2024-25.
Conclusion
I am disclaiming the Whole of Government Accounts for the third year in succession, due to the level of data missing from the accounts and the level of unaudited data that is included in the accounts. On both counts, I have not been able to obtain sufficient, appropriate evidence upon which to form an opinion. It is possible that the impact of undetected misstatements is both material and pervasive to the financial statements and I am therefore disclaiming my ‘true and fair’ opinion on the financial statements.
Despite disclaiming my opinion, I believe that the WGA is an important and informative document and a useful tool for the management of public finances. It can provide valuable insights to both decision-makers and the public, but to do so it needs to be timely. In 2020 WGA production was significantly delayed by Covid and in response HM Treasury set out a recovery plan. The 2024-25 WGA represents the final year of this plan and is the earliest that the accounts have been published since the 2017-18 WGA published in May 2019. Recent measures to support the building back of assurance in the English Local government sector are also welcome. This work must be progressed with vigour to ensure timely and high-quality financial reporting for every local body, supporting both local accountability and the completeness and accuracy of the WGA.
Gareth Davies
Comptroller and Auditor General
12 June 2026
National Audit Office
157-197 Buckingham Palace Road Victoria
London
SW1W 9SP
8. Annex A Comparison to The National Accounts
8.1 WGA and the National Accounts
WGA provides the most comprehensive view of the public sector balance sheet but is published with a longer lag than is useful for in-year fiscal management. For timely monitoring and forecasting, the government primarily uses ONS National Accounts measures. These are available sooner but have narrower balance sheet coverage.
When assessing the fiscal landscape, the National Accounts offer various statistical measures that provide a supplementary perspective on the government’s financial standing. Public Sector Net Debt (PSND) is a National Accounts measure of the public sector’s gross debt liabilities in selected instruments, less its liquid financial assets (such as bank deposits and official reserves). PSND excluding public sector banks is the main headline indicator used in the UK fiscal framework.
Public Sector Net Financial Liabilities go beyond PSND, encompassing all financial assets like loans, derivatives, and equity investments. The most comprehensive gauge derived from the National Accounts is Public Sector Net Worth, which compares the government’s debt with all its assets. This includes physical assets used for service delivery, such as infrastructure, offices, hospitals, and schools.
Chart 26: Comparison of National Accounts and WGA Measures
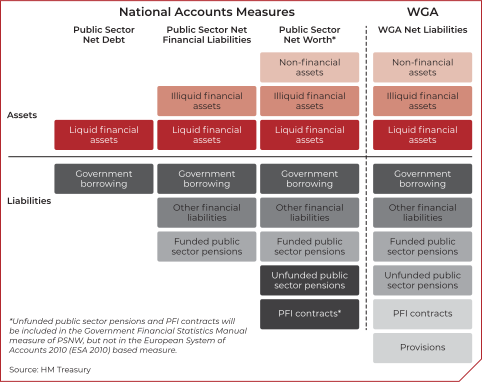
Note – WGA Net Liabilities surpass the scope of Public Sector Net Debt by incorporating non-financial assets, public sector pension liabilities, provisions, and PFI contracts. Additional insights into the distinctions between WGA and National Accounts will be provided later in this annex.
Chart 27: National Accounts (NA) PSND and WGA Net Liabilities
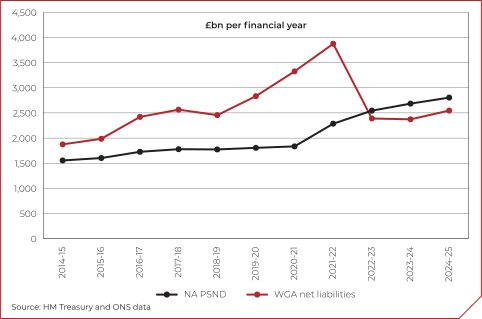
Over the period since the inception of the Whole of Government Accounts (WGA), both National Accounts Public Sector Net Debt (PSND) and WGA net liabilities have often moved in the same direction, reflecting common fiscal and macroeconomic drivers such as borrowing, economic conditions and policy decisions. However, the two measures are not directly comparable and can diverge materially because they are constructed for different purposes and include different items.
A notable divergence occurred in 2016-17 and 2017-18. While PSND continued to follow its established pattern, WGA net liabilities rose sharply, driven largely by increases in public service pension liabilities. These liabilities are long-term obligations and are recognised in WGA but are not included in the National Accounts measure of PSND. This episode illustrates how WGA can capture changes in long-term commitments that do not affect PSND.
In 2018-19, the fiscal position improved, with the National Accounts deficit falling to a low level by recent historical standards. This helped to moderate the pace of increase in PSND, consistent with a period of tighter fiscal policy and more favourable economic conditions.
In the same period, a change in actuarial/discount rate assumptions in WGA assumptions had a significant impact on reported results. Changes in the discount rate applied to long-term provisions and pension liabilities reduced the present value of future obligations, contributing to a marked improvement in the WGA position. This demonstrates how movements in discount rates and other actuarial assumptions can drive substantial changes in WGA outcomes even where underlying cash flows and policy settings have not changed significantly.
Overall, while PSND and WGA net liabilities can show similar broad movements over time, the inclusion in WGA of long-term liabilities (such as pensions and provisions) and the sensitivity of those valuations to discount rates can lead to periods of divergence. These episodes highlight the broader scope of WGA in capturing the government’s total financial position, including both short-term financing and long-term commitments.
Since the late 2000s, both PSND and WGA net liabilities have increased substantially, with particularly sharp rises during and after the COVID-19 pandemic. Although the pace of change has moderated more recently, both measures indicate that pressures on the public finances remain significant and will require sustained long‑term fiscal planning.
PSND reflects current debt levels and is highly sensitive to borrowing and movements in nominal GDP. WGA net liabilities capture a wider range of obligations and assets and are therefore influenced by both fiscal developments and accounting remeasurements. During the pandemic, PSND rose sharply due to higher borrowing, while WGA outcomes reflected both the immediate fiscal response and changes in long-term obligations. In 2022-23, discount rate changes materially reduced the reported value of long-term liabilities in WGA, improving the headline position, though this primarily reflected an accounting remeasurement rather than a fundamental reduction in underlying long-term commitments.
Chart 28: National Accounts (NA) Public Sector Current Budget Deficit and WGA Net Expenditure
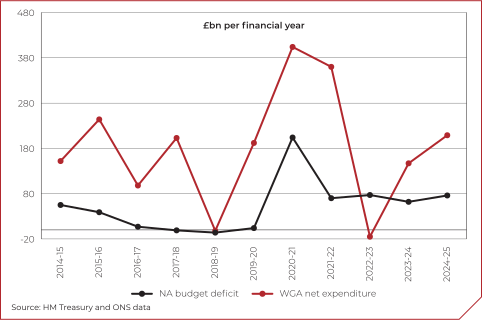
The National Accounts and WGA offer distinct perspectives on the public sector’s finances, leading to differences in reported net expenditure. While the National Accounts current budget deficit has generally declined over the past 13 years, the WGA net expenditure series for the same period has shown greater volatility. This is largely because WGA includes the full cost of changes in longterm liabilities – such as public sector pensions and provisions – which are not reflected in the National Accounts. As a result, WGA figures can fluctuate more significantly year-on-year, reflecting changes in actuarial assumptions, discount rates and other accounting adjustments.
WGA financing costs are sensitive to discount rates used to value long-term liabilities. In several years (including 2015-16, 2017-18 and 2022-23), changes in discount rates materially affected the reported cost of pensions and provisions in WGA, without an equivalent effect on the National Accounts current budget deficit. These movements largely reflect accounting remeasurement rather than changes in underlying cash commitments.
Certain government priorities entail long-term obligations that span decades and require sustained expenditure. While the ultimate cost of these programmes remains uncertain, accounting standards require a single figure to be presented in annual accounts. This is derived from the best estimate of costs, assumptions about technology and other relevant factors, adjusted to reflect the changing value of money over time. The valuation of future cash flows is determined through present value calculations in accordance with accounting standards. The discount rates for provisions, set by HM Treasury and updated annually, have a significant impact on reported liabilities.
Historically, HM Treasury issued real discount rates based on the real yield of UK index‑linked gilts. From 2018‑19 onwards, HM Treasury introduced nominal rates that do not incorporate inflation, replacing real rates. When using nominal rates, cash flows are inflated using inflation assumptions provided by HM Treasury, unless a more appropriate forecast has been identified for specific provisions.
The Public Sector Current Budget Deficit measures the shortfall between government revenues – primarily taxes – and government day-to-day spending, excluding capital investment. In recent years, the deficit has been heavily influenced by the pandemic response and subsequent economic developments. Key factors include:
- Economic contraction and recovery: The sharp fall in GDP in 2020-21, followed by a gradual recovery, reduced government revenues for several years.
- Inflation: From 2022 onwards, higher inflation increased government spending on benefits and subsidies and led to higher interest payments on index-linked debt.
WGA net expenditure covers a much broader scope than the current budget deficit. In addition, today-to-day spending, WGA includes public sector pension liabilities, provisions for future costs (such as nuclear decommissioning) and other longterm obligations. As such, WGA provides a more comprehensive picture of the government’s financial obligations, combining both financial and non-financial assets and liabilities. The most significant drivers of WGA net expenditure in the last five years have included:
- Pension liabilities: A significant and growing component of WGA net expenditure.
- Longterm provisions: Provisions for future costs, including public sector guarantees, energy support schemes and environmental liabilities.
- COVID-19 and post-pandemic recovery: Immediate costs in 2020-21 drove WGA figures higher, while longterm provisions for pandemic-related liabilities and other commitments kept net expenditure elevated.
Pre-pandemic (2018-19), both the Public Sector Current Budget Deficit and WGA net expenditure were at historically low levels, reflecting fiscal consolidation and relatively strong economic performance. During the pandemic years (2020-21), both measures rose sharply, driven by the government’s response to COVID-19 and the associated long‑term financial obligations. In the post-pandemic period (2021-23), the current budget deficit began to narrow as the economy recovered, but inflation, rising interest rates and ongoing support measures kept both the deficit and WGA net expenditure at elevated levels. WGA net expenditure continued to reflect growing pension liabilities and other long-term provisions, even as the most immediate fiscal pressures began to ease.
For 2022-23, changes in the discount rate had important implications for WGA net expenditure. An increase in the discount rate reduced the present value of long-term liabilities, particularly pension obligations and other provisions. This improved the reported position, but it largely reflected an accounting remeasurement rather than a fundamental reduction in the scale of underlying long-term commitments. In the period following 2022-23, PSND remained high, reflecting ongoing borrowing pressures and wider macroeconomic conditions. Over the same period, work to improve WGA transparency, timeliness and reconciliation to the National Accounts strengthened users’ ability to understand how the two frameworks relate, and why they can move differently from year to year.
In 2024-25, the relationship between PSND and WGA net liabilities continued to reflect their different purposes and coverage. PSND remained a debt-focused indicator driven primarily by borrowing and the macroeconomic environment, while WGA net liabilities reflected a broader balance sheet position influenced not only by fiscal developments but also by accounting judgements and valuation changes. In 2024-25, WGA net liabilities were around 95% of PSND (i.e. WGA net liabilities were about 5% lower than PSND). This reinforces that year-on-year changes in WGA net liabilities can diverge from PSND even when the overall fiscal narrative is one of relative stability, because WGA is sensitive to remeasurements, updated assumptions and changes in the valuation or coverage of assets and liabilities across the public sector boundary.
Overall, these developments underline the different purposes of the two frameworks. PSND is a narrow, debt-focused measure used for fiscal monitoring and is sensitive to borrowing and changes in nominal GDP. By contrast, WGA is a full balance sheet measure prepared under IFRS, capturing a wider set of liabilities (including pensions, provisions and PFI obligations) as well as the public sector’s asset base. The 2022-23 outturn illustrates the sensitivity of WGA to actuarial and discount rate assumptions, and therefore its potential volatility. Unless there are further material changes in discount rates or other key assumptions, subsequent WGA results would not be expected to repeat the same scale of accounting-driven improvement, and longterm obligations will remain a significant consideration for fiscal planning. Using both measures together provides a more complete picture: PSND highlights near-term debt dynamics and financing pressures, while WGA helps assess how longer-term commitments and balance sheet strength are evolving.
8.2 Why does The Government use National Accounts?
The UK government relies on National Accounts for several key purposes that are crucial for economic management, policymaking, and international comparison. National Accounts underpin the UK fiscal framework and provide timely, internationally comparable measures of the deficit and debt used for fiscal monitoring, forecasting and policy decisions. They are used to support:
- Economic measurement and monitoring
- Fiscal policy and budgeting
- Compliance with international standards
- Monetary policy
- Economic forecasting and analysis
- Public accountability and transparency
WGA is prepared in accordance with International Financial Reporting Standards (IFRS). Although these standards are interpreted and adapted for the public sector, WGA is fundamentally prepared on a basis similar to that used in the private sector and is independently audited by the National Audit Office (NAO). Its main advantage is that it provides a comprehensive view of the government’s financial position, including the future implications of decisions already taken and commitments made, such as public service pensions and PFI contracts.
For the wider public finances, internationally agreed standards are applied using the National Accounts framework (European System of National and Regional Accounts) to measure economic activity. The Office for National Statistics (ONS), operating independently, compiles and publishes these data. A key advantage of National Accounts is that they are available much sooner than WGA, making them particularly useful for timely economic management and fiscal planning.
There are important similarities between the two frameworks: both use accruals-based concepts, produce balance sheets, and provide analyses of income and expenditure. They can therefore be used in a complementary way. The UK goes further by publishing a reconciliation between WGA and the National Accounts, which enhances transparency and helps users understand the links between the two.
The government’s preferred measure of Public Sector Net Debt (PSND) excludes public sector banks and is calculated as gross external liabilities less liquid financial assets.
The remainder of this Annex sets out the main differences between accounting standards and National Accounts rules and presents a detailed reconciliation from WGA to the National Accounts.
8.3 Comparison between Accounting Standards and National Accounts
The UK government prepares its financial reports using two different frameworks, depending on the context. Whole of Government Accounts (WGA) adheres to International Financial Reporting Standards (IFRS), commonly used by businesses and public sector bodies for detailed financial reporting. The National Accounts, by contrast, follow the European System of Accounts (ESA), which sets statistical rules designed for economic analysis and international comparability.
Although they serve distinct purposes – IFRS focusing on financial transparency and accountability, and ESA on economic measurement and policy – the two frameworks share several core features:
- Accruals basis: Both frameworks are prepared on an accrual’s basis, recognising economic events when they occur rather than when cash is received or paid. This provides a more accurate picture of financial and economic activity over time.
- Financial statements: Each framework produces key statements, including a balance sheet (or statement of financial position), an analysis of income and expenditure, and statements showing other significant changes in assets and liabilities. Together, these provide a comprehensive view of financial performance and position.
- Exclusion of certain future obligations: Both frameworks exclude future tax revenues and other anticipated assets and liabilities that may arise in the future. For example, they do not recognise future welfare benefits or state pension payments that relate to future periods, even though these are important for long-term fiscal sustainability.
These similarities help ensure a degree of consistency across different reporting frameworks, while their distinct purposes and methods allow the government to meet both financial reporting and economic analysis needs.
8.4 Comparing WGA Expenditure to the Public Sector Current Budget Deficit
The public sector current budget deficit is a key component of the UK government’s fiscal framework. It reflects the difference between the public sector’s accrued current revenue (primarily taxes) and current expenditure (day-to-day spending, excluding capital investment) during a given financial year, as reported in the National Accounts.
A major difference between the current budget deficit in the National Accounts and total expenditure in the Whole of Government Accounts (WGA) is the treatment of longterm liabilities. In the National Accounts, many long-term obligations (including unfunded public service pension liabilities and most provisions) are not recognised as balance sheet liabilities in the same way as under IFRS. By contrast, WGA recognises these obligations as they accrue and remeasures them using actuarial assumptions.
This distinction highlights the complementary roles of the two frameworks: the National Accounts focus on the government’s short-term fiscal position and are central to the fiscal rules, while WGA offers a broader picture of its long-term financial obligations.
8.5 Comparison to Public Sector Net Debt
Public Sector Net Debt (PSND) is defined, in the National Accounts, as the public sector’s gross liabilities in selected debt instruments (such as gilts and Treasury bills, loans and deposits), less its liquid assets (mainly official reserves and cash-like assets). It provides a focused measure of the government’s indebtedness by comparing its core debt obligations with the liquid assets available to meet them.
Differences between PSND and the net liabilities reported in the Whole of Government Accounts (WGA) arise mainly because they are designed for different purposes and follow different measurement frameworks. Key differences include:
- Coverage of liabilities: PSND includes only specific types of debt instruments. It does not include many long-term commitments, such as most public service pension liabilities and provisions. By contrast, WGA recognises a much wider range of liabilities, including pension obligations and other longterm provisions, giving a broader picture of the government’s total obligations.
- Valuation of assets: In PSND, assets are generally measured at market or nominal value where relevant and are restricted to liquid assets for the net debt measure. WGA, following IFRS, records a wider range of assets – including property, plant and equipment and intangible assets – often at current or fair value, net of depreciation and impairment. These differences in scope and valuation affect the reported net position.
- Provisions for future costs: WGA recognises provisions for future costs (such as environmental remediation or legal claims) when they meet accounting recognition criteria. These provisions are not generally included in PSND, which focuses on a narrower set of debt instruments. This contributes to WGA net liabilities being higher than PSND.
Both PSND and WGA net liabilities therefore play important but distinct roles in fiscal analysis. PSND is central to the government’s fiscal framework and is used for monitoring debt sustainability in National Accounts terms, while WGA net liabilities provide a more comprehensive, IFRS-based view of the public sector’s overall financial position.
8.6 Differences between WGA and National Accounts
The distinctions between IFRS and ESA in terms of how they recognize, and value specific assets, liabilities, and expenditures are outlined as follows:
Differences between WGA (IFRS) and National Accounts (ESA)
| Area | WGA treatment | National Accounts treatment |
|---|---|---|
| Grants to fund capital expenditure | Is recognised as an expense in-year as it does not result in an asset for government | Is always capitalised on the basis that it results in an asset in the wider economy |
| Research and development expenditure | Can be capitalised if it is likely to result in an asset but is frequently recognised as an expense in-year | Is capitalised more frequently on the basis that it is an investment lasting for more than one year |
| PFI | Most PFI assets and liabilities are recognised on balance sheet after assessing control of the assets. PFI payments are apportioned between repaying debt, paying interest and paying for services. | Most PFI assets and liabilities are not recognised on the balance sheet after assessing risks and rewards. Payments under PFI contracts are recognised as a current expense in-year for off balance sheet schemes and a capital expense in-year for on balance sheet schemes. |
| Depreciation of assets | Is calculated for each asset individually based on its estimated useful economic life and residual value | Is calculated using standard statistical models, high level data and asset life assumptions. |
| Revaluation and impairment of assets | Assets are revalued as set out in Note 1 of the WGA. Assets are assessed annually for impairment compared to their carrying value | Assets are recognised at cost less depreciation and are not revalued. Only impairments caused by obsolescence or accidental damage are recognised |
| Profit or loss on sale of assets | Recognised as income or expenditure | Proceeds of sale are recognised but not the profit or loss |
| Gilts | WGA bodies hold gilts at fair value, these are eliminated on consolidation, and all the remaining gilts are held at amortised cost. | Gilts are included based on their redemption price. |
| Public sector pensions | Recognises expenditure when rights accrue to employees, even though payment is not due. Pension Assets are recognised when employees and/or employers make contributions into the pension fund. | Recognises expenditure as it is paid to retirees. The future liability for current employees is not recognized. Pension entitlements in national accounts are measured on a gross basis; entitlements are not netted against expected revenue of government or expected household social contributions. |
| Provisions | Recognises expenditure when it becomes probable that a payment will be needed because of past events | Recognises provisions only when they are settled (i.e., there are actual payments). Amounts expected to be paid out in future because of past events are not recognised |
| Effects of discounting future liabilities | Future cash flows are discounted to estimate the value of the liability. Changes to the cash flows and discount rate are recognised in-year | Not included |
| Transactions within government | Transactions are eliminated entity‑by-entity in a process that takes several months. The residual elimination error is quantified and subject to audit | Transactions are eliminated using a quicker and higher-level approach. The residual elimination error can’t be quantified |
| Asset Purchase Facility | Shows gilt purchases at fair value | Records the gilt purchases at nominal value |
| UK Asset Resolution (UKAR) | Includes both the liabilities and the assets. | Includes UKAR’s own debts to the private sector and excludes their non-liquid financial and other assets |
| Housing associations | Not included within the WGA boundary | Housing Associations used to be included in the National Accounts but are now not |
8.7 Reconciliation to Public Sector Net Debt
Public Sector Net Debt is a measure that is calculated from the National Accounts. The same figures can be compiled from WGA, but the total net liabilities recognised within WGA are more extensive than those recognised in Public Sector Net Debt. This is partly because Public Sector Net Debt is only part of the National Accounts balance sheet and partly because WGA recognises additional assets and liabilities which are not included on the National Accounts balance sheet.
Public Sector Net Debt Compared to Total WGA Net Liabilities
The reconciling amounts included on the adjustment line in the table below are calculated as the difference between the value of a balance in WGA and the value of the same balance in the National Accounts. These amounts are therefore not directly comparable to the amounts included in the Financial Statements.
Public Sector Net Debt Compared to Total WGA Net Liabilities
| 2024-25 | 2023-24 | |
|---|---|---|
| £bn | £bn | |
| Public Sector Net Debt (National Accounts) | 2,805 | 2,686 |
| Add liabilities not recognised in National Accounts: | ||
| Net public sector pensions liability | 1,396 | 1,312 |
| Provisions | 283 | 262 |
| PFI contracts | 34 | 32 |
| Adjust assets measured differently in national accounts: | ||
| Asset Purchase Facility including Term Funding Schemes | (181) | (247) |
| Unamortised premia on gilts | (43) | (43) |
| UK Asset Resolution (UKAR) net impact on net debt | (0) | (0) |
| Add assets and liabilities excluded from measure of PSND: | ||
| Property, plant and equipment | (1,661) | (1,539) |
| Right of Use Assets | (27) | (28) |
| Investment property | (16) | (14) |
| Intangible assets | (56) | (52) |
| Trade and other receivables | (53) | (44) |
| Prepayments and accrued income | (117) | (118) |
| Inventories | (14) | (13) |
| Investments | (41) | (49) |
| Trade and other payables | 47 | 42 |
| Accruals and deferred income | 95 | 92 |
| Deduct liabilities not yet recognised in WGA | ||
| Housing associations | 0 | 0 |
| Other adjustments including eliminations | 96 | 94 |
| Net liabilities (WGA) | 2,547 | 2,373 |
8.8 Public Sector Net Financial Liabilities
The table below shows the assets and liabilities in WGA that are not included in PSNFL. Whilst PSNFL has a wider definition than PSND, it still does not include some items such as property, plant and equipment, accrued income, deferred income and provisions that are recorded in WGA.
Other differences include measurement differences where the same assets and liabilities are valued differently. For example, PSNFL uses a different discount rate from WGA which is fixed over a longer period. There are also classification differences, such as where the investments of pension schemes are shown as equity in PSNFL but netted off the pension liability in WGA. The only discount rate that PSNFL uses is for pension fund liabilities and assets.
Public Sector Net Financial Liabilities Compared to Total WGA Net Liabilities
The reconciling amounts shown on the adjustment line in the table below are calculated as the difference between the value of a given balance in WGA and the value of the same balance in the National Accounts. These amounts are therefore not directly comparable to the figures presented in the Financial Statements.
Public Sector Net Financial Liabilities (PSNFL) is a statistical measure produced by the Office for National Statistics (ONS). It is calculated as public sector financial liabilities minus financial assets, and therefore only considers financial instruments, not physical assets such as buildings or infrastructure. PSNFL is produced on a national accounts basis (European System of Accounts/ESA), which differs from the commercial-style accruals basis used in WGA.
WGA provides a comprehensive picture of the government’s financial position, including both financial and non-financial assets and long-term liabilities. PSNFL is more focused on the government’s financial risk and exposure, as it only captures financial instruments and excludes non-financial assets. Both are measures of the government’s financial position, but they differ in coverage and accounting basis, so the figures are not directly comparable.
In recent years, including the period covering the COVID19 pandemic and subsequent economic shocks, both PSNFL and WGA net liabilities have increased, reflecting higher borrowing and elevated debt interest costs.
PSNFL was £2,438.9bn in 2024-25. WGA net liabilities were £2,546.6bn in 2024-25, reflecting WGA’s broader coverage of the public sector balance sheet, including obligations such as public service pensions and provisions, alongside the buildup of government debt.
PSNFL focuses on government borrowing and debt within the National Accounts framework, while the WGA presents a more comprehensive view of the public sector’s long term financial position by capturing a broader range of obligations, partially offset by significant non financial assets
WGA Net Liabilities Compared to Public Sector Net Financial Liabilities (PSNFL)
| 2024-25 | 2023-24 | |
|---|---|---|
| £bn | £bn | |
| Public Sector Net Financial Liabilities (PSNFL – National Accounts) | 2,439 | 2,271 |
| Add liabilities not recognised in National Accounts: | ||
| Provisions | 283 | 262 |
| PFI contracts | 34 | 31 |
| Deduct assets not recognised in national accounts: | ||
| Property, plant and equipment | (1,661) | (1,539) |
| Right of Use Assets | (27) | (28) |
| Investment property | (16) | (14) |
| Intangible assets | (56) | (52) |
| Inventories | (14) | (13) |
| Assets held for sale | (1) | (1) |
| Adjust assets measured differently in national accounts: | ||
| Net public sector pension assets (equity) | 511 | 510 |
| Monetary gold & special drawing rights | (4) | (3) |
| Financial assets | 91 | 45 |
| Financial derivatives and employee stock options | (47) | (57) |
| Other Accounts Receivable | (103) | (98) |
| Adjust liabilities measured differently in National Accounts: | ||
| Currency deposits and debt securities | (36) | (108) |
| Pensions | 841 | 787 |
| Guarantees | 0 | (1) |
| Derivatives | 104 | 103 |
| Other Accounts Payable | 209 | 278 |
| Other adjustments (rounding) | – | – |
| Net liabilities (WGA) | 2,547 | 2,373 |
8.9 Reconciliation to Public Sector Current Budget Deficit
Public Sector Current Budget Deficit is also calculated from the National Accounts and the government’s preferred measure excludes public sector banks. Total net expenditure in WGA is higher than the Public Sector Current Budget Deficit primarily because it includes expenditure on long-term liabilities.
Public Sector Current Budget Deficit
| 2024-25 | 2023-24 | |
|---|---|---|
| £bn | £bn | |
| Public sector current budget deficit (National Accounts) | 76 | 62 |
| Add expenditure on liabilities excluded from National Accounts: | ||
| Increase in provisions | (9) | (10) |
| Adjust expenditure calculated differently from National Accounts: | ||
| Public sector pensions | – | – |
| Depreciation and amortisation | (29) | (28) |
| Impairments and revaluations of assets | 21 | 26 |
| Net (gains)/Losses on sale of assets | 3 | 2 |
| Capital grants | 87 | 65 |
| Research and development | 5 | 4 |
| Other adjustments including eliminations | (131) | (65) |
| Net expenditure on public services (WGA) | 23 | 56 |
| Financing costs of long-term liabilities, including discounting | 177 | 83 |
| Revaluation of financial assets and liabilities | 8 | 7 |
| Total net expenditure (WGA) | 208 | 146 |
-
See 15-year analysis of financial statements for more detail on comparison to GDP. ↩
-
An operating measure analogous to EBITDA, which is an acronym of ‘Earnings before interest, taxation, depreciation and amortisation’. In a profit seeking group, this metric shows the operating results of the organisation before including the financial impact of the capital structure. Net cash before non-operating expenditure includes interest cost on government borrowings, but not revaluation losses or impairments. ↩
-
Pensions revaluations are recognised in the statement of other comprehensive, income not the statement of revenue and expenditure ↩
-
Stamp Duty Land Tax, Stamp Duty Reserve Tax, and Annual Tax on Enveloped Dwellings. ↩
-
Fiscal drag refers to the automatic increase in tax revenues that occurs when tax thresholds are frozen or rise more slowly than wages or inflation, causing more taxpayers to enter higher bands or pay more tax without any change in headline tax rates. ↩
-
Measuring tax gaps 2026 edition: tax gap estimates for 2024 to 2025 ↩
-
The block grant is the principal funding provided by the UK Government to the devolved governments, forming a large portion of budgets for devolved public services. In the context of WGA, they are an internal transaction, which is eliminated on consolidation. ↩
-
The “triple lock” is a UK government policy ensuring the State Pension rises each April by the highest of three metrics: average wage growth (May-July), inflation (September CPI), or 2.5%. Introduced in 2010 (active from 2011), it protects pensioners’ purchasing power against rising costs. ↩
-
CG: British government stock (gilts): £m CPNSA - Office for National Statistics ↩
-
Bank of England Asset Purchase Facility Fund Limited Annual Report and Accounts 1 March 2024–28 February 2025 ↩
-
The discount rates presented here and in tables below are for illustrative purposes only. As long-term liabilities, the longest-range discount rate has been presented. Readers should be aware that different rates are applied to shorter time brackets, but for the purposes of this analysis, the longer term is more relevant. ↩
-
Discounting has no effect on cashflow timing ↩
-
Health related inflation is, in most years, higher than general inflation. In the 0% discounted figures above, a residual inflationary uplift has remained in the figures to reflect this higher cost inflation approximately 6.5%. This has been completed to avoid understating a liability which is more susceptible to inflationary pressures than others. ↩