UK House Price Index Wales: August 2017
Published 17 October 2017
Applies to Wales

© Crown copyright 2017
This publication is licensed under the terms of the Open Government Licence v3.0 except where otherwise stated. To view this licence, visit nationalarchives.gov.uk/doc/open-government-licence/version/3 or write to the Information Policy Team, The National Archives, Kew, London TW9 4DU, or email: psi@nationalarchives.gov.uk.
Where we have identified any third party copyright information you will need to obtain permission from the copyright holders concerned.
This publication is available at https://www.gov.uk/government/statistics/uk-house-price-index-wales-august-2017/uk-house-price-index-wales-august-2017
1. Headline statistics for August 2017
the average price of a property in Wales was
£150,258
the annual price change of a property for Wales was
3.4%
the monthly price change of a property for Wales was
-0.1%
the index figure for Wales (January 2015 = 100) was
110.4
Estimates for the most recent months are provisional and are likely to be updated as more data is incorporated into the index. Read the revision policies.
2. Price change
2.1 Annual price change
Annual price change for Wales over the past 5 years
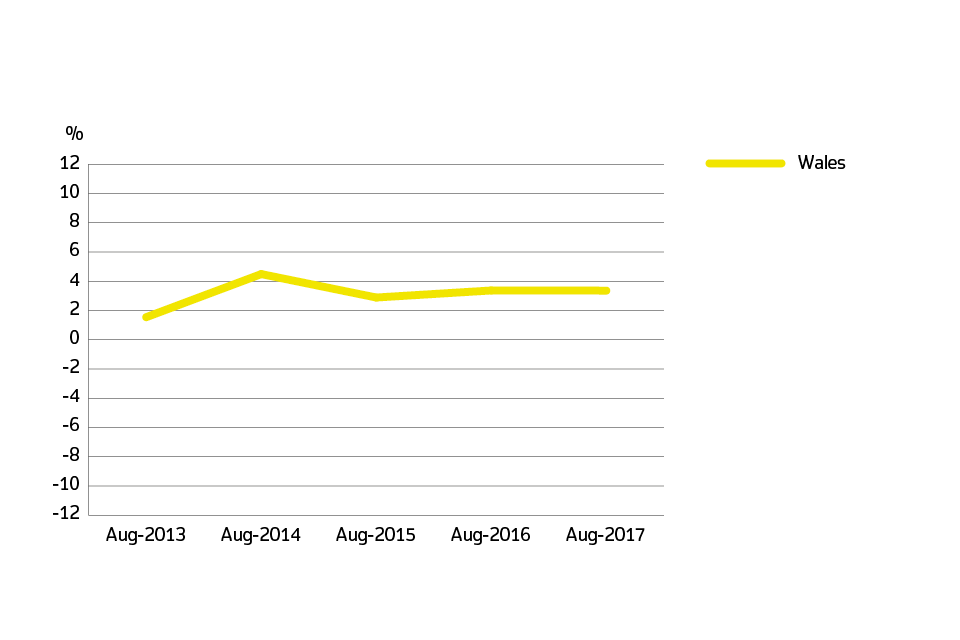
In Wales, the average price increased by 3.4% in the year to August 2017 (up from 2.7% in the year to July 2017).
Annual price change by local authority for Wales
Low numbers of sales transactions in some local authorities can lead to volatility in the series. Whilst efforts are made to account for this volatility, the change in price in these local levels can be influenced by the type and number of properties sold in any given period.
| Local authorities | August 2017 | August 2016 | Difference |
|---|---|---|---|
| Blaenau Gwent | £81,988 | £78,357 | 4.6% |
| Bridgend | £148,930 | £137,384 | 8.4% |
| Caerphilly | £130,238 | £121,212 | 7.4% |
| Cardiff | £196,625 | £191,836 | 2.5% |
| Carmarthenshire | £133,397 | £136,217 | -2.1% |
| Ceredigion | £177,548 | £173,297 | 2.5% |
| Conwy | £159,398 | £148,207 | 7.6% |
| Denbighshire | £145,371 | £143,156 | 1.5% |
| Flintshire | £162,291 | £157,097 | 3.3% |
| Gwynedd | £154,915 | £142,866 | 8.4% |
| Isle of Anglesey | £158,685 | £155,494 | 2.1% |
| Merthyr Tydfil | £95,253 | £97,064 | -1.9% |
| Monmouthshire | £227,293 | £222,086 | 2.3% |
| Neath Port Talbot | £107,837 | £106,503 | 1.3% |
| Newport | £157,343 | £152,044 | 3.5% |
| Pembrokeshire | £164,798 | £154,160 | 6.9% |
| Powys | £176,216 | £168,288 | 4.7% |
| Rhondda Cynon Taf | £101,675 | £104,973 | -3.1% |
| Swansea | £140,661 | £138,400 | 1.6% |
| Torfaen | £134,792 | £125,310 | 7.6% |
| Vale of Glamorgan | £207,463 | £207,675 | -0.1% |
| Wrexham | £150,615 | £148,627 | 1.3% |
| Wales | £150,258 | £145,382 | 3.4% |
Average price by local authority for Wales
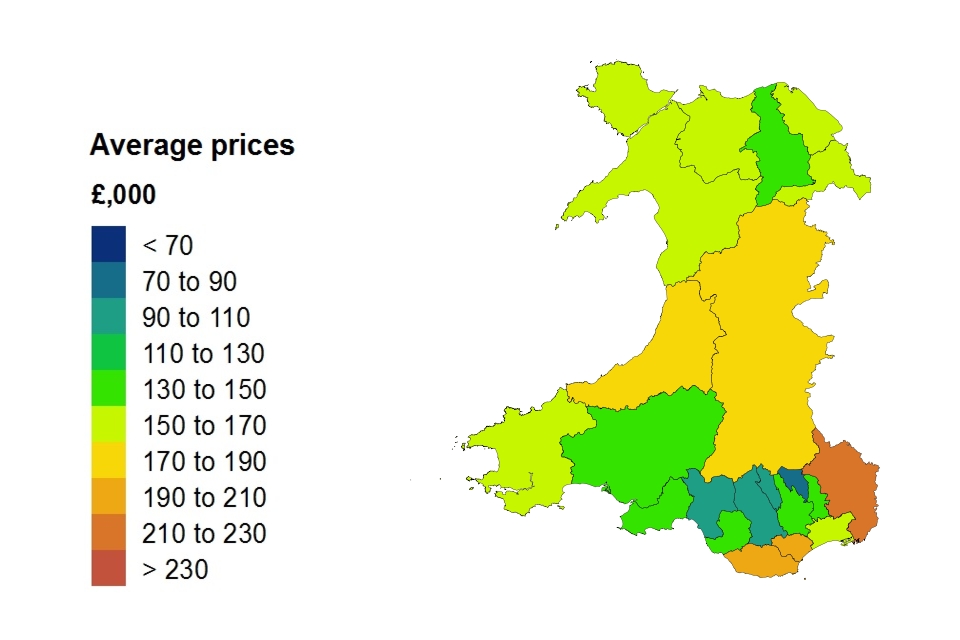
In August 2017, the most expensive area to live in was Monmouth, where the cost of an average house was £227,000. In contrast, the cheapest area to purchase a property was Blaenau Gwent, where an average house cost £82,000.
2.2 Average price change by property type
Average price change by property type for Wales
| Property type | August 2017 | August 2016 | Difference |
|---|---|---|---|
| Detached | £228,756 | £216,982 | 5.4% |
| Semi-detached | £144,390 | £139,249 | 3.7% |
| Terraced | £115,786 | £113,876 | 1.7% |
| Flat or maisonette | £106,935 | £105,233 | 1.6% |
| All | £150,258 | £145,382 | 3.4% |
3. Sales volumes
Due to a period of 2 to 8 weeks between completion and registration of sales, volume figures for the most recent two months are not yet at a reliable level for reporting, so they are not included in the report.
Sales volume data is also available by property status (new build and existing property) and funding status (cash and mortgage) in our downloadable data tables. Transactions involving the creation of a new register, such as new builds, are more complex and require more time to process. Read Revisions to the UK HPI data for more information.
3.1 Sales volumes by local authority
Sales volumes for Wales by Local Authority
| Local authorities | June 2017 | June 2016 | Difference |
|---|---|---|---|
| Blaenau Gwent | 66 | 59 | 11.9% |
| Bridgend | 184 | 195 | -5.6% |
| Caerphilly | 254 | 186 | 36.6% |
| Cardiff | 467 | 411 | 13.6% |
| Carmarthenshire | 235 | 257 | -8.6% |
| Ceredigion | 90 | 55 | 63.6% |
| Conwy | 176 | 191 | -7.9% |
| Denbighshire | 129 | 112 | 15.2% |
| Flintshire | 171 | 182 | -6.0% |
| Gwynedd | 118 | 141 | -16.3% |
| Isle of Anglesey | 63 | 75 | -16.0% |
| Merthyr Tydfil | 77 | 68 | 13.2% |
| Monmouthshire | 115 | 135 | -14.8% |
| Neath Port Talbot | 152 | 137 | 10.9% |
| Newport | 214 | 260 | -17.7% |
| Pembrokeshire | 126 | 130 | -3.1% |
| Powys | 165 | 118 | 39.8% |
| Rhondda Cynon Taf | 309 | 342 | -9.6% |
| Swansea | 306 | 293 | 4.4% |
| Torfaen | 87 | 97 | -10.3% |
| Vale of Glamorgan | 188 | 242 | -22.3% |
| Wrexham | 163 | 125 | 30.4% |
| Wales | 3,867 | 3,812 | 1.4% |
3.2 Sales volumes
Sales volumes for Wales over the past 5 years
| Date | Sales volumes for Wales |
|---|---|
| June 2013 | 3,183 |
| June 2014 | 3,849 |
| June 2015 | 4,052 |
| June 2016 | 3,812 |
| June 2017 | 3,867 |
4. Property status
New build and existing resold property for Wales: August 2017
The first estimate for new builds is based on a small sample which can cause volatility in this initial estimate.
| Property status | Average price | Monthly change | Annual change |
|---|---|---|---|
| New build | £204,442 | 1.3% | 10.9% |
| Existing resold property | £147,204 | -0.1% | 2.9% |
5. Buyer status
First time buyer and former owner occupier for Wales: August 2017
| Type of buyer | Average price | Monthly change | Annual change |
|---|---|---|---|
| First time buyer | £129,456 | -0.4% | 2.7% |
| Former owner occupier | £174,605 | 0.3% | 4.0% |
6. Funding status
Cash and mortgage indicator for Wales: August 2017
| Funding status | Average price | Monthly change | Annual change |
|---|---|---|---|
| Cash | £146,648 | 0.1% | 3.4% |
| Mortgage | £152,403 | -0.1% | 3.3% |
7. Repossession volumes
Due to a period of 2 to 8 weeks between completion and registration of sales, repossession volume figures for the most recent two months are not yet complete, so they are not included in the report.
Repossession volumes by government office region
| Country | Repossession sales volume June 2017 |
|---|---|
| Wales | 64 |
8. Access the data
Download the data as CSV files or access it with our UK HPI tool.
Data revisions
View any revisions to previously published data in the data downloads or find out more about revisions in our guidance About the UK HPI.
9. About the UK House Price Index
The UK House Price Index (UK HPI) is calculated by the Office for National Statistics and Land & Property Services Northern Ireland. Find out about the methodology used to create the UK HPI.
Data for the UK House Price Index is provided by HM Land Registry, Registers of Scotland, The Land & Property Services/Northern Ireland Statistics & Research Agency and the Valuation Office Agency.
Find out more about the UK House Price Index.
10. Contact for Wales queries
Eileen Morrison, Data Services Team Leader, HM Land Registry
Email eileen.morrison@landregistry.gov.uk
Telephone 0300 006 5288