The role of DCMS infrastructure in economic growth
Published 11 September 2026

© Crown copyright 2026
This publication is licensed under the terms of the Open Government Licence v3.0 except where otherwise stated. To view this licence, visit nationalarchives.gov.uk/doc/open-government-licence/version/3 or write to the Information Policy Team, The National Archives, Kew, London TW9 4DU, or email: psi@nationalarchives.gov.uk.
Where we have identified any third party copyright information you will need to obtain permission from the copyright holders concerned.
This publication is available at https://www.gov.uk/government/publications/the-role-of-dcms-infrastructure-in-economic-growth/the-role-of-dcms-infrastructure-in-economic-growth
Executive summary
Context and study objectives
This study helps to better understand how cultural, creative, heritage, tourism, civic, and sporting infrastructure contribute to economic growth at the local level. This will help shape policies so that the Department for Digital, Culture, Media and Sport (DCMS) infrastructure can deliver greater value. This study will also support DCMS’s role in the government’s mission to unlock the potential of places and share prosperity more evenly. The report omits the digital sector as it was produced before the July 2026 machinery of government change to integrate digital into the department.
Currently, the DCMS sectors’ economic contribution is around 9% of the UK’s gross value added (GVA), according to the DCMS statistics. Evidence from the literature suggests that the contribution of DCMS infrastructure extends beyond direct economic output by supporting wellbeing and productivity, attracting visitors and skilled workers, and strengthening civic participation and local identity. Section 2.3 provides more information on the available evidence, such as Bertacchini and others (2024) and Frontier Economics (2024).
However, the precise mechanisms through which DCMS infrastructure contributes to economic performance are complex and not fully understood. In addition, the impacts of DCMS infrastructure on growth are difficult to isolate because they are mediated by other supporting infrastructure (such as transport) and because growth impacts are expected to vary greatly across places.
This research helps address this knowledge gap by examining the following research question:
How does DCMS infrastructure contribute to a place’s economic growth?
This is addressed by:
- setting out a conceptual framework which shows how DCMS infrastructure can, in principle, support growth at the local level;
- constructing a novel analytical data set from disparate sources to enable the measurement of local DCMS and wider infrastructure, and economic outcomes; and,
- empirically testing the relationship between DCMS infrastructure, other infrastructure, and growth at the local level by drawing on the conceptual framework and a novel data set.
The outputs from the study will allow a better understanding of the role DCMS infrastructure plays in shaping local economic outcomes across different place types. Further, the conceptual framework and novel data set enable future research to quantitatively estimate the causal impact of different types of DCMS infrastructure on growth.
Conceptual framework
The literature highlights multiple impact mechanisms through which DCMS infrastructure can influence local economic outcomes.
DCMS infrastructure can affect local economic growth in a number of ways: through direct economic effects (such as increased investment and job creation), supply-chain effects, and additional spending that stimulates economic activity.
There can also be positive impacts on human capital (for example, skills, health and well-being, and place attractiveness), social capital (such as pride in place), and increased density of people and businesses (agglomeration effects), which affect inward investment, innovation, and creative spillovers. Section 2.3 provides more information on the impact mechanisms of DCMS infrastructure.
The strength of these effects depends on local economic circumstances, including the availability of supporting infrastructure and other factors, such as demographics and the local availability of skills.
Understanding the relationships between DCMS and other infrastructure and economic outcomes across places requires a robust analytical framework with clear definitions.
Studying the interactions of DCMS and other infrastructure at the local level is important in understanding why productivity and growth differentials between areas have persisted over long periods. This will contribute to an understanding of productivity issues while providing clues about which interventions could help narrow these gaps in the future. This requires a robust analytical approach with clear definitions of DCMS infrastructure, supporting infrastructure, local economic conditions, and place types. Figure 1 presents an overview of this framework.
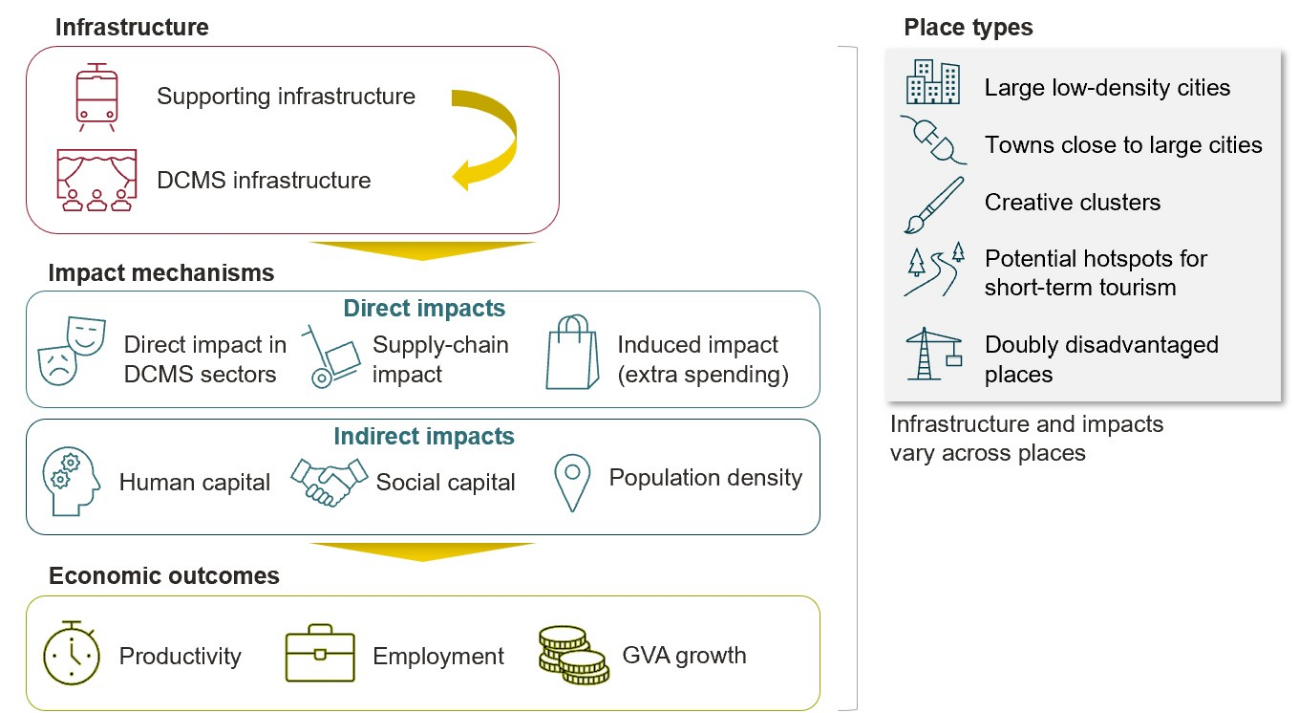
Figure 1 Framework overview
Source: Frontier Economics.
This study uses the following definitions.
DCMS infrastructure: physical assets (buildings) in the private and public sectors, and the third sector, connected to cultural, creative, heritage, tourism, civic, and sporting activities. Some DCMS assets, such as heritage buildings, libraries, and theatres, play an infrastructure role by enabling downstream activities over a long time horizon and benefiting a wide range of individuals and firms. Section 2.3 provides more details on this.
Supporting infrastructure: complementary factors that enable the local impacts of DCMS infrastructure. These were identified through a rapid literature review based on relevance to economic growth, complementarity with DCMS assets, spatial variation, and data availability. These include transport and digital connectivity, housing supply, skills, civic participation, and selected place-specific indicators. Section 2.4 provides more details on the complementary factors.
Impact mechanisms: the processes through which DCMS infrastructure generates economic impact. These were identified through a literature review and grouped based on whether their main contribution to economic outcomes is direct or indirect. Direct economic impacts include activity in the DCMS sectors (such as GVA created), supply chain effects, and extra spending. Indirect impacts are realised through an increase in human capital, social capital, or the spatial clustering of people and economic activity (agglomeration effects).
Place types fall into 6 categories, which help to understand the variation across places in the potential for constraints to growth.
These are:
- large cities with low urban density (such as Swansea);
- towns that neighbour large high-potential cities with poor housing supply (such as Solihull);
- high-potential creative clusters (such as Glasgow);
- emerging hotspots for short-term tourism (such as Tameside);
- doubly disadvantaged places (Defined as LADs, which contain places with the highest level of both economic and social deprivation, such as Middlesbrough); and,
- other places not falling into these place types (such as Wiltshire)
Read Section 3.4 for an overview of ‘Other places’.
The economic outcomes considered in the study are productivity, employment, and GVA growth. These outcomes reveal the core dimensions of economic performance, are aligned with policy objectives, and can be consistently measured at the local level.
This study uses the Local Authority District (LAD) as its unit of analysis because it strikes a balance between being large enough to have available data and small enough for local analysis.
Novel analytical data set
The study constructs a novel, UK-wide data set which can be used to measure DCMS and wider infrastructure provision, economic outcomes, and to identify place types.
DCMS infrastructure is captured through asset densities: the count of cultural, creative, heritage, tourism, civic and sporting assets per square kilometre in a given geographical area. The study explored measuring asset density as assets per population. However, this can overstate density in small, remote areas. There is no single data set that captures the evolution of DCMS assets over time. Therefore, the study builds a novel data set, processing large volumes of spatial data from the open-source OpenStreetMap (OSM). This enables the construction of a comprehensive set of DCMS assets across the UK over time, and the calculation of densities at the LAD level for different functional asset categories.
Supporting infrastructure data are extracted from separate publicly available sources, including the Department for Transport’s (DfT) Connectivity Tool (for transport), Ofcom broadband data (for digital connectivity), and civic participation data from the Community Life Survey (for community engagement).
Places are classified into types (a place can be more than one type) using a data-driven methodology that accounts for factors such as population size and density, housing supply, industrial composition, short-term visitor flows, and indicators of multiple deprivation.
Economic outcomes are based on Office for National Statistics (ONS) and DCMS data. These are productivity (GVA per worker), employment and GVA growth.
Findings
DCMS infrastructure is distributed unevenly across the UK. Figure 2 shows the spatial variation in asset densities across different asset categories.
Assets tend to be concentrated in London and other major cities with high population density. Creative and cultural assets exhibit the strongest clustering, while civic and sports assets show a more uniform distribution.
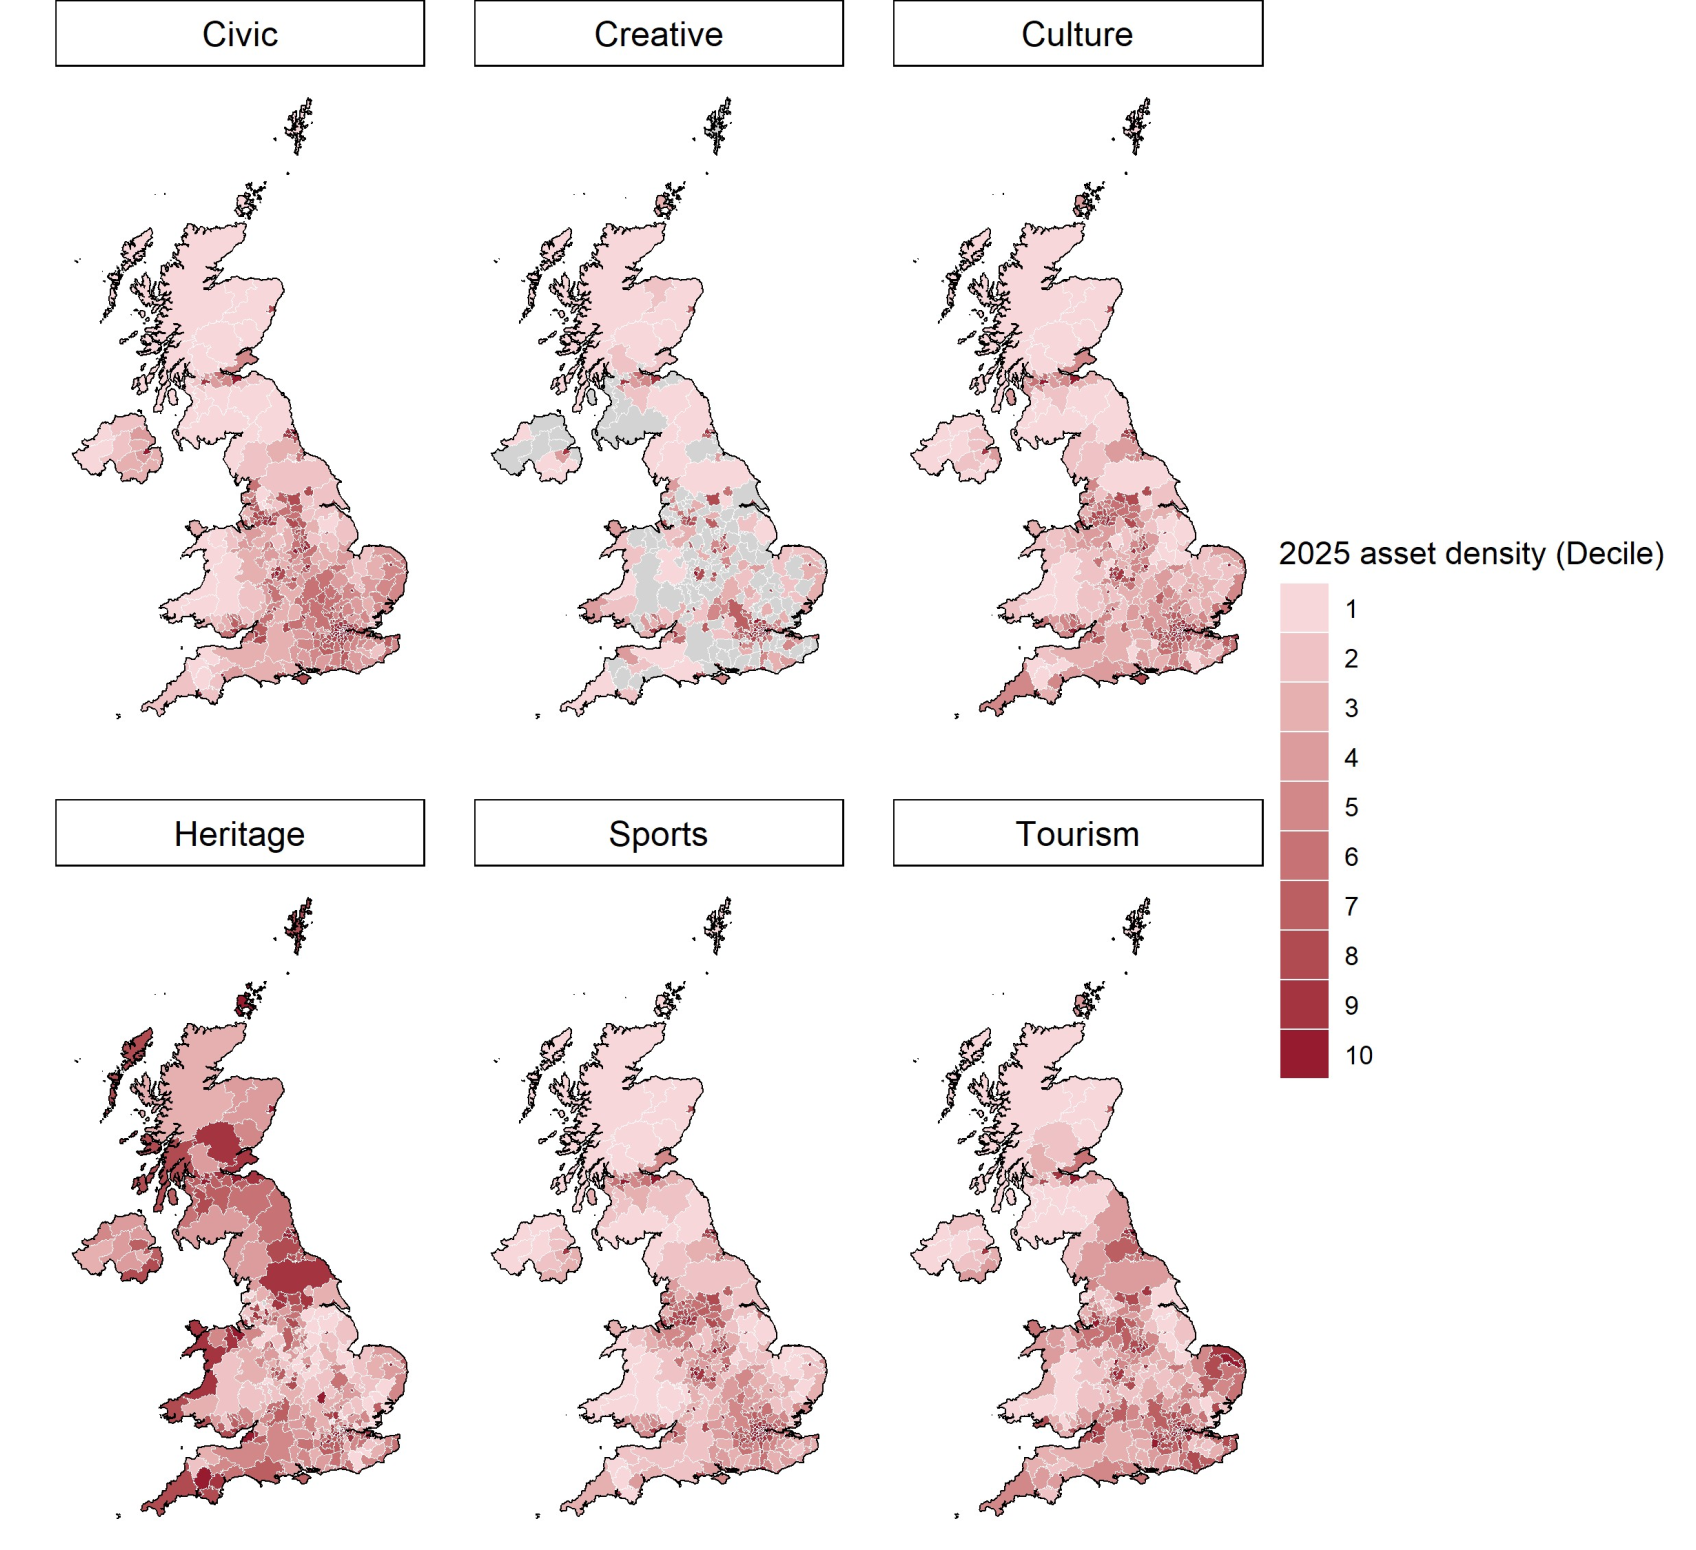
Figure 2 Spatial variation in asset densities across asset categories by decile, 2025
Source: Frontier Economics.
Note: The map shows the distribution of DCMS sectoral asset density (number of assets per 100km2) across LADs in 2025, grouped into deciles. A value of 1 represents LADs in the lowest 10% of the distribution, while a value of 10 represents LADs in the highest 10%. The classification reflects relative ranking rather than absolute levels. LADs with zero assets are filled in grey.
Asset densities vary substantially by sector, with creative assets the most spatially concentrated, especially in inner London. Cultural assets show similar but less extreme urban clustering, while tourism attractions are clustered but more dispersed across London and coastal places.
By contrast, civic and sports assets are more evenly distributed across the UK. Heritage assets show a distinct spatial variation, with generally even distribution and higher concentrations in coastal and rural areas.
This pattern of asset clustering does not vary significantly over time.
Asset density and mix are associated with variation in economic outcomes across different place types.
The most notable differences across place types (presented in Figure 3) are:
- Creative clusters have significantly higher densities than other place types across all asset categories, including creative production spaces and cultural venues. They also have stronger employment and productivity outcomes.
- Emerging hotspots for short-term tourism** have asset densities that are significantly lower than the UK average across all asset types, including heritage and tourism attractions, suggesting that these places could benefit from an enhanced cultural and visitor offer to attract tourists. These areas have relatively fast population growth and total GVA growth whilst tourism focussed jobs could drive productivity gains, highlighting their potential as emerging hotspots. This report uses a particular approach to define and identify place typologies, including “emerging hotspots for short-term tourism”. This is just one approach to identify such typologies and does not represent government policy. It is noted that there are other approaches to define and identify place typologies, including others used throughout government policy.
- Doubly disadvantaged places are at or below the median of the distribution in terms of asset density for most asset categories. This suggests that provision of DCMS assets in these places is relatively limited overall, although a basic level is maintained across most asset types. Economic outcomes in this group are relatively poor.
These patterns highlight that differences across places are affected not only by overall asset density but also by the mix of assets present. In particular, higher-performing places tend to combine a broad set of DCMS assets with different functional characteristics, while lower-performing places often have both lower densities and a more limited mix.
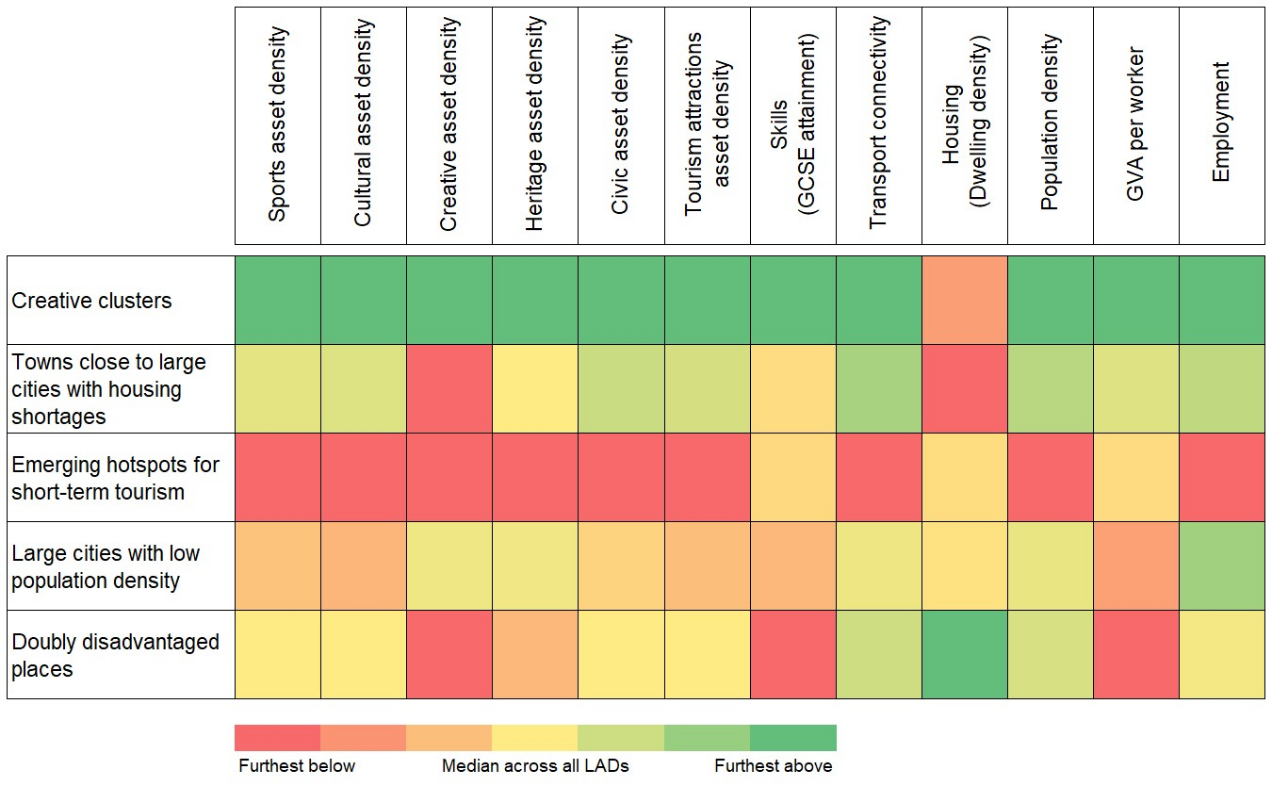
Figure 3 Density and other variables by place type
Source: Frontier Economics.
Note: For each variable, the median within each place type is presented in colour blocks relative to the overall median across all LADs, with green indicating values furthest above the median and red indicating values furthest below.
DCMS asset density is positively correlated with productivity and, to a lesser extent, employment growth.
There is a positive linear association between DCMS asset density and subsequent employment growth and productivity, indicating that areas with good access to DCMS assets have favourable economic outcomes. However, this relationship is not statistically significant and is relatively small in magnitude.
Examining the relationship at a more granular level (for example, by asset type) reveals that both employment growth and productivity are positively correlated (and significant) with asset density across all asset categories except creative assets.
This finding is consistent with what would be expected for creative assets given spatial concentration and the benefits of clustering. Exploratory quantitative analysis in Section 4.2 which attempts to control for baseline differences between local authorities shows a positive and statistically significant relationship.
The correlations are larger for productivity than for employment growth, suggesting that asset density is potentially more closely associated with productivity than employment outcomes. This finding is generally consistent with the literature, which primarily reports productivity impacts (for example, through human capital). Read Section 4.1 for more information on the analysis of DCMS assets.
Exploratory quantitative analysis suggests a positive relationship between DCMS infrastructure and economic outcomes. Further work is needed to improve causal inference.
Correlational bivariate analysis indicates a positive relationship between pre-existing DCMS asset density and productivity and employment growth.
However, when other relevant factors are accounted for in an exploratory econometric model, generally no statistically significant relationship is found. There are indications that the relationship between DCMS infrastructure and employment growth may be stronger in established creative clusters. However, this pattern is not consistent across all model specifications and should be interpreted with caution. Read Section 4.2 for more information about the exploratory econometric model.
The absence of a statistically significant finding is not necessarily evidence of the absence of an effect. Indeed, this study identifies areas for future research that build on its strong foundation to enhance causal inference.
Recommendations
Exploring impacts at a local level using event studies. Future work could focus on small local areas that have experienced clear interventions or catalyst events (such as the introduction or relocation of major DCMS infrastructure or major shifts in DCMS-related funding) and observe their long-term economic development following these catalyst events. This could then be compared with similar local areas (identified using the place typology in combination with data methods such as matching or synthetic controls) that have not experienced similar catalyst events. The divergent outcomes could then be attributed to DCMS infrastructure, using quasi-experimental techniques such as difference-in-differences or a synthetic control method.
Experimenting with the analysis of longer time series data. Increasing the time series available to the DCMS infrastructure would allow the observation of longer-term trends before and after interventions or catalyst events. A longer time series would also allow better exploitation of the data set to control for unobserved variation across places (such as local institutions and governance) and make the causal estimation more precise.
Improving measurement. Asset density captures spatial concentration, but it does not reflect differences in scale, investment value, quality, or intensity of use. Incorporating additional measures, such as asset size, visitor numbers, funding levels, or indicators of usage and engagement, could provide a more nuanced understanding of how DCMS infrastructure contributes to economic outcomes. Improving the measurement technique would benefit the external validity and policy relevance of the analysis.
1. Scope and policy context
This study examines the role of the Department for Digital, Culture, Media and Sport (DCMS) infrastructure in shaping local economic performance across different areas.
It looks at the extent to which DCMS infrastructure is associated with employment, growth and productivity across different place types with differing economic strengths, opportunities and constraints.
1.1. Policy context for growth, infrastructure and place-based approaches
The UK government has made economic growth the central mission in the 2024 Autumn Budget. The Growth Mission aims to boost jobs, productivity and living standards across the UK, after years of slow growth and weak productivity following the 2008 Global Financial Crisis.
Infrastructure investment is a core government lever to help raise productivity and improve economic performance. Indeed, the Autumn Budget 2024 identifies investment, infrastructure and planning among the 7 pillars underpinning the Growth Mission.
The UK’s 10-year Infrastructure Strategy is a cross-government framework that sets out how economic, social and housing infrastructures support long-term growth and enable delivery of the wider Growth Mission. The Strategy emphasises the importance of place-based infrastructure policy that considers local needs and opportunities to improve local economic performance and reduce regional disparities.
According to Local Trust (2021), targeted neighbourhood-level funding can generate significant economic and fiscal returns over time, and well-directed local infrastructure investment can contribute to both economic growth and the reduction of spatial disparities. Place-based interventions building on local strengths and addressing specific needs are increasingly common in the UK. Examples (under previous governments) include the UK Shared Prosperity Fund (2024), Towns Fund evaluation: interim findings (2025), and the Community Ownership Fund (2026).
Further, the (current) UK government’s Pride in Place Strategy (2025) sets out a long-term plan to build stronger communities by giving local stakeholders greater say over investment decisions which reflect local priorities, and the National Wealth Fund (2024) seeks to mobilise public capital to catalyse private investment in strategic areas with a strong regional focus.
The significance of place-based interventions is reflected in the latest HMT Green Book review and guidance, where place-based business cases are being introduced as a new way to appraise public investment decisions, not as individual projects but as packages. The revised HMT Green Book guidance (2026) aims to “support fairer and more balanced decisions on investment in every part of the country”.
1.2. The importance of infrastructure for economic growth
Infrastructure provides enabling services for multiple downstream activities, often over long time periods. Typically, infrastructure is characterised by high upfront costs and spillover benefits for a wide range of individuals and firms, including those not directly ‘consuming’ the infrastructure services. For example, a firm might benefit from improved public transport links in the local area through increased customer flows, even if the firm itself does not use public transport (eg it does not use it for the delivery of intermediate goods).
These features often lead to market failure through suboptimal infrastructure provision by the private sector, with government intervention to achieve societal outcomes such as improved growth, productivity or wellbeing. Infrastructure can be categorised as either growth or social infrastructure, depending on the primary outcomes enabled by the infrastructure:
- Growth infrastructure includes assets that primarily enable productivity, jobs and investment, supporting outcomes including higher growth value added (GVA), wages and firm formation. Examples include energy systems and transport networks. According to the UK Infrastructure 10-year strategy, investment in infrastructure such as transport, energy, water and digital networks, housing, education, and hospitals raises productivity, improves connectivity, supports private-sector investment, and enhances long-term economic resilience.
- Social infrastructure includes assets that primarily enable wellbeing, inclusion, and social cohesion, which support improved health, education and social connections. Libraries, parks, and community arts centres are examples of this type of infrastructure. These spaces perform key functions in community life by supporting social relationships, identity formation and creative expression (the Bennett Institute 2025). As described by the Bennett Institute (2020), improving access to libraries, parks, community and cultural venues supports local economic performance, strengthens community resilience, and improves wellbeing and social cohesion.
DCMS’s policy portfolio covers a wide range of sectors and associated assets, such as museums, galleries, and sports facilities, many of which perform an infrastructure role, including high upfront costs and spillover benefits beyond their immediate users over a long time period, according to research by the Bennett Institute (2023). Table 1 shows examples of sector assets.
Table 1 Examples of DCMS assets by sector
| Sector | Example assets |
|---|---|
| Civil society | Community centres, village halls, or advice centres |
| Creative industries | Creative studios, artist studios, or film studios |
| Culture | Museums, art galleries, or libraries |
| Gambling | Betting shops, bingo halls, or racetracks |
| Sport | Fitness studios, swimming pools, or sports stadiums |
Source: Frontier Economics.
Valuing the impacts of these types of assets on society and the economy is challenging. For natural capital, the Department for Environment, Food & Rural Affairs (DEFRA) has developed a framework to recognise, measure, and value the environment’s contribution to society and the economy.
DCMS has developed a more comprehensive framework for Culture and Heritage Capital (CHC) to better capture the full value of cultural, creative and heritage assets in appraisal and decision-making. The Culture and Heritage Capital (CHC) Programme is led by the Department for Digital, Culture, Media and Sport (DCMS) and the Arts and Humanities Research Council (AHRC), in partnership with DCMS’ arm’s-length bodies: Arts Council England (ACE), the British Film Institute (BFI), Historic England, and the National Lottery Heritage Fund. The CHC Programme is developing new methods, practical tools, and an evidence bank to ensure that the full economic, social, cultural and environmental benefits of culture, the creative industries and heritage are included in appraisals and evaluations. For more information, please see the Culture and Heritage Capital Portal.
This report focuses on physical, geographically identifiable assets that can be measured consistently across places and over time, and linked to local economic outcomes to measure place-based effects. Other forms of capital recognised by CHC, including intangible heritage, knowledge and creative works, remain relevant to the impact mechanisms discussed in the report, but sit outside this report’s operational definition of ‘assets’.
In the CHC framework, the value of an asset is derived from the benefits arising from the flows of services delivered by the asset and enabled through interactions with other forms of infrastructure. For example, a theatre performance provides an experiential service (e.g. sensory, emotional and intellectual stimulation), which produces a positive impact on enjoyment and wellbeing, but it might also spur innovative ideas through training and skills development in art schools or learning centres.
1.3. Assessing the impact of DCMS infrastructure
DCMS sectors make a significant direct contribution to the UK economy.
DCMS sectors generated around £247.6 billion in GVA in 2024, accounting for approximately 9.4% of the UK economy and generating around 4 million jobs, which represent 11.7% of all filled jobs.
However, the infrastructure role that DCMS sector assets play means they are expected to generate a wide range of benefits beyond direct economic outcomes. This suggests that the overall impact of DCMS infrastructure is likely to be substantially larger, extending beyond direct economic contributions to include wider socio-economic effects.
Evidence shows these wider benefits, for example:
- OECD (2021) provides an overview of the economic and social impacts of the cultural and creative sectors. The report shows that the GVA generated directly in these sectors understates its overall weight. Broader economic benefits include impacts through innovation, skills, and supply-chain linkages, as well as social benefits on improved health, wellbeing, and social capital.
- Gutierrez-Posada and others (2022) find that each creative job generates at least 1.9 additional non-tradable jobs (local services) through local multiplier effects, primarily through spending by creative workers, rather than visitor demand.
- Bertacchini and others (2024) show that designation as, or proximity to, a UNESCO World Heritage Site is associated with statistically significant increases in local income per capita and residential property values. The gains appear to reflect structural shifts in local economies, particularly the attraction and retention of higher-skilled workers, drawn by enhanced amenity value rather than tourism alone.
- Frontier Economics (2024) finds that engagement with culture and heritage generates significant health and wellbeing benefits for UK residents and shows how these impacts can be monetised. Impacts include improvements in individuals’ health, avoided health and social care costs, and wider societal effects such as productivity gains.
This list is not exhaustive of all the literature linked to the methodology, but instead presents some illustrative examples considered during the literature review. These examples have been selected to showcase clear evidence of both direct economic benefits and wider socio-economic benefits from DCMS infrastructure.
Existing literature recognises the important economic and social impacts of DCMS sectors. For example, TBR and others (2016) explore the role of the cultural, sport, and heritage sectors in driving economic and social outcomes across places.
However, important gaps remain. These include:
- the mechanisms through which DCMS infrastructure contributes to local economic performance are not well understood;
- there is limited clarity on how impacts vary across different types of places; and
- research often focuses on a narrow set of assets, and the interaction between DCMS and wider infrastructure is not well understood.
This study responds directly to these evidence gaps by:
- exploring the direct and indirect channels through which DCMS infrastructure is expected to deliver economic impact;
- developing a framework with a place typology to assess how DCMS infrastructure contributes to local economic performance;
- constructing a novel data set at the local authority level with broad asset coverage, including data on the interaction between DCMS and wider infrastructure and economic outcomes; and
- using this framework to explore empirical approaches to quantitatively estimating the relationship between DCMS infrastructure and local economic performance.
1.4. A robust place-based framework
DCMS infrastructure has a wide range of socio-economic impacts, such as health and wellbeing, civic participation, and a sense of belonging. This is evidenced in a large-scale 3,000 study review published by WHO (2019) that finds “global evidence on the role of arts in improving health and well-being”. DCMS (2020) provides a more extensive summary of relevant evidence
According to a 2025 DCMS research report, these impacts vary depending on access to physical infrastructure and social networks. Different types of infrastructure are also expected to interact with each other in generating these impacts.
Evidence from investment in social infrastructure indicates that strategies to boost local growth must be tailored to local strengths and institutional capacity (see, for example, the experience from the UK’s Strength in Places Fund: Evaluation of the Strength in Places Fund). Another report by Frontier Economics (2025) recognises that areas with different economic capacities require tailored support to achieve sustained economic and social impact.
Therefore, understanding the role of DCMS infrastructure requires a robust place-based framework that accounts for local context, complementary infrastructure, and local economic conditions.
The framework requires evidence on:
- the spatial distribution of DCMS and wider infrastructure;
- the channels through which DCMS infrastructure is expected to deliver impact; and
- the local strengths and barriers to economic growth, which may shape how and to what extent DCMS infrastructure influences economic outcomes.
In addition, the framework requires data on local economic outcomes. Read Section 3 for more details on the data set.
1.5. Structure of the report
The rest of the report is structured as follows:
- Section 2 presents the conceptual framework, constructing DCMS asset typologies, impact mechanisms, supporting infrastructure, and place typologies.
- Section 3 outlines the data sources and provides a descriptive analysis of DCMS infrastructure and other supporting infrastructure, and an overview of the place types.
- Section 4 discusses the empirical findings, including the descriptive results and an overview of the quantitative approaches which can be used to estimate the relationship between DCMS infrastructure and local economic performance.
- Section 5 concludes by bringing together the evidence on DCMS infrastructure and growth, discussing implications, and suggesting potential avenues for future work.
- Annex A provides supporting material, including the literature review, further details on the framework and empirical methods, and empirical findings.
2. Conceptual framework
This chapter sets out the conceptual framework that underpins the study.
It defines and brings together a DCMS asset typology, the mechanisms through which they generate impact, the role of supporting infrastructure, and the place typologies into a coherent framework.
Together, these components provide the foundation for the analysis in Sections 3 and 4, which explore where, how and under what conditions DCMS infrastructure can support local economic growth.
2.1. Summary of the framework components
The framework developed combines information on DCMS assets, impact channels, the enabling infrastructure, and the local context into a single conceptual structure, including:
- DCMS asset typology;
- impact mechanisms;
- supporting infrastructure; and,
- place typology.
DCMS asset typology allows the collection of DCMS asset data across local areas, using a functional typology to allocate assets into distinct groups. The functional groups are:
- civil society and youth
- culture
- heritage
- creative and media
- sport
- tourism and visitor economy
Impact mechanisms reflect the channels through which DCMS assets are expected to generate impact. Evidence on these channels allows an understanding of the potential impacts across different local areas. The impact channels are:
- DCMS infrastructure can directly generate GVA and jobs, including through supporting supply chains and the extra income which sustains economic activity (induced effects).
- Economic impacts can also occur through broader spillover effects from human and social capital, and an increase in the spatial clustering of people and economic activity (agglomeration effects).
Supporting infrastructure are a wide range of infrastructure types with which DCMS infrastructure interacts in delivering economic impact. The framework captures the most relevant complementary infrastructure conducive to growth and relevant for DCMS infrastructure. This approach allows the collection of data on:
- transport links;
- digital connectivity;
- housing;
- skills;
- civic participation; and,
- selected place-specific indicators.
Read Section 2.4.3 for more details on the place-specific indicators.
The place typology classifies local areas into place types based on observable characteristics, including size, population density, deprivation and the potential for sectoral specialisation. This typology allows the framework to capture opportunities and barriers to growth at the local level. The framework place types are:
- large, high-potential cities hindered by low urban density;
- towns neighbouring large, high-potential cities with poor housing supply;
- places with high-potential creative clusters;
- emerging hotspots for short-term tourism; and,
- doubly disadvantaged places.
Read Section 3.4 for an overview of places that do not fall into any of the 5 place types. Figure 4 provides an overview of the framework.
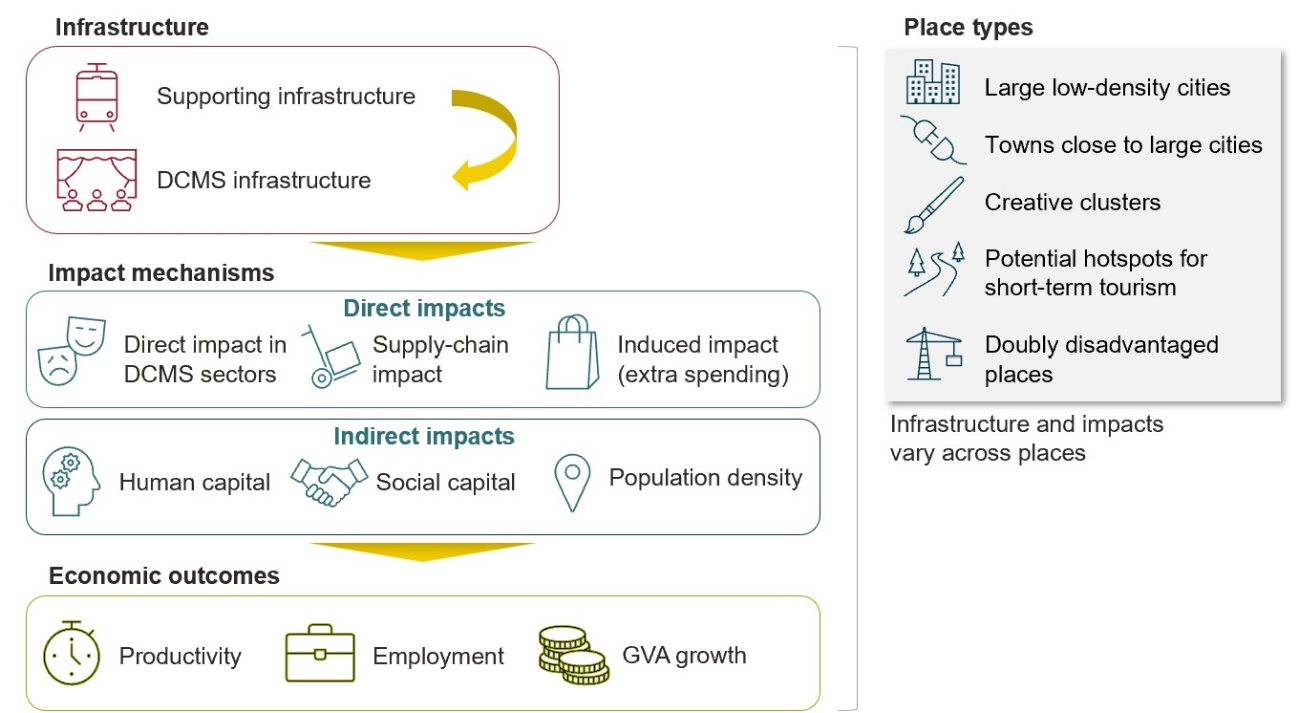
Figure 4 Framework overview
Source: Frontier Economics.
2.2. DCMS asset typology
The framework creates a DCMS asset typology through a functional lens that reflects the assets’ primary economic and social roles, including content production, cultural consumption, community provision, sport and recreation, and visitor economy activities.
This asset typology should be considered alongside more extensive work to consider asset classifications set out in Embedding a Culture and Heritage Capital Approach, which focuses more narrowly on assets relating to culture, heritage and creative industries. This definition includes both tangible and intangible assets. The wider list of assets includes: built historic environment; cultural venues and production facilities; historic landscapes; collections and archives; creative & artistic works; intangible heritage; digital assets; creative and cultural knowledge.
This framework is being further iterated and developed with the sector, through the ACH (Arts, Culture and Heritage) Taxonomies project, funded by Arts and Humanities Research Council (AHRC) and DCMS. All DCMS sector assets, where data is available, are in scope except for gambling, given the sector’s distinct economic characteristics (see, for example, the Office for Health Improvement & Disparities evidence update from 2023). Where possible, the framework includes assets with low-stakes games from other DCMS sectors (such as ball-toss games in theme parks).
2.2.1. Identifying DCMS assets
A rapid literature review identified potential assets and their functions based on the granular DCMS sectors. The framework identifies assets and activities based on DCMS economic estimates, which provide information on the granular (SIC07) sectors within each broader DCMS sector. Table 2 provides examples of assets identified in this approach. However, granular sector information is not provided for the civil society sector. To identify activities and related assets, this report uses the definitions in the economic estimates. According to these definitions, civil society includes charities, voluntary organisations or trusts, social enterprises, mutuals and community interest companies.
Table 2 Example asset identification
| SIC07 CODE | DCMS industries | Identified assets |
|---|---|---|
| 9001 (Performing arts) | Creative, cultural, and tourism | Theatres, concert halls, opera houses, and performance studios |
| 9101 (Library and archive activities) | Creative and cultural | Libraries, reading rooms, archival repositories, and exhibition rooms |
| 9102 (Museum activities) | Creative, cultural, and tourism | Museums, exhibition halls, heritage centres, and visitor auditoriums |
Source: Frontier Economics based on DCMS sectors economic estimates definitions: DCMS Sectors Economic Estimates Definitions - GOV.UK.
Assets identified through this approach are validated using typologies and frameworks from previous research, such as DCMS (2024) and Ipsos (2024), which assess culture and heritage capital. Annex A.1 provides a full list of assets identified through this approach.
2.2.2. Allocating assets to functional categories
The framework allocates the identified assets into functionally distinct groups based on activities. This 2-step approach, from sectoral function to tangible infrastructure, ensures that the assets captured in the data set are conceptually grounded, economically meaningful, and consistently measurable across places.
Existing research from Historic England as part of the CHC programme has emphasised the importance of focusing on the ‘flows’ of benefits (such as health) from different services in the culture, creative, and heritage sectors to understand the value of the underlying assets or ‘stocks’. Adopting a functional approach classifies assets according to the primary services which generate the flow of benefits. This approach yields 5 categories that align with standard DCMS sector definitions.
The framework allocates assets based on whether the primary feature of each of the assets is to:
- provide community social infrastructure;
- preserve or present cultural heritage for consumption;
- produce creative content;
- enable physical activity; or
- attract visitors to places and service the visitor economy.
Table 15 shows the relevant asset types.
This approach provides a tractable typology for this research based on SICs, enabling a wide range of assets to be consistently classified and used for the analysis in Sections 3 and 4.
Based on these principles, the assets are grouped into the 5 functional categories of DCMS assets. Table 3 presents these groups.
Table 3 Functional categories of DCMS assets
| Category | Description | Example |
|---|---|---|
| Civil society and youth | Social infrastructure that supports community cohesion, wellbeing, civic participation, and local service delivery. | Community centres |
| Culture and heritage | Cultural and heritage infrastructure that preserves and presents art, history, and knowledge. | Museums |
| Creative and media | Production infrastructure for the creation and distribution of creative content. | Film studios |
| Sport | Physical activity and competition infrastructure that supports participation, training, and spectator sports. | Leisure centres |
| Tourism and visitor economy | Visitor-facing infrastructure that attracts and services visitors. | Theme parks |
Source: Frontier Economics.
Earlier studies, such as Historic England (2023), which acknowledges that the heritage sector crosses across SIC grouping boundaries and Nesta (2013), which explores the role of ‘embedded’ workers performing creative roles in non-creative sector organisations, faced similar classification challenges. This report addresses these challenges to ensure analytical clarity.
The approach recognises that there is no precise one-way mapping between assets and functional groups, and that certain assets may serve multiple functions. Indeed, many DCMS assets perform a range of functions (as illustrated in Table 2). Annex A.1 shows all the potential functional groups for DCMS assets.
There are assets which serve similar functions to those of DCMS assets but whose primary role sits outside of DCMS sectors. For example, places of worship serve as cultural and artistic heritage sites, are often used as performance venues and for community functions, and, in some cases, generate significant visitor flows. These structures are recognised, but for consistency, are excluded from the framework.
Assets built onto natural sights, such as beach resorts, are included in the framework. However, the natural environment itself, such as coastlines, is not captured as a DCMS asset. This ensures that the framework focuses on human-built assets affected by investment decisions, rather than on fixed natural features of a place. The natural environment is considered in Sections 3 and 4 to be infrastructure that supports DCMS assets.[footnote 1]
2.3. Impact mechanisms
A rapid literature review identified a range of direct and indirect economic benefits associated with DCMS assets. This evidence is important in the context of the different roles that DCMS assets can play across local areas in supporting economic growth.
First, the literature points to direct effects on output, employment and productivity within DCMS sectors themselves. Next, it highlights broader spillovers that operate through the formation of human and social capital. Finally, it notes the positive impact of increasing population density on the leveraging of human and social capital.
Figure 5 provides an overview of the mechanisms. These mechanisms are introduced in turn.
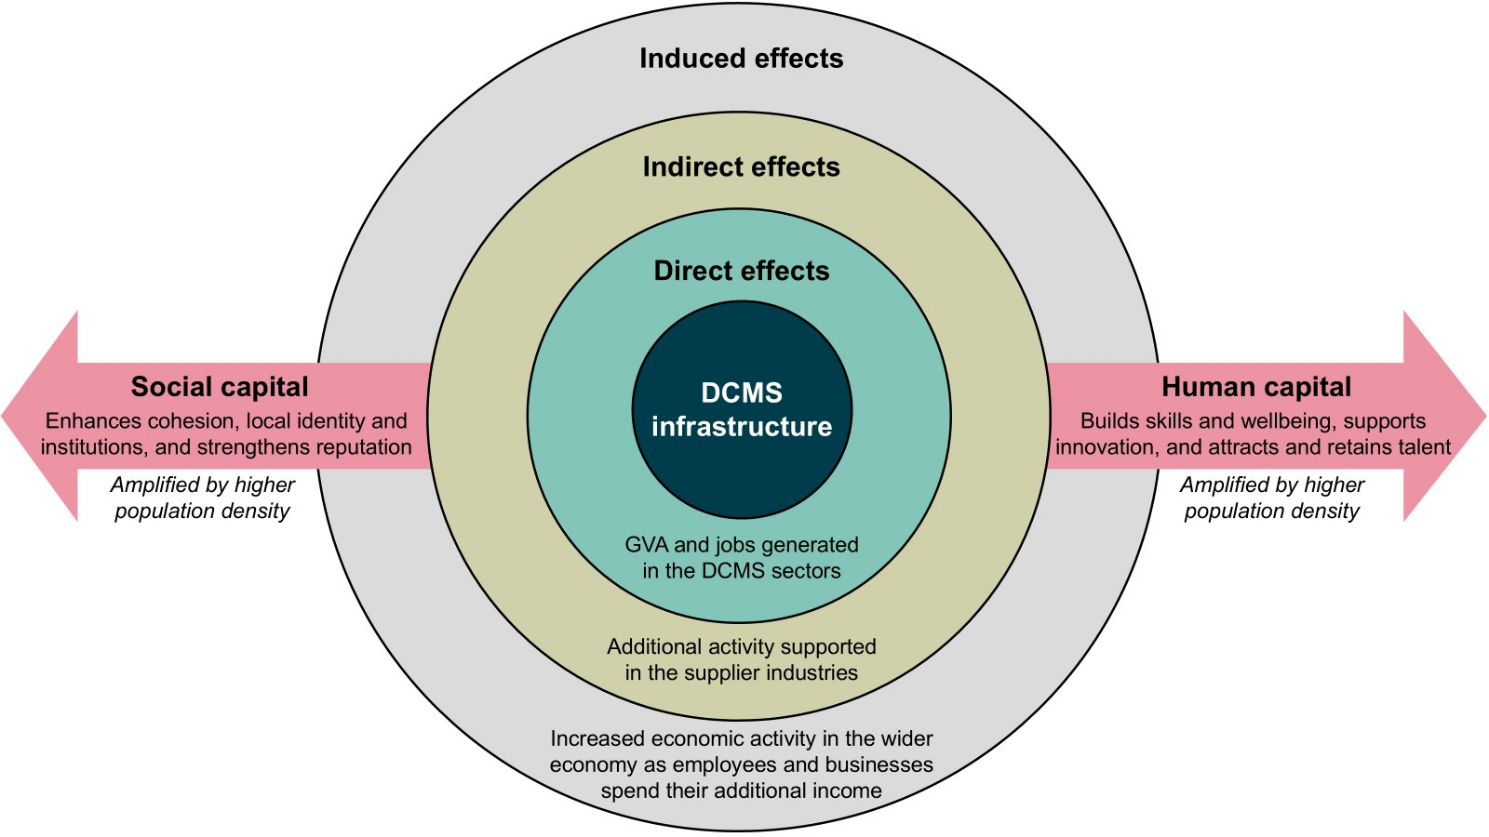
Figure 5 Overview of impact mechanisms
Source: Frontier Economics, based on literature review.
2.3.1. Direct effects
DCMS infrastructure generates economic benefits through increasing GVA and employment directly in DCMS sectors. Cultural venues, creative production facilities, sports infrastructure, and tourism assets attract domestic demand, international tourists, and export demand.
In 2024, DCMS sectors generated GVA of £247.6 billion, accounting for 9.4% of the total UK GVA, with the creative (56.3%) and tourism (26.4%) sectors contributing most (DCMS Sectors Economic Estimates Gross Value Added 2024 provides provisional estimates for 2024). DCMS sectors employed 4 million people in 2024, 11.7% of all UK jobs (excluding tourism). The tourism sector directly employed 1.2 million people in 2023 (ONS 2023).
Beyond these directly measured contributions, DCMS infrastructure also supports additional economic activity through indirect and induced channels. ‘Indirect effects’ arise as DCMS organisations purchase goods and services from suppliers, generating further GVA and employment across their supply chains. For example, Arts Council England (2019) finds that every £1 of GVA directly generated by the arts and culture sectors supports an additional 45p of GVA through supply chains. ‘Induced effects’ occur when the incomes earned by employees and firms in DCMS sectors and their suppliers are spent in the wider economy, supporting further output and jobs across a range of industries. Gutierrez-Posada and others (2022) find that spending by creative service employees significantly impacts job creation.
2.3.2. Broader spillovers
DCMS assets generate important, broader spillover benefits that indirectly impact economic outcomes by positively affecting individuals within a place or enhancing the place’s ability to attract and retain individuals and firms.
These effects impact economic outcomes through human capital or social capital:
- Human capital includes knowledge, skills, competencies, and health embodied in individuals that enhance productivity, innovation, and economic performance.
- Social capital is the combination of networks, trust, and shared norms that enable cooperation, reduce transaction costs, and support collective economic and social outcomes (according to the OECD 2001 report on Wellbeing of Nations).
DCMS infrastructure generates impacts through human capital and social capital as follows:
Human capital: DCMS infrastructure helps in skills development and is associated with firm-level innovation (Frontier Economics 2023). Health and wellbeing effects can reduce sickness and improve productivity (Frontier Economics 2024). DCMS infrastructure can also improve the quality and distinctiveness of places, which helps attract and retain skilled workers. For example, Bertaccini and others (2024) show that proximity to UNESCO World Heritage sites has significant positive effects on the attraction of high-skilled workers.
Social capital: According to the Pride in Place Strategy (2025), investment in cultural and community infrastructure strengthens local identity and civic participation, and increases pride in place amongst local residents. High-profile cultural assets and programmes can also improve external reputation, supporting attractiveness to visitors and locals. Chamberlain and others (2019) show that this can be achieved through restoring key pieces of cultural infrastructure.
Enhanced population density can amplify these effects. Greater interaction among people, firms, and institutions amplifies knowledge spillovers and increases innovation and productivity (Duranton and Puga 2020).
2.3.3. The role of impact mechanisms in the framework
Although the literature identifies a range of distinct impact channels, isolating and quantifying each mechanism separately is beyond the scope of this study. Instead, the empirical analysis in Section 4 provides robust evidence on the combined effect of these channels by examining the relationship between DCMS infrastructure and economic outcomes at an aggregate level across places.
These results provide new insights into how DCMS infrastructure is associated with economic performance and how this relationship varies across places. While the analysis does not focus on the individual mechanisms, it highlights the overall importance of DCMS infrastructure and indicates that impacts are likely to differ across local contexts, showing the importance of a place-based lens.
2.4. Supporting infrastructure
DCMS infrastructure interacts with a range of complementary infrastructures in delivering economic impact. This supporting infrastructure, such as transport, digital connectivity, and skills provision, is itself an important growth driver (the UK’s 10-Year Infrastructure Strategy provides an example).
Evidence in Section 1 shows the importance of supporting infrastructure for growth and how it interacts with DCMS infrastructure. The framework considers infrastructure an ‘enabling condition’ for DCMS-led growth and captures the types of complementary infrastructure most relevant to DCMS, as well as their spatial variation across local areas.
2.4.1. Embedding supporting infrastructure in the framework
Inclusion of supporting infrastructure in the framework is important to:
- understand the contribution of DCMS infrastructure to growth over and above the contribution of other types of infrastructure; and
- explore the interactions between supporting infrastructure and DCMS assets.
It is also necessary that data on these forms of infrastructure can be incorporated into the empirical analysis in Sections 3 and 4.
As a result, the framework includes information on supporting infrastructure that satisfies the following criteria:
- Is it clearly linked to economic growth?
- Does it plausibly complement DCMS infrastructure?
- Does it vary meaningfully across local areas?
- Can it be measured consistently using publicly available data?
2.4.2. Identification of supporting infrastructure through a longlist
The framework uses a rapid literature review to identify a longlist of infrastructure types likely to mediate the impact of DCMS infrastructure on growth.
The review explored studies on infrastructure as a general driver of growth, as well as those related to DCMS infrastructure. For example:
- Supporting infrastructure for growth broadly: Zhang and Cheng (2023) find that transport infrastructure investment in the UK has a positive long-run impact on economic growth. Using macroeconomic modelling over several decades, the study shows that transport infrastructure contributes to productivity and overall economic performance.
- Supporting infrastructure specifically for DCMS: Frontier Economics (2022) finds common key ingredients associated with stronger growth potential for UK creative clusters. These include access to financing, export markets, talent and skills, innovation capacity, and the broader environment, including industry composition and cultural setting. The broader infrastructure, such as transport links, utilities, and digital connectivity, is also important through its impact on productivity and the quality of life.
Annex A.2 provides a summary of the literature and the infrastructure longlist.
2.4.3. Shortlist of relevant supporting infrastructure
This approach yields a focused shortlist of infrastructure items incorporated into the empirical framework. This includes supporting infrastructure, which is relevant across all places, and infrastructure relevant mainly to specific types of places.
Infrastructure relevant across all local areas:
- Transport connectivity: Better transport links expand catchment areas for consumers and workers and support agglomeration benefits – the productivity and growth advantages that arise when firms and workers cluster together geographically.
- Digital connectivity: Stable and high-speed internet connections are critical for vibrant economies, for example, for creative production and marketing.[footnote 2]
- Housing: Access to affordable housing is important to attract and retain skilled workers.
- Skills and learning: Skills underpin productivity, innovation, and spillovers.
- Active and engaged communities: Community engagement strengthens the indirect benefits of DCMS assets, such as community cohesion, pride in place, and reputation.
Infrastructure relevant to specific types of places:
- Access to natural capital, such as green spaces and beaches, is important mainly for rural and coastal visitor economies with tourism potential.
- Co-working and innovation spaces are most relevant in creative clusters, larger urban areas, and places undergoing structural economic change, where they can support clustering, entrepreneurship and knowledge spillovers.
- Coastal water quality is important for coastal tourism and local reputation, and can be considered a proxy for wider water infrastructure quality (such as sewage spills), proxied by bathing water quality.
This place-sensitive approach explicitly recognises that the same infrastructure (such as transport) can play different roles across different local contexts. Incorporating supporting infrastructure in the framework ensures that the analysis can explore the combinations of assets conducive to local economic growth.
2.5. Place typology
Understanding the economic role of DCMS infrastructure requires an explicit recognition that places differ fundamentally in their economic structures, growth constraints, and development trajectories.
The place typology distinguishes contexts in which DCMS infrastructure plays different roles.
2.5.1. Why a place typology is needed
A central premise of the framework is that the impact of DCMS infrastructure on economic growth is highly specific to the local context.
Similar infrastructure may generate very different outcomes depending on local economic conditions, the stage of development, the availability of supporting infrastructure, and the size and function of the local catchment area for visitors. Put differently, DCMS infrastructure might provide different levers for growth depending on the local context.
Without a place typology, analysis of the relationship between DCMS asset densities and economic outcomes risks conflating structurally different places.
For example, tourism attractions in a coastal visitor economy serve a different economic function than tourism assets in a large metropolitan centre. Similarly, cultural venues in areas undergoing structural economic transition may play a role in regeneration and identity building that differs from their role in established creative clusters.
A place typology enables the framework to:
- distinguish between different economic starting points and development trajectories;
- identify places where a given quantity and mix of DCMS infrastructure or DCMS intervention is likely to be more relevant compared to other places; and
- find the appropriate DCMS interventions for different place types.
2.5.2. Principles for constructing the typology
Standard place classification methods (such as urban-rural) are important, but this study requires a more bespoke approach to reflect the DCMS infrastructure’s diverse role across local settings.
In developing the typology, the framework draws on 3 principles:
- The typology must reflect differences in economic development and growth potential. This includes capturing their development potential and the constraints they face.
- The typology must align with the role that DCMS infrastructure is expected to play in the relevant local context. Therefore, the typology needs to capture contexts where DCMS infrastructure is likely to play different roles, such as visitor economies and creative clusters.
- The typology must be data-driven. The framework applies a consistent methodology to classify local authority districts (LADs) using observable indicators (such as tourism flows, deprivation indices, and creative activity). This ensures that the categorisation can be replicated and tested empirically.
2.5.3. Proposed place types
Using these principles and working jointly with DCMS, we have grouped areas into 5 core place types, plus a residual ‘other’ category that captures LADs that do not match any of the place types. Each type reflects differences in economic context and the role of DCMS infrastructure.
Large, high-potential cities, hindered by low urban density (Swansea). Urban areas where an insufficient housing supply constrains growth. In these areas, the primary DCMS lever is to strengthen the cultural and social offer. By enhancing cultural infrastructure and social amenities, DCMS infrastructure can help increase urban density, thereby enabling agglomeration benefits.
Towns neighbouring large, high-potential cities with poor housing supply (Solihull). A stronger local cultural and social offer can help these towns absorb growth pressures from nearby core cities, effectively relieving housing and capacity constraints while supporting a more balanced distribution of economic activity across places.
Places with high-potential creative clusters (Glasgow). These places are characterised by a significant provision and mix of DCMS infrastructure concentrated in a particular area. In these locations, the key lever is cluster development. DCMS policy can reinforce existing strengths by supporting the depth and connectivity of creative and cultural assets, thereby increasing agglomeration benefits, innovation spillovers and productivity growth.
Emerging hotspots for short-term tourism (Tameside). These are often rural or coastal areas with strong access to natural capital. In these contexts, the primary DCMS lever is to enhance the visitor offer. Strengthening tourism-related and cultural infrastructure can help grow the visitor economy and generate further spillover benefits.
Doubly disadvantaged places (Middlesbrough). Due to data availability constraints, this place type is defined only for England. These are typically towns that include areas affected by both economic and social deprivation. DCMS activity can support economic regeneration by using existing cultural, heritage, and community assets. For example, this can be achieved through upgrading facilities, increasing utilisation, and improving connectivity to wider local infrastructure. Failure to address persistent, overlapping socio-economic challenges has high economic and social costs (such as lost output and increased welfare spending).
Section 3 further explores these place types and their overlaps, and identifies archetype examples that illustrate how different place types manifest spatially. Table 17 summarises all binary overlaps between place types by showing the number of local authorities that belong to 2 place types simultaneously.
Overall, the typology is an analytical tool that allows for a more nuanced understanding of the roles of DCMS infrastructure, supporting infrastructure, and economic outcomes across space.
Embedding the typology within the assets–infrastructure–growth framework ensures the analysis identifies where, under what conditions, and how DCMS infrastructure is most likely to support local economic performance. It is a key output of this study.
3. Data set and descriptive overview
A robust assessment of the relationship between DCMS assets and local economic performance requires a novel analytical data set.
The unique data set used in this study brings together asset densities, supporting infrastructure, place characteristics, and economic outcomes, which provides a robust starting point for assessing the economic contribution of DCMS infrastructure.
This chapter explores the differences across places in the provision of DCMS infrastructure, other supporting infrastructure, and wider economic and geographical differences.
3.1. Overview of analytical data set
This section sets out the data sources used in the descriptive and econometric analyses.
3.1.1. DCMS asset densities
The study uses data from OpenStreetMap (OSM) to capture DCMS assets. OSM is a global, open-access, crowd-sourced geographic database of mapped features such as buildings, amenities, and points of interest.
Features are defined using tags (such as ‘leisure=fitness_centre’) and stored as geocoded objects with full version histories. This structure enables consistent identification of a wide range of assets over time at a granular geographic level.
The study builds a UK-wide database of DCMS assets by extracting OSM data for the relevant tags across the UK. Section 2 explains how the relevant DCMS assets were identified, and Annex A.1 lists the OSM tags used.[footnote 3]
Using OSM data, this study calculates asset densities by dividing the number of assets in a given Local Authority District (LAD) by the area of the LAD. Defining the unit of analysis as LAD is a pragmatic balance between sufficient geographic granularity to capture meaningful local variation and consistent data availability (the study does not explicitly model cross-LAD spillovers). The study defines asset densities on a per-area rather than per-population basis because per-area densities more accurately capture the spatial distribution of assets.[footnote 4]
It is important to interpret findings based on asset densities with caution, given that densities alone do not reflect differences in scale, quality, or intensity of use. The study partially addresses this by including data on significant visitor attractions as a proxy for asset prominence.
Other key data the study uses include data on supporting infrastructure, on operationalising the place typologies, and on economic outcomes.
3.1.2. Supporting infrastructure
The study captured supporting infrastructure using a combination of publicly available data sets.
Transport connectivity is measured using readily available indices such as DfT’s Connectivity Tool and OSM-based measures of DCMS assets’ proximity to transport links. To measure digital connectivity, the study draws on Ofcom broadband data (2025) and ONS data to measure access to housing through the number of dwellings per 1,000 residents in the LAD.
Community engagement is proxied by civic participation data from the Community Life Survey, and skills provision is measured by GCSE attainment using education data.[footnote 5] The study uses OSM data to measure access to natural capital (green spaces such as natural parks and nature reserves) and to extract the number of co-working spaces available in each LAD. Lastly, bathing water quality is available from the Department for Environment, Food & Rural Affairs (DEFRA) and devolved administrations. The final analysis did not use the information due to limited data availability and insufficient variation across place types.
For supporting infrastructure, the study explores different combinations of data sets as robustness checks where available. Annex A.3 provides further details on the data set combinations.
3.1.3. Defining place types
The framework allocates LADs into place types using a data-driven approach that reflects each place type definition; a LAD can belong to multiple place types. Table 4 shows the criteria used for each place type.
| Place type | Criteria |
|---|---|
| Large, low-density cities | LADs in urban areas, which belong to the top 50% most populated cities and the bottom 50% of the least densely populated cities at the same time (This report uses ‘Primary Urban Areas’ as identified by the Centre for Cities). |
| Towns neighbouring large cities with a poor housing supply | These are urban LADs bordering cities that rank in the bottom 25% for housing availability, measured by dwelling density (number of dwellings per 100,000 population). |
| Creative clusters | LADs which are part of 1 of the 55 creative clusters as identified by Frontier Economics (2023) and recognised by the government’s Creative Industries Sector Plan. |
| Areas that could benefit from tourism led regeneration | LADs that are in the bottom 50% of all LADs by current visitor numbers (2025) and at the same time in the top 50% of all LADs by visitor growth (2023 to 2025 growth), according to ONS. |
| Doubly disadvantaged places | LADs that contain places with the highest levels of both economic and social deprivation. |
Source: Frontier Economics.
3.1.4. Economic outcomes
The study uses data on economic outcomes to test whether, and in what context, higher densities of DCMS assets are associated with stronger local economic performance.
This includes data on employment (separately for DCMS sectors and for other sectors), productivity (GVA per worker), and economic output (GVA) at the LAD level (ONS 2023). Data are available from the ONS.
3.2. Overview of the distribution of DCMS infrastructure provision
This section explores the characteristics and spatial distribution of DCMS infrastructure in the UK.
Overall, asset density varies significantly across the UK, and assets are heavily concentrated in London and other major cities.
Figure 6 shows the distribution of DCMS asset density across the 361 LADs in the UK in 2025, grouped into deciles. Asset density is calculated by dividing the total number of DCMS assets in each LAD by its land area. In the following sections, summary statistics are presented in terms of the number of assets per 100km2.
There is significant variation in asset densities and concentration in large cities. The mean density is 130 assets per 100km2, and the median is 51, indicating that most areas have relatively low asset densities, while a small number of areas have very high densities. The total DCMS asset density ranges from about 6 assets per 100km2 in the Scottish Highlands to over 3,000 assets per 100km2 in the City of London.
Several London boroughs fall within the top decile by density, alongside other urban LADs such as Glasgow, Edinburgh, Manchester and Bristol. By contrast, several large rural LADs (for example, the Scottish Highlands) fall into lower deciles when measured by asset density.
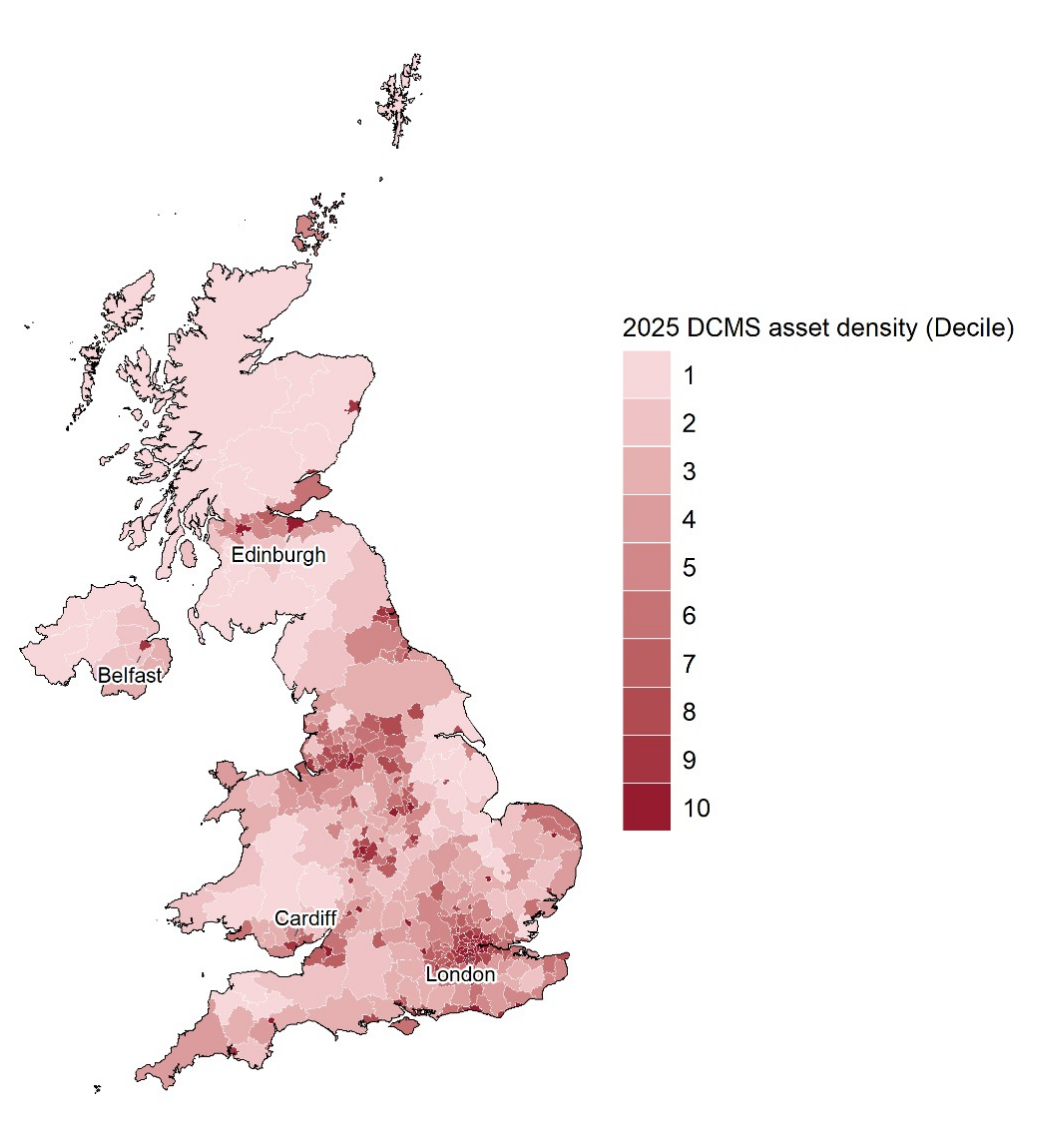
Figure 6 Spatial distribution of DCMS asset density by decile, 2025
Source: Frontier Economics.
Note: The map shows the distribution of DCMS asset density (number of assets per 100km2) across LADs in 2025, grouped into deciles. A value of 1 represents LADs in the lowest 10% of the distribution, while a value of 10 represents LADs in the highest 10%. The classification reflects relative ranking rather than absolute levels.
There is substantial variation in density levels and clear differences in the distribution of sectoral assets across the UK.
Figure 7 presents DCMS asset density by asset type in 2025, grouped into deciles.
Asset densities vary substantially by sector, with creative assets the most spatially concentrated, especially in inner London. Cultural assets exhibit similar but less extreme urban clustering, while tourism attractions are clustered but more geographically dispersed across London and coastal visitor economies. By contrast, civic and sports assets are more evenly distributed across the UK. Heritage assets show a distinct spatial variation, with generally even distribution and higher concentrations in coastal and rural areas.
Overall, creative and cultural assets exhibit the strongest clustering, while civic and sports assets show a more uniform distribution (OSM data show limited variation in asset clustering over time).
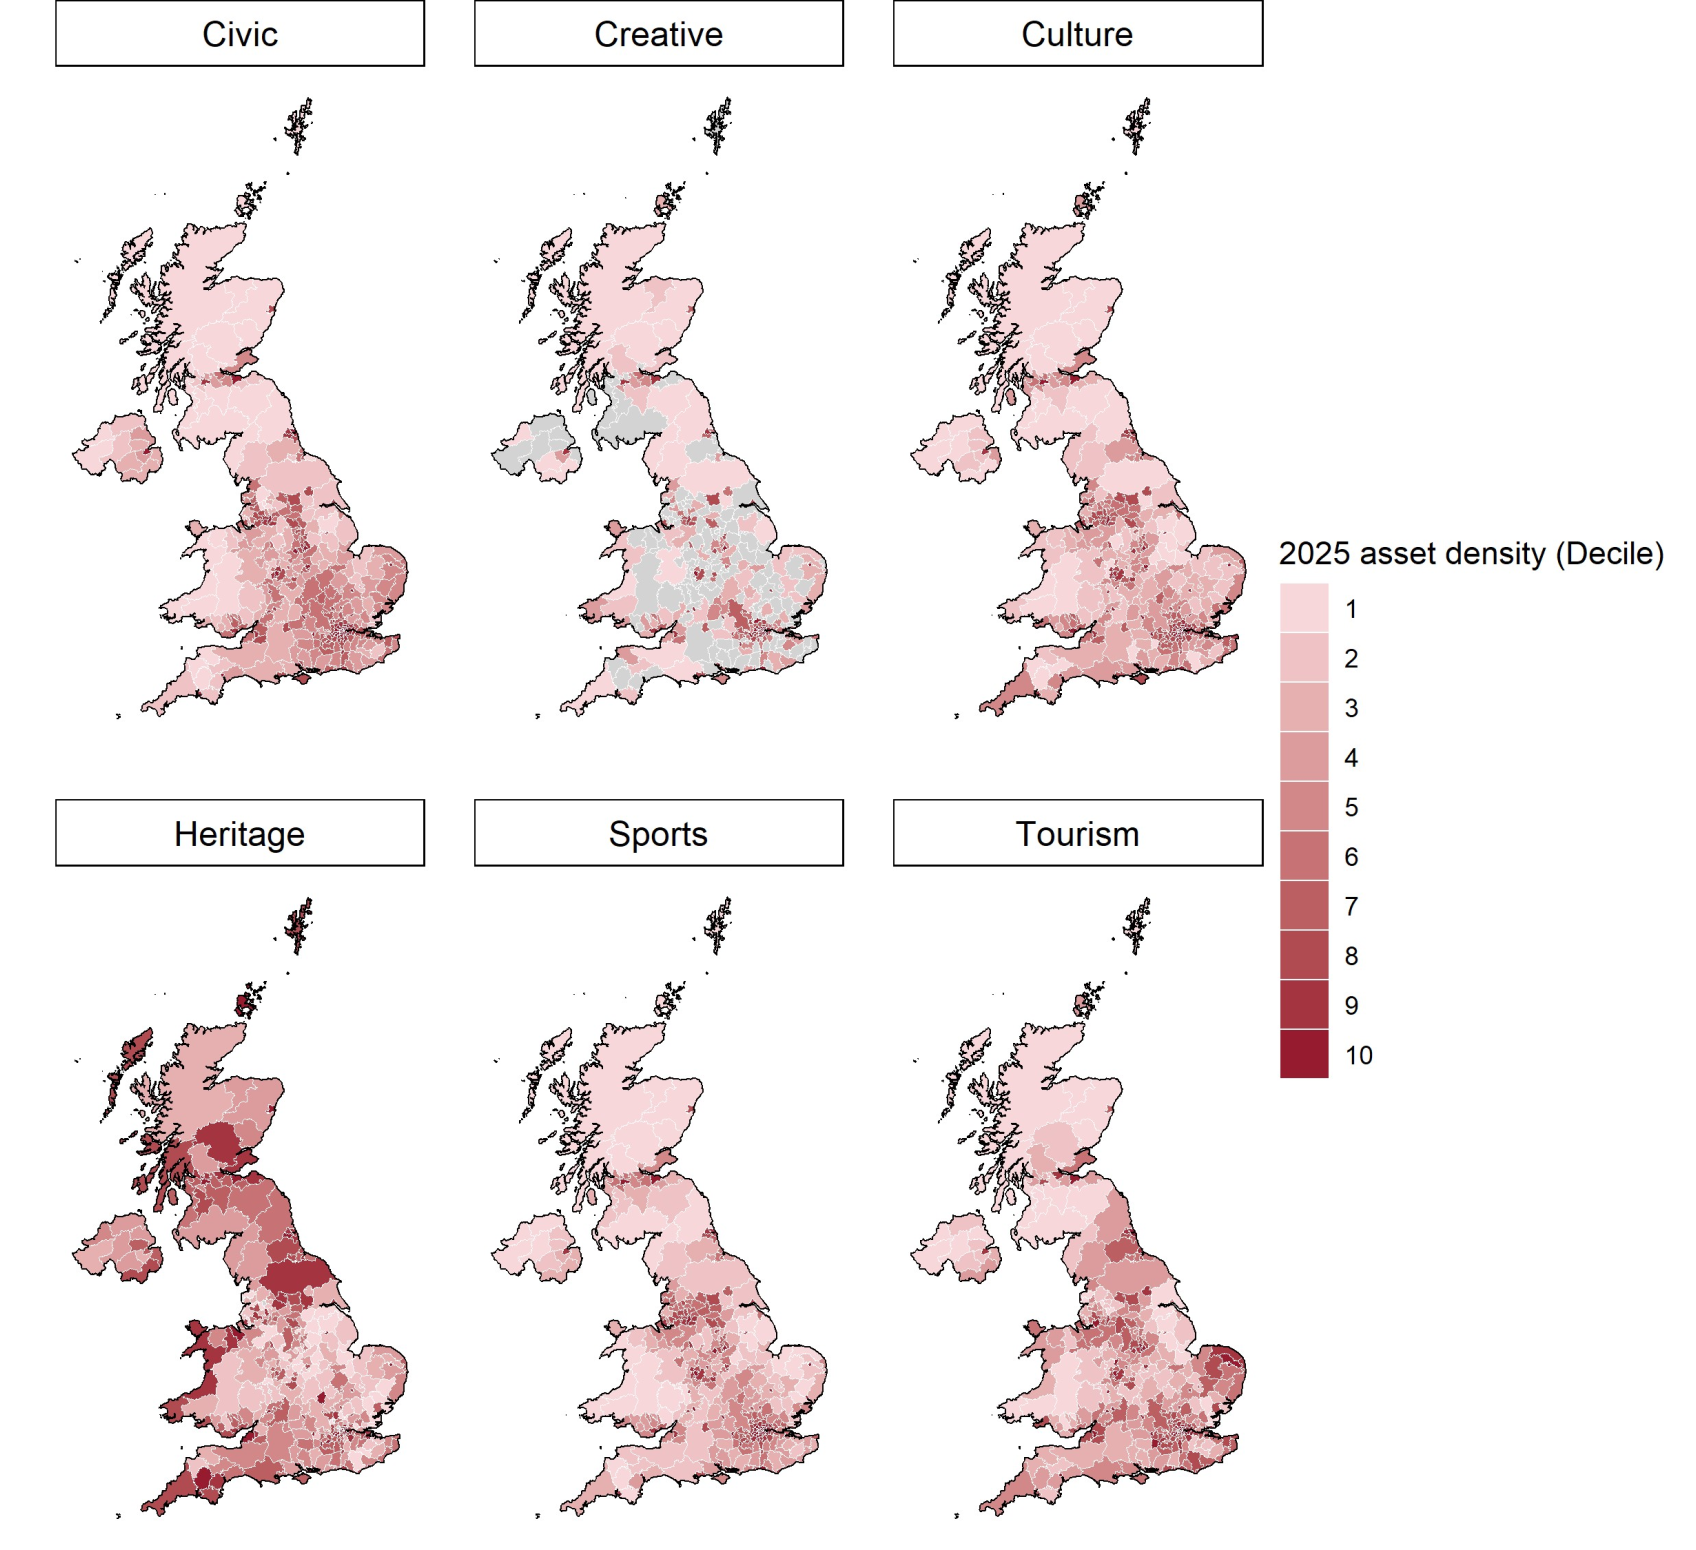
Figure 7 Spatial variation in asset densities across asset categories by decile, 2025
Source: Frontier Economics.
Note: The map shows the distribution of DCMS sectoral asset density (number of assets per 100km2) across LADs in 2025, grouped into deciles. A value of 1 represents LADs in the lowest 10% of the distribution, while a value of 10 represents LADs in the highest 10%. The classification reflects relative ranking rather than absolute levels. LADs with zero assets are filled in grey.
3.3. Variation in asset density and supporting infrastructure across place types
This section explores the distribution of DCMS infrastructure and supporting infrastructure across place types. The provision and mix of DCMS assets vary by place type. Table 5 shows DCMS asset density for the average LAD in each of the 5 identified place type groups, in the ‘other’ category for places not falling into any other groups, and for the UK as a whole.
Large cities with low urban density. These places tend to have densities similar to or slightly lower than the UK average, depending on the asset category. This finding suggests that these cities might lack some of the cultural offerings that can make these places more attractive and increase urban density.
Towns close to large cities with housing shortages. They tend to have relatively high asset densities compared to the UK average. This finding suggests that these neighbouring towns have developed a comparatively strong local DCMS offering in their area.
Creative clusters. These places have significantly higher densities than other areas across all asset categories, including creative production spaces and cultural venues. This confirms the concentration of DCMS assets in these clusters, suggesting the presence and potential for agglomeration effects.
Emerging hotspots for short-term tourism. Here the asset densities are generally lower than for other areas. This includes lower densities in heritage and tourism attractions, suggesting that these places could benefit from an enhanced cultural and visitor offer to attract tourists.
Doubly disadvantaged places. They are in the middle or lower end of the distribution in terms of asset density for most asset categories. This finding suggests that provision of DCMS assets in these places is relatively limited overall, although a basic level is maintained across most asset types.
Places not falling into any of the 5 place type categories. These places tend to have relatively low asset densities, suggesting a more limited role for DCMS assets compared to the named place types.
The median asset density across place types and asset categories is important in assessing provision. However, some places in a given place type are likely to have a very high level of provision, while others have a lower level.
Some assets display significant clustering, with creative assets showing the highest spatial concentration. Annex A.5 shows the distribution of assets by category across place types. Across the different place types, creative, cultural, and heritage assets show the highest concentration, while civic, sports, and tourism assets appear less concentrated.
This finding is relevant in assessing the level of provision for each asset category across different place types.
Table 5 Median asset density (assets per 100km2) by place type, 2025
|
Place type (Number of LADs) |
Civic | Creative | Cultural | Heritage | Sports | Tourism attractions |
|---|---|---|---|---|---|---|
| Large cities with low density (30 LADs) | 12.9 | 0.4 | 9.5 | 7.5 | 33.2 | 7.9 |
| Towns close to large cities with housing shortages (33 LADs) | 21.6 | Not applicable | 18.4 | 7.1 | 48.4 | 12.4 |
| Creative clusters (73 LADs) | 36.9 | 3.7 | 40.0 | 10.7 | 95.8 | 21.3 |
| Emerging hotspots for short-term tourism (104 LADs) |
10.6 | Not applicable | 5.6 | 4.1 | 21.2 | 5.6 |
| Doubly disadvantaged places (87 LADs) | 13.4 | Not applicable | 6.5 | 5.9 | 38.3 | 9.1 |
| Other places (124 LADs) | 7.3 | Not applicable | 3.3 | 5.5 | 8.3 | 3.9 |
| Overall, in the UK (361 LADs) | 10.5 | 0.1 | 7.2 | 5.9 | 21.1 | 7.6 |
Source: Frontier Economics, based on OSM data.
Note: The sum of LADs across place types is larger than the total number of LADs because each LAD can belong to multiple place type categories.
There are clear differences in infrastructure provision across place types.
As discussed in Section 1, DCMS assets deliver economic impact through interactions with other infrastructure, and the role of this infrastructure is expected to vary across places.
Table 6 shows the median provision of supporting infrastructure across place types, and for places not captured by any of the 5 place types. The findings for GCSE attainment are based on a small sample size and should be interpreted with caution.
The results highlight clear differences in the infrastructure profiles of place types.
Large, low-density cities. They score relatively low on transport links, but they have high GCSE attainment (a proxy for skills) and strong digital connectivity, coupled with better housing provision compared to the other place types, such as creative clusters and towns close to large cities with housing shortages.
Towns close to large cities with housing shortages. These places have relatively strong transport links and the best digital connectivity across all place types. However, these places have relatively low GCSE attainment and low dwelling density, implying low housing provision relative to their population.
Creative clusters. They stand out in terms of infrastructure provision. They have the strongest transport connections and GCSE attainment levels across all place types. However, they do not have correspondingly high levels of digital connectivity, and their comparatively low dwelling density suggests housing shortages.
Emerging short-term tourist hotspots. These places have weaker transport links, digital connectivity, and GCSE attainment compared to other place types. However, they provide better access to housing and the best provision of natural capital than any other place type.
Doubly disadvantaged places. They have generally good transport connections and digital connections, and provide the best access to housing than any other place type. However, doubly disadvantaged places have relatively low GCSE attainment.
Places not captured by any place type. They show distinct** features. These places have weaker transport links compared to all other place types, but have a good level of housing provision and GCSE attainment. Notably, these places have significantly higher civic participation rates and greater provision of natural capital than the 5 place types. It is likely that these places capture a larger number of rural areas, including current tourism hotspots, given that the framework includes ‘emerging’ hotspots for short-term tourism under a distinct place type.
Similar to DCMS infrastructure, the provision of supporting infrastructure also varies across place type categories. Annex A.5 presents this variation.
Table 6 Median of supporting infrastructure variables by place types
| Variable | Unit |
Large cities with low density (30 LADs) |
Towns close to large cities with housing shortages (33 LADs) |
Creative clusters (73 LADs) |
Emerging hotspots for short-term tourism (104 LADs) |
Doubly dis-advantaged places (87 LADs) |
Other places (124 LADs) |
|---|---|---|---|---|---|---|---|
| Civic participation (2025) | Percentage of people who engaged in civic participation | 31.8% (N=22) | 32.0% (N=33) | 32.2% (N=70) | 32.3% (N=92) | 31.3% (N=87) | 36.0% (N=81) |
| Transport connectivity (2025) | Percentage of people with good transport links | 62.3% (N=23) | 69.1% (N=33) | 75.0% (N=70) | 60.2% (N=96) | 65.9% (N=86) | 51.8% (N=95) |
| Dwelling density (2024) | Dwellings per 100k people | 43,757.4 (N=22) | 40,773.2 (N=33) | 42,107.0 (N=70) | 43,636.7 (N=92) | 44,955.9 (N=87) | 44,948.7 (N=81) |
| Digital connectivity (2025) | Percentage of people with full fibre connectivity | 84.4% (N=30) | 87.6% (N=33) | 81.1% (N=73) | 79.2% (N=104) | 85.1% (N=87) | 72.8% (N=124) |
| GCSE attainment (2023/24) | Percentage of people reaching GCSEs by 19 | 82.2% (N=22) | 83.4% (N=33) | 85.6% (N=68) | 83.3% (N=91) | 79.5% (N=86) | 85.6% (N=79) |
| Natural capital availability (2025) | Area of natural capital in km2 available per 100k people | 2,822.5 (N=30) | 2,640.6 (N=33) | 2,764.2 (N=73) | 4,126.8 (N=104) | 2,774.8 (N=87) | 5,652.1 (N=124) |
Source: Frontier Economics’ analysis, based on data described in Section 3.1.
3.4. Economic and geographical differences across place types
This section explores the wider economic and geographical differences across place types.
LADs show clear spatial clustering by place type.
Figure 8 shows where the LADs for each place type fall within the UK (‘Doubly disadvantaged places’ are only defined for England). The spatial clustering suggests the use of a place-based lens when assessing and investing in DCMS infrastructure.
Large, high-potential cities hindered by low urban density. They are found primarily in the Midlands and the North of England, and to a smaller extent in parts of Wales and Scotland, with examples such as Doncaster, Sunderland, and Glasgow. This is a relatively small and distinct group with only 30 LADs, given that large cities tend to have relatively high population density.
Towns neighbouring large, high-potential cities with poor housing supply. They are concentrated around major cities in the wider South and South East (London, Bristol, Oxford and Cambridge), and around large cities in the North of England and the Midlands (Birmingham, Manchester, and Leeds). This place type includes mainly urban and suburban areas. Examples of LADs falling into this category include Dartford, South Gloucestershire, and Solihull.
Places with high-potential creative clusters. These places are concentrated in London and the South East, reflecting the spatial concentration of the UK’s creative industries in and around London (for example, Camden). There are also clusters in major metropolitan areas in England (such as Manchester, Birmingham, Leeds, and Bristol) and in Scotland (Glasgow and Edinburgh).
Emerging hotspots for short-term tourism.** They are geographically widespread. They are particularly prominent around coastal areas, in rural Wales (Eryri and Snowdonia National Park), and in the Scottish Highlands and islands. Some are also found in historic urban centres which draw visitors (such as York). Examples include Cornwall in England, Gwynedd in Wales, and the Highlands in Scotland.
Doubly disadvantaged places. These places are only defined for England due to data availability. These areas are characterised by a combination of economic deprivation and wider social need, including many former industrial hubs and coastal areas. Middlesbrough in the North East and Knowsley in the North West of England, and Sandwell in the West Midlands are examples of areas classified as doubly disadvantaged.
Places are not captured by any place type. These ‘other’ places include 124 LADs, which are geographically widespread across England, Wales, and Scotland, with a mix of rural areas and small towns, suburban districts, and smaller cities. Examples of these areas include Wiltshire in the South West of England, Shropshire in the West Midlands, and the East Riding of Yorkshire.
The findings also show that place types are not mutually exclusive, and that many areas combine characteristics of multiple place types and can fall into more than one. This highlights that the growth role of DCMS assets is highly context-specific. Annex A.4 contains additional information about overlaps between different place types.
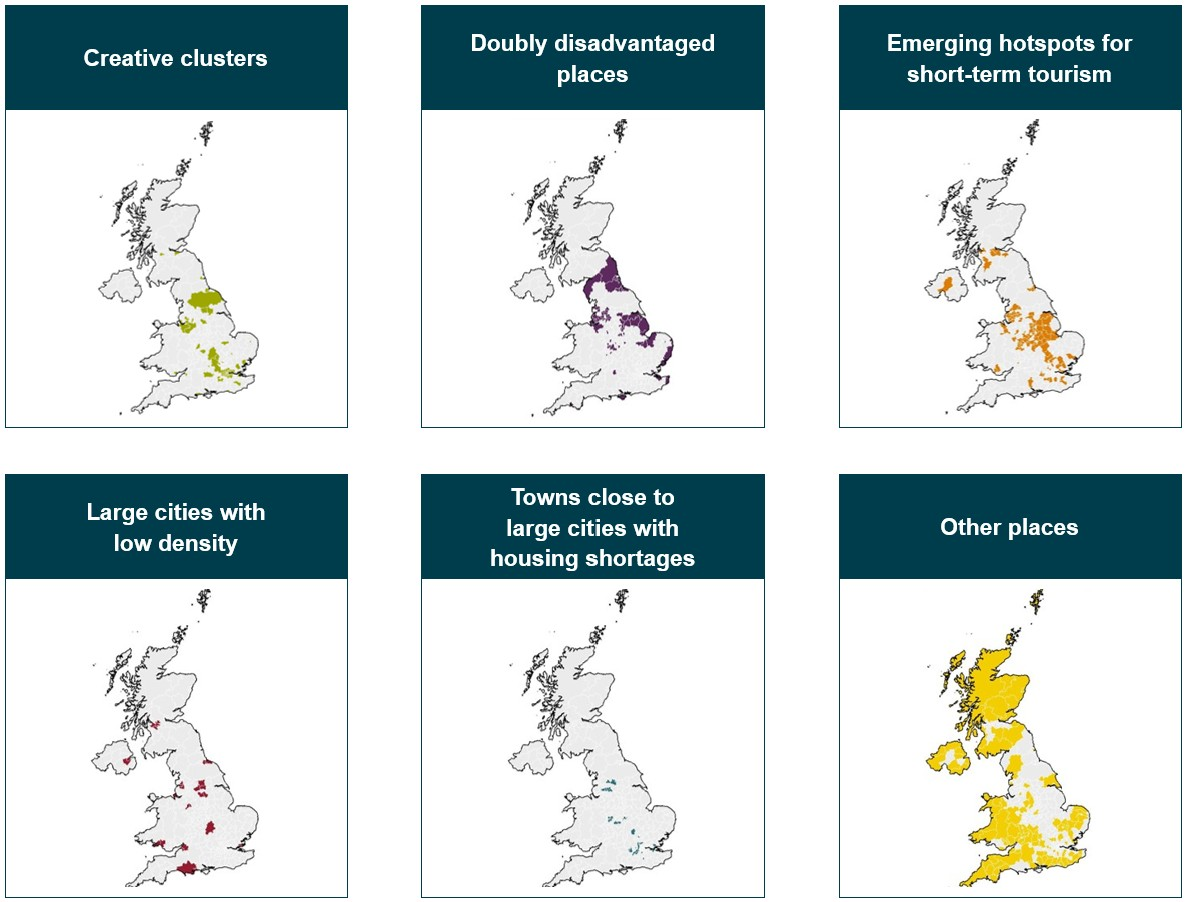
Figure 8 Spatial distribution of place types across the UK
Source: Frontier Economics.
Note: LADs that are assigned to multiple place types appear in each place type category they are assigned to.
Population size, density, and urban-rural split vary by place type.
Table 7 summarises the characteristics of places captured under each place type category and those not falling into any category (other places).
Large, low-density cities and creative clusters are the most populous (roughly between 230,000 and 280,000 residents, compared to a UK median of 150,000). Creative clusters are very densely populated (about 3,700 people per km²), whereas large, low-density cities are more dispersed (1,000 people per km²). Towns near large cities with housing shortages are smaller (180,000) and have intermediate densities (2,000 people per km²). These 3 place types are predominantly urban.
Places falling into the other place types are generally smaller and less urban. Emerging short-term tourism hotspots have densities close to the UK median (600 people per km²), consistent with more rural or coastal areas. Doubly disadvantaged places, although smaller, are relatively dense (1,400 people per km²). Other places not captured by the 5 place types are smaller, less densely populated, and more likely to be rural than the UK as a whole.
Overall, large low-density cities, creative clusters, and, to a lesser extent, doubly disadvantaged places are more likely to be densely populated and urban, thereby supporting agglomeration effects.
This is in contrast to other place types, where DCMS infrastructure is more likely to support the visitor economy and provide social infrastructure.
Table 7 Summary characteristics of place types
| Place type | Number of LADs | % share of all LADs | Median population | Median population density (people per km2) |
|---|---|---|---|---|
| Large, low-density cities | 30 | 8.3% | 229,052 | 1,000 |
| Towns close to large cities with housing shortages | 33 | 9.1% | 182,907 | 2,000 |
| Creative clusters | 73 | 20.2% | 279,737 | 3,687 |
| Emerging hotspots for short-term tourism | 104 | 28.8% | 129,616 | 571 |
| Doubly disadvantaged places | 87 | 29.4%* | 159,911 | 1,385 |
Source: Frontier Economics’ analysis, based on data described in Section 3.1.
Note: ‘*’ The doubly disadvantaged places are defined only for England. Therefore, the % share is calculated based on English LADs. The sum of LADs across place types is larger than the total number of LADs, because each LAD can belong to multiple place-type categories. Population figures are for 2025.
In higher-growth, higher-productivity areas, DCMS infrastructure may focus on reinforcing agglomeration benefits, whilst in other areas it can support place attractiveness and social infrastructure.
Every place is likely to have multiple strengths and face different barriers to economic growth. Economic performance varies by place type, which helps frame the potential of DCMS assets to support growth in different local contexts.
Table 8 shows population growth, productivity (GVA per worker), and GVA growth for each of the 5 identified place types and for places not captured under the 5 place types. For each variable, the median is shown across places.
Large, high-potential cities hindered by low urban density. They show lower productivity and population growth compared to other place types. However, this place type shows the fastest overall GVA growth rate.
Towns close to large cities with housing shortages. These places have strong productivity, and the strongest population growth across all place types. However, the total GVA growth is the lowest.
Creative clusters. They show the highest productivity and the second-fastest population growth across place types. However, total GVA growth is lower.
Emerging hotspots for short-term tourism. They are placed in the middle in terms of productivity, and show relatively fast population growth and total GVA growth.
Doubly disadvantaged places. These places show lower productivity and population growth, with GVA growth in the mid-range of the distribution across place types.
Places not captured by any of the 5 place types. They show low population growth but relatively high productivity and GVA growth.
The findings from comparing outcomes across place types need to be interpreted with caution. Many of the observed differences in annual growth rates are relatively small and have limited explanatory power. However, the cumulative effect of even relatively small differences in growth rates can result in substantial divergence in outcomes. For example, the yearly average GVA growth between 2018 and 2023 in York was 6%, whereas it was 5% in Birmingham. As a result, total cumulative GVA growth between 2018 and 2023 was about 34% in York and 28% in Birmingham.
Overall, the findings suggest clear differences in economic dynamism across place types. This has implications for the role of DCMS infrastructure:
- In higher-productivity, fast-growing areas, DCMS infrastructure may reinforce agglomeration effects, with spillovers to growth and productivity.
- In lower-productivity or slower-growing places, their role may be to support regeneration, place attractiveness, and social infrastructure.
Table 8 Economic characteristics of place types
| Median outcomes Place type |
GVA per worker (2023) |
Yearly population growth (2018 to 25) | Yearly GVA growth (2018 to 23) |
|---|---|---|---|
| Large low-density cities | £64,126 | 0.5% | 5.9% |
| Towns close to large cities with housing shortages | £70,089 | 1.0% | 4.2% |
| Creative clusters | £78,051 | 0.7% | 5.0% |
| Emerging hotspots for short-term tourism | £67,172 | 0.7% | 5.3% |
| Doubly disadvantaged places | £61,193 | 0.6% | 5.1% |
| Other places | £67,993 | 0.6% | 5.1% |
Source: Frontier Economics’ analysis, based on data described in Section 3.1.
Note: The growth rates are compound annual growth rates. This is population2025-population20181/7-1 for population and is equivalently defined for GVA as well. GVA growth is defined as growth in nominal GVA.
The differences in economic characteristics between place types are generally stable over time. For example, place types which had comparably high productivity in 2023 also tend to have comparably high productivity in earlier years.
Place archetypes help illustrate each place type.
The place typology in this study is based on conceptual foundations that are difficult to grasp in the abstract. Therefore, the study selects place archetypes to represent each place type.
The place archetypes for each place type are:
- Swansea for large cities with low urban density;
- Solihull for towns that neighbour large high-potential cities with poor housing supply;
- Glasgow for places with high-potential creative clusters;
- Tameside for emerging hotspots for short-term tourism; and,
- Middlesbrough for doubly disadvantaged places.
Place archetypes are selected to ensure they are some of the most ‘typical’ places, as defined by the closest data matches. This means selecting the LAD that scored highest on the criteria for each place type. For example, selecting an LAD with relatively fast growth in visitor numbers from a low base as a potential hotspot for short-term tourism.
The archetypes broadly align with their place types, with some differences.
Table 9, Table 10, and Table 11 provide information on place archetypes for asset density, supporting infrastructure, and economic outcomes, respectively. The results show that archetypes generally fit their place types, but there is variation within each place type in a place’s characteristics.
For example, creative clusters are characterised by higher asset densities relative to other place types, and Glasgow reflects this pattern. However, Glasgow exceeds creative clusters on several density measures but shows lower productivity. Similarly, Swansea has lower asset densities compared to other places, similar to large low-density cities, but it has a higher density of tourist attractions and weaker growth. Middlesbrough follows the broader pattern of doubly disadvantaged places, with lower productivity and weaker infrastructure overall. However, it stands out with relatively stronger transport connectivity and population growth, and higher densities of cultural and sports assets.
Overall, this suggests that while archetypes capture the relative positioning of place types, there remains meaningful variation within each group.
Table 9 Asset density (assets per 100km2) by place archetype, 2025
| Place archetype | Civic | Creative | Cultural | Heritage | Sports | Tourism attractions |
|---|---|---|---|---|---|---|
| Large cities with low density: Swansea | 6.4 | 0.5 | 9.8 | 10.5 | 18.8 | 19.5 |
| Towns close to large cities with housing shortages: Solihull | 10.1 | Not applicable | 12.3 | 2.8 | 36.5 | 7.3 |
| Creative clusters: Glasgow | 37.4 | 7.4 | 73.1 | 22.7 | 115.1 | 20.4 |
| Emerging hotspots for short-term tourism: Tameside | 11.6 | 1.9 | 12.6 | 7.8 | 77.6 | 9.7 |
| Doubly disadvantaged places: Middlesbrough | 16.5 | Not applicable | 25.7 | 16.5 | 40.3 | 16.5 |
Source: Frontier Economics, based on OSM data.
Table 10 Supporting infrastructure variables by place archetypes
| Variable | Unit | Large cities with low density: Swansea | Towns close to large cities with housing shortages: Solihull | Creative clusters: Glasgow | Emerging hotspots for short-term tourism: Tameside | Doubly disadvantaged places: Middlesbrough |
|---|---|---|---|---|---|---|
| Civic participation (2025) | Percentage of people who engaged in civic participation | Not applicable | 36.0% | Not applicable | 32.6% | 33.5% |
| Transport connectivity (2025) | Percentage of people with good transport links | 59.0% | 66.4% | Not applicable | 70.2% | 68.0% |
| Dwelling density (2024) | Dwellings per 100k people | Not applicable | 43,409.9 | Not applicable | 44,043.8 | 41,103.3 |
| Digital connectivity (2025) | Percentage of people with full fibre connectivity | 81.9% | 80.1% | 91.5% | 91.0% | 61.7% |
| GCSE attainment (2023/24) | Percentage of people reaching GCSEs by 19 | Not applicable | 84.4% | Not applicable | 82.3% | 75.7% |
| Natural capital availability (2025) | Area of natural capital in km2 available per 100k people | 2,842.2 | 2,923.0 | 3.948.2 | 948.9 | 1,003.8 |
Source: Frontier Economics’ analysis, based on data described in Section 3.1.
Table 11 Summary characteristics of place archetypes
| Place archetype | Population | Population density (people per km2) | GVA per worker (2023) | Yearly population growth (2018 to 25) | Yearly GVA growth (2018 to 23) |
|---|---|---|---|---|---|
| Large cities with low density: Swansea | 251,304 | 599 | £59,452 | 0.3% | 2.9% |
| Towns close to large cities with housing shortages: Solihull | 221,242 | 1,241 | £73,537 | 0.4% | 2.6% |
| Creative clusters: Glasgow | 650,300 | 3,687 | £67,186 | 0.5% | 6.9% |
| Emerging hotspots for short-term tourism: Tameside | 239,643 | 2,323 | £58,414 | 0.9% | 3.5% |
| Doubly disadvantaged places: Middlesbrough | 156,161 | 2,863 | £59,226 | 1.5% | 4.8% |
Source: Frontier Economics’ analysis, based on data described in Section 3.1.
Note: Population figures are for 2025.
4. Empirical findings
This chapter builds on the newly constructed data set to empirically examine the relationship between DCMS infrastructure, supporting infrastructure, place types, and economic outcomes. It consists of descriptive and econometric sections.
Because of data limitations described in each section in detail, the findings are largely exploratory in nature, and the results of both analyses should be considered jointly
Overall, this study finds only limited causal evidence of the economic impact of DCMS infrastructure. However, a longer discussion of how a robust impact could be identified is provided.
4.1. Descriptive analysis of DCMS assets
This section introduces the descriptive analysis of the impact of DCMS infrastructure on economic growth. The analysis provides descriptive evidence of this relationship, focusing on employment growth and productivity as illustrative outcomes of interest.
The results indicate a weak positive relationship between total DCMS asset density and both productivity and employment growth at the local level. In general, the results vary by DCMS asset type and indicate a non-uniform impact of different asset types on economic growth.
First, this analysis examines the correlation between total DCMS asset density in 2017 and the economic outcomes of interest: employment growth between 2018 and 2024, and productivity (measured as GVA per worker in 2023). The analysis then examines whether associations vary across specific DCMS asset types, to assess whether certain asset types are more closely linked to local economic performance.
Because this analysis is correlational, the results in this section are descriptive and do not claim that DCMS assets cause better economic outcomes. This is because this section does not account for the fact that localities with higher asset densities may differ systematically from other LADs in ways that also influence growth and productivity.
Despite this limitation, this analysis is important in supporting the econometric investigation presented in Section 4.2. The econometric analysis is largely exploratory, and the causal interpretations of these findings are subject to important limitations and caveats.
Therefore, the results from the correlational and econometric analyses have to be reviewed jointly.
Total DCMS asset density is weakly positively correlated with employment growth and productivity
Figure 9 shows a weak positive linear association between total DCMS asset density and employment growth. However, this relationship is not statistically significant, meaning that although the association appears detectable, it does not indicate a strong link between overall asset density and greater employment growth.
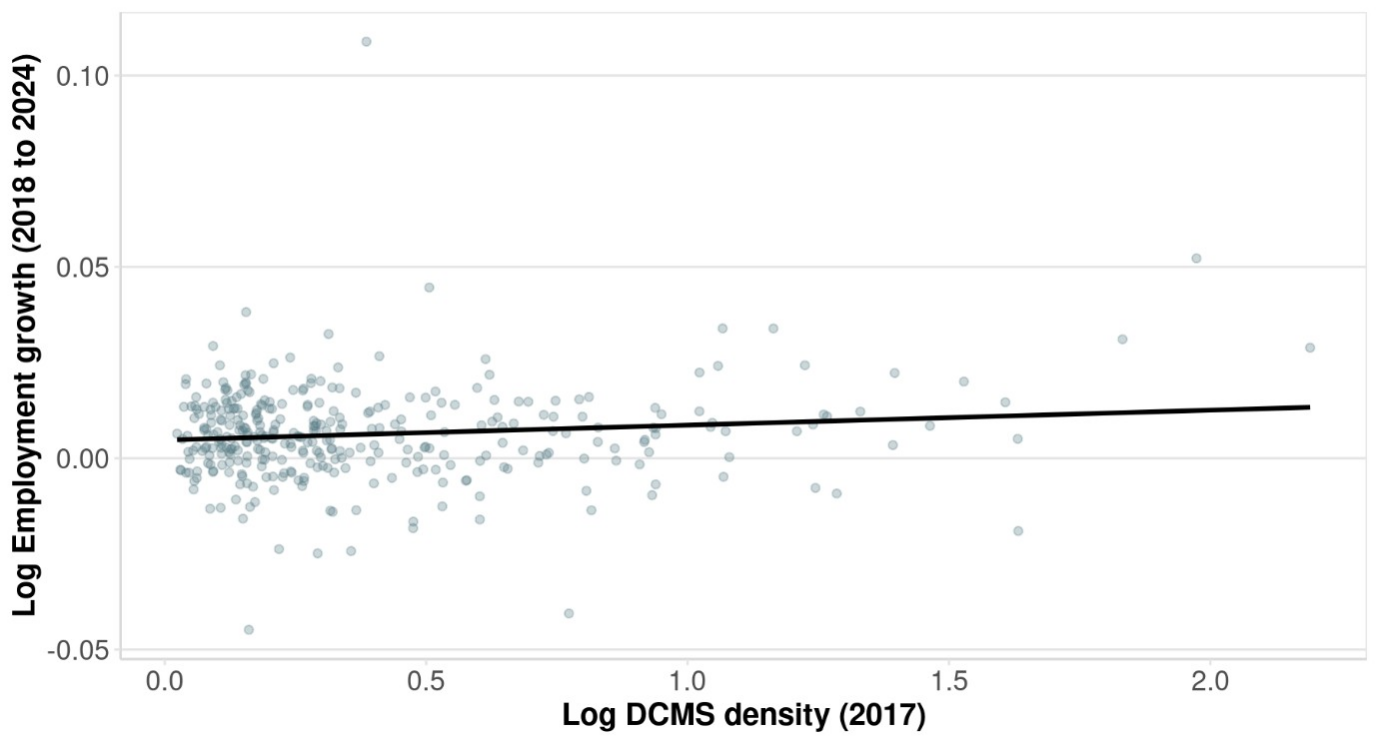
**Figure 9 Long-term growth in employment (2018 to 2024) vs DCMS asset density (2017) **
Source: Frontier Economics’ analysis based on data described in Section 3.1.
Note: N=346 LADs. Outliers with extreme total asset density (top 1%) are excluded from this scatter plot.
Figure 10 presents a similar pattern for productivity. Overall asset density in 2017 is associated with higher GVA per worker in 2023 at the local level, but the relationship is small in magnitude.
Together, the findings suggest that areas with higher total DCMS asset density tend to exhibit slightly stronger local economic outcomes. However, the magnitude of these associations is very small.
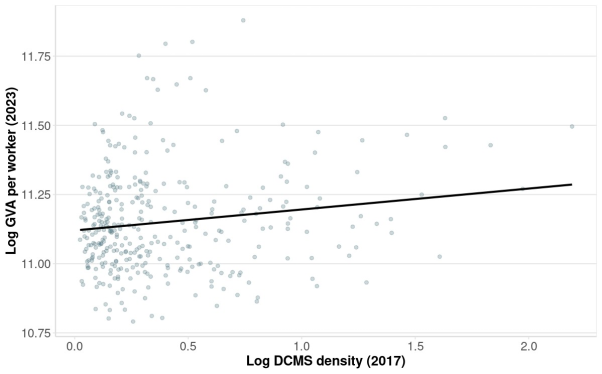
Figure 10 GVA per worker (2023) vs DCMS asset density (2017)
Source: Frontier Economics’ analysis based on data described in Section 3.1.
Note: N=346 LADs. Outliers with extreme total asset density (top 1%) are excluded from this scatter plot.
The correlation between DCMS asset densities and economic outcomes varies in size and significance by asset types
Different DCMS asset types might have different economic impacts. This analysis also focuses on establishing correlations between asset densities of different asset types and economic outcomes.
Figure 11 shows the relationship between asset densities in 2017 and employment growth from 2018 to 2024 across the 6 asset types. For 5 of the 6 asset types, higher asset density is statistically significantly associated with stronger subsequent employment growth, although the magnitude of the relationship is small. For creative assets, the Pearson correlation coefficient is positive but not statistically significant, indicating no clear linear association between asset density and subsequent employment growth at the LAD level.
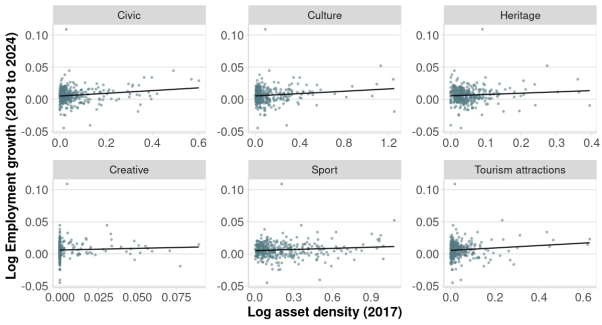
Figure 11 Long-term growth in employment (2018 to 2024) vs asset density by asset type (2017)
Source: Frontier Economics’ analysis based on data described in Section 3.1.
Note: Outliers with extreme total asset density (top 1%) are excluded from this scatter plot.
Figure 12 shows that higher asset density in 2017 is associated with higher GVA per worker in 2023 across all asset types. The association is statistically significant at the 5% level for 5 of the 6 asset types. As with employment, creative assets do not exhibit a statistically significant relationship with productivity.
For the 5 asset types with significant correlations, the correlation magnitudes remain small. Moreover, the estimated correlation coefficients for the statistically significant sector assets lie within a relatively narrow range, indicating broadly similar effect sizes across DCMS assets. Compared with employment growth, the correlations between asset density and productivity are consistently larger, suggesting that asset density is more closely associated with productivity outcomes than with employment expansion. This is in line with broader findings from the literature, which show that the presence of DCMS assets does not operate mostly through an increase in employment but rather through general increases in human capital and attraction of high-skilled workers. These mechanisms can lead to higher productivity while not significantly affecting employment.
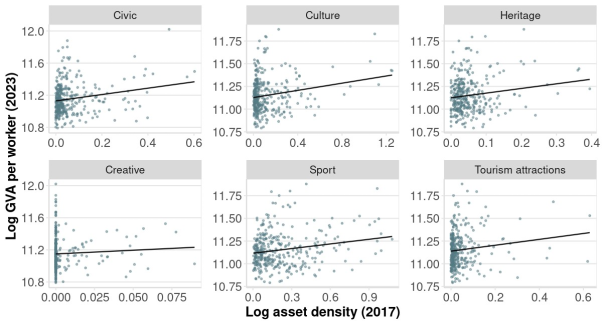
Figure 12 GVA per worker (2023) vs asset density by asset type (2017)
Source: Frontier Economics’ analysis based on data described in Section 3.1.
Note: Outliers with extreme total asset density (top 1%) are excluded from this scatter plot.
4.2. Exploratory econometric specifications
This section introduces the key considerations when modelling the economic impacts of DCMS infrastructure and discusses example methodologies. The analysis is exploratory and focuses on potential modelling approaches that can be used to establish the impact of DCMS infrastructure on local economic performance, and provides an explanation of their advantages and disadvantages.
This section also showcases example results for some of the proposed methodologies, but they should not be taken as conclusive due to the limitations discussed.
Finally, this section recommends alternative approaches for studying the impacts of DCMS infrastructure and discusses the data necessary to operationalise these methods.
As discussed in section 2.4, the economic impact of DCMS infrastructure should translate into changes in employment and GVA. In line with this theoretical reasoning, the empirical analysis measures local economic performance in terms of employment (both in DCMS sectors and in non-DCMS sectors) and GVA (both total and per worker). This analysis also considers whether the impact of DCMS infrastructure on economic outcomes varies by place type or remains consistent across place types.
4.2.1. Key considerations for understanding the impact on economic performance
The question of the impact of DCMS infrastructure on economic performance is difficult to answer because of:
Reverse causality: This analysis aims to study whether DCMS infrastructure causes improvement in local economic performance. However, it is likely that places with better economic performance cause growth in DCMS infrastructure. This means that an analysis that does not account for reverse causality will likely overstate the true impact.
Variation in DCMS asset densities: The variation is important for the ability of econometric analysis to identify the economic impacts of DCMS infrastructure. There are 2 kinds of variation that can act as the identifying source for the economic impacts: i) the variation between local authorities in a given year, and ii) the variation within local authorities over the years. Because of the nature of DCMS assets, their number tends not to change over time very dynamically, which means that the between variation is more significant, as shown in Figure 13.
Long-term impacts: The impacts of DCMS infrastructure, as described in section 2.4, can only manifest themselves over longer periods because of the mechanisms through which they work. For econometric modelling, this means there must be a sufficient time gap between when DCMS assets are counted and when the observed economic indicators are measured. Otherwise, there is a risk of underestimating the true economic impact.
Omitted variable bias: It is likely that the past economic performance of local authorities influences both the future economic performance and the current density of DCMS assets. Because both relationships are positive, failing to control for pre-existing conditions likely overstates the true impact of DCMS infrastructure on economic performance. In addition, there are likely other factors that are difficult to observe and influence both economic outcomes and DCMS asset densities. These may bias the results in unknown directions unless accounted for.
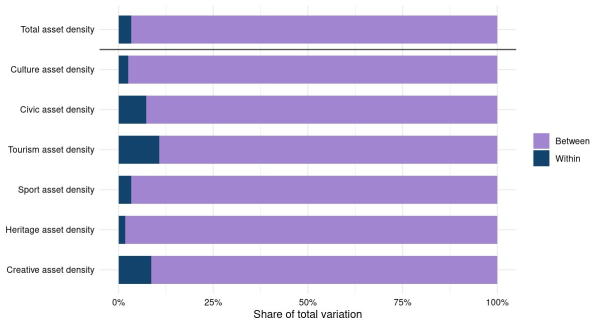
Figure 13 Comparison of variation in DCMS asset densities within and between local authorities
Source: Frontier Economics’ analysis based on data described in Section 3.1.
Note: ‘Between’ indicates the variation across local authorities, where the densities across the years for each local authority are averaged. ‘Within’ is the variation across time within a local authority, and then averaged across them.
4.2.2. Comparison of 2 modelling approaches
Given these key considerations, 2 modelling approaches could be used in this analysis. The approaches differ in how well they address the considerations outlined above.
Cross-sectional analysis uses the DCMS asset density variation between local authorities at a given point in time to identify its impact on economic performance. This modelling approach presents the simplest way to study the relationship between DCMS infrastructure and local economic performance. However, it cannot account for unobservable variation between local authorities.
Panel data analysis uses the DCMS asset density variation within a local authority over time to identify the desired impact. The specific modelling approach consists of a 2-way fixed effects model (Woolridge 2010 provides a full technical description of the approach). This effectively controls for unobserved differences between local authorities arising from pre-existing local economic conditions, pre-existing DCMS asset densities, and other local authority-specific factors. At the same time, it controls for macroeconomic shocks that might affect both economic performance and DCMS assets simultaneously across all local authorities.
Table 12 presents the strengths and limitations of both approaches with regard to the key considerations outlined in the previous section. Annex A.6 presents the full technical specification and discussion of both approaches.
Table 12 Key strengths and limitations of the 2 modelling approaches
| Consideration | Cross-sectional analysis | Panel data analysis |
|---|---|---|
| Reverse causality | Can be addressed using lagged asset densities |
Can be addressed using lagged asset densities |
| Variation in DCMS assets | Not a large problem because of a high ‘between’ variation | The biggest limitation because of a low ‘within’ variation |
| Long-term impact | Can be accounted for using long-term growth rates | Can be partially accounted for by using higher-order lags |
| Omitted variable bias | The biggest limitation because of the inability to control for pre-existing economic conditions in LADs | Can control for pre-existing economic conditions. Some bias remains due to unobserved changes in economic conditions over time. |
4.2.3. Example results from panel data analysis
Panel data analysis handles omitted variable bias well but struggles to yield significant results due to low variation in DCMS assets over time.
As described above, each modelling approach has its strengths and weaknesses, with neither inherently preferable to the other. Because of this, the study uses both modelling approaches in various specifications to fully examine the effect of DCMS infrastructure on local economic performance. This section presents example results of the panel data analysis. Annex A.6 provides the full set of results for both approaches.
Example model 1: Baseline panel analysis
The example panel model illustrates the kind of analysis possible with the data. The model uses yearly growth in total employment, DCMS-sector employment, and non-DCMS-sector employment as the outcome variables. This is motivated by the DCMS sectors’ potential impact not only on related industries but also on broader local growth. The main explanatory variables of interest are DCMS asset densities in local authorities. These are observed one year before the employment growth to avoid reverse causality.
As seen in Table 13, the panel data analysis does not find many significant results. The only significant impact is that of the density of civic society assets on employment in DCMS sectors. This is likely caused by the low within local authority variation in asset densities as described above, and as further seen from a statistic showing the proportion of variation in employment growth that can be explained by the variation in asset densities within local authority over time in each model (known as the ‘within R2’ statistic).
Table 13 Results of example panel data analysis
| (1) Total employment: Total density | (2) Total employment: Sector densities | (3) DCMS employment: Total density | (4) DCMS employment: Sector densities | (5) non-DCMS employment: Total density | (6) non-DCMS employment: Sector densities | |||||||
|---|---|---|---|---|---|---|---|---|---|---|---|---|
| Total density | 0.020 (0.012) | Not applicable | 0.033 (0.033) | Not applicable | 0.013 (0.014) | Not applicable | ||||||
| Sport density | Not applicable | 0.015 (0.020) | Not applicable | -0.044 (0.052) | Not applicable | 0.025 (0.025) | ||||||
| Civic density | Not applicable | -0.003 (0.027) | Not applicable | 0.146** (0.061) | Not applicable | -0.036 (0.033) | ||||||
| Culture density | Not applicable | 0.031 (0.043) | Not applicable | -0.071 (0.104) | Not applicable | 0.057 (0.037) | ||||||
| Heritage density | Not applicable | 0.048 (0.046) | Not applicable | -0.108 (0.097) | Not applicable | 0.080 (0.054) | ||||||
| Creative density | Not applicable | -0.052 (0.090) | Not applicable | 0.127 (0.127) | Not applicable | -0.085 (0.090) | ||||||
| Tourism density | Not applicable | -0.003 (0.023) | Not applicable | 0.022 (0.044) | Not applicable | -0.010 (0.026) | ||||||
| N observations | 1776 | 1776 | 1776 | 1776 | 1776 | 1776 | ||||||
| Adjusted R2 | 0.049 | 0.046 | -0.017 | -0.017 | 0.022 | 0.020 | ||||||
| Within R2 | 0.001 | 0.001 | 0.001 | 0.004 | 0.000 | 0.003 | ||||||
| Fixed effects | LAD + year | LAD + year | LAD + year | LAD + year | LAD + year | LAD + year |
Source: Frontier Economics’ analysis based on data described in Section 3.1.
Note: Standard errors are in brackets and are calculated at the local authority level. * p < 0.1, ** p <0.05, *** p < 0.01. The model is specified as a log-log growth model. That means the dependent variable is the natural logarithm of the yearly employment growth. The independent variables are natural logarithms of respective densities.
Example model 2: Place type interaction analysis
DCMS assets seem to have the most impact in creative clusters.
As described in section 2.5, the DCMS assets are expected to have different impacts across various place types. This analysis tests this proposition empirically using both cross-sectional and panel data methods. The study uses both methods because the considerations outlined above apply. Therefore, comparing the 2 sets of results is important for checking their consistency.
Annex A.6 presents the full technical specification. In short, the modelling involves interacting the DCMS asset densities with the place-type variables to see whether the direction, magnitude, and significance of impacts differ. The study considers 5 place types and uses other places as a baseline. Because it is necessary to compute the interaction between the DCMS asset density and each place type, this analysis uses only the total DCMS asset density, rather than the sectoral breakdown used in other models. This is to prevent calculating too many coefficients and to allow for a more reliable estimate.
Table 14 presents the results of this analysis with growth in total employment and DCMS employment as economic outcomes of interest. Annex A.6 extends this analysis to GVA and GVA per worker. The results show a consistent, positive, significant impact of DCMS asset density in creative clusters. This means that the impact of DCMS infrastructure on employment growth in creative clusters is significantly higher than in other places.
Table 14 Results of place-type interactions analysis
| (1) Total employment: Cross-sectional model | (2) Total employment: Panel data model | (3) DCMS employment: Cross-sectional model | (4) DCMS employment: Panel data model | |
|---|---|---|---|---|
| Total density | -0.002 (0.005) | 0.004 (0.006) | -0.004 (0.007) | -0.006 (0.007) |
| Total density x large low-density cities |
0.001 (0.007) | 0.011 (0.017) | 0.015 (0.011) | -0.029 (0.024) |
| Total density x towns neighbouring poor housing |
-0.009 (0.019) | -0.023 (0.022) | -0.002 (0.019) | 0.003 (0.014) |
| Total density x creative clusters |
0.011** (0.005) | 0.012* (0.007) | 0.015* (0.007) | 0.026** (0.008) |
| Total density x places with tourism potential |
-0.001 (0.003) | -0.010 (0.010) | 0.004 (0.008) | 0.002 (0.008) |
| Total density x doubly disadvantaged places |
-0.002 (0.005) | -0.010 (0.006) | 0.000 (0.007) | -0.004 (0.006) |
| N observations | 277 | 1776 | 277 | 1480 |
| Adjusted R2 | 0.059 | 0.105 | 0.019 | 0.545 |
| Within R2 | Not applicable | 0.003 | Not applicable | 0.016 |
| Fixed effects | Not applicable | ITL2 + year | Not applicable | ITL2 + year |
Source: Frontier Economics’ analysis based on data described in Section 3.1.
Note: Standard errors are in brackets and are calculated at the ITL2 (regional) level. * p < 0.1, ** p <0.05, *** p < 0.01.
4.2.4. Alternative modelling approaches
An alternative rigorous approach could use the difference-in-differences method. This would require a narrower geographic scope, focusing on specific locations over a longer period, and covering sudden changes in DCMS infrastructure at the local level.
This study has shown examples of 2 modelling approaches that could help examine the impact of DCMS infrastructure on economic performance. Yet, neither of the examined approaches can adequately address all considerations. Further work, beyond the scope of this project, is needed to continue this analysis.
Cross-sectional analysis suffers from omitted variable bias, meaning the effects cannot be interpreted causally. This means that a cross-sectional analysis cannot show that DCMS infrastructure truly contributes to economic growth, rather than just appearing alongside it. Panel data analysis, on the other hand, yields results that can be understood causally. However, because of the low variation in DCMS asset densities over time, the analysis is not statistically powerful enough to reliably determine which results are significant.
There are alternative approaches to examining the impact of DCMS infrastructure on local economic performance, but they require a narrower, more local focus with accompanying local historical data. A potential approach would be to use a difference-in-differences method, which utilises a sudden increase in DCMS infrastructure to identify the causal impact. The economic performance of the local area where the sudden increase occurred would be observed over a long period and compared with similar small areas across the country that had comparable pre-existing demographic and economic conditions but did not undergo an increase in DCMS infrastructure. This approach has been used before, for example, to study the economic impact of relocating some of the BBC’s offices to Salford in Greater Manchester (Gomez-Hernandez 2025).
This approach would work best if:
- the observed area is smaller than a local authority, so that the impacts are not overshadowed by other economic changes;
- the increase in DCMS infrastructure is sudden and sufficiently large, such as a large funding increase, an opening of a new museum, or a relocation of a creative industries institution; and
- the local area can be observed over a sufficiently long period of time to truly illustrate a long-term foundational nature of the impact.
Conducting such a rigorous analysis would require a more local focus, concentrating on a small number of localities rather than aiming to capture UK-wide effects.
The conceptual framework and analytical data set developed in this study can be used to identify candidate places for further research.
These can include places where:
- granular data is available over a long time horizon;
- it is possible to identify significant changes in DCMS infrastructure for an event-study-type analysis (such as the opening of major museums); and
- places which represent different types of mechanisms through which DCMS infrastructure generates impact, strengths, and challenges (place types).
This analysis cannot be conducted as part of this study, and is only a recommendation for future work.
5. Summary
The main contributions of this study are threefold:
- It develops a comprehensive analytical framework for assessing how DCMS infrastructure contributes to local economic growth. Grounded in literature and data, the framework identifies distinct place types, defined by their economic and social conditions. This enables a structured and systematic assessment of how the relationship between DCMS infrastructure and economic performance varies across locations.
- It constructs a novel, consolidated data set to support the analysis. Drawing on web scraping and extensive data collection, the study maps the geographic distribution and density of DCMS assets at the LAD level and combines these with indicators of supporting infrastructure and economic development. No comparable data set previously existed at this level of granularity, enabling systematic comparison across places and over time.
- Given the analytical framework and newly constructed data set, the analysis explores the interaction between DCMS asset density and mix, social infrastructure, and economic outcomes across place types. It also evaluates the appropriateness of a range of empirical methods in estimating the causal relationship between DCMS asset density and economic outcomes.
5.1. Implications of findings
Overall, the empirical findings reveal that areas with high DCMS asset density and a wide variety of DCMS assets have more favourable economic outcomes than areas with less asset density and variety. The findings further suggest that a strong DCMS infrastructure is more closely associated with productivity than employment outcomes.
5.2. Limitations
The available data do not provide sufficient temporal coverage or variation to support well-identified causal econometric estimates. In particular:
- The current data set does not extend further back than 2017 due to a lack of available historical DCMS asset data and the difficulty in mapping historical local authority boundaries onto current LAD geographies. This relatively short time horizon limits the ability to observe meaningful changes in asset distributions (such as the relocation of an important infrastructure asset).
- Over the observed period, most variation in DCMS asset density occurs across LADs rather than within LADs. As a result, panel fixed effects models rely on a relatively small share of the available variation. This reduces statistical power and means that estimated coefficients and ‘within’ R-squared values are expected to be small or imprecisely estimated. This limitation could lessen over time as more data becomes available.
- The data set draws on OpenStreetMap, where assets are added voluntarily over time. While the fixed effects framework controls for nationwide increases in mapping activity, it cannot account for differences in mapping intensity across LADs. If mapping activity varies systematically with local economic performance, this may introduce omitted variable bias. For example, if faster-growing areas are mapped more actively, estimated density effects may be biased upward; if mapping expands more in declining areas, coefficients may be biased downward.
- The data set only captures one aspect of DCMS assets, density, which is only one of several potential channels through which DCMS infrastructure may contribute to economic outcomes. Density measures the spatial concentration of assets, but does not reflect differences in scale, quality, investment value, or intensity of use. Areas with similar densities may differ substantially in the economic significance of their infrastructure.
Together, these constraints limit the extent to which the current analysis can identify causal effects of DCMS asset density on economic outcomes. Therefore, these results should be interpreted as descriptive associations rather than causal relationships.
5.3. Relevance for further research
This study establishes a strong foundation for further econometrics analysis. It creates a baseline data set from which longer time series can be developed and identifies distinct place types that can structure future quasi-experimental work, thereby strengthening causal inference.
A key next step would be to extend the DCMS asset data set further back in time by exploring alternative data sources. With sufficient time coverage, causal analysis could be advanced using quasi-experimental approaches such as synthetic control methods. Where a clear intervention or catalyst event can be identified (for example, the introduction or relocation of major DCMS infrastructure), the established place typology could support identifying credible comparison areas. In cases involving a single treated place, a synthetic control approach could construct a weighted combination of similar areas to approximate the counterfactual trajectory.
Beyond extending the time series, future work could also enrich the measurement of DCMS infrastructure (for example, building on the Bennet Institute’s 2025 work in measuring social infrastructure). Asset density captures spatial concentration but does not reflect differences in scale, investment value, quality, or intensity of use. Incorporating additional measures, such as asset size, visitor numbers, funding levels, and usage and engagement indicators, could provide a more nuanced understanding of how DCMS infrastructure contributes to economic outcomes. Where possible, greater spatial granularity could further improve precision and help identify more localised effects that may be obscured at the current geographic scale.
Annex A
A.1 Identification of DCMS assets from Open Street Map
As discussed in Section 2.2, this study uses a rapid evidence review to identify assets and categorise them into the Department for Digital, Culture, Media and Sport (DCMS) asset groups.
The list of theoretically identified assets is cross-checked against the list of assets that can be counted in OpenStreetMap (OSM). After identifying all the relevant DCMS assets, this study categorises them into asset groups.
Some assets can belong to multiple asset groups. However, for the empirical analysis, a primary asset group is identified (highlighted in the table).
Table 15 presents a full list of DCMS assets and asset groups.
Table 15 List of all DCMS assets as identified from OSM
| DCMS Asset Tag (based on OSM) | Identified asset groups |
|---|---|
| community_centre | Civic* |
| social_centre | Civic* |
| arts_centre | Culture* and creative |
| cinema | Culture* |
| gallery | Culture* and tourism |
| museum | Culture*, heritage, and tourism |
| music_venue | Culture*, creative, and tourism |
| theatre | Culture*, creative, and tourism |
| library | Culture* and civic |
| archaeological_site | Heritage* and tourism |
| castle | Heritage* and tourism |
| fort | Heritage* and tourism |
| monument | Heritage* and tourism |
| ruins | Heritage* and tourism |
| tomb | Heritage* and tourism |
| studio | Creative* |
| bowling_alley | Sport* |
| disc_golf_course | Sport* |
| fitness_centre | Sport* |
| golf_course | Sport* and tourism |
| ice_rink | Sport* |
| pitch | Sport* |
| sports_centre | Sport* |
| sports_hall | Sport* |
| stadium | Sport* and tourism |
| swimming_pool | Sport* |
| track | Sport* |
| aquarium | Tourism* |
| conference_centre | Tourism* |
| exhibition_centre | Tourism* and culture |
| information | Tourism* |
| theme_park | Tourism* |
| water_park | Tourism* |
| zoo | Tourism* |
| swimming_area | Tourism* and sport |
Source: Frontier Economics categorisation based on the OSM Wiki.
Note: Assets are listed in the exact format used by OSM tags. ‘*’ marks the primary asset groups used for empirical analysis.
A.2 Literature review and longlist for supporting infrastructure
Supporting infrastructure refers to the complementary factors that enable the DCMS infrastructure to generate local economic and social impacts.
A rapid literature review identifies a longlist of relevant infrastructure types. This list is then narrowed down based on the infrastructure types’ contribution to growth, complementarity with DCMS assets, spatial variation, and data availability.
Literature review
This section shows the literature reviewed to identify the supporting infrastructure that enables DCMS infrastructure to drive economic and social outcomes.
- Department for Environment, Food & Rural Affairs (DEFRA). ‘Drivers of rural firm productivity growth’ (viewed on 19 May 2026)
- Department for Digital, Culture, Media and Sport (DCMS), and Department for Levelling Up, Housing and Communities (DLUHC). ‘Rapid evidence review of community initiatives’ (viewed on 19 May 2026)
- Frontier Economics report for ICON. ‘Report for the Neighbourhoods Commission’ (viewed on 19 May 2026)
- His Majesty’s Government. ‘UK infrastructure: a 10 year strategy’ (viewed on 19 May 2026)
- Frontier Economics report for Local Trust. ‘The impacts of scaling social infrastructure investment’ (viewed on 19 May 2026)
- Frontier Economics report for Digital, Culture, Media & Sport (DCMS). ‘Understanding the growth potential of creative clusters’ (viewed on 19 May 2026)
- Yijia Zhang and Lu Cheng. ‘Infrastructure and regional development’ (viewed on 19 May 2026)
- The British Academy. ‘Social Infrastructure Programme’ (viewed on 19 May 2026)
Longlist of supporting infrastructure
The list below presents the longlist of supporting infrastructure identified through the literature review, reflecting the range of factors relevant to growth and for DCMS infrastructure to generate impact.
The framework narrows down this list to a smaller set of key, tangible infrastructure types (such as transport) for which consistent data can be collected across local areas. Read Section 2.4 for more information on supporting infrastructure.
- co-working and innovation spaces
- natural capital
- existing creative clusters
- water infrastructure and flood resilience
- transport links
- housing
- commercial real estate (beyond co-working or innovation spaces)
- digital connectivity (for example, broadband)
- access to healthcare
- energy networks
- education and skills (for example, schools, colleges, and universities)
- law enforcement (for example, courts, prisons and police presence)
- innovation (for example, R&D, business investment, and entrepreneurial activity)
- export-linkages
- access to finance (especially early-stage)
- neighbourhood-led regeneration programmes
- active and engaged communities
- local governance and institutions
- in-migration (for example, arrival of workers from other places)
- quality of life factors not considered so far (for example, crime)
A.3 Data on supporting infrastructure
As discussed in Section 2.4, this study considers supporting infrastructure to have an enabling role for DCMS infrastructure.
The study compiles an extensive data set of supporting infrastructure data from a large number of sources for empirical analysis. Table 16 below lists the relevant supporting infrastructure indicators used in this study, along with the specific variables used to measure them.
Table 16 List of all supporting infrastructure indicators used in the study
| Supporting infrastructure | Indicator used | Source |
|---|---|---|
| Transport connectivity | Average travel time to work by public transport or walking | ONS |
| Transport connectivity | Mean distance between public transport locations and DCMS assets | Frontier analysis based on OSM data |
| Transport connectivity | Percentage of people who are ‘well connected’ | DfT |
| Digital connectivity | Percentage of premises with full-fibre coverage | Ofcom |
| Digital connectivity | Percentage of premises with gigabit-capable coverage | Ofcom |
| Co-working and innovations spaces | Count of coworking spaces | Frontier analysis based on OSM data |
| Access to natural capital | Natural capital area per capita | Frontier analysis based on OSM data |
| Housing | Number of dwellings per capita | MHCLG |
| Housing | Median house-price-to-earnings ratio | ONS |
| Active and engaged communities | Percentage of people engaging in civic participation in the past month | Community Life Survey |
| Active and engaged communities | Percentage of people who chatted to neighbours in the last month | Community Life Survey |
| Active and engaged communities | Percentage of people who have volunteered in the last month | Community Life Survey |
| Active and engaged communities | Percentage of people perceiving a good neighbourhood connection | Community Life Survey |
| Skills and learning | Count of Russell Group universities | Russell Group |
| Skills and learning | Percentage of people achieving GCSEs by age 19 | ONS |
| Coastal water quality | Average bathing coastal water quality | Environment Agency |
Source: Sources of specific data are indicated in the ‘Source’ column.
A.4 Overlaps between place-types
As discussed in Section 2.5 of this study, a local authority may belong to multiple place types. This is a feature of the empirical application of the place-typology, and it is preserved to provide additional variation in the empirical analysis.
Table 17 summarises all binary overlaps between place types by showing the number of local authorities that belong to 2 place types simultaneously.
It is also possible for a local authority to belong to more than 2 place types. However, this is very rare and thus is not shown here.
Table 17 Overlaps between place-types
| Creative clusters | Towns close to large cities with housing shortages | Emerging hotspots for short-term tourism | Large cities with low population density | Doubly disadvantaged places | |
|---|---|---|---|---|---|
| Creative clusters | Not applicable | 7 | 9 | 8 | 12 |
| Towns close to large cities with housing shortages | 7 | Not applicable | 12 | 0 | 9 |
| Emerging hotspots for short-term tourism | 9 | 12 | Not applicable | 7 | 34 |
| Large cities with low population density | 8 | 0 | 7 | Not applicable | 8 |
| Doubly disadvantaged places | 12 | 9 | 34 | 8 | Not applicable |
Source: Frontier Economics’ analysis, based on the place-typology defined in Section *2.5*.
Note: Doubly disadvantaged places are defined for England only due to data availability.
A.5 Additional descriptive statistics
This section includes further descriptive information across place types.
As discussed in Section 3.3, Figures 14 through 25 show the distribution of assets across place types for each asset category, alongside the distribution of supporting infrastructure across place types.
These results indicate that patterns of concentration vary across asset categories. Creative, cultural, and heritage assets tend to be more concentrated, whereas civic, sports, and tourism assets tend to be less concentrated. The figures also demonstrate that the provision of supporting infrastructure varies across place types.
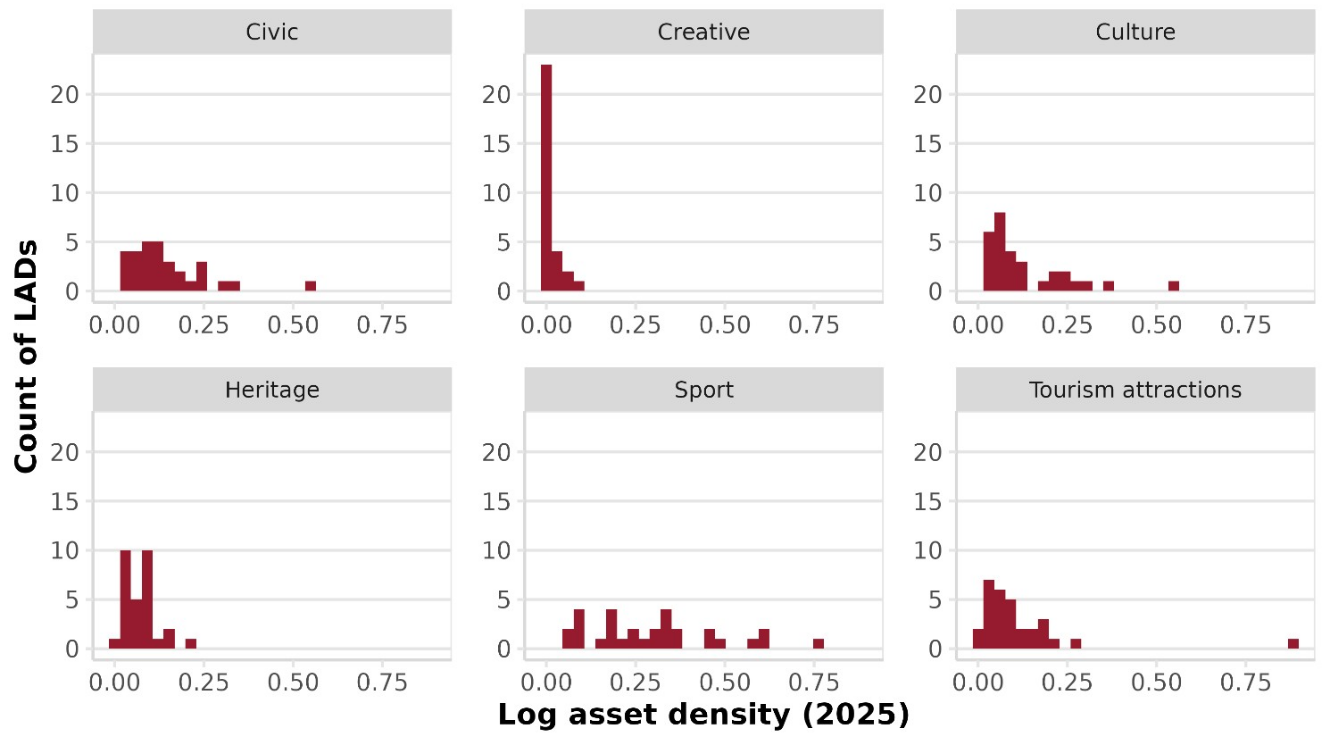
Figure 14 Distribution of asset density by asset type for ‘Large cities with low density, 2025’
Source: Frontier Economics.
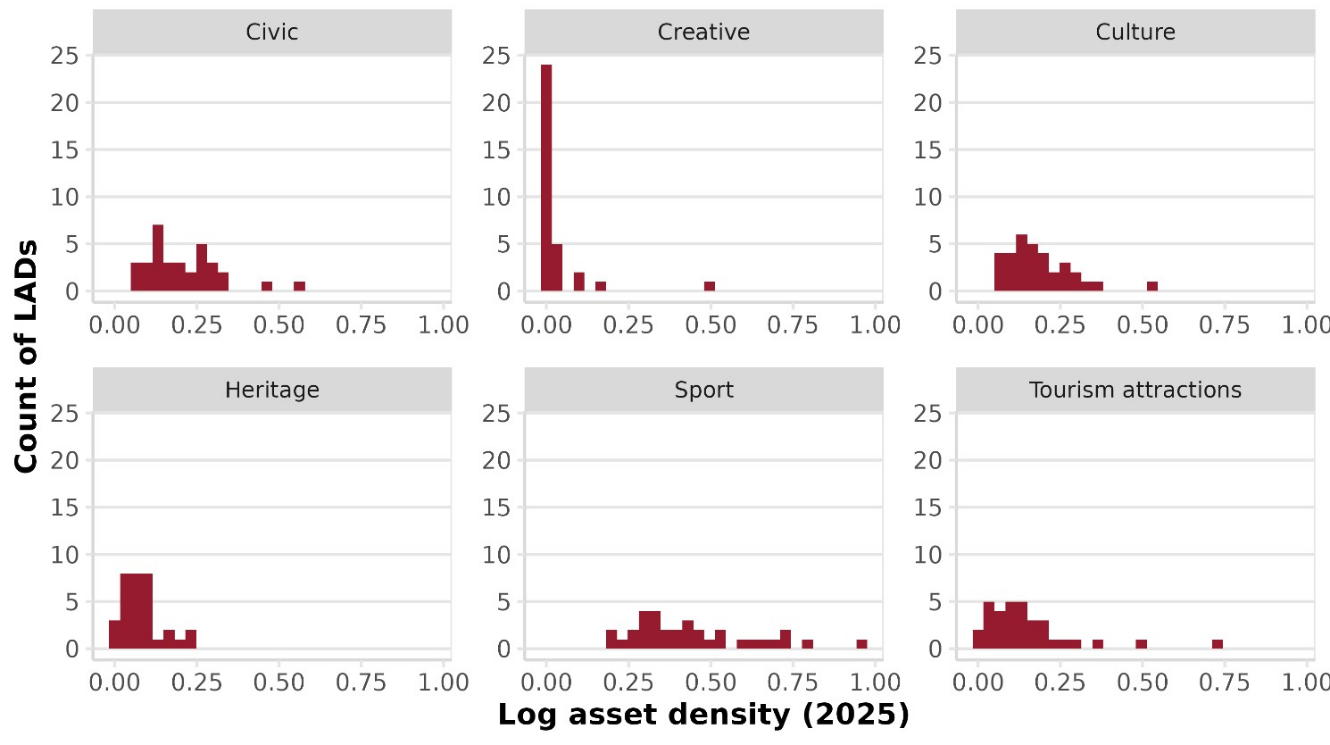
Figure 15 Distribution of asset density by asset type for ‘Towns close to large cities with housing shortages, 2025’ Source: Frontier Economics.
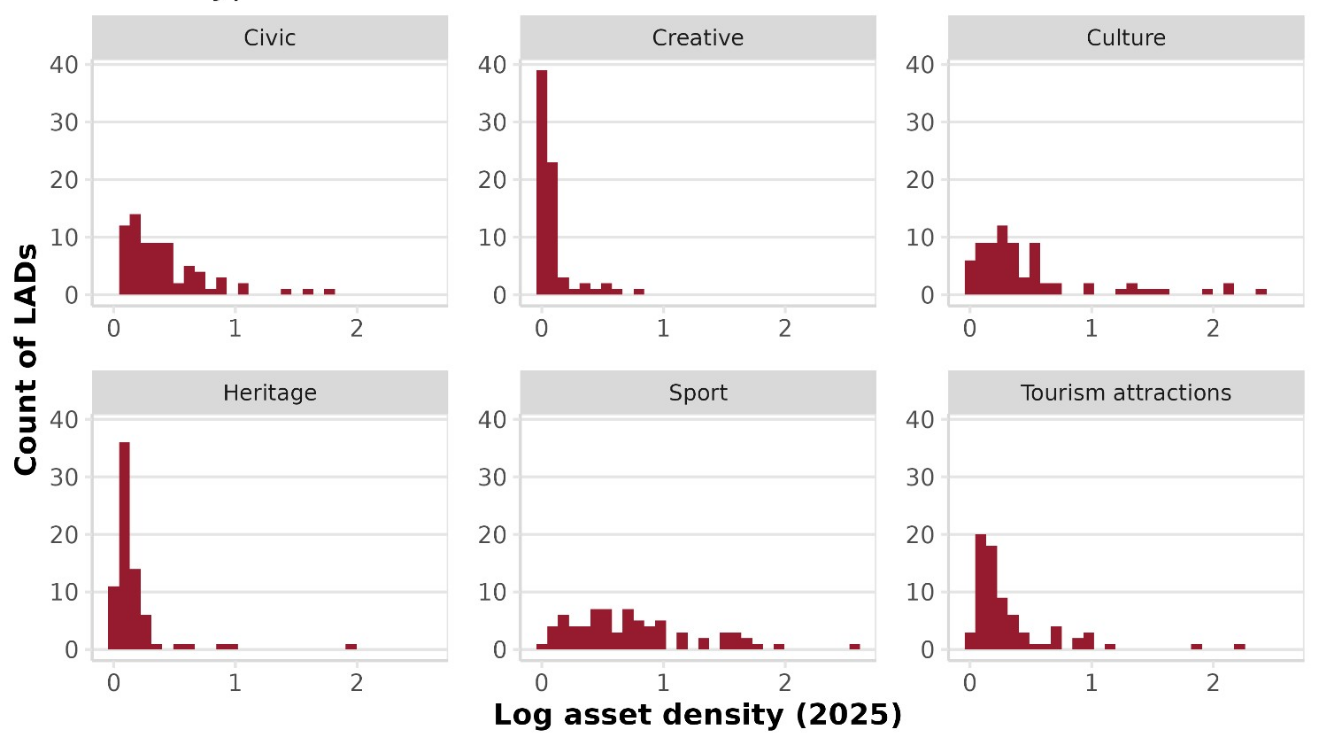
Figure 16 Distribution of asset density by asset type for ‘Creative clusters, 2025’
Source: Frontier Economics.
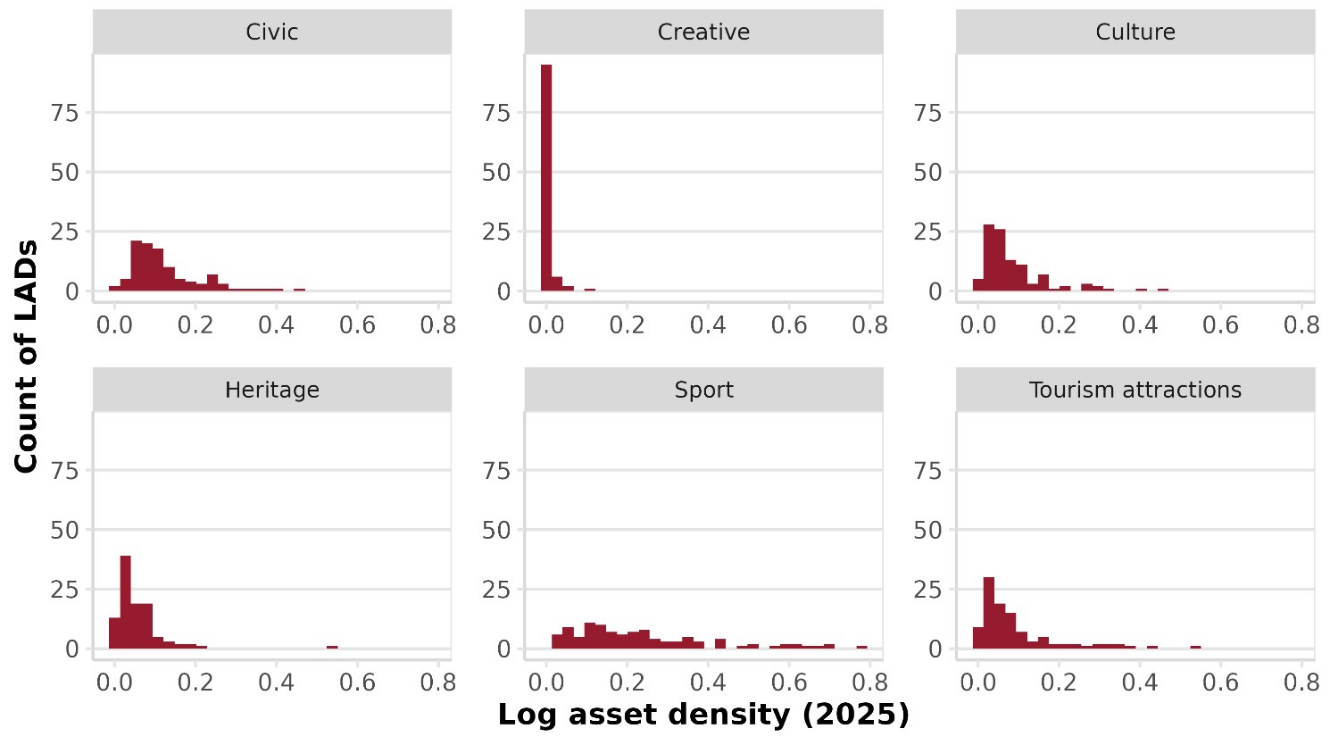
Figure 17 Distribution of asset density by asset type for ‘Emerging hotspots for short-term tourism, 2025’
Source: Frontier Economics.
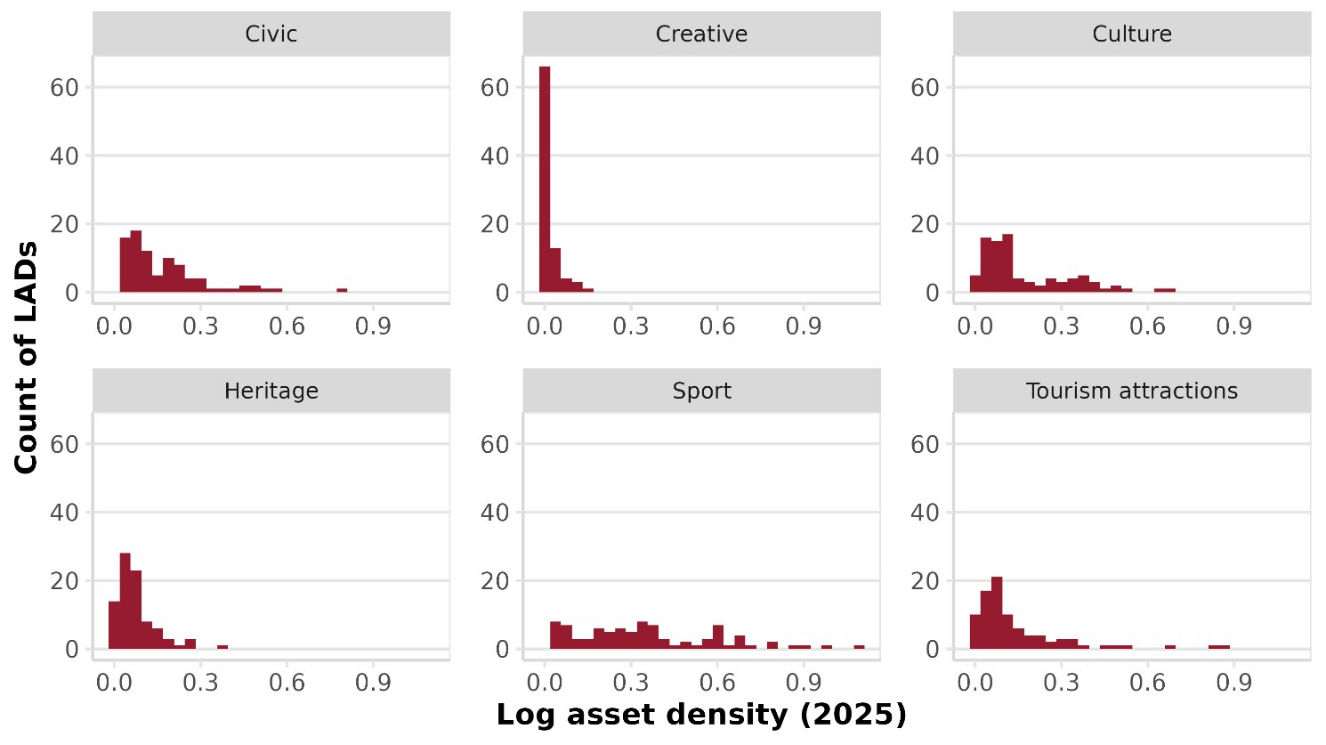
Figure 18 Distribution of asset density by asset type for ‘Doubly disadvantaged places, 2025’
Source: Frontier Economics.
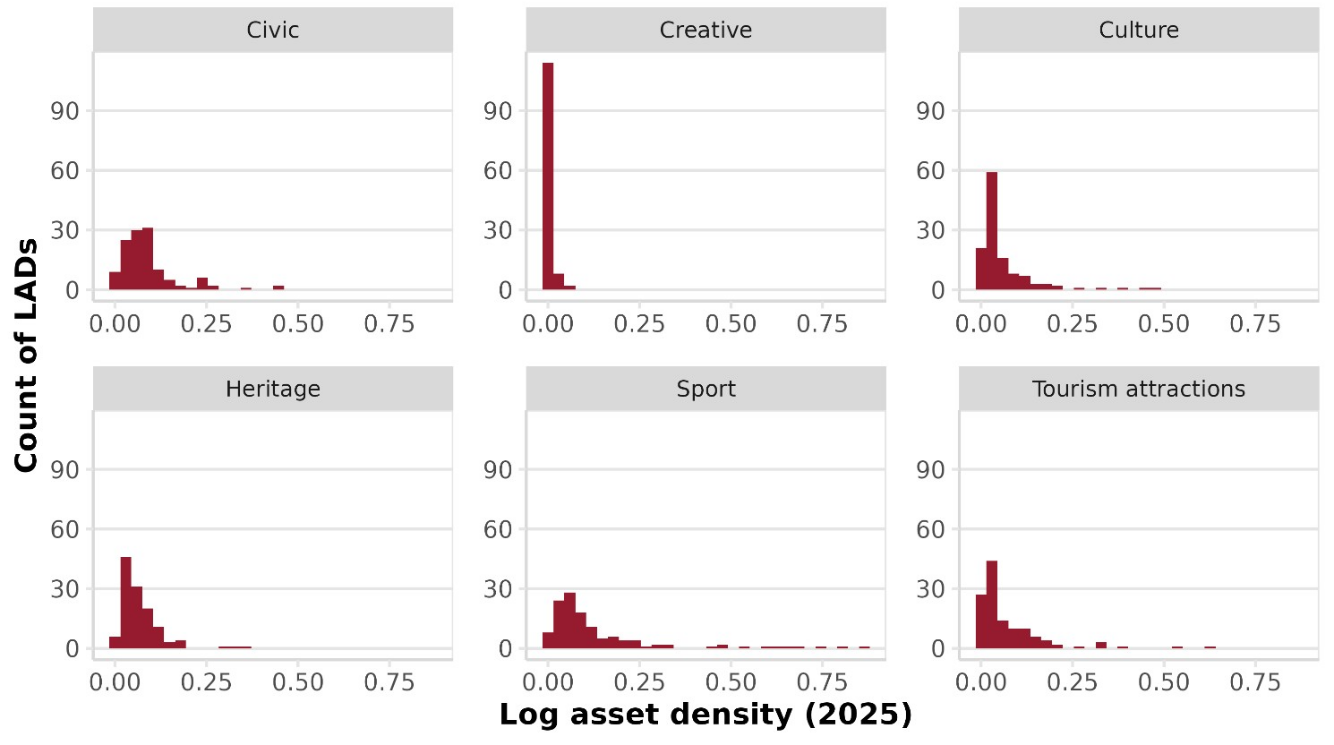
Figure 19 Distribution of asset density by asset type for ‘Other places, 2025’
Source: Frontier Economics.
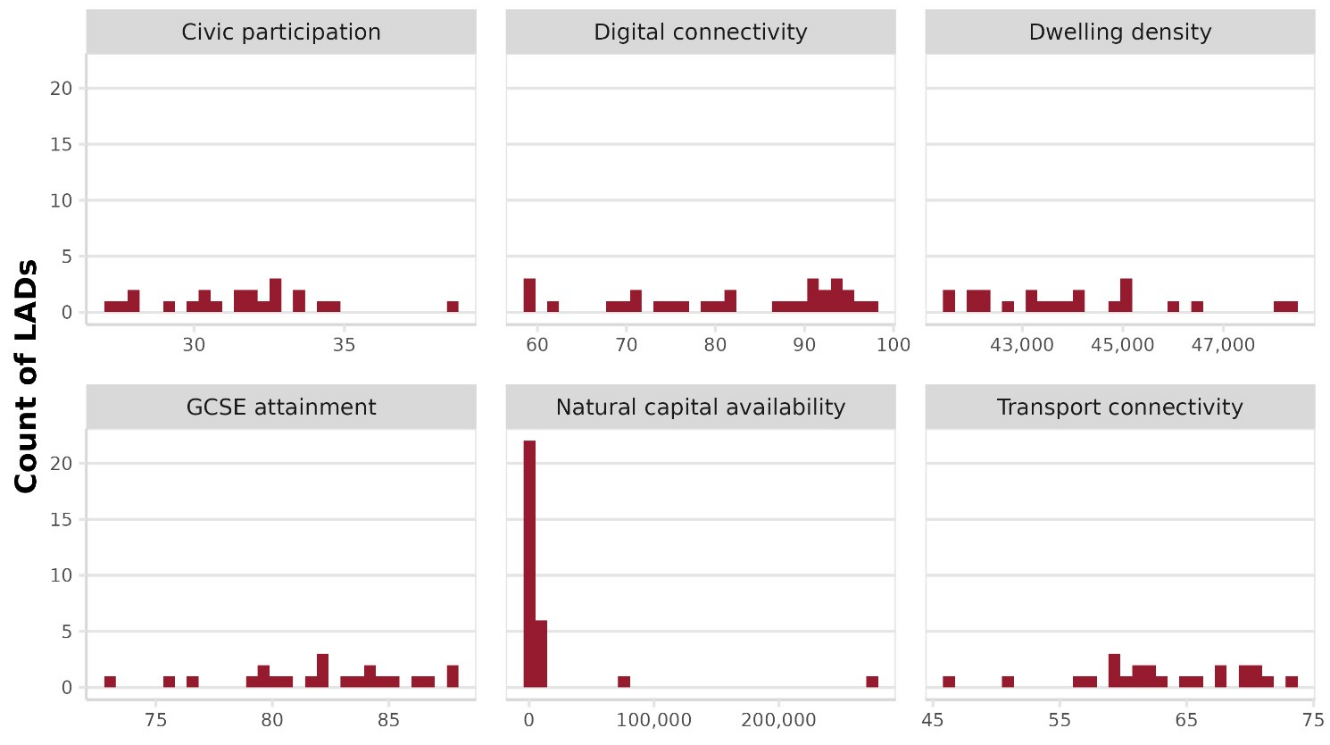
Figure 20 Distribution of supporting infrastructure for ‘Large cities with low density’
Source: Frontier Economics.
Note: See Section 3.3 for definitions of each supporting infrastructure variable (on the horizontal axis).
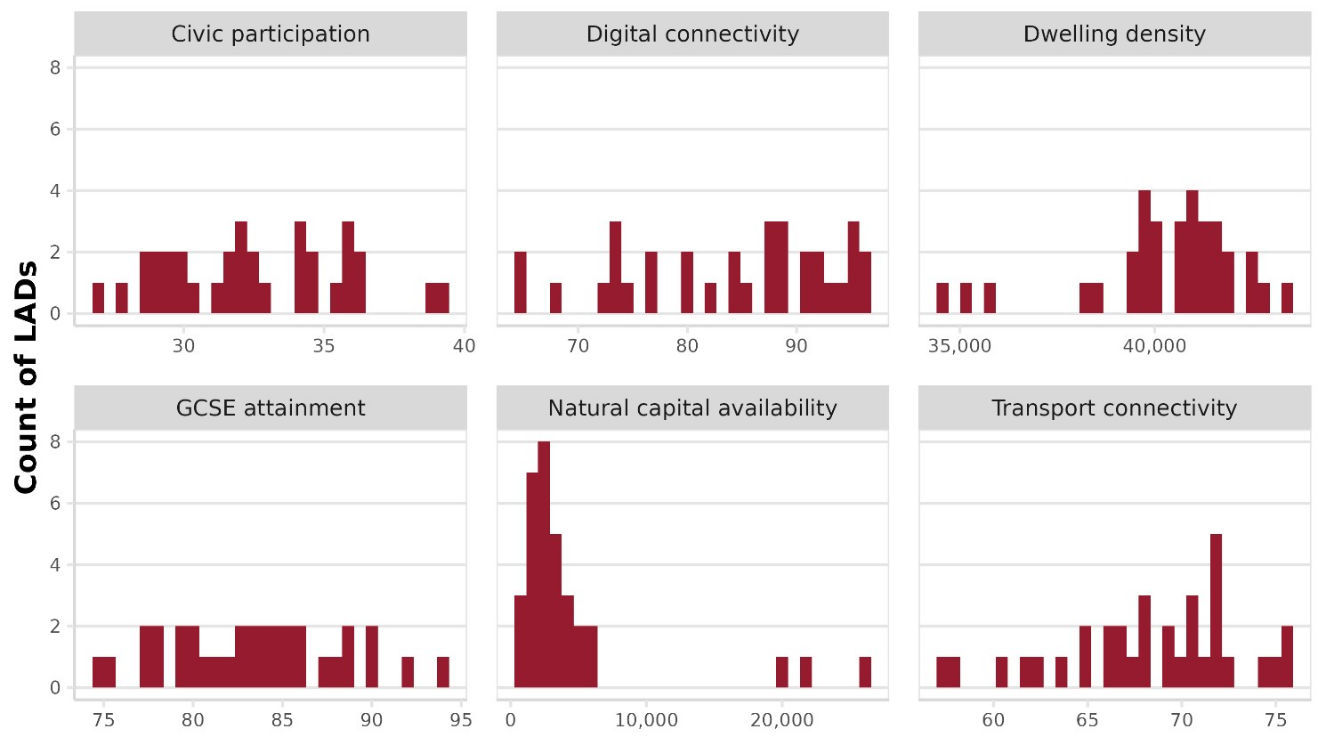
Figure 21 Distribution of supporting infrastructure for ‘Towns close to large cities with housing shortages’
Source: Frontier Economics.
Note: See Section 3.3 for definitions of each supporting infrastructure variable (on the horizontal axis).
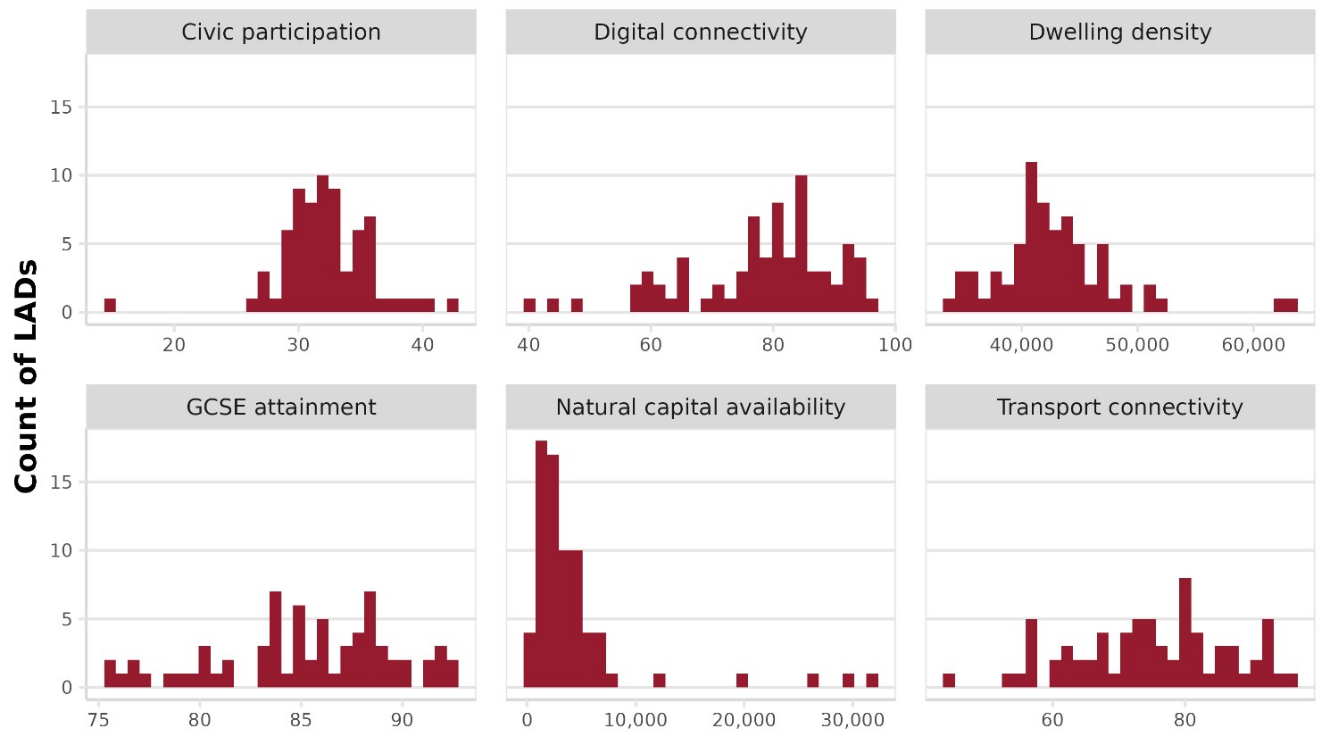
Figure 22 Distribution of supporting infrastructure for ‘Creative clusters’
Source: Frontier Economics.
Note: See Section 3.3 for definitions of each supporting infrastructure variable (on the horizontal axis).
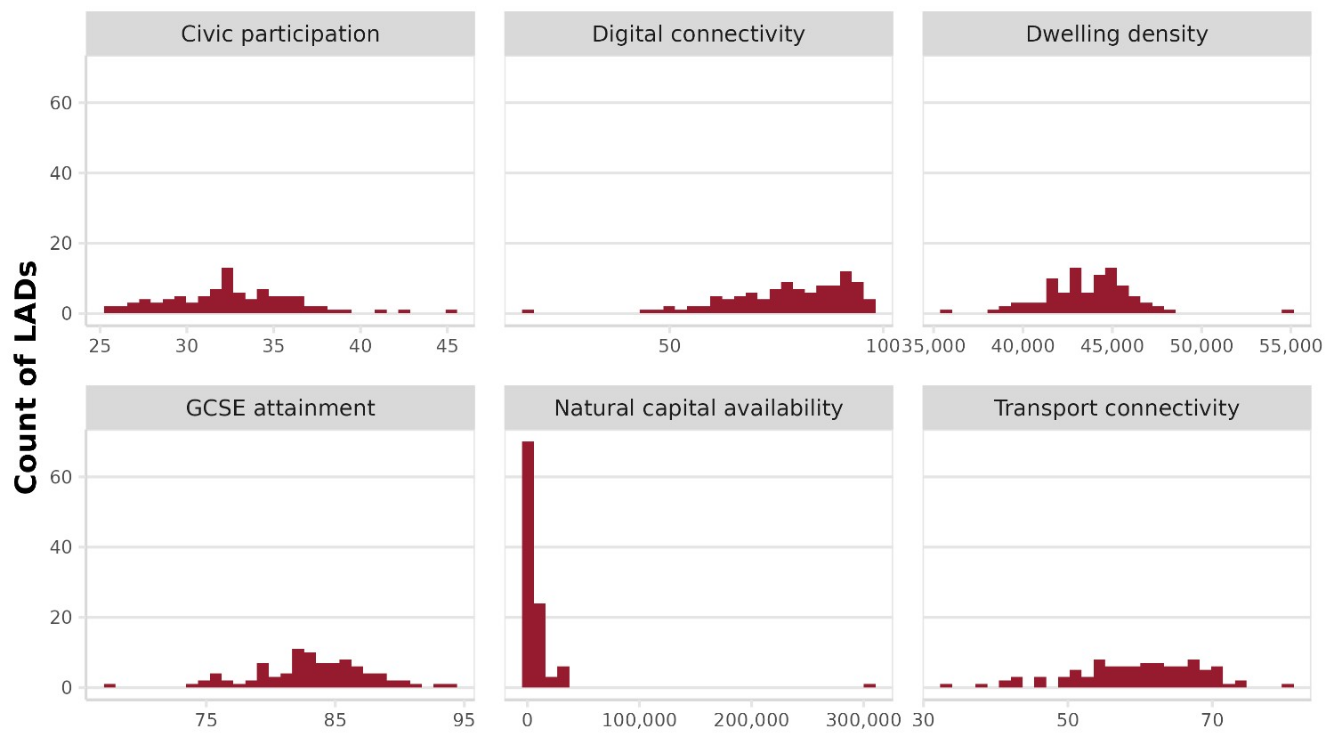
Figure 23 Distribution of supporting infrastructure for ‘Emerging hotspots for short-term tourism’
Source: Frontier Economics.
Note: See Section 3.3 for definitions of each supporting infrastructure variable (on the horizontal axis).
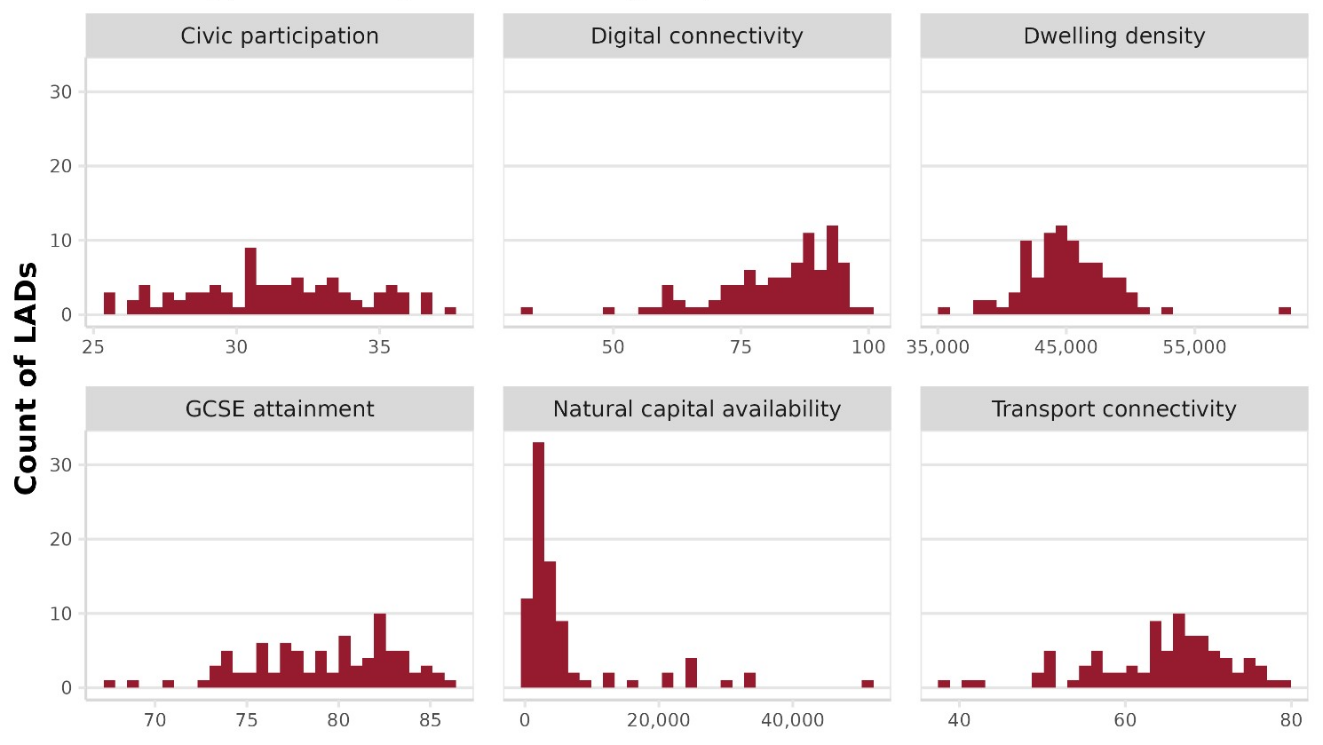
Figure 24 Distribution of supporting infrastructure for ‘Doubly disadvantaged places’
Source: Frontier Economics.
Note: See Section 3.3 for definitions of each supporting infrastructure variable (on the horizontal axis).
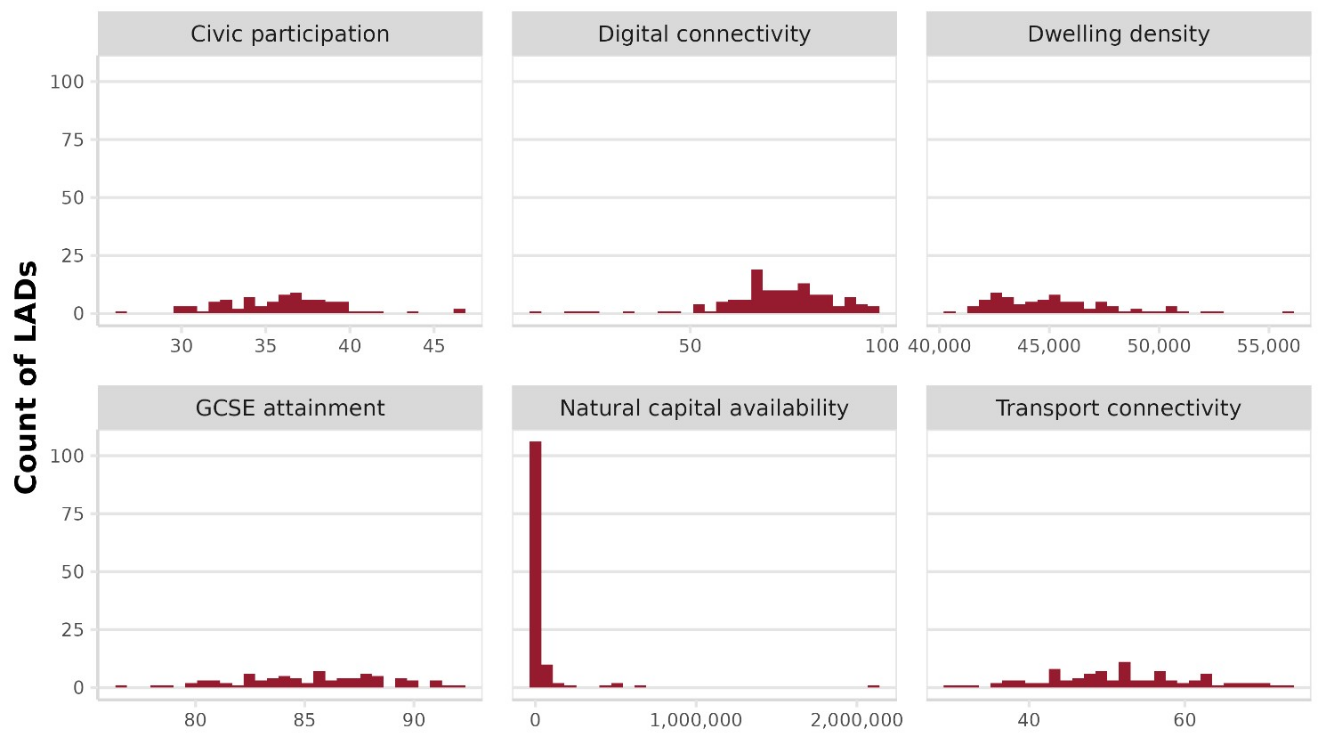
Figure 25 Distribution of supporting infrastructure in ‘Other places’
Source: Frontier Economics.
Note: See Section 3.3 for definitions of each supporting infrastructure variable (on the horizontal axis).
Table 18 shows the median employment level by place type in 2024.
Table 18 Median employment across place types, 2024
| Variable | Large cities with low density (30 LADs) | Towns close to large cities with housing shortages (33 LADs) | Creative clusters (73 LADs) | Emerging hotspots for short-term tourism (104 LADs) | Doubly disadvantaged places (87 LADs) | Other places (124 LADs) |
|---|---|---|---|---|---|---|
| Total employment (2024) | 99,060 (N=28) | 88,010 (N=33) | 121,325 (N=73) | 55,670 (N=103) | 68,920 (N=87) | 51,148 (N=116) |
A.6 Technical details and full results of the econometric modelling
In this section, the full technical details of the cross-sectional and panel analyses, as well as results from a wider selection of models, are discussed.
Panel data analysis
As discussed in Section 4, the panel data analysis uses a 2-way fixed-effects model to control for unobserved yearly shocks and pre-existing within-local-authority conditions. This involves running the following regression specification:
lnYi,t-lnYi,t-1=αi+λt+β’lnXi,t-1+ϵit
Where:
- lnYi,t – lnYi,t-1 is the yearly growth in the economic outcomes
- αi are the local authority fixed effects
- λt are the yearly fixed effects
- Xi,t-1 are the DCMS asset densities (either as a total density or as sector densities)
- ϵit is the year – local authority specific error term
The reported coefficient of interest is β.
Section 4 presents the results from specifications with Yi,t specified as employment, DCMS sectors employment, and non-DCMS sectors employment. Table 19 presents the results from a further specification with Yi,t specified as GVA and GVA per worker, respectively.
As with models that use employment as the dependent variable, the ‘within’ local authority variation remains the key limitation of this approach. However, there are some significant results. The impact of total DCMS asset density on both GVA and GVA per worker is positive and significant.
Additionally, there is a positive and significant impact of heritage asset density on GVA and creative asset density on both GVA and GVA per worker. This suggests that DCMS assets have a more significant impact on GVA and productivity, consistent with the results in Section 4 and findings from the wider literature.
Table 19 Results of the baseline panel data models on further economic outcomes
| (1) GVA: Total density | (2) GVA: Sector densities | (3) GVA per worker: Total density | (4) GVA per worker: Sector densities | |
|---|---|---|---|---|
| Total density | 0.081*** (0.026) | Not applicable | 0.004* (0.002) | Not applicable |
| Sport density | Not applicable | 0.050 (0.038) | Not applicable | 0.002 (0.003) |
| Civic density | Not applicable | 0.067 (0.050) | Not applicable | 0.006 (0.004) |
| Culture density | Not applicable | -0.084 (0.084) | Not applicable | -0.009 (0.007) |
| Heritage density | Not applicable | 0.184** (0.087) | Not applicable | 0.006 (0.006) |
| Creative density | Not applicable | 0.136** (0.065) | Not applicable | 0.019*** (0.006) |
| Tourism density | Not applicable | 0.036 (0.061) | Not applicable | 0.000 (0.005) |
| N observations | 1480 | 1480 | 1480 | 1480 |
| Adjusted R2 | 0.505 | 0.507 | 0.210 | 0.213 |
| Within R2 | 0.010 | 0.017 | 0.004 | 0.012 |
| Fixed effects | LAD + year | LAD + year | LAD + year | LAD + year |
Source: Frontier Economics’ analysis, based on data described in Section 3.1.
Note: Standard errors are in brackets and are calculated at the local authority level. * p < 0.1, ** p <0.05, *** p < 0.01.
Further, in Section 4, a potential issue is discussed with DCMS infrastructure having a long-term rather than an instantaneous impact on economic performance. To test for this, further lags of DCMS asset densities are included, which results in the following regression specification:
lnYi,t-lnYi,t-1=αi+λt+β1’lnXi,t-1+β2’lnXi,t-2+β3’lnXi,t-3+ϵit
With all variables being defined as before, and the coefficients of interest being β1, β2, and β3. It is not advisable to test all of the coefficients individually. This is because of the multiple hypothesis testing problem: when too many coefficients are tested, some will appear significant purely by chance. That is why the long-term impact is instead modelled and tested as the sum of the 3 lag coefficients (in line with standard econometric modelling practices described by Baltagi [2011]). The results are again robust, only partially, because the ‘within’ variation is not sufficient to have a lot of statistical power. Table 20 presents the results for all 5 economic outcomes.
Because of the multiple hypothesis testing, it is important to interpret the results jointly. For example, if the impact of a certain density is significantly positive on GVA but negative and insignificant on GVA per worker, this reduces the robustness of the first finding.
With this approach in mind, the only consistently significant impact is the positive impact of creative asset density on GVA and GVA per worker. There is some indicative evidence of negative long-run associations between certain asset types and employment outcomes (for example, in sports, tourism, and heritage assets). These patterns may reflect measurement limitations or some degree of substitution across activities, and should be interpreted with caution.
Table 20 Results of the panel data model with further DCMS asset density lags
| (1) Total employment | (2) DCMS employment | (3) non-DCMS employment | (4) GVA | (5) GVA per worker | |
|---|---|---|---|---|---|
| Sport density | 0.026 (0.064) | -0.084*** (0.122) | 0.052 (0.061) | 0.111 (0.123) | 0.003 (0.006) |
| Civic density | -0.061 (0.081) | 0.172 (0.148) | -0.089 (0.078) | -0.046 (0.134) | 0.006 (0.010) |
| Culture density | 0.190 (0.127) | 0.312 (0.221) | 0.137 (0.131) | -0.141 (0.203) | -0.036* (0.017) |
| Heritage density | -0.079 (0.112) | -0.220* (0.263) | -0.111 (0.125) | -0.051* (0.304) | 0.026 (0.024) |
| Creative density | -0.094 (0.146) | 0.147 (0.239) | -0.054 (0.124) | 0.243*** (0.279) | 0.051*** (0.022) |
| Tourism density | -0.108 (0.064) | -0.066 (0.130) | -0.111* (0.061) | 0.129 (0.140) | 0.008 (0.009) |
| N observations | 1184 | 1184 | 1184 | 888 | 888 |
| Adjusted R2 | -0.091 | -0.113 | -0.093 | -0.054 | -0.021 |
| Within R2 | 0.024 | 0.037 | 0.012 | 0.036 | 0.041 |
| Fixed effects | LAD + year | LAD + year | LAD + year | LAD + year | LAD + year |
Source: Frontier Economics’ analysis, based on data described in Section 3.1.
Note: The reported coefficients are a sum of the 3 lag coefficients. Standard errors are calculated at the local authority level, and the sum of 3 corresponding standard errors is reported in brackets. The significance of the rejection of the null hypothesis that the sum of the 3 lag coefficients is 0. * p < 0.1, ** p <0.05, *** p < 0.01.
Cross-sectional analysis
The cross-sectional analysis uses variation in DCMS asset densities between local authorities at a fixed point in time to estimate their economic impact. Using these models involves running the following specification:
lnYi=α+β’lnXi+πPi+θ’Zi+ϵi
Where:
- Yi is the difference between the economic outcome of interest in 2018 and in the newest data available
- Xi are the DCMS asset densities for various asset types
- Pi is the place type of a given local authority
- Zi are the supporting infrastructure indicators
This means the coefficients of interest are the sets of β coefficients.
The key advantage of this approach is the increase in ‘between’ LAD variation in DCMS asset densities, which gives the model increased statistical power. Additionally, the cross-sectional nature of the model allows for the inclusion of place types and supporting infrastructure variables.
Place types do not vary over time, and much of the supporting infrastructure has very little variation over time as well. This means that adding them to a panel data model would prevent the identification of the main effects. In the cross-sectional analysis, these limitations do not exist.
However, the cross-sectional analysis suffers from omitted variable bias. This is because it cannot control for pre-existing economic conditions in local authorities, which might influence both DCMS infrastructure levels and future economic outcomes, thus preventing causal estimation of the main effects. Additionally, it cannot control for unobservable factors (‘Time’ and ‘LAD’ fixed effects are used in the panel data approach).
Table 21 presents the results of this analysis. The results are generally consistent with the panel data analysis, as the impact of creative assets is the largest and most significant for employment metrics. Additionally, civic asset density has a significant positive impact on employment in DCMS sectors. Overall, however, these results cannot be reliably interpreted causally due to the omitted variable bias. Nevertheless, they provide an indication of the basic underlying relationships between DCMS infrastructure and economic outcomes.
Table 21 Results of the cross-sectional analysis model
| (1) Total employment | (2) DCMS employment | (3) non-DCMS employment | (4) GVA | (5) GVA per worker | |
|---|---|---|---|---|---|
| Sport density | -0.007 (0.006) | -0.007 (0.009) | -0.008 (0.006) | -0.014* (0.008) | -0.001 (0.001) |
| Civic density | 0.011 (0.009) | 0.028*** (0.011) | 0.007 (0.009) | 0.019 (0.015) | 0.000 (0.001) |
| Culture density | -0.002 (0.010) | -0.010 (0.016) | 0.001 (0.009) | 0.000 (0.016) | 0.000 (0.001) |
| Heritage density | 0.007 (0.016) | 0.009 (0.015) | 0.004 (0.017) | 0.005 (0.020) | 0.001 (0.001) |
| Creative density | 0.073** (0.035) | 0.078 (0.050) | 0.071** (0.031) | 0.048 (0.071) | -0.002 (0.003) |
| Tourism density | 0.001 (0.008) | 0.002 (0.012) | 0.001 (0.008) | -0.007 (0.011) | -0.000 (0.001) |
| N observations | 277 | 277 | 277 | 277 | 277 |
| Adjusted R2 | 0.078 | 0.044 | 0.064 | 0.067 | -0.009 |
Source: Frontier Economics’ analysis, based on data described in Section 3.1.
Note: Standard errors in brackets are heteroskedasticity-robust. * p < 0.1, ** p <0.05, *** p < 0.01.
Place type interaction analysis
DCMS infrastructure is expected to have different impacts across various place types. To test this, this study estimates both cross-sectional and panel models with interaction effects between place types and DCMS asset densities. Specifically, this involves estimating the following 2 regressions:
For panel data models:
lnYi,t-lnYi,t-1=αi+λt+πlnXi,t-1+j∈1;5βjlnXi,t-1*1i=j+ϵit
And for cross-sectional models:
lnYi=α+πlnXi+j∈{1;5}βjlnXi*1(i=j)+θ’Zi+ϵi
In both models, the variables are defined as in the basic models without interaction terms, with 2 changes. Firstly, λt represents the ITL2 level fixed effect rather than the LAD fixed effect. This is because place types are collinear with LADs, and therefore, the interaction terms could not be estimated with LAD fixed effects.
The second change is the addition of 1(i=j) which is a dummy variable equal to 1 if a certain local authority belongs to a given place type and 0 otherwise. That means in both models the coefficients of interest are β1,…,β5, which measure the impact of DCMS asset density in a given place type relative to the baseline, which consists of local authorities that do not belong to any place types (remaining places).
Because it is necessary to estimate the interaction between DCMS asset density and each place type, this analysis uses only the total DCMS asset density, rather than the sectoral breakdown used in other models. This is to prevent computing too many coefficients and allows for more reliable estimation.
Section 4 presents the results for total and DCMS employment. This Annex extends this analysis, and Table 22 presents the results for GVA and GVA per worker. As with the models in Section 4, the results show a consistent, positive, and significant impact of DCMS asset density in creative clusters. This suggests that the effect of DCMS infrastructure on economic activity is higher in creative clusters than in other locations.
Table 22 Results of place-type interactions analysis
| (1) GVA: Cross-sectional model | (2) GVA: Panel data model | (3) GVA per worker: Cross-sectional model | (4) GVA per worker: Panel data model | |
|---|---|---|---|---|
| Total density | -0.003 (0.006) | -0.004 (0.004) | 0.000 (0.00) | -0.002 (0.003) |
| Total density x large low-density cities | -0.017 (0.030) | 0.005 (0.007) | -0.002 (0.002) | 0.005 (0.008) |
| Total density x towns neighbouring poor housing | -0.005 (0.014) | 0.007 (0.009) | -0.000 (0.001) | 0.003 (0.009) |
| Total density x creative clusters | 0.008 (0.008) | 0.011** (0.005) | -0.000 (0.001) | 0.011*** (0.004) |
| Total density x places with tourism potential | -0.009 (0.009) | -0.008 (0.007) | -0.001 (0.001) | -0.005 (0.006) |
| Total density x doubly disadvantaged places | 0.004 (0.005) | 0.003 (0.005) | 0.000 (0.000) | 0.001 (0.004) |
| N observations | 277 | 1776 | 277 | 1776 |
| Adjusted R2 | 0.057 | 0.066 | -0.004 | 0.103 |
| Within R2 | Not applicable | 0.003 | Not applicable | 0.004 |
| Fixed effects | Not applicable | ITL2 + year | Not applicable | ITL2 + year |
Source: Frontier Economics’ analysis, based on data described in Section 3.1.
Note: Standard errors in brackets are heteroskedasticity-robust. * p < 0.1, ** p <0.05, *** p < 0.01.
-
Heritage assets such as archaeological sites, castles, forts, monuments, ruins, and tombs are included within the scope, as the built infrastructure, preservation systems and visitor facilities associated with them are human-made and policy-relevant. ↩
-
Proximity allows businesses to share infrastructure and suppliers, match more efficiently with skilled labour, and benefit from knowledge spillovers through collaboration and informal interaction. ↩
-
There is a small number of assets (<1%) for which the tags have changed over time. This means they might be miscategorised in the final data set for some years. We accept this as one of the limitations of using OSM data, as it is very difficult to identify these mistakes. ↩
-
In large, sparsely populated LADs, assets may be widely dispersed, requiring longer travel distances and implying lower effective provision despite a small population base. Density per population can overstate provision in such areas. ↩
-
The advantage of using GCSE attainment over other metrics, such as level 4+ qualification data, includes that (i) GCSE attainment is less likely to be economically-determined (for example, due to better local economic performance), (ii) attainment data provides consistent spatial coverage and comparability, and (iii) it measures universal, baseline skills. ↩