Quarterly Survey for Q1 (April to June 2026)
Published 3 September 2026
Applies to England

© Crown copyright 2026
This publication is licensed under the terms of the Open Government Licence v3.0 except where otherwise stated. To view this licence, visit nationalarchives.gov.uk/doc/open-government-licence/version/3 or write to the Information Policy Team, The National Archives, Kew, London TW9 4DU, or email: psi@nationalarchives.gov.uk.
Where we have identified any third party copyright information you will need to obtain permission from the copyright holders concerned.
This publication is available at https://www.gov.uk/government/publications/quarterly-survey-for-q1-april-to-june-2026/quarterly-survey-for-q1-april-to-june-2026
Introduction
1 - This quarterly survey report is based on regulatory returns from 195 private registered providers (PRPs) and PRP groups who own or manage more than 1,000 homes.
2 - The survey provides a regular source of information regarding the financial health of PRPs, in particular with regard to their liquidity position. The quarterly survey returns summarised in this report cover the period from 1 April 2026 to 30 June 2026.
3 - The regulator reviews each PRP’s quarterly survey. It considers a range of indicators and follows up with the PRP where a risk to 12-month liquidity is identified, or where there is a risk to loan covenant compliance. Further assurance is sought where there is increasing exposure to refinancing risk, or risks from activities carried out within non-registered entities. Findings will be reflected in regulatory judgements where appropriate.
4 - PRPs have a responsibility to both their current tenants, in ensuring that their homes are safe and decent, and to the more than one million people on housing waiting lists with an unmet housing need. PRPs need to be able to manage the risks and opportunities that are evolving around them and find innovative solutions to enable them to fulfil their ambitions without compromising financial viability.
5 - Figures have been rounded to the nearest £billion to one decimal place. This can result in rounding differences in totals and percentages as the individual returns are denominated in £000s.
Summary
Liquidity
PRPs continued to secure funding to support investment in new and existing stock, with total agreed facilities reaching £144.5bn during the quarter.
- 46 PRPs arranged new finance totalling £4.3 billion during the quarter, compared to an average of £3.4 billion per quarter over the last three years.
- Loan drawdowns of £10.6 billion are forecast over the next 12 months, of which £3.3 billion is from facilities not yet agreed.
- Loan repayments of £1.6 billion were made during the quarter, with PRPs forecasting a further £3.9 billion in repayments over the next 12 months.
- Cash balances reduced by 16% during the quarter to £3.4 billion (March: £4.1 billion). Cash balances are forecast to reduce to £3.2 billion by June 2027, with 72% of PRPs forecasting a net cash outflow during this period.
- Gross mark-to-market (MTM) exposure on derivatives increased to £177 million at the end of the quarter (March: £138 million).
Performance in the quarter
Further reductions in both quarterly and 12-month outturn cash interest cover (excluding sales), as interest and repairs costs remain at historically high levels.
- Quarterly cash interest cover (excluding sales, but including grant in respect of capitalised major repairs) stood at 59%.
- When grant funding is excluded, quarterly interest cover stood at 49% (March: 87%). Net operating cashflows were affected by large annual invoices such as insurance premiums.
- Total spend on repairs and maintenance in the quarter was £2.4 billion; 8% less than in the previous quarter, but 10% higher than in the same quarter of the previous year.
- Rolling 12-month interest cover (excluding grant) reduced to 76% (March: 79%), with the median reducing to 86% (March: 92%).
- Forecast interest cover over the next 12 months stands at 73% (including grant). When grant funding is excluded, forecast interest cover has reduced from 67% to 64%, due to an increase in forecast interest payable.
- Total current asset sales were £0.5bn in the quarter, a 40% decrease on previous quarter. In the year to June sales of £2.6 billion were achieved, compared to £2.9 billion in the year to June 2025.
Investment in new and existing stock
Outturn and forecast spend on repairs and maintenance continues to increase. Forecasts for development expenditure show a slight increase in investment.
- 12-month spend on repairs and maintenance totalled £9.7 billion; 6% higher than in the year to June 2025, and 18% higher than in the year to June 2024.
- Forecast 12-month repairs and maintenance spend has increased to £11.1 billion, an increase of 15% compared to actual spend in the year to June 2026.
- Annual spend on development totalled £13.1 billion, compared to £13.6 billion in the year to June 2025.
- Development spend in the quarter amounted to £3.1 billion, compared to a total of £3.4 billion in the quarter to June 2025 and £3.5 billion in the quarter to June 2024.
- Total 12-month forecast development has increased to £16.0 billion (March 12-month forecast: £15.1 billion); the fifth consecutive quarter where forecasts have increased. This includes £5.1 billion relating to uncommitted development – an increase of 16%, and the highest level in three years.
- Forecasts for development grant have reduced by 9% to £2.7 billion (March forecast: £3.0 billion) although remain relatively high in comparison to the quarterly average over the last three years of £2.5 billion.
Sales
AHO completions have decreased by 38% in the quarter; the lowest amount achieved in 6 years. Market sale completions reduced by 50% and are at the lowest level in over 10 years.
- AHO sales decreased by 26% in the quarter to 3,337 units and remain below the three-year average. The margin on AHO sales increased in the quarter to 13.3% although remain at historically low levels.
- The 18-month sales pipeline figures for both AHO and market sale have increased from previous quarter.
- Non-social housing sales generated proceeds of £1.1 billion in the quarter – the highest amount ever recorded. This is driven by a large PRS sale.
- The overall margin on total asset sales stood at 8%; the lowest level recorded since reporting began.
- In the 12 months to June 2026 fixed asset sales totalled £4.9 billion; 44% higher than in the year to June 2025.
- For the 12 months to June 2027 a further £4.9 billion worth of fixed asset sales has been forecast. This includes £2.6 billion relating mainly to bulk sales of both social housing and non-social housing assets.
Operating environment
Economic environment
6 - Consumer Price Index (CPI) inflation in the UK fell from 3.3% in the 12 months to March 2026 to 2.6% in the 12 months to June 2026. Monthly CPI increased by 0.1% in June 2026, compared with 0.7% in March 2026. Lower transport inflation was a key contributor to the decline in the headline rate.
7 - Conflict continues in the Middle East, bringing uncertainty to global oil and energy prices, with petrol and diesel costs fluctuating during the period. The wider economic consequences of the conflict have the potential to adversely affect the social housing sector.
8 - The Bank of England (BoE) expects inflation to rise this year, driven in part by energy price rises linked to the Middle East conflict. Energy prices have fallen since the initial spike but remain high due to uncertainty with the war. The BoE base rate has remained at 3.75%, with a continued commitment to return inflation to the 2% target in the medium term.
9 - The average interest rate for a typical 5-year mortgage stood at 4.65% in June 2026, up from 4.42% in March. Mortgage approvals for house purchases reduced to 58,200, down from 63,500 in March 2026, below the average of 61,400 over the previous 6 months.
10 - Annual house prices in England increased by 1.8% in the year to June 2026. The largest annual growth was experienced in the North West, where prices increased by 4.7% over the year. The lowest growth was in London, where prices decreased by 2.5%.
11 - The UK unemployment rate decreased 0.1% to 4.9% in the quarter to June 2026. The number of job vacancies in the quarter decreased by 7,000 to reach 712,000, this is the lowest quarterly level of vacancies since March 2021. The total number of people claiming Universal Credit in England was around 7.2 million in May 2026 compared to 6.7 million a year earlier, with the increase partly driven by the transition from legacy benefits.
Social housing landscape
12 - The King’s Speech on 13 May confirmed that the Government will bring forward legislation to support long-term investment in social housing. The Social Housing Bill was subsequently introduced to parliament on 14 May and includes proposals to reform Right to Buy schemes, introduce measures to protect existing social housing stock and safeguard vulnerable tenants.
13 - In July 2026, a new Prime Minister was appointed, with the new government in the process of establishing its priorities. Early signals indicate continued political focus on housing supply, and PRPs should continue to monitor the potential impact to their long-term plans.
14 - On 25 August 2026, the government and Homes England announced the first major allocations from the £39 billion SAHP 2026 to 2036. The initial £9.58 billion allocation will support 33 strategic partners to deliver around 73,600 social and affordable homes, with at least 60% required to be for Social Rent.
15 - The 2026 rent policy permits an annual rent increase of the Consumer Price Index (CPI) plus 1% for a period of ten years from April 2026. Rent convergence will be introduced from April 2027 for properties below formula rent, allowing additional weekly increases above the standard CPI + 1% cap, rising from £1 in 2027 to £2 from 2028 until formula rent is reached.
16 - The Social and Affordable Homes Programme 2026 to 2036, rent convergence, and targeted building safety funding, including the Cladding Safety Scheme extension announced on 9 July 2026, are intended to support long-term investment and promote greater regulatory certainty for PRPs. PRPs will need to operate within evolving frameworks, including the Decent Homes Standard, Minimum Energy Efficiency Standards (MEES), and Awaab’s law.
17 - PRPs should ensure their plans evolve in line with emerging opportunities and regulatory changes. It is essential that PRPs understand and manage any additional risks, identify potential liquidity and covenant constraints, and maintain robust contingency strategies.
18 - In June 2026, the regulator published a discussion document on the future of economic regulation, with a focus on how its regulation can help the sector deliver more and better social homes. The regulator has invited sector feedback ahead of a formal consultation on the revised economic standards in 2027.
Private finance
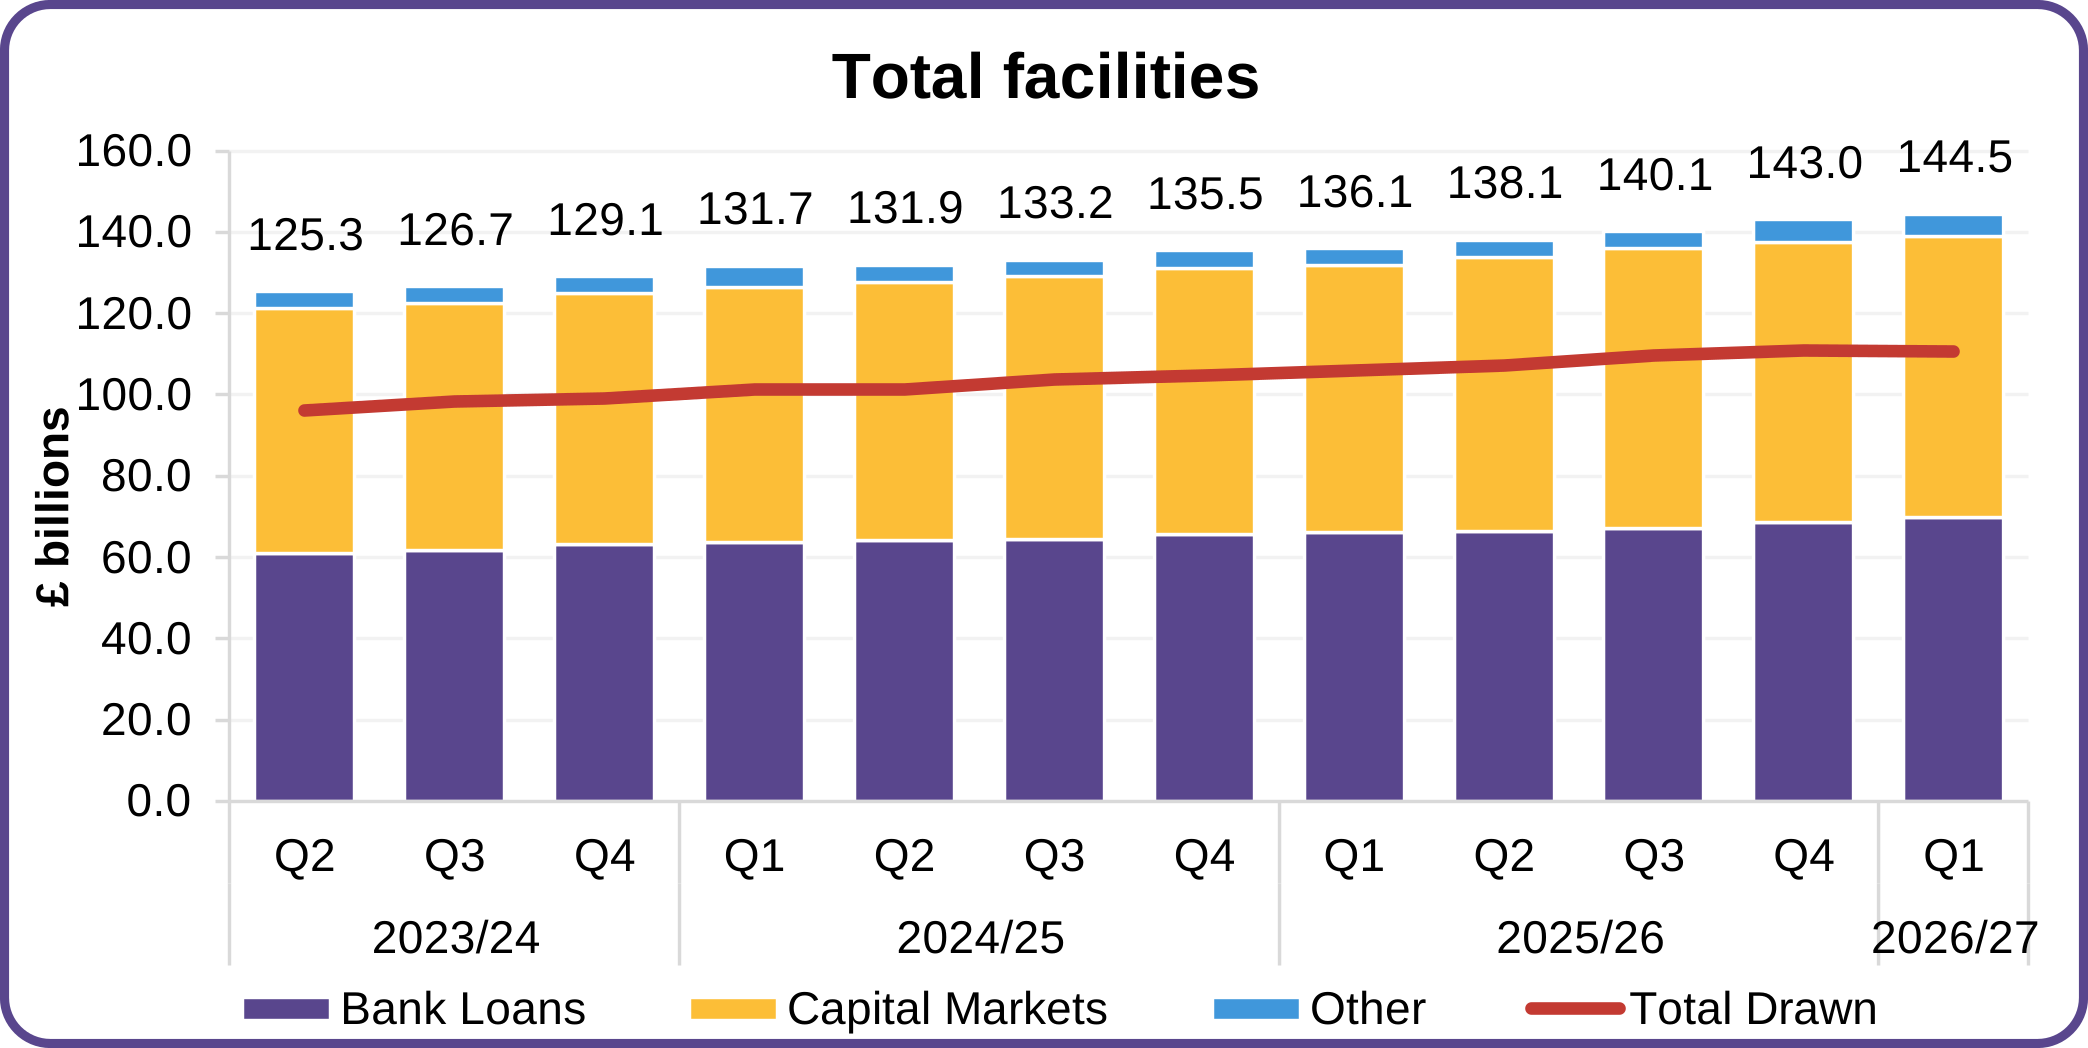
19 - The sector’s total agreed borrowing facilities increased by £1.4 billion over the quarter, to reach £144.5 billion at the end of June (March: £143.0 billion).
Figure 1: Total facilities (£ billions)
£bn
| Qtrs | Bank Loans | Capital Markets | Other | Total Facilities | Drawn Facilities |
|---|---|---|---|---|---|
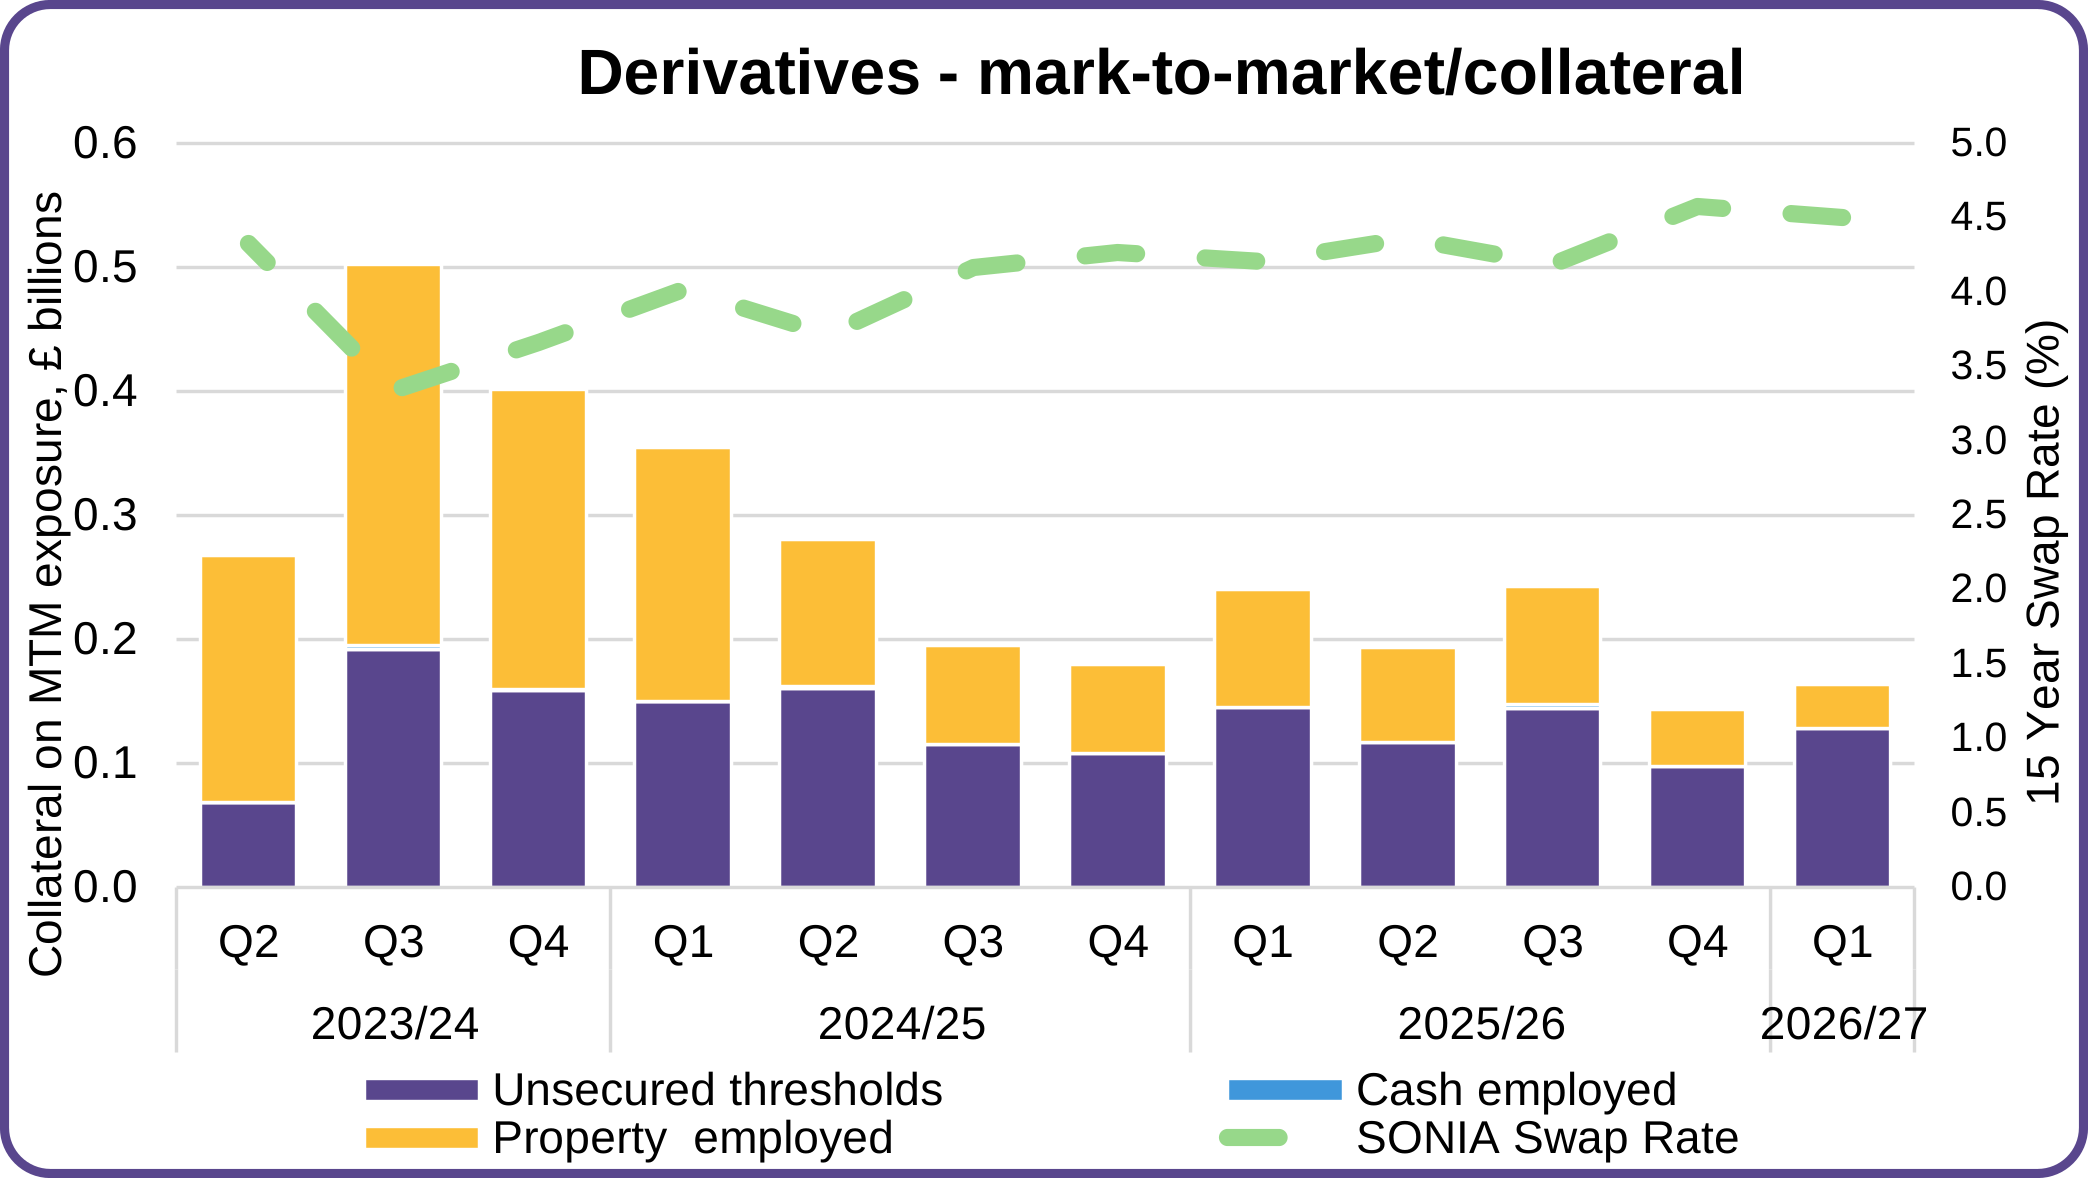
| 2026/27 - Q1 | 69.8 | 69.2 | 5.4 | 144.5 | 110.6 |
| 2025/26 - Q4 | 68.5 | 69.1 | 5.4 | 143.0 | 110.8 |
| 2025/26 - Q3 | 67.2 | 68.7 | 4.2 | 140.1 | 109.8 |
| 2025/26 - Q2 | 66.4 | 67.5 | 4.2 | 138.1 | 107.1 |
| 2025/26 - Q1 | 66.0 | 65.8 | 4.2 | 136.1 | 105.9 |
| 2024/25 - Q4 | 65.6 | 65.4 | 4.5 | 135.5 | 104.9 |
| 2024/25 - Q3 | 64.5 | 64.6 | 4.1 | 133.2 | 103.7 |
| 2024/25 - Q2 | 64.1 | 63.7 | 4.2 | 131.9 | 101.4 |
| 2024/25 - Q1 | 63.7 | 62.8 | 5.1 | 131.7 | 101.2 |
| 2023/24 - Q4 | 63.2 | 61.7 | 4.1 | 129.1 | 99.2 |
| 2023/24 - Q3 | 61.7 | 60.9 | 4.1 | 126.7 | 98.3 |
| 2023/24 - Q2 | 61.0 | 60.1 | 4.2 | 125.3 | 96.1 |
Table 1: Total facilities – drawn and secured
| £billions | Previous quarter | Current quarter | % change |
|---|---|---|---|
| Drawn | 110.8 | 110.6 | (0.2%) |
| Undrawn | 32.2 | 33.9 | 5.6% |
| Secured | 128.3 | 128.8 | 0.5% |
| Security required | 2.8 | 3.5 | 22.7% |
| Security not required | 12.0 | 12.2 | 1.7% |
20 - At the end of June, 99% of PRPs (March: 97%) were forecasting that debt facilities would be sufficient for 12 months or more.
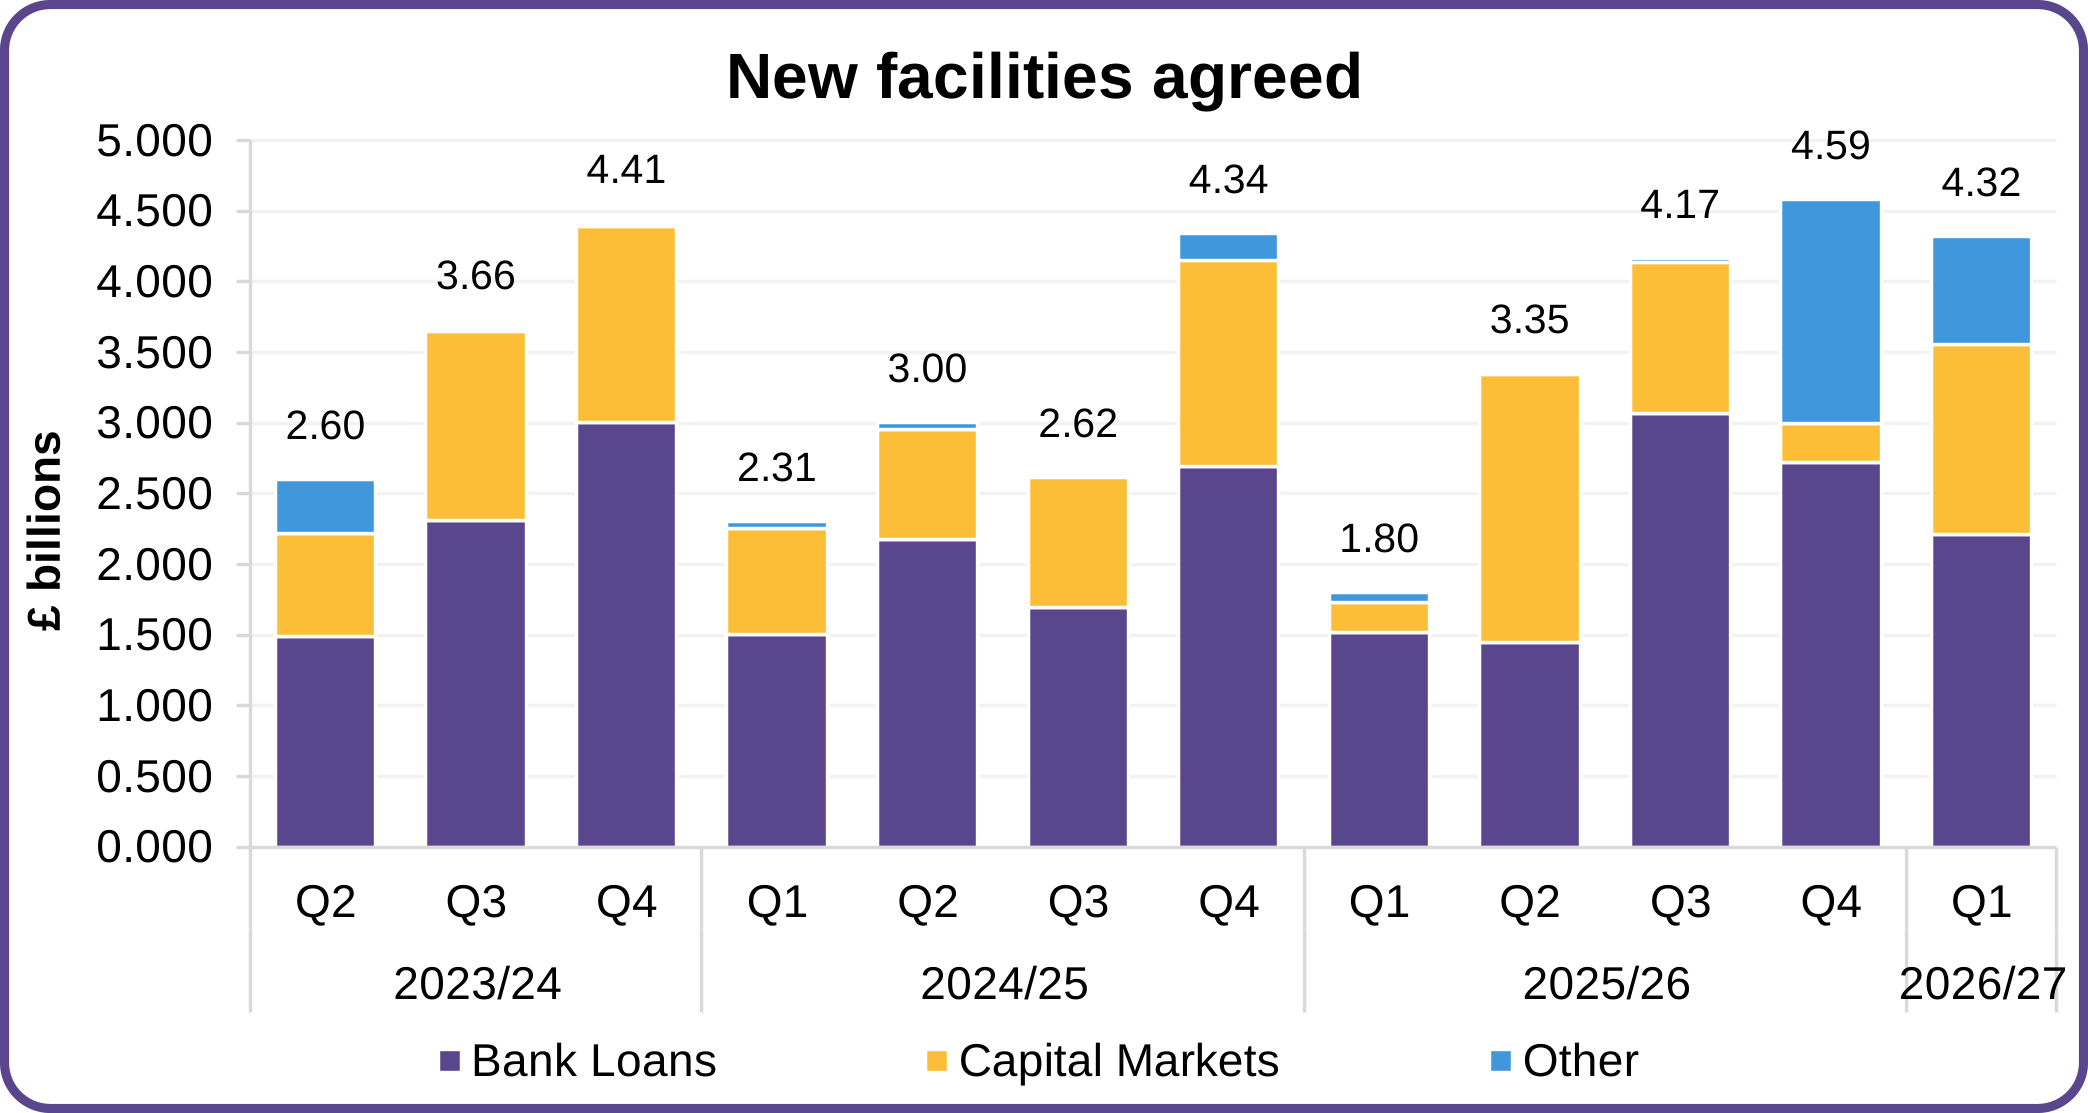
21 - A total of 46 PRPs arranged new finance during the quarter (March: 42), with 17 of these arranging facilities worth £100 million or more, and one provider arranging facilities over £400 million. The total agreed, including refinancing, amounted to £4.3 billion in the quarter (March: £4.6 billion); compared to an average of £3.4 billion per quarter over the last three years.
22 - Bank lending accounted for 51% (£2.2 billion) of new funding in the quarter. Capital market funding, including private placements and aggregated bond finance, accounted for 31% (£1.3 billion) of the total, an increase of £1.0 billion on the previous quarter. Other funding accounted for 18% (£0.8 billion) of the total (March: £1.6 billion). Two PRPs accounted for the £0.8 billion of other funding, through intra-group lending, with one of these PRPs refinancing more than £400 million.
Figure 2: New facilities agreed (£ billion)
£bn
| Qtrs | Bank Loans | Capital Markets | Other | Total Facilities |
|---|---|---|---|---|
| 2026/27 - Q1 | 2.21 | 1.35 | 0.76 | 4.32 |
| 2025/26 - Q4 | 2.72 | 0.28 | 1.59 | 4.59 |
| 2025/26 - Q3 | 3.07 | 1.06 | 0.03 | 4.17 |
| 2025/26 - Q2 | 1.45 | 1.90 | 0.01 | 3.35 |
| 2025/26 - Q1 | 1.52 | 0.21 | 0.07 | 1.80 |
| 2024/25 - Q4 | 2.70 | 1.46 | 0.19 | 4.34 |
| 2024/25 - Q3 | 1.70 | 0.92 | 0.00 | 2.62 |
| 2024/25 - Q2 | 2.18 | 0.78 | 0.05 | 3.00 |
| 2024/25 - Q1 | 1.51 | 0.75 | 0.06 | 2.31 |
| 2023/24 - Q4 | 3.01 | 1.39 | 0.02 | 4.41 |
| 2023/24 - Q3 | 2.31 | 1.34 | 0.01 | 3.66 |
| 2023/24 - Q2 | 1.49 | 0.73 | 0.38 | 2.60 |
23 - Aggregate undrawn facilities and cash increased from the previous quarter, with a total of £37.3 billion (March: £36.3 billion) available as at the end of June. This amount would be sufficient to cover the sector’s forecast expenditure on net interest costs (£5.1 billion), loan repayments (£3.9 billion) and net development for the next year (£13.3 billion), even if no new debt facilities were arranged and no sales income were to be received.
24 - Loan drawdowns of £2.1 billion were made during the quarter, which after repayments, resulted in a £0.2 billion net decrease in the value of drawn facilities. Drawn debt increased by £4.7 billion over the last 12 months, with a further increase of £6.7 billion forecast over the next 12 months.
Table 2: 12-month forecasts
| £billions | Previous quarter | Current quarter | % change |
|---|---|---|---|
| Drawdown from facilities agreed | 5.4 | 7.3 | 34.4% |
| Drawdown from facilities not yet agreed | 3.2 | 3.3 | 3.9% |
| Loan repayments | 3.5 | 3.9 | 11.3% |
| Net movement in drawn debt | 5.1 | 6.7 | 31.3% |
25 - Loan repayments of £1.6 billion were made during the quarter, above the quarterly average recorded over the last three years of £1.0 billion. PRPs report a range of reasons for repayment, including replacement facilities, reducing interest cost and managing liquidity needs to account for spending, in addition to contractually scheduled repayments. For the next twelve months, a further £3.9 billion worth of loan repayments are forecast to be made. Seven PRPs have each forecast over £150 million worth of loan repayments, together accounting for over half of the sector total.
Cashflows
26 - It is essential that PRPs have access to sufficient funds at all times. The regulator engages with PRPs that have low liquidity indicators. Table 3 below shows the actual performance for the quarter compared to forecast, and the 12-month performance for the year to June 2026.
Table 3: Summary cashflow performance[footnote 1]
| £billions[footnote 2] | 3 months to 30 June 2026 (forecast) | 3 months to 30 June 2026 (actual) | 12 months to 30 June 2026 (actual) |
|---|---|---|---|
| Operating cashflows excluding sales | 3.2 | 3.0 | 13.1 |
| Repairs & maintenance (capital & revenue) | (2.6) | (2.4) | (9.7) |
| Net operating cashflows excluding sales | 0.6 | 0.6 | 3.4 |
| Interest cashflows | (1.2) | (1.1) | (4.6) |
| Payments to acquire and develop housing | (4.0) | (3.1) | (13.1) |
| Current assets sales receipts | 0.7 | 0.5 | 2.6 |
| Disposals of housing fixed assets | 1.7 | 1.6 | 4.9 |
| Other cashflows | (0.1) | (0.1) | (0.5) |
| Cashflows before resources and funding | (2.3) | (1.7) | (7.2) |
| Financed by: | |||
| Net grants received | 0.9 | 0.8 | 2.9 |
| Net increase in debt | 0.4 | 0.2 | 4.3 |
| Use of cash reserves[footnote 3] | 1.0 | 0.7 | 0.0 |
| Total funding cashflows | 2.3 | 1.7 | 7.2 |
27 - Cash interest cover[footnote 4], based on net operating cashflows excluding all current asset and fixed asset sales, stood at 59% in the quarter to June 2026. From quarter one onwards, new disclosures within the quarterly survey return allow for the grant associated with capitalised major works to be separately identified, therefore this has now been included within the calculation of cash interest cover. This revised measure is consistent with the treatment of grant in the regulator’s Value for Money metrics[footnote 5], and recognises that PRPs have been able to accelerate certain capital works as government grant funding has been made available for this purpose. Grant receipts of £0.1 billion were recorded in the quarter, which includes funding from the Building Safety Fund, Cladding Safety Scheme, and Warm Homes: Social Housing Fund.
28 - When grant funding is excluded, cash interest cover stood at 49% in the quarter to June 2026. This is the lowest quarterly value recorded on this basis since cashflow data was first collected in 2015, and compares to 87% in the quarter to March. The reduction in interest cover compared to the previous quarter is wholly attributable to lower net operating cashflows, which at £3.0 billion, were £0.6 billion (18%) lower than the amount recorded in March. At £1.1 billion, net interest payable was consistent with the previous quarter, and repairs and maintenance costs were £0.2 billion lower, mainly due to a reduction in capitalised works.
29 - Net operating cashflows are subject to volatility due to the timing of creditor payments and rent receipts, and it is typical for cashflows to fall in the first quarter of the year as year-end accruals are settled, and large annual invoices, such as insurance premiums, I.T. licence fees and subscriptions, are paid. However, performance is significantly below that recorded in the comparable quarters of both 2025/26 and 2024/25, when interest cover stood at 61% and 67% respectively, due to higher overall repairs and interest costs.
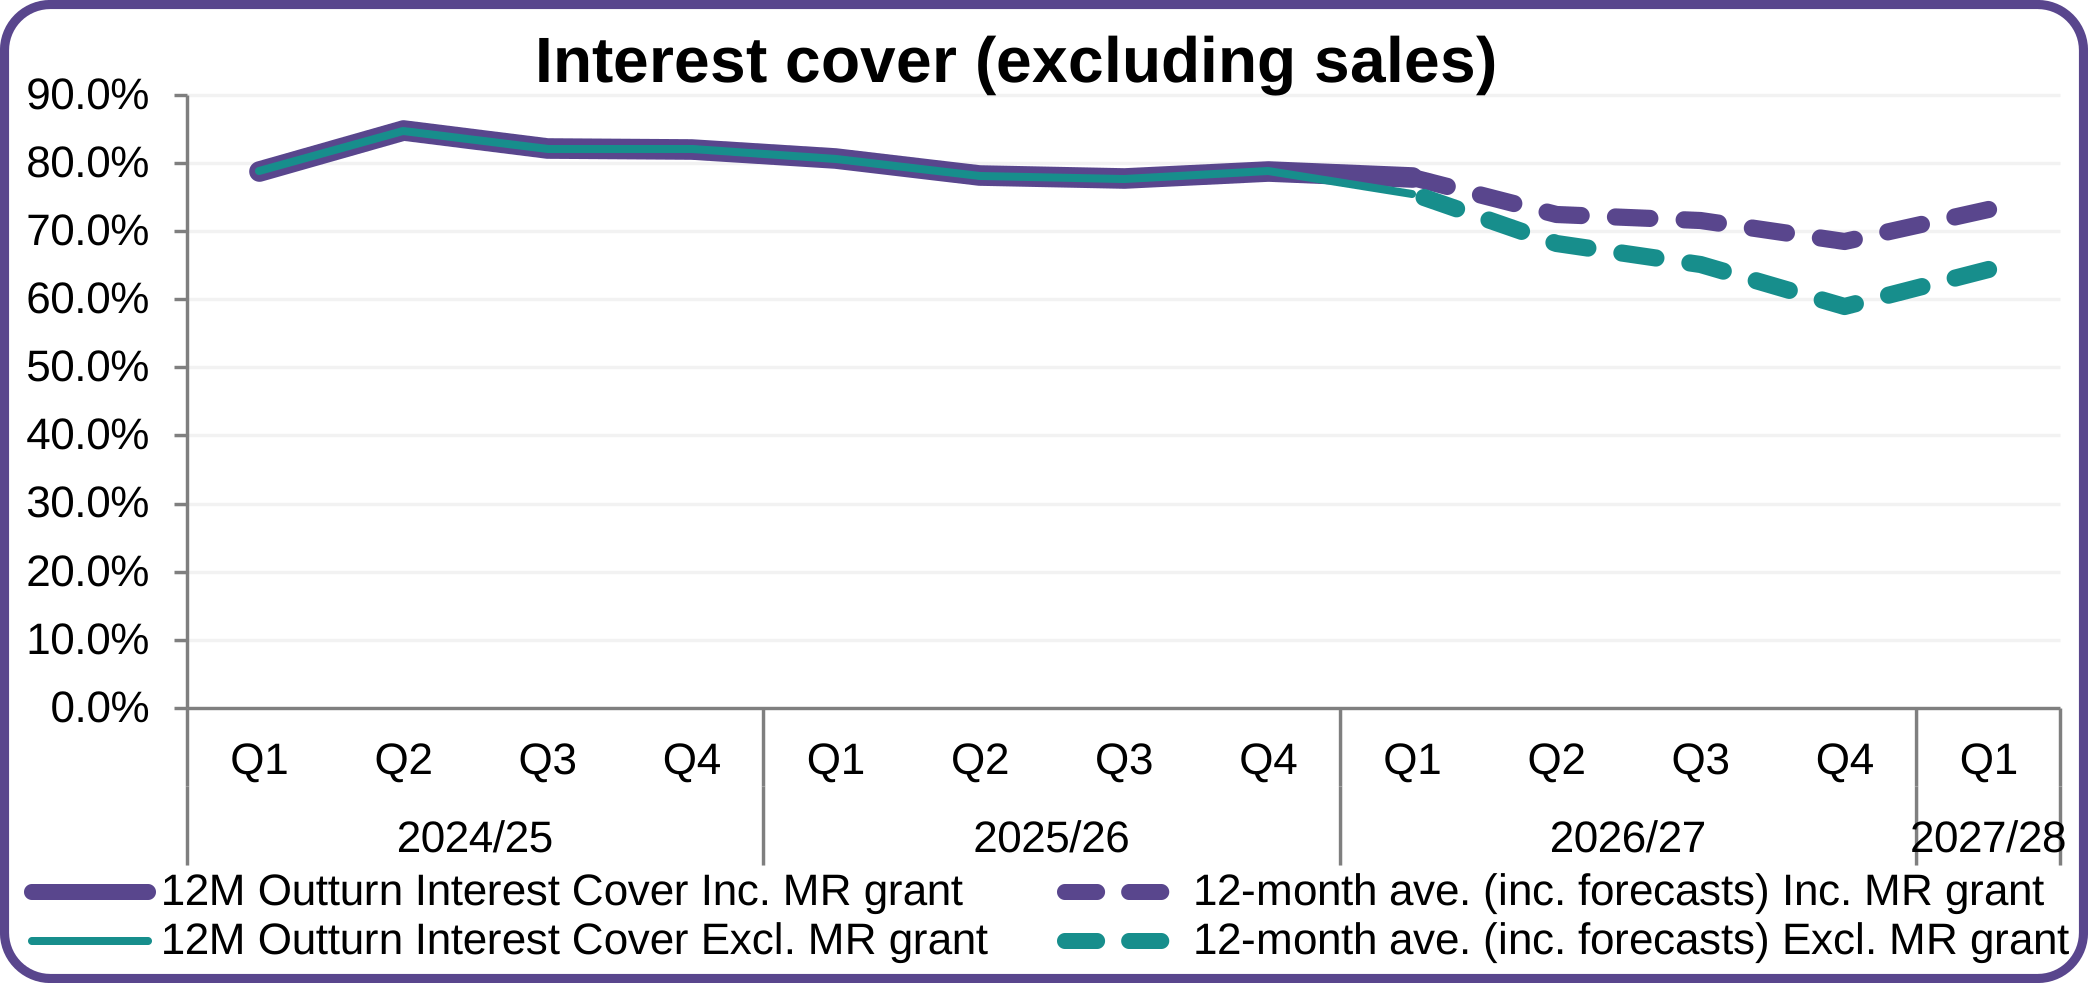
Figure 3: Interest cover from operating cashflows (excluding sales)
IC 12M Aggregate
| Qtrs | 12M Outturn Interest Cover Inc. MR Grant | 12-month ave. (inc. forecast data) Inc. MR Grant | 12M Outturn Interest Cover Excl. MR Grant | 12-month ave. (inc. forecast data) Excl. MR Grant |
|---|---|---|---|---|
| 2027/28 - Q1 | 0.0% | 73.3% | 0.0% | 64.4% |
| 2026/27 - Q4 | 0.0% | 68.6% | 0.0% | 59.1% |
| 2026/27 - Q3 | 0.0% | 71.7% | 0.0% | 65.2% |
| 2026/27 - Q2 | 0.0% | 72.6% | 0.0% | 68.3% |
| 2026/27 - Q1 | 78.0% | 75.6% | ||
| 2025/26 - Q4 | 78.9% | 78.9% | ||
| 2025/26 - Q3 | 77.8% | 77.8% | ||
| 2025/26 - Q2 | 78.3% | 78.3% | ||
| 2025/26 - Q1 | 80.7% | 80.7% | ||
| 2024/25 - Q4 | 82.1% | 82.1% | ||
| 2024/25 - Q3 | 82.2% | 82.2% | ||
| 2024/25 - Q2 | 84.8% | 84.8% | ||
| 2024/25 - Q1 | 78.9% | 78.9% |
30 - Rolling interest cover in the 12 months to June stood at 76% (March: 79%), increasing to 78% when capitalised major repairs grant received in the current quarter is included. Interest cover varies between different types of PRPs.
- Median 12-month outturn interest cover excluding sales and grant was 86% (March: 92%)
- Lower quartile performance was 36% (March: 45%) and upper quartile performance was 138% (March: 142%).
- The eleven PRPs that comprise the G15 group of London-based providers reported aggregate 12-month outturn cash interest cover of 54%.
31 - Cash interest cover is expected to remain restricted. Projections for the year to June 2027 (including grant associated with capitalised major repairs) give forecast interest cover of 73%, with 113 of the 195 PRPs in the dataset forecasting that performance will be below 100% over this period.
32 - When grant funding in respect of capitalised major repairs is excluded, 12-month forecast interest cover reduces to 64%. This is a reduction on the 67% that has been forecast on a comparable basis for the previous four quarters, and is mainly due to an increase in interest costs - forecasts for net interest payable now stand at £4.9 billion, compared to forecasts of £4.8 billion in the previous three quarters. Net interest payable has increased by 26% over the last three years, from £3.6 billion in the year to June 2023 to £4.6 billion in the year to June 2026.
33 - A total of 20 PRPs have reported having one or more loan covenant carve-outs or waivers in place at the end of June (March: 27). The agreements in place include carve-outs to exclude fire or other building safety works from loan covenant calculations, reported by ten PRPs, and carve-outs of energy efficiency or decarbonisation works, reported by seven PRPs. Three PRPs have agreed to temporarily exclude general major repairs costs from covenants, and a further three have agreed for certain pension-related costs to be excluded.
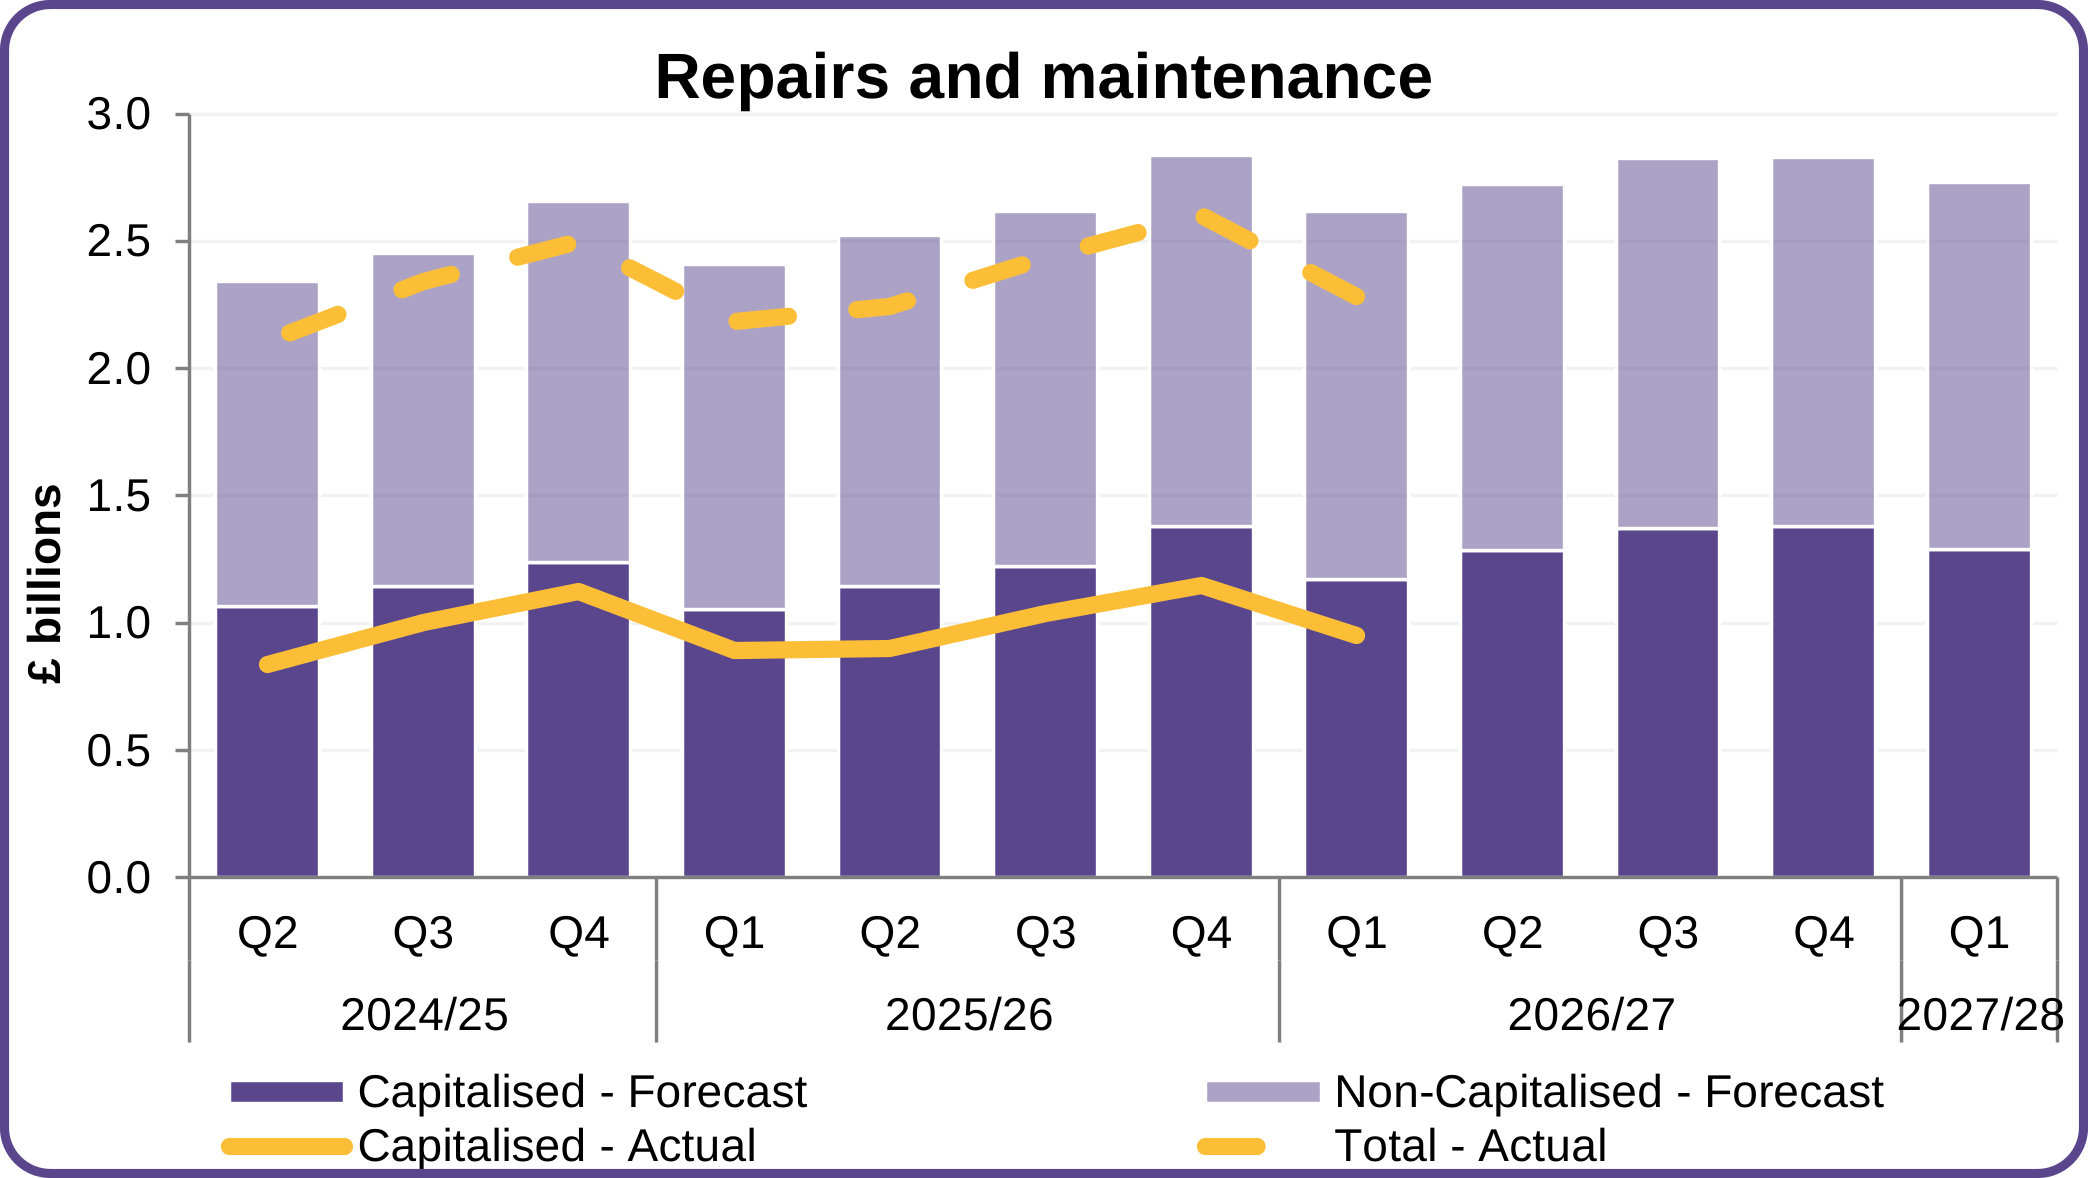
34 - Including both revenue and capital expenditure, total repairs and maintenance spend in the quarter amounted to £2.4 billion. This was 8% less than the total from the previous quarter (£2.6 billion), but 10% higher than in the same quarter of the previous year (£2.2 billion).
35 - A total of £1.4 billion was incurred in the quarter in respect of revenue repairs. This was consistent with both the forecast made in March, and the actual expenditure in the previous quarter. Capitalised expenditure amounted to £1.0 billion in the quarter; 19% below the previous forecast, and 17% below the amount spent in the previous quarter. It is typical for capitalised works to fall in the first quarter of a new financial year as repairs programmes are planned, tendered and initial surveys are carried out. However, this is the highest quarter one spend recorded since cashflow data was first collected in 2015, in part due to the payment of accruals for works completed at the end of the previous financial year.
36 - In the 12 months to June 2026 total repairs and maintenance spend was £9.7 billion; 6% higher than in the year to June 2025, and 18% higher than in the year to June 2024. For the 12 months to June 2027 the sector has forecast expenditure to increase to £11.1 billion (March 12-month forecast: £10.7 billion), an increase of 15% compared to actual spend in the year to June 2026. Repairs and maintenance costs have increased significantly in recent years due to increased focus on building safety and energy efficiency, and initial data from 30-year business plans recently submitted to the regulator (via the Financial Forecast Return - FFR) suggest that these levels of investment will be maintained for the foreseeable future.
Figure 4: Total repairs and maintenance expenditure (£ billions)
| £bn | Capitalised Repairs | Non-Capitalised Repairs | Total Repairs & Maint. Spend | |||
|---|---|---|---|---|---|---|
| Qtrs | Actual | Forecast | Actual | Forecast | Actual | Forecast |
| 2027/28 - Q1 | 1.3 | 1.4 | 2.6 | |||
| 2026/27 - Q4 | 1.4 | 1.5 | 2.7 | |||
| 2026/27 - Q3 | 1.4 | 1.4 | 2.7 | |||
| 2026/27 - Q2 | 1.3 | 1.4 | 2.6 | |||
| 2026/27 - Q1 | 1.0 | 1.2 | 1.4 | 1.4 | 2.3 | 2.6 |
| 2025/26 - Q4 | 1.1 | 1.4 | 1.5 | 1.5 | 2.6 | 2.8 |
| 2025/26 - Q3 | 1.0 | 1.2 | 1.4 | 1.4 | 2.4 | 2.6 |
| 2025/26 - Q2 | 0.9 | 1.1 | 1.3 | 1.4 | 2.2 | 2.5 |
| 2025/26 - Q1 | 0.9 | 1.1 | 1.3 | 1.4 | 2.2 | 2.4 |
| 2024/25 - Q4 | 1.1 | 1.2 | 1.4 | 1.4 | 2.5 | 2.7 |
| 2024/25 - Q3 | 1.0 | 1.1 | 1.3 | 1.3 | 2.3 | 2.5 |
| 2024/25 - Q2 | 0.8 | 1.1 | 1.3 | 1.3 | 2.1 | 2.3 |
| 2024/25 - Q1 | 0.8 | 1.0 | 1.3 | 1.2 | 2.1 | 2.2 |
| 2023/24 - Q4 | 1.0 | 1.1 | 1.2 | 1.2 | 2.2 | 2.3 |
| 2023/24 - Q3 | 0.8 | 0.9 | 1.2 | 1.2 | 2.0 | 2.1 |
| 2023/24 - Q2 | 0.7 | 0.9 | 1.2 | 1.1 | 1.9 | 2.0 |
| 2023/24 - Q1 | 0.7 | 0.8 | 1.1 | 1.1 | 1.8 | 1.9 |
37 - Of the £11.1 billion total repairs and maintenance forecast for the next 12 months, £5.8 billion relates to revenue expenditure and £5.3 billion relates to capitalised works (March forecast: £5.8 billion revenue, £4.9 billion capital). Half of the forecast capitalised expenditure is attributable to 19 PRPs. This includes 10 of the 11 PRPs that comprise the G15 group of large, London-based providers, which on its own accounts for 32% of the total 12-month forecast capital spend.
38 - Current asset sales of £2.6 billion were achieved in the 12 months to June 2026; compared to £2.9 billion in the year ending June 2025 and £3.1 billion in the year ending June 2024. For the 12 months to June 2027 the sector has forecast current asset sales of £3.5 billion (March forecast: £3.3 billion), of which £2.8 billion relates to properties for which development is contractually committed (March: £3.1 billion). Seven PRPs have each forecast current asset sales of £100 million or more over the next 12 months, together accounting for 45% of the sector total.
39 - In the 12 months to June 2026 fixed asset sales totalled £4.9 billion; an increase of 44% compared to the £3.4 billion total recorded in the year to June 2025. For the 12 months to June 2027 the sector has forecast a further £4.9 billion worth of fixed asset sales (March 12-month forecast: £5.3 billion).
40 - Of the total forecast fixed asset sales, £2.6 billion relates to ‘other’ fixed asset sales, including bulk sales to other organisations (March 12-month forecast: £3.2 billion). There are 36 PRPs that are forecasting sales of this type, however, 44% of the total is attributable to just one PRP, and 85% is attributable to six PRPs. The bulk sales included within forecasts include the sale of market rent and shared ownership portfolios, student accommodation, and Extra Care schemes.
41 - A further £2.3 billion has been forecast in relation to sales to tenants or other open market sales (including mainly staircasing, RTB/RTA and sale of void properties), 5% higher than the forecast from March. Six PRPs have each forecast tenant or open market sales of over £100m, and together account for 39% of the sector total.
42 - Available cash, excluding amounts held in secured accounts, reduced by 16% during the quarter to £3.4 billion (March: £4.1 billion); the second lowest amount reported in the last thirteen years. Available cash is forecast to reduce to £3.2 billion by the end of June 2027, with 72% of PRPs forecasting cash levels to reduce over this period.
43 - In addition to the £3.4 billion worth of available cash, cash held in secured accounts or otherwise unavailable for use by PRPs stood at £0.9 billion at the end of the quarter (March: £0.9 billion). These amounts include debt servicing reserve accounts, leaseholder sinking funds, and cash held on long-term deposit.
44 - The regulator will continue to monitor the financial viability of PRPs that are forecasting low liquidity levels or restricted interest cover and will engage with PRPs as necessary, especially if there is reliance on fixed asset sales to support operating cashflows or to meet loan covenants. Findings will be reflected in regulatory judgements where appropriate.
Development
45 - In the 12 months to June 2026, £13.1 billion was invested in the acquisition and development of housing properties. This compares to £13.6 billion in the year to June 2025, and £14.2 billion in the year to June 2024. Total expenditure for the year was 12% below the total forecast reported at the start of the period, but 24% above the forecast for contractually committed schemes.
46 - Although development activity is widespread across the sector, expenditure is concentrated in a small number of PRPs. A total of six PRPs each reported development expenditure of over £400 million in the year to June, together accounting for one-quarter of the sector total.
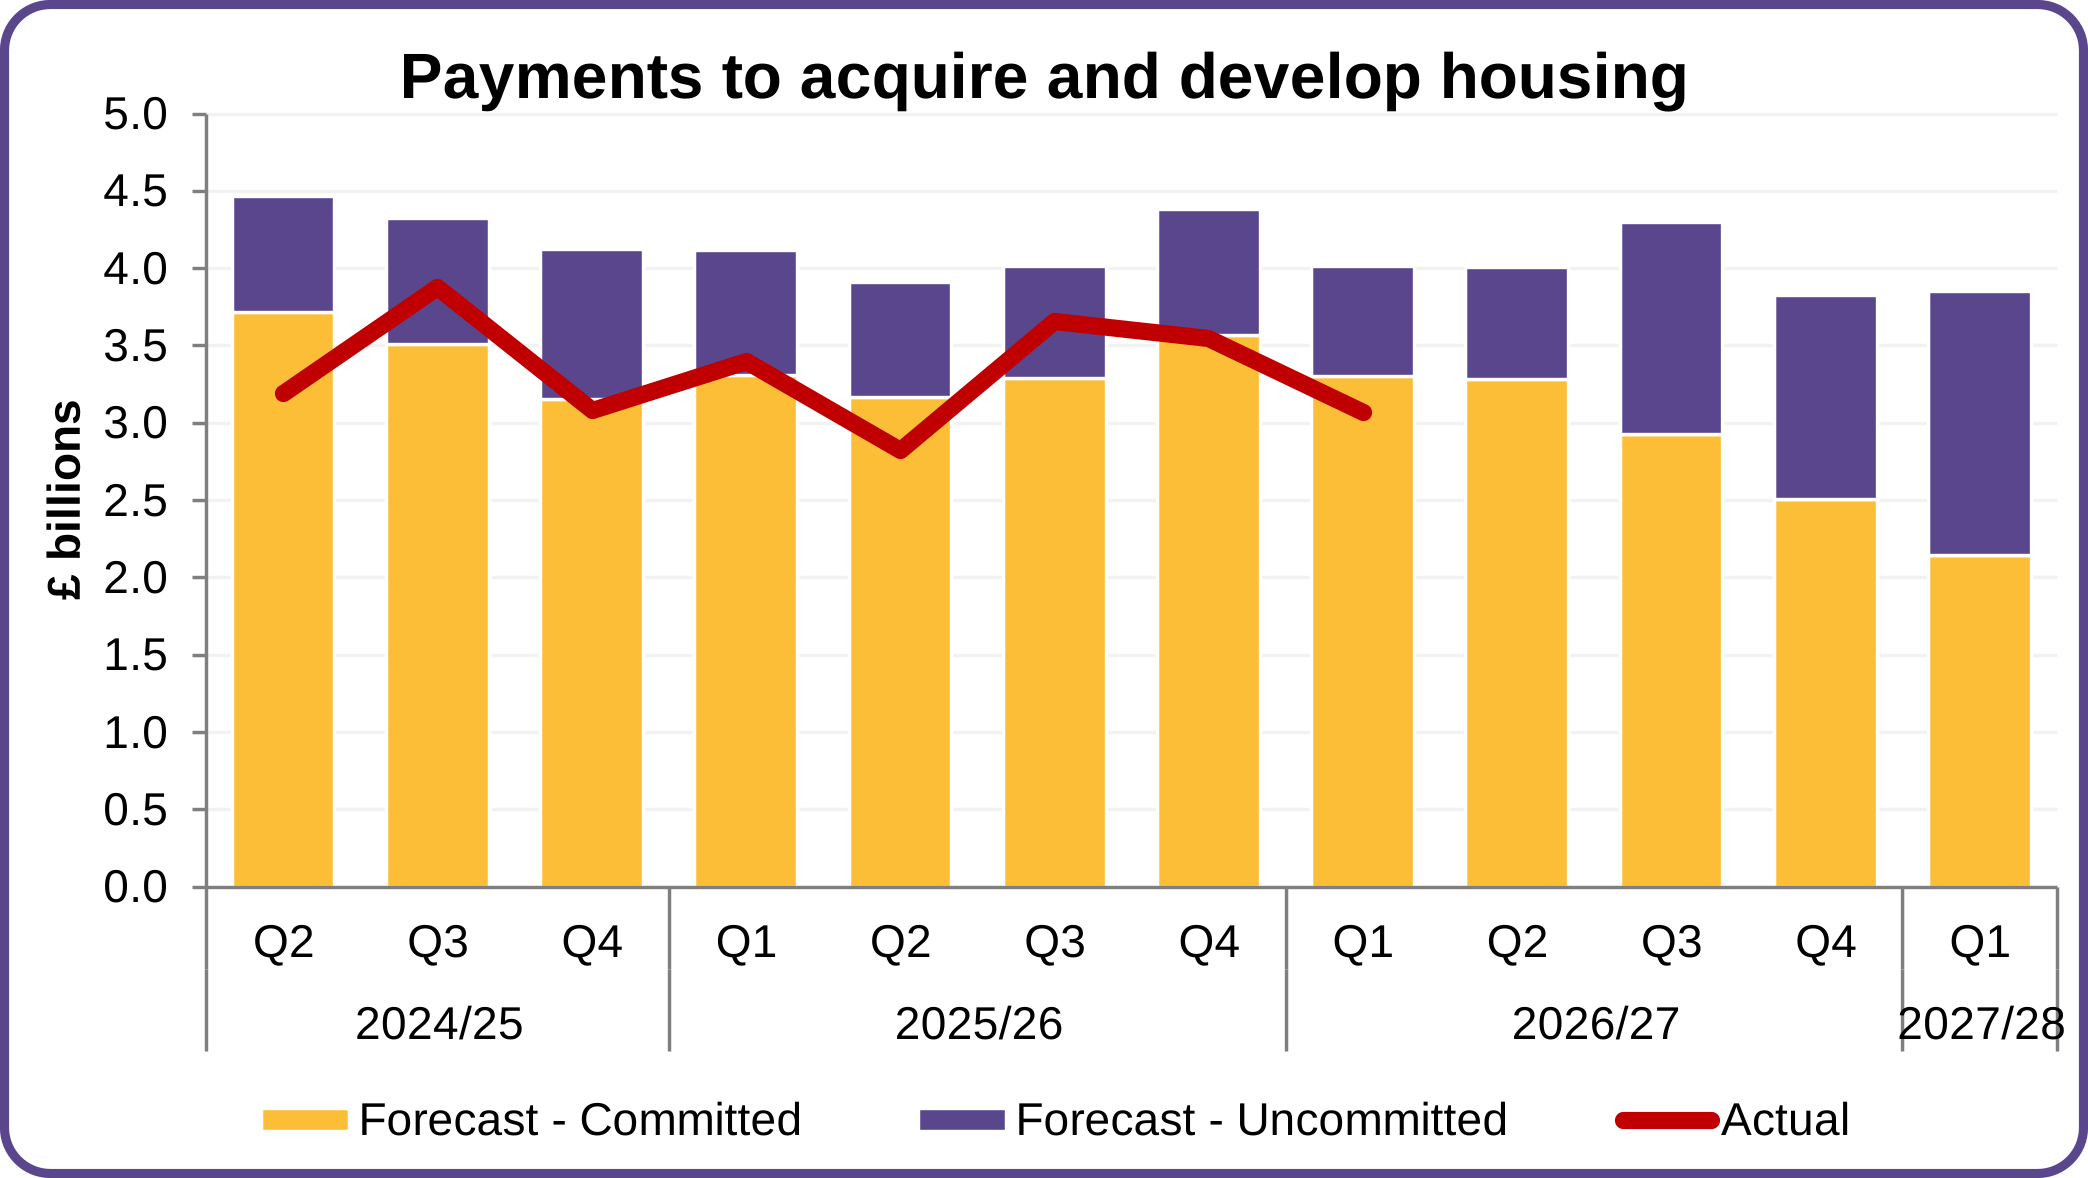
47 - Actual expenditure in the three months to June 2026 was £3.1 billion, compared to a total of £3.4 billion in the quarter to June 2025 and £3.5bn in the quarter to June 2024. Expenditure was 7% below the forecast for contractually committed development, and 24% below the total forecast including uncommitted expenditure and is the lowest Q1 spend in four years. In addition to general scheme delays and timing differences, PRPs have attributed underspends to delays in securing contractors, slower handover of units, and in some instances reprofiling development programs. Complex contract negotiations, planning applications and legal works have also impacted construction activity.
Figure 5: Payments to acquire and develop housing
| £bn | Committed | Uncommitted | Total | |
|---|---|---|---|---|
| Qtrs | Actual | Forecast | Forecast | Forecast |
| 2027/28 - Q1 | 2.1 | 1.7 | 3.9 | |
| 2026/27 - Q4 | 2.5 | 1.3 | 3.8 | |
| 2026/27 - Q3 | 2.9 | 1.4 | 4.3 | |
| 2026/27 - Q2 | 3.3 | 0.7 | 4.0 | |
| 2026/27 - Q1 | 3.1 | 3.3 | 0.7 | 4.0 |
| 2025/26 - Q4 | 3.5 | 3.6 | 0.8 | 4.4 |
| 2025/26 - Q3 | 3.7 | 3.3 | 0.7 | 4.0 |
| 2025/26 - Q2 | 2.8 | 3.2 | 0.7 | 3.9 |
| 2025/26 - Q1 | 3.4 | 3.3 | 0.8 | 4.1 |
| 2024/25 - Q4 | 3.1 | 3.2 | 1.0 | 4.1 |
| 2024/25 - Q3 | 3.9 | 3.5 | 0.8 | 4.3 |
| 2024/25 - Q2 | 3.2 | 3.7 | 0.7 | 4.5 |
48 - For the next 12 months a further £16.0 billion worth of investment has been forecast (March 12-month forecast: £15.1 billion). This is the fifth consecutive quarter that forecasts have increased and the highest amount in two years. Within this, forecasts for committed expenditure have increased by 2% to £10.9 billion, and forecasts for uncommitted development have increased by 17% up to £5.1 billion. This is the highest level of forecast uncommitted development in three years.
49 - Forecasts for development grant have reduced by 9% to £2.7 billion (March forecast: £3.0 billion), however remain relatively high compared to the quarterly average over the last three years of £2.5 billion. Forecasts for grant relating to committed development decreased by almost 30%, offset by a 14% increase in uncommitted development grant. Some PRPs have stated that forecasts have been updated to reflect changes to funding for bids from the new Social and Affordable Homes Programme (SAHP) 26-36, with one PRP accounting for 60% of the overall decrease.
Housing market
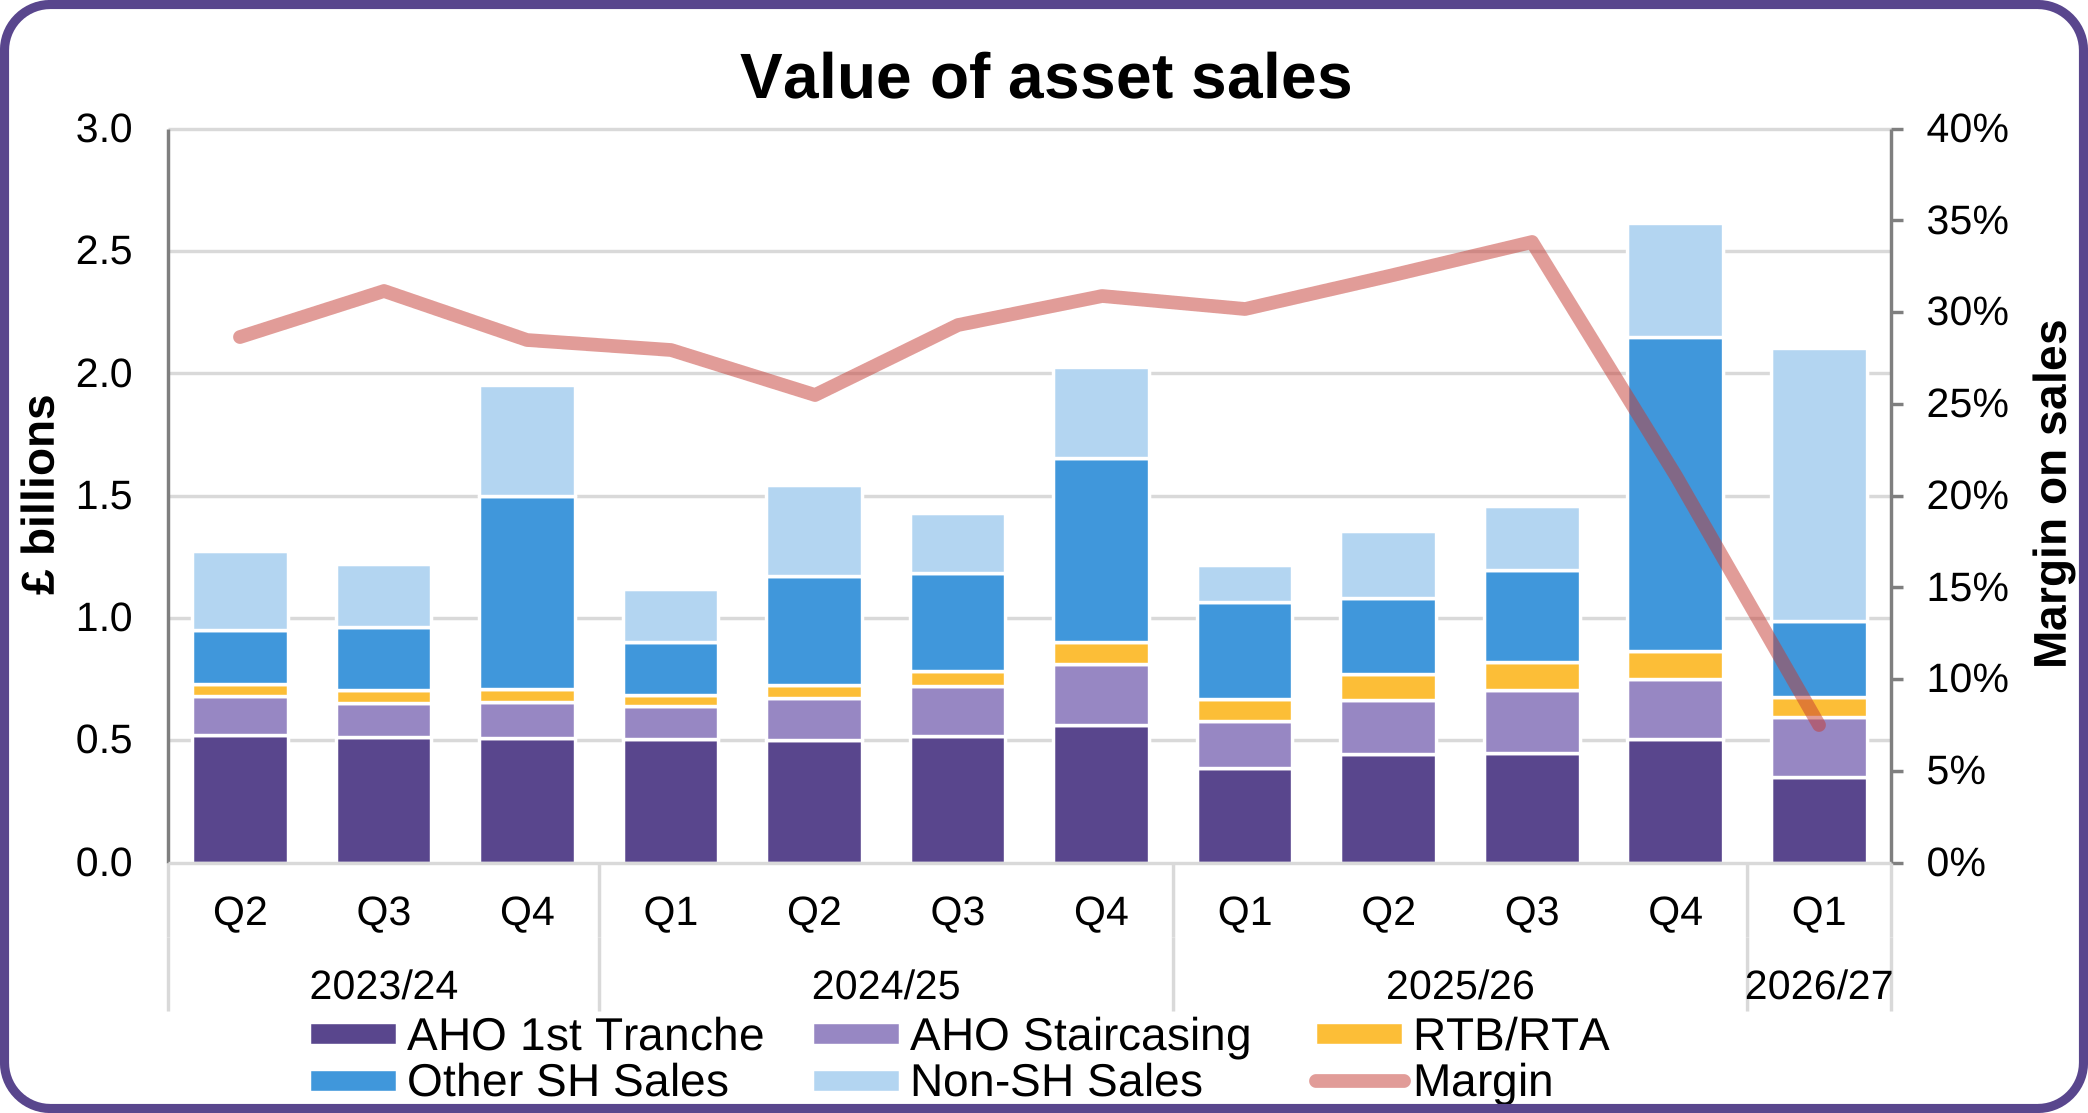
50 - Total asset sales, including staircasing, RTB/RTA and voluntary sales, as well as Affordable Home Ownership (AHO) first tranche sales and market sales, amounted to £2.1 billion in the quarter to June (March: £2.6 billion). This follows from the highest value recorded in the previous quarter and remains at elevated levels.
Figure 6: Value of asset sales
| £m | Sales Value | Margin | |||||
|---|---|---|---|---|---|---|---|
| Qtrs | AHO 1st Tranche | AHO Staircasing | RTB/RTA | Other SH Sales | Non-SH Sales | Total | Total |
| 2026/27 - Q1 | 351.0 | 244.0 | 83.0 | 309.0 | 1,114.8 | 2,101.9 | 7.5% |
| 2025/26 - Q4 | 503.4 | 248.7 | 112.4 | 1,284.8 | 465.0 | 2,614.4 | 21.1% |
| 2025/26 - Q3 | 446.1 | 257.8 | 117.2 | 374.1 | 263.3 | 1,458.5 | 33.9% |
| 2025/26 - Q2 | 442.7 | 219.7 | 109.5 | 309.5 | 274.0 | 1,355.5 | 32.0% |
| 2025/26 - Q1 | 385.5 | 191.9 | 91.1 | 396.8 | 149.4 | 1,214.7 | 30.2% |
| 2024/25 - Q4 | 560.6 | 251.5 | 90.9 | 752.4 | 369.3 | 2,024.7 | 30.9% |
| 2024/25 - Q3 | 517.5 | 205.5 | 61.3 | 400.1 | 246.2 | 1,430.7 | 29.3% |
| 2024/25 - Q2 | 499.5 | 174.5 | 52.6 | 442.8 | 373.7 | 1,543.0 | 25.5% |
| 2024/25 - Q1 | 506.8 | 134.7 | 41.3 | 220.3 | 213.3 | 1,116.5 | 28.0% |
| 2023/24 - Q4 | 510.7 | 145.2 | 52.9 | 788.7 | 453.2 | 1,950.7 | 28.5% |
| 2023/24 - Q3 | 511.6 | 139.6 | 53.3 | 258.1 | 257.5 | 1,220.1 | 31.2% |
| 2023/24 - Q2 | 519.8 | 159.6 | 50.9 | 220.5 | 323.8 | 1,274.5 | 28.6% |
51 - Affordable home ownership 1st tranche sales decreased by 30% to £351 million from £503 million in March. Non-social housing sales generated proceeds of £1.1 billion in the quarter to June, compared to £465 million in March. This is the highest amount ever recorded, which includes a large disposal of a Private Rented Sector (PRS) business by one PRP to simplify its operations.
52 - The overall surplus from asset sales stood at £158 million for the quarter (March: £552 million), resulting in a combined margin of 8% (March: 21%); the lowest ever recorded, and well below the average margin of 26% over the last three years. The margin is distorted by a large one-off business disposal, as previously mentioned, in the quarter.
53 - Total fixed asset sales amounted to £1.6 billion (March: £1.7 billion), against a forecast of £1.7 billion. Fixed asset sales are categorised as either sales to tenants/open market sales, or other sales (bulk disposals to other organisations, including stock transfers and rationalisation).
-
Sales to tenants and other open market sales (including staircasing, RTB/RTA and voluntary sales) amounted to £549 million (March: £821 million), 9% above the amount previously forecast. Fourteen PRPs recorded sales of over £10 million each, together accounting for 58% of the sector total.
-
Bulk fixed asset sales to other organisations amounted to £1.1 billion (March: £925 million), 11% lower than the £1.2 billion previously forecast. Over half of this variance is driven by one PRP whose disposal of student accommodation has been delayed and reforecast to the following quarter. In the current quarter one PRP accounted for 90% of the sales.
54 - Total cash receipts in respect of current asset sales (market sales and first tranche AHO sales) amounted to £0.5 billion in the quarter; a 40% decrease compared to the previous quarter, and the lowest amount achieved in 11 years. Seven PRPs reported sales of over £15 million in the quarter, accounting for over a third of total sales. Current asset sales were 30% below the amount previously forecast, with five PRPs reporting sales below forecast of over £10 million each, accounting for almost 60% of the total forecast variance. PRPs cited challenging operating conditions causing handover delays and impacting sales. Overall, forecasts for current asset sales have been on a gradual downwards trajectory in recent years, however since the launch of the SAHP, forecasts have increased over the last two quarters.
Table 4: AHO units
| AHO units | Previous quarter | Current quarter | % change |
|---|---|---|---|
| Completed | 5,235 | 3,240 | (38.1%) |
| Sold | 4,526 | 3,337 | (26.3%) |
| Margin on first tranche sales | 11.4% | 13.3% | 1.9% |
| Unsold | 7,977 | 7,877 | (1.3%) |
| Unsold for more than 6 months | 2,983 | 3,439 | 15.3% |
| 18-month pipeline | 25,600 | 26,815 | 4.7% |
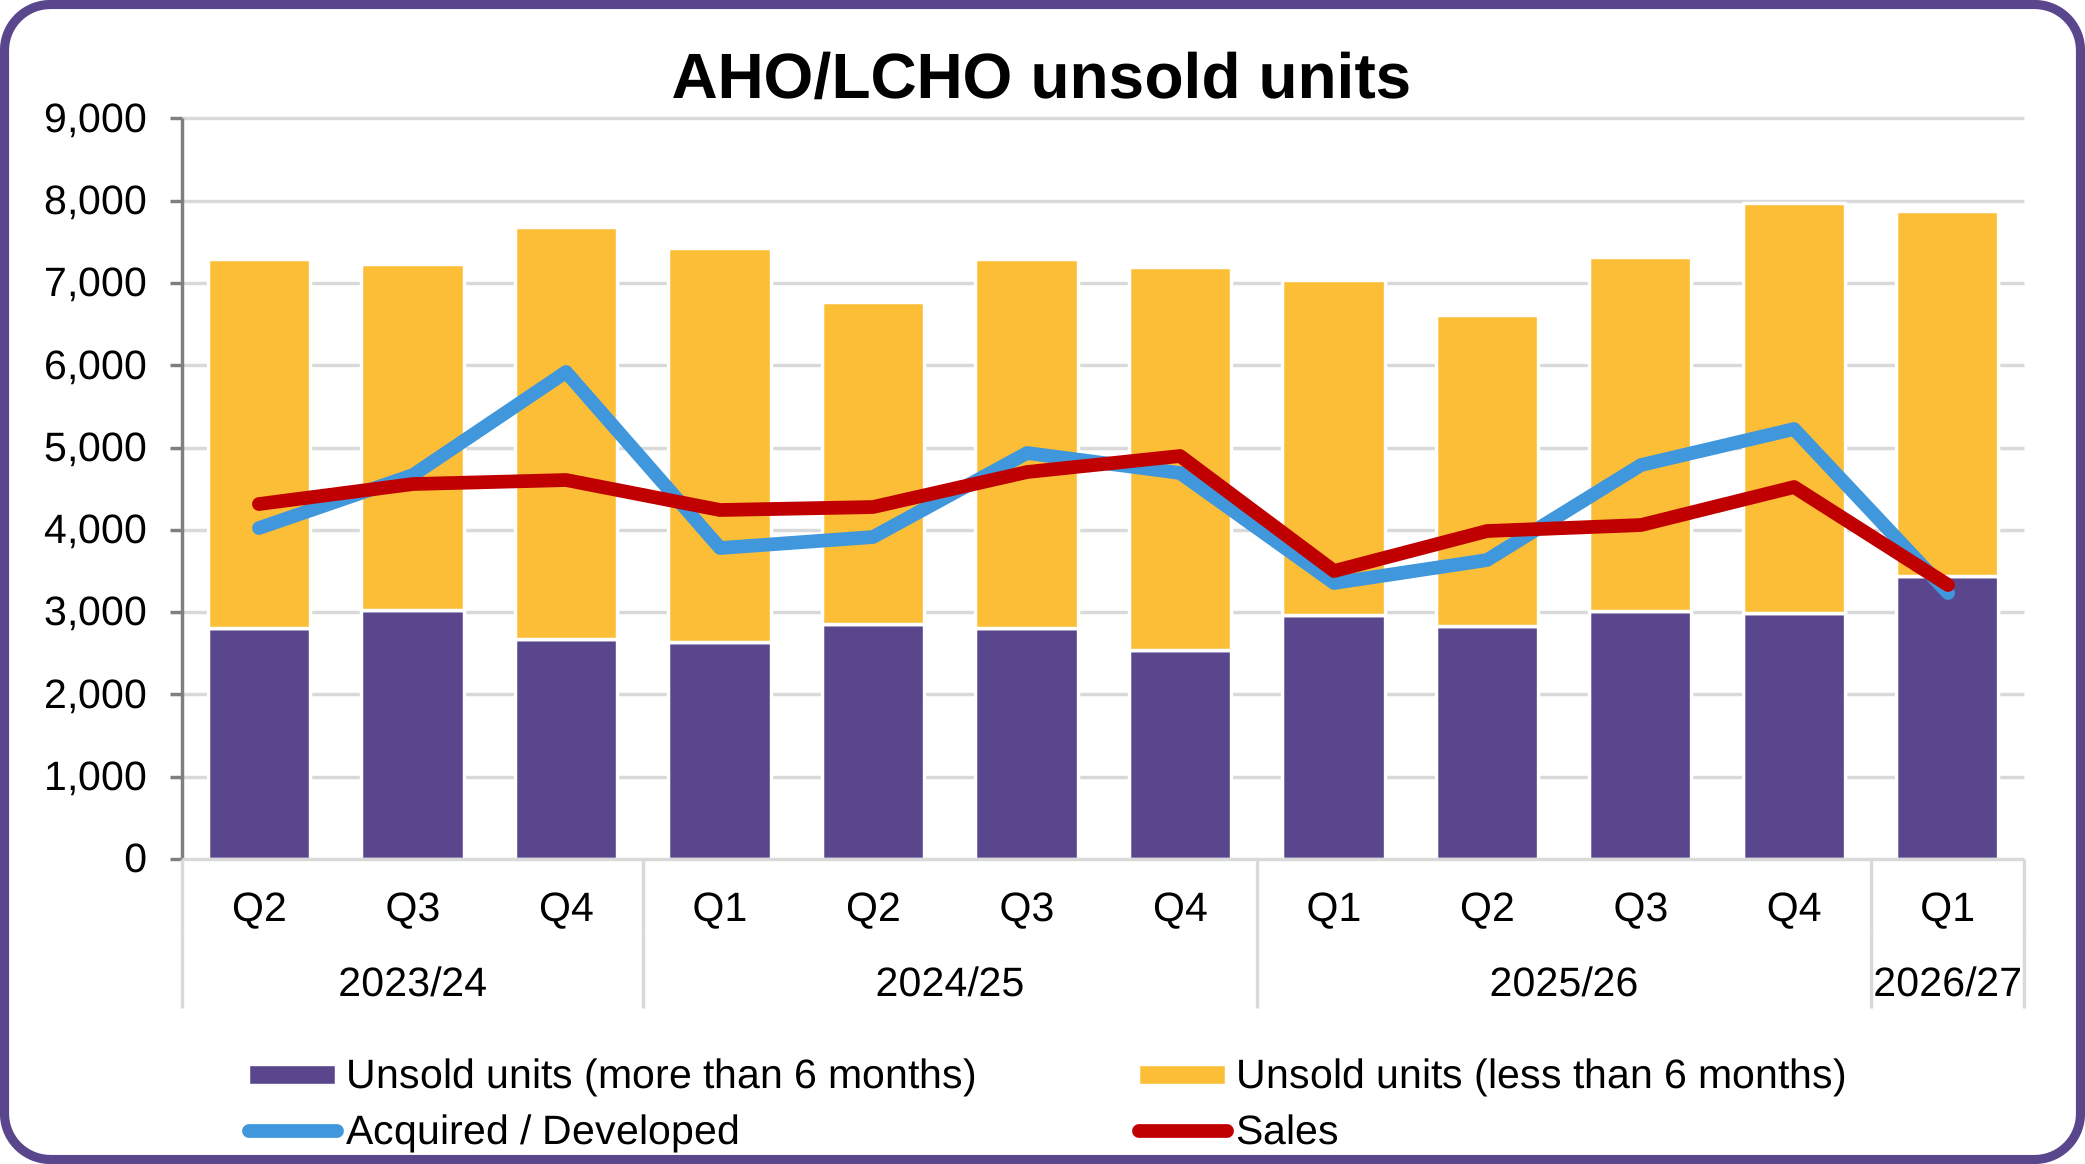
55 - AHO completions have decreased by 38% to 3,240 units (March: 5,235), which is in line with seasonal trends as PRPs push to reach targets at year end, and a slowdown is usually observed in Q1. However, this is the lowest amount achieved in six years, since the start of the pandemic. In the last 12 months a total of 16,912 units have been completed, remaining in line with the same period in 2025.
56 - AHO sales decreased by 26% in the quarter to 3,337 units, below the three-year average of 4,255. Six PRPs reported sales of more than 100 AHO units each in the quarter, compared to 16 in March, together accounting for a quarter of the sector total. A total of 15,915 AHO sales were recorded in the year to June, compared to 17,410 in the year to June 2025.
57 - The overall number of unsold units slightly decreased by 1% to 7,877, however the number of units unsold for over six months increased to 3,439 units. Nine PRPs each held 100 or more units that were unsold for over six months, together accounting for 58% of the sector total.
Figure 7: AHO/LCHO units
| Units | Development and Sales | Unsold Units | |||
|---|---|---|---|---|---|
| Qtrs | Acq/Dev | Sales | Total | <6 Months | >6 Months |
| 2026/27 - Q1 | 3,240 | 3,337 | 7,877 | 4,438 | 3,439 |
| 2025/26 - Q4 | 5,235 | 4,526 | 7,977 | 4,994 | 2,983 |
| 2025/26 - Q3 | 4,793 | 4,066 | 7,313 | 4,297 | 3,016 |
| 2025/26 - Q2 | 3,644 | 3,986 | 6,609 | 3,784 | 2,825 |
| 2025/26 - Q1 | 3,355 | 3,507 | 7,033 | 4,065 | 2,968 |
| 2024/25 - Q4 | 4,700 | 4,904 | 7,196 | 4,657 | 2,539 |
| 2024/25 - Q3 | 4,942 | 4,714 | 7,288 | 4,476 | 2,812 |
| 2024/25 - Q2 | 3,917 | 4,285 | 6,769 | 3,915 | 2,854 |
| 2024/25 - Q1 | 3,790 | 4,252 | 7,424 | 4,792 | 2,632 |
| 2023/24 - Q4 | 5,923 | 4,606 | 7,680 | 5,013 | 2,667 |
| 2023/24 - Q3 | 4,671 | 4,559 | 7,230 | 4,206 | 3,024 |
| 2023/24 - Q2 | 4,032 | 4,319 | 7,288 | 4,480 | 2,808 |
58 -Sales proceeds from 1st tranche AHO sales amounted to £351 million during the quarter with an overall surplus of £47 million being reported (March: £58 million). This resulted in an average margin of 13.3% (March: 11.4%), the second lowest level recorded since data was first collected in 2011 and compares to an average margin of 16.3% over the last three years.
59 - The total pipeline of AHO completions expected in the next 18 months has increased by 5% to 26,815 units (March: 25,600), of which 23,642 units are contractually committed (March: 23,321). The committed pipeline remains below the quarterly average over the last 12 months of 24,540 units, whereas the uncommitted pipeline of 3,173 units was 17% above the uncommitted average over the last 12 months of 2,707 units.
Table 5: Market sale units
| Market sale units | Previous quarter | Current quarter | % change |
|---|---|---|---|
| Completed | 616 | 311 | (49.5%) |
| Sold | 545 | 379 | (30.0%) |
| Unsold | 1,329 | 1,223 | (8.0%) |
| Unsold for more than 6 months | 791 | 751 | (5.1%) |
| 18-month pipeline | 5,414 | 6,107 | 12.8% |
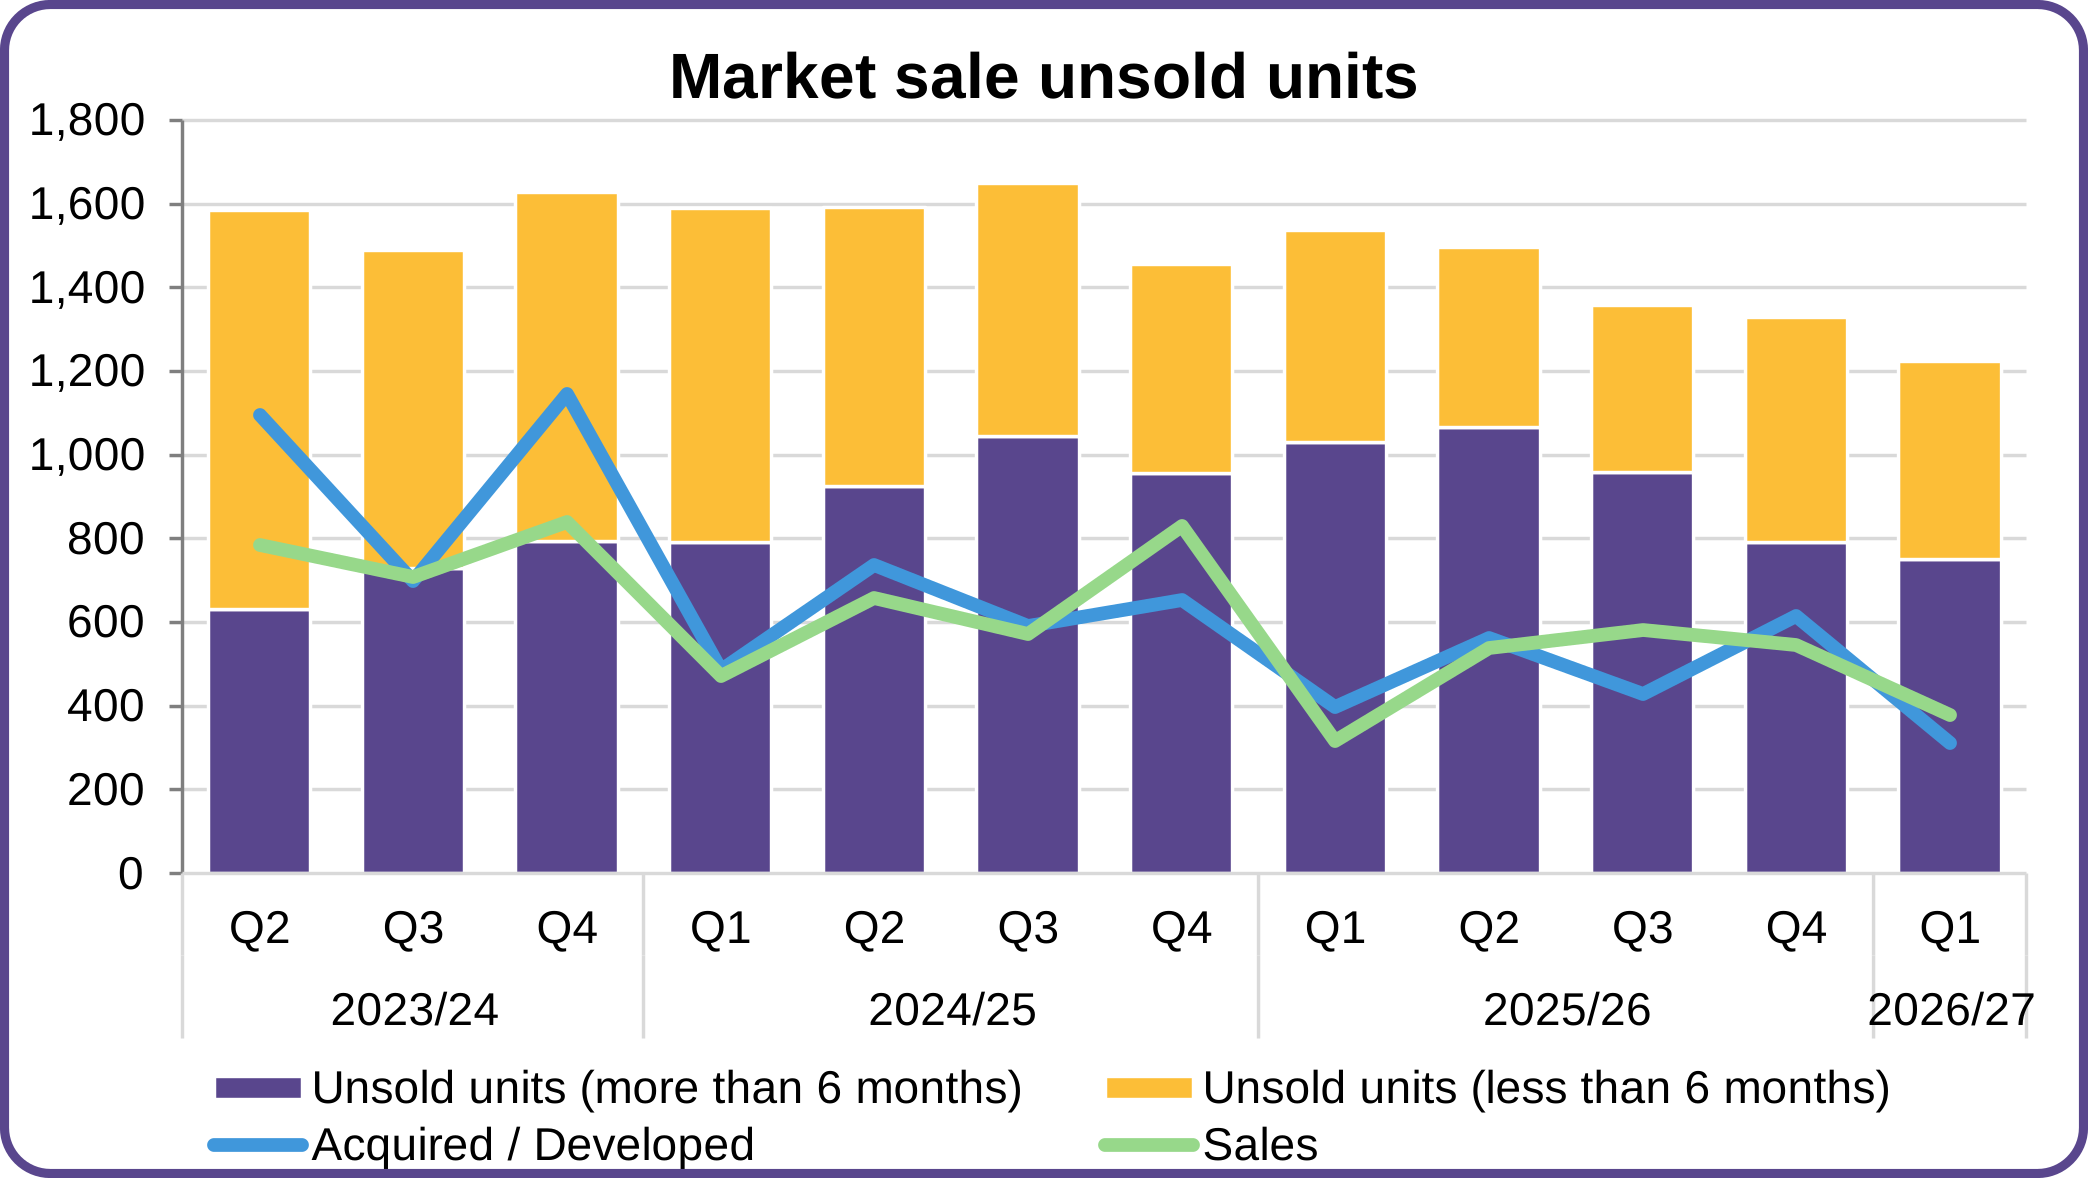
60 - The number of market sale completed units reduced by 50% compared to the previous quarter, and at 311 units, was the lowest amount achieved in over 10 years. For context, the highest level achieved on record was in quarter four 2019/20 where 1,944 units were completed. Current levels are half of the average units achieved per quarter over the last 3 years of 644 units, and below the level achieved in the same quarter of 2025 of 399 units. A total of 1,920 units were completed in the year to June 2026, compared to 2,382 units in the year to June 2025, and 3,426 units in the year to June 2024.
61 - Market sale units sold in the quarter also reduced by 30% and were the second lowest level achieved since data collection began in 2014. Current levels are below the average units sold per quarter over the last 3 years of 602 units, although above the level achieved in the same quarter of 2025 of 317 units; the lowest on record.
62 - Market sale activity continues to be concentrated in a small number of PRPs, with only 17% of PRPs recording market sales over the last 12 months. Eight PRPs each sold over 100 market sale units in this period, together accounting for 73% of the sector total. One PRP with the highest sales in this period accounted for over 20% of the total.
Figure 8: Market sale units
| Units | Development and Sales | Unsold Units | |||
|---|---|---|---|---|---|
| Qtrs | Acq/Dev | Sales | Total | <6 Months | >6 Months |
| 2026/27 - Q1 | 311 | 379 | 1,223 | 472 | 751 |
| 2025/26 - Q4 | 616 | 545 | 1,329 | 538 | 791 |
| 2025/26 - Q3 | 430 | 581 | 1,357 | 399 | 958 |
| 2025/26 - Q2 | 563 | 540 | 1,497 | 430 | 1,067 |
| 2025/26 - Q1 | 399 | 317 | 1,537 | 508 | 1,029 |
| 2024/25 - Q4 | 654 | 830 | 1,456 | 501 | 955 |
| 2024/25 - Q3 | 591 | 573 | 1,648 | 604 | 1,044 |
| 2024/25 - Q2 | 738 | 658 | 1,592 | 668 | 924 |
| 2024/25 - Q1 | 487 | 472 | 1,590 | 799 | 791 |
| 2023/24 - Q4 | 1,146 | 841 | 1,627 | 834 | 793 |
| 2023/24 - Q3 | 698 | 708 | 1,489 | 760 | 729 |
| 2023/24 - Q2 | 1,095 | 785 | 1,584 | 953 | 631 |
63 - The total number of unsold market sale units decreased for the fourth consecutive quarter to 1,223, 8% below the previous quarter. Five PRPs each held over 100 unsold market sale units at the end of the quarter and together accounted for 66% of the sector total. The number of units unsold for over six months also decreased, to 751 (March: 791).
64 - The pipeline of market sale completions expected over the next 18 months has increased by 13%, to 6,107 units (March: 5,414), of which 6,008 units are contractually committed (March: 5,350). Pipeline units are above the quarterly average over the last three years of 5,960 units. The pipeline for market sale units is concentrated amongst 33 PRPs, with one PRP reporting over one thousand unit completions over the next 18 months accounting for 23% of the total pipeline.
Derivatives
65 - In the quarter to June 2026, two new questions were added in the quarterly survey relating to loan-linked derivatives, followed by the standard questions relating to standalone derivatives. In recent years PRPs have opted to obtain fixed rates with loan-linked derivatives which share the security pledged to the underlying loan. These are not subjected to margin calls, unlike standard standalone derivatives, therefore have a reduced liquidity risk. The quarterly survey adjustment will allow a more accurate representation of the type of derivative instrument PRPs are using.
66 - At the end of June, 42 PRPs reported making use of loan-linked derivatives, and 40 PRPs reported using free-standing derivatives. The notional value of loan-linked derivatives amounted to £3.4 billion in the quarter, and standalone derivatives decreased from £11.9 billion to £10.5 billion over the quarter. The reduction in standalone derivatives is almost entirely related to the reclassification to loan-linked derivatives.
67 - The majority of derivative instruments utilised by the sector are floating-to-fixed interest rate swaps, whereby MTM exposure will increase as swap rates fall. Over the quarter the 15-year swap rate decreased from 4.58% at the end of March to 4.50% at the end of June, resulting in a net increase in MTM exposure to £177 million at the end of the quarter (March: £138 million).
Figure 9: Derivatives – Mark-to-market/collateral
£bn
| Qtrs | Unsecured thresholds | Cash employed | Property employed | SONIA Swap Rate |
|---|---|---|---|---|
| 2026/27 - Q1 | 0.1 | 0.0 | 0.0 | 4.50 |
| 2025/26 - Q4 | 0.1 | 0.0 | 0.1 | 4.58 |
| 2025/26 - Q3 | 0.1 | 0.0 | 0.1 | 4.19 |
| 2025/26 - Q2 | 0.1 | 0.0 | 0.1 | 4.36 |
| 2025/26 - Q1 | 0.1 | 0.0 | 0.1 | 4.20 |
| 2024/25 - Q4 | 0.1 | 0.0 | 0.1 | 4.26 |
| 2024/25 - Q3 | 0.2 | 0.0 | 0.1 | 4.17 |
| 2024/25 - Q2 | 0.1 | 0.0 | 0.2 | 3.71 |
| 2024/25 - Q1 | 0.2 | 0.0 | 0.2 | 4.02 |
| 2023/24 - Q4 | 0.2 | 0.0 | 0.3 | 3.66 |
| 2023/24 - Q3 | 0.1 | 0.0 | 0.2 | 3.34 |
| 2023/24 - Q2 | 0.0 | 0.0 | 0.0 | 4.33 |
68 - The above graph shows MTM exposure excluding excess collateral. Collateral pledged continues to be well above the sector’s exposure levels, and at the end of June the total headroom of collateral and unsecured thresholds available over gross MTM exposure was £2.1 billion (March: £2.4 billion).
69 - Of the 40 PRPs that were making use of free-standing derivatives, 36 had collateral pledged that exceeded or equalled their level of gross exposure, and the remaining four PRPs were not required to provide security to cover their position. At sector level, unsecured thresholds and available security pledged to swap counterparties reduced in the quarter to £2.3 billion available.
70 - With swap rates continuing to fluctuate, PRPs must ensure they have sufficient collateral available to cover potential increases in exposure and that they understand the sensitivity to changes in underlying rates.
Income collection
71 - At the end of June, 63% of PRPs reported that their levels of arrears, rent collection and voids were all within, or outperforming, their business plan assumptions (March: 65%).
Figure 10: Current tenant arrears
| Qtrs | Mean | Lower Quartile | Median | Upper Quartile |
|---|---|---|---|---|
| 2026/27 - Q1 | 3.5% | 2.3% | 3.1% | 4.2% |
| 2025/26 - Q4 | 3.2% | 2.1% | 3.0% | 4.1% |
| 2025/26 - Q3 | 3.6% | 2.4% | 3.4% | 4.4% |
| 2025/26 - Q2 | 3.6% | 2.3% | 3.3% | 4.5% |
| 2025/26 - Q1 | 3.5% | 2.3% | 3.3% | 4.5% |
| 2024/25 - Q4 | 3.4% | 2.2% | 3.2% | 4.2% |
| 2024/25 - Q3 | 3.7% | 2.5% | 3.5% | 4.5% |
| 2024/25 - Q2 | 3.9% | 2.6% | 3.7% | 4.9% |
| 2024/25 - Q1 | 3.7% | 2.6% | 3.3% | 4.5% |
| 2023/24 - Q4 | 3.5% | 2.4% | 3.3% | 4.4% |
| 2023/24 - Q3 | 3.7% | 2.6% | 3.5% | 4.6% |
| 2023/24 - Q2 | 3.9% | 2.6% | 3.6% | 4.7% |
| 2023/24 - Q1 | 3.7% | 2.5% | 3.4% | 4.5% |
| 2022/23 - Q4 | 3.6% | 2.3% | 3.1% | 4.6% |
| 2022/23 - Q3 | 3.9% | 2.6% | 3.4% | 4.7% |
| 2022/23 - Q2 | 3.9% | 2.7% | 3.5% | 4.7% |
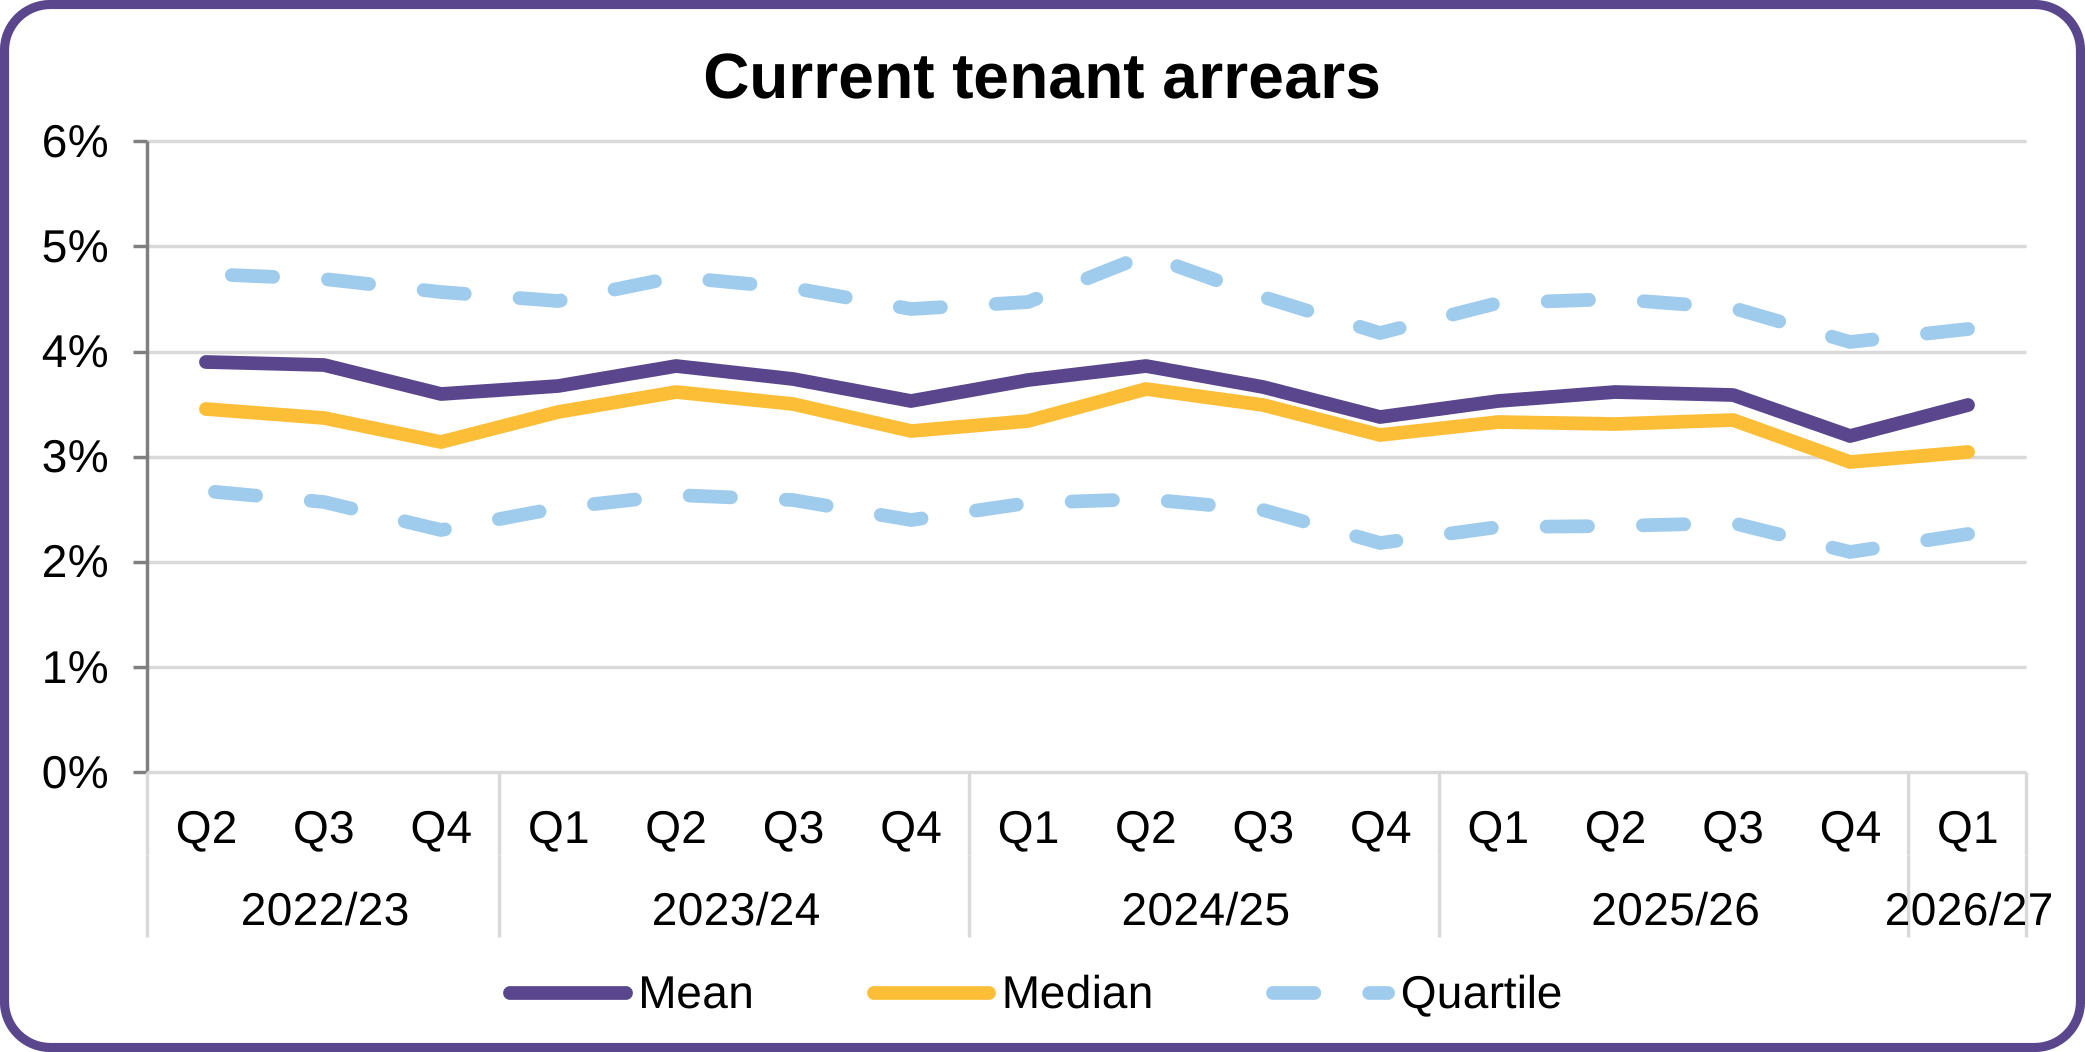
72 - In line with seasonal trends, both mean and median current tenant arrears increased during the quarter, to stand at 3.5% and 3.1% respectively (March: 3.2% and 3.0%). Compared with the corresponding quarter of the previous year, the mean remained unchanged, while the median decreased 0.2% from 3.3%.
73 - For the 59% of PRPs reporting non-social housing arrears, such as those relating to student accommodation and market rent tenures, the average stood at 6.2% in the quarter, an increase on the 5.3% reported in the quarter to March, consistent with the average of the last year. Non-social housing arrears can also include leaseholder charges or commercial rents, which are often applied as an annual charge and then paid monthly over the course of the year.
Figure 11: Void losses
| Qtrs | Mean | Lower Quartile | Median | Upper Quartile |
|---|---|---|---|---|
| 2026/27 - Q1 | 1.9% | 0.9% | 1.4% | 2.0% |
| 2025/26 - Q4 | 1.9% | 0.9% | 1.3% | 2.1% |
| 2025/26 - Q3 | 1.8% | 0.9% | 1.3% | 2.1% |
| 2025/26 - Q2 | 1.8% | 0.9% | 1.3% | 2.1% |
| 2025/26 - Q1 | 1.8% | 0.9% | 1.3% | 2.0% |
| 2024/25 - Q4 | 1.8% | 0.8% | 1.3% | 2.1% |
| 2024/25 - Q3 | 1.7% | 0.8% | 1.2% | 2.1% |
| 2024/25 - Q2 | 1.7% | 0.8% | 1.3% | 2.0% |
| 2024/25 - Q1 | 1.7% | 0.8% | 1.2% | 2.0% |
| 2023/24 - Q4 | 1.8% | 0.9% | 1.3% | 2.0% |
| 2023/24 - Q3 | 1.8% | 0.9% | 1.3% | 2.1% |
| 2023/24 - Q2 | 1.9% | 0.9% | 1.4% | 2.1% |
| 2023/24 - Q1 | 1.8% | 0.9% | 1.4% | 2.1% |
| 2022/23 - Q4 | 2.0% | 0.9% | 1.5% | 2.1% |
| 2022/23 - Q3 | 1.9% | 0.8% | 1.4% | 2.0% |
| 2022/23 - Q2 | 1.8% | 0.8% | 1.4% | 2.0% |
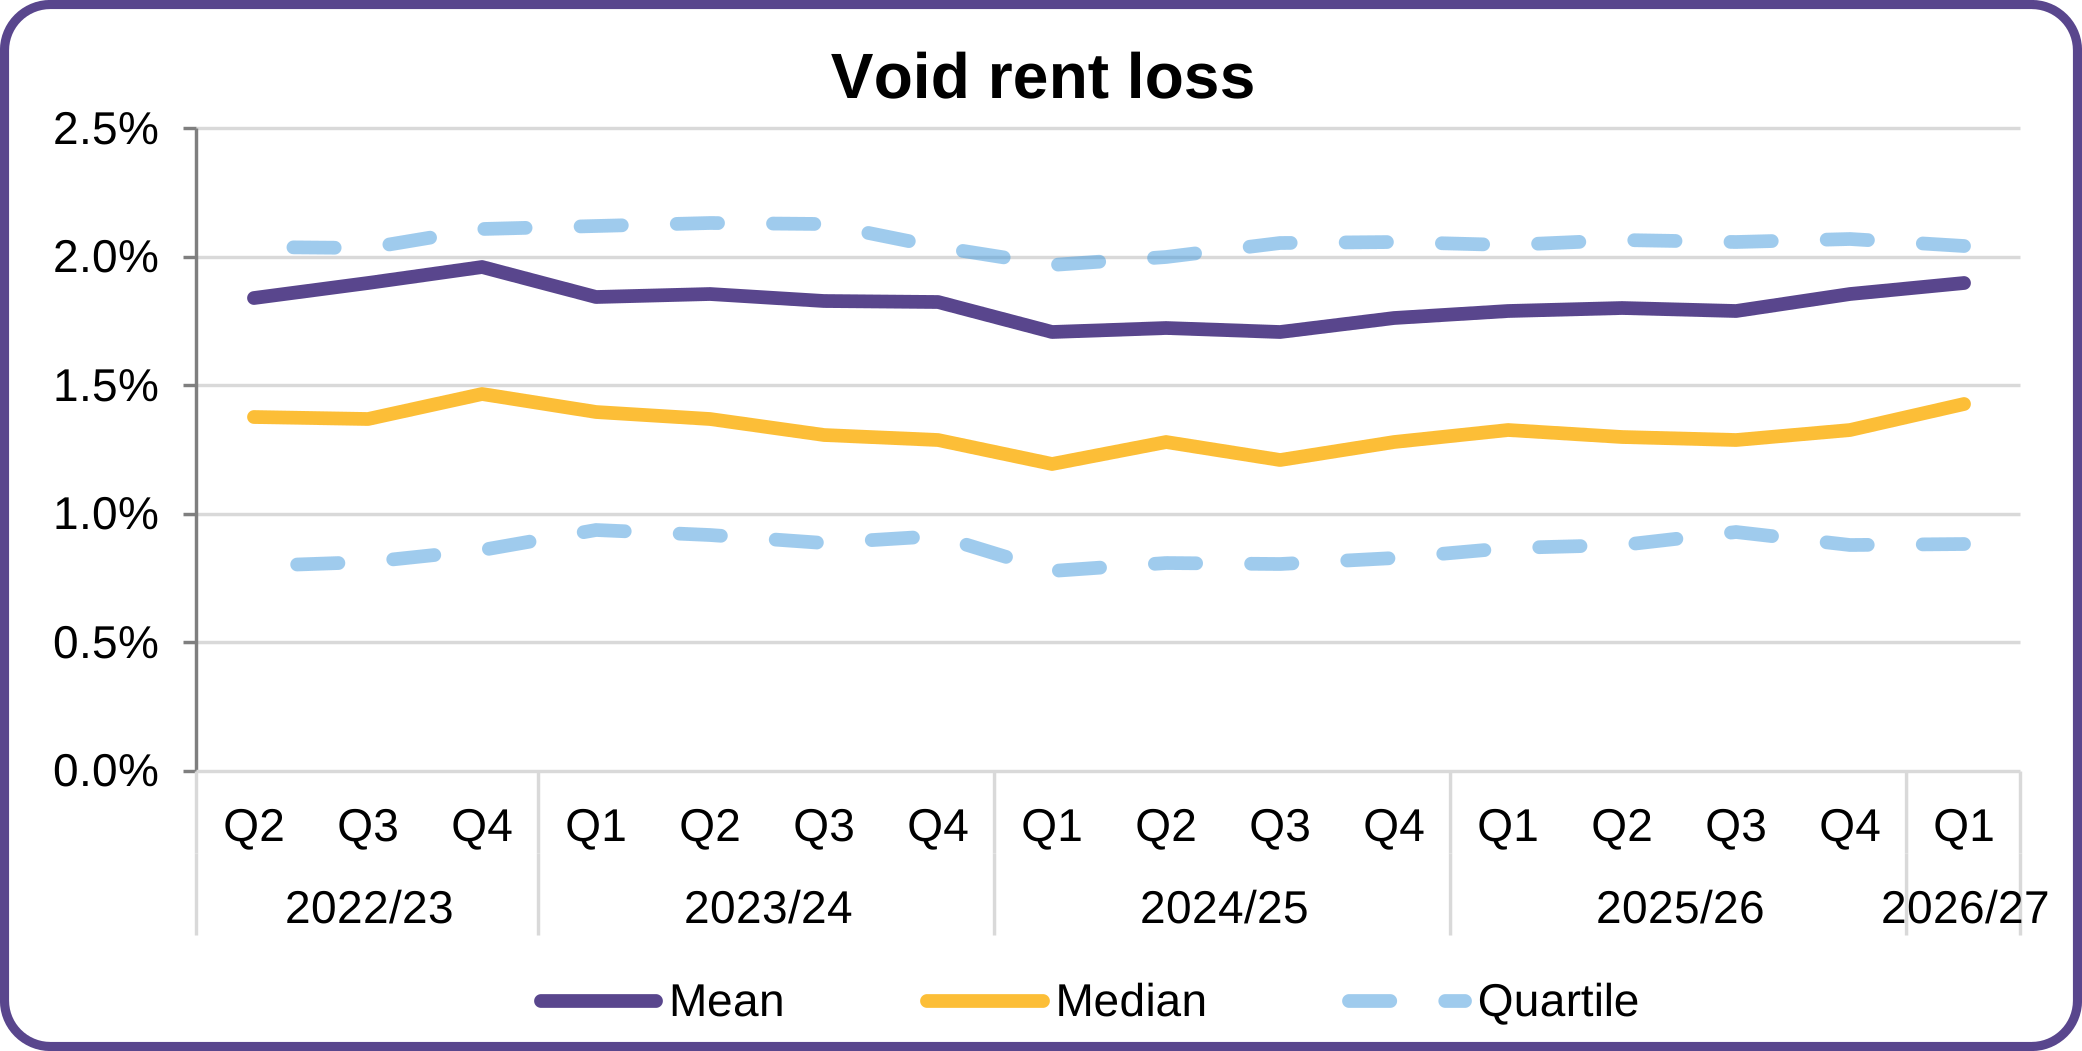
74 - At the end of June, mean and median void losses remained broadly in line with the previous quarter, standing at 1.9% and 1.4% respectively.
75 - PRPs with a large proportion of supported housing units, care home units or Housing for Older People will typically experience the highest levels of void losses. A total of 11 PRPs reported void losses of 5% or more (March: 11), and of these, eight hold over 50% of their stock within these specialist categories.
76 - Around 30% of PRPs have reported being outside their business plan assumptions for void rent loss. PRPs report a combination of factors affecting void re-let times, such as referral delays from social services upon which they are reliant, complex applicant needs and affordability assessment refusals. In addition, PRPs report decant properties for regeneration schemes and major repair and safety works.
Figure 12: Rent collection
| Qtrs | Mean | Lower Quartile | Median | Upper Quartile |
|---|---|---|---|---|
| 2026/27 - Q1 | 98.4% | 97.0% | 98.7% | 100.0% |
| 2025/26 - Q4 | 99.9% | 99.3% | 99.9% | 100.5% |
| 2025/26 - Q3 | 99.1% | 98.3% | 99.4% | 100.1% |
| 2025/26 - Q2 | 98.7% | 97.6% | 99.0% | 100.0% |
| 2025/26 - Q1 | 98.7% | 97.1% | 98.6% | 100.0% |
| 2024/25 - Q4 | 99.8% | 99.1% | 99.9% | 100.8% |
| 2024/25 - Q3 | 99.2% | 98.1% | 99.3% | 100.0% |
| 2024/25 - Q2 | 98.3% | 96.9% | 98.6% | 99.8% |
| 2024/25 - Q1 | 98.0% | 96.4% | 98.3% | 99.7% |
| 2023/24 - Q4 | 99.4% | 98.8% | 99.5% | 100.0% |
| 2023/24 - Q3 | 98.8% | 97.8% | 99.0% | 99.9% |
| 2023/24 - Q2 | 98.2% | 96.9% | 98.4% | 99.8% |
| 2023/24 - Q1 | 97.8% | 96.2% | 98.2% | 99.7% |
| 2022/23 - Q4 | 99.2% | 98.7% | 99.4% | 99.9% |
| 2022/23 - Q3 | 98.6% | 97.8% | 98.9% | 99.8% |
| 2022/23 - Q2 | 98.0% | 97.1% | 98.7% | 99.5% |
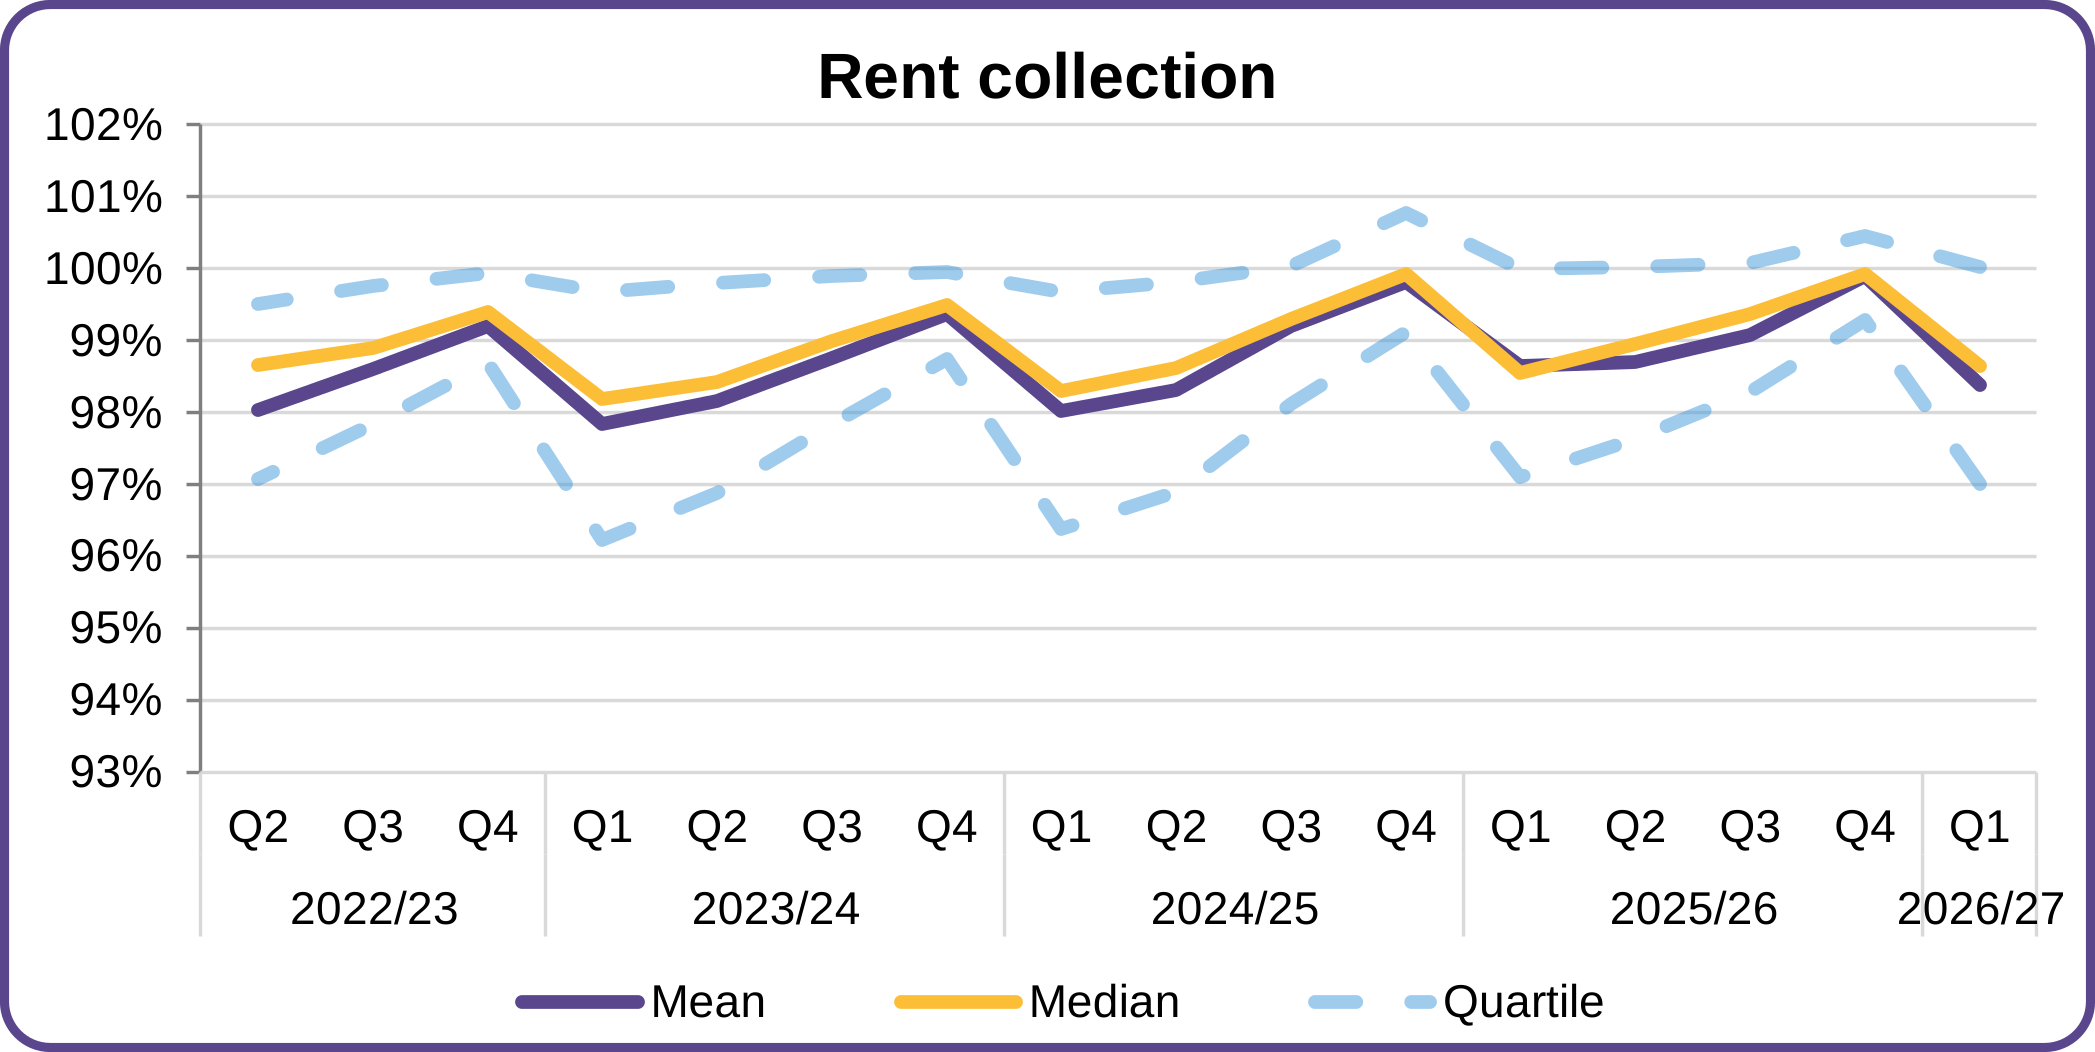
77 - Rent collection rates have decreased since the end of March, in line with seasonal trends. Mean rent collection rates stood at 98.4%, compared to 98.7% reported in the same quarter of the prior year. Median rent collection rates stood at 98.7%, comparable with the rate reported in March 2025.
78 - The number of PRPs reporting rent collection rates of less than 95% stood at 22 at the end of June (March 2026: 3, June 2025: 20). Income collection rates typically increase over the course of a financial year as Housing Benefit and Universal Credit receipts fall in line with rent charges, and for some PRPs, as rent-free weeks are applied. There can also be a delay in the uplift of Housing Benefit payments in the first quarter of the financial year after rent increases are applied in April.
-
Operating cashflow excludes current asset sales receipts and costs of sales. ‘Payments to acquire and develop housing’ include payments in respect of both current and fixed assets. ↩
-
There may be rounding differences in the calculated totals; figures are reported by PRPs in £000. ↩
-
Includes the movement in both available cash, and cash that is unavailable for use. ↩
-
The calculation of cash interest cover prudently excludes operating surpluses from properties developed for sale (either 1st tranche shared ownership sales or outright market sales). Calculations include all interest and repairs costs, without the deduction of capitalised interest. ↩
-
Value for Money metrics - Technical note guidance 2026 - GOV.UK. The EBITDA MRI interest cover metric used for VfM reporting also includes the surplus on current asset sales. ↩