Food Hygiene Rating Scheme (FHRS) Food and You 2 report: wave 11
Published 29 September 2026
Applies to England, Northern Ireland and Wales

© Crown copyright 2026
This publication is licensed under the terms of the Open Government Licence v3.0 except where otherwise stated. To view this licence, visit nationalarchives.gov.uk/doc/open-government-licence/version/3 or write to the Information Policy Team, The National Archives, Kew, London TW9 4DU, or email: psi@nationalarchives.gov.uk.
Where we have identified any third party copyright information you will need to obtain permission from the copyright holders concerned.
This publication is available at https://www.gov.uk/government/publications/food-hygiene-rating-scheme-fhrs-food-and-you-2-report-wave-11/food-hygiene-rating-scheme-fhrs-food-and-you-2-report-wave-11
Executive summary
Overview of Food and You 2
Food and You 2 is an annual official statistic survey commissioned by the Food Standards Agency (FSA), that measures consumers’ knowledge, attitudes and behaviours related to food safety and other food issues.
This report presents findings from Food and You 2: wave 11 on respondents’ awareness, use and attitudes towards the Food Hygiene Rating Scheme (FHRS). It also describes trends from wave 2 (November 2020 to January 2021) to wave 11 (May to August 2025), where comparable data is available.
Fieldwork for wave 11 was conducted between 19 May 2025 and 7 August 2025. A total of 5,898 adults (aged 16 years and over) across England, Wales and Northern Ireland completed the ‘push-to-web’ survey.
Key findings
Awareness and recognition of the FHRS
Awareness of the FHRS remained high in wave 11 (May to August 2025), with 91% of respondents reporting they had heard of the scheme. Across all waves, around 9 in 10 respondents reported they had heard of the FHRS (86%-91%).
In wave 11, 62% of respondents had heard of the FHRS and knew a lot or a bit about it. This was comparable with 62% in wave 10 (October 2024 to February 2025), but a notable increase from 47% in wave 2 (November 2020 to January 2021).
Among those who had heard of the FHRS, the most common way respondents had come across the scheme remained a food hygiene rating sticker displayed at a food business premises (84% in wave 11). The percentage who reported they had come across the FHRS on a food business’s own website (44%), on a food ordering delivery website or app (26%) and on the FSA’s website (18%) was slightly higher in wave 11 compared to all previous waves.
Recognition of the food hygiene rating sticker remained high. Across all waves, when shown an image of the sticker, around 9 in 10 respondents reported that they had seen it before (92% in wave 11).
Use of the FHRS
In wave 11, 55% of respondents had checked the food hygiene rating of a food business in the previous 12 months (either at the business premises or online), a notable increase compared to all previous waves (41%-44%).
Among those who had checked a rating in the previous 12 months, the most common way of doing so remained looking at the sticker displayed at the business (86% in wave 11). Around a quarter checked on a food business’s own website (27%) or via an online food ordering or delivery website or app (26%), while 16% checked on the FSA’s website.
In wave 11, 56% of respondents said they find it easy (very or quite) to find FHRS ratings when eating out or shopping for food in-person, while 29% said they find it easy to find FHRS ratings when ordering or shopping for food online.
Use of the FHRS in decision making
It was most common for respondents who had heard of the FHRS to say 4 (good) was the lowest food hygiene rating they would generally consider acceptable, increasing notably from 39% in wave 2 to 52% in wave 11.
In wave 11, 28% of those who had heard of the FHRS said in the last 12 months they had decided against using a food business because it did not display it’s FHRS sticker, a notable increase compared all previous waves where this had remained broadly stable (15%-18%).
Across all waves, the most common concerns about a food business not displaying its food hygiene rating sticker among those who had heard of the FHRS were that it had poor hygiene standards (53% in wave 11) or that it had a low food hygiene rating and was trying to hide it (49% in wave 11).
Views on mandatory display
Across all waves, over 9 in 10 respondents who had heard of the FHRS agreed businesses should be required by law to display their food hygiene rating at their premises (94% in wave 11).
Support for online display was also consistently high. In wave 11, over 9 in 10 respondents agreed that food hygiene ratings should be clearly displayed on a takeaway’s own website (94%), restaurant’s or café’s own website (93%), on the websites or apps of food ordering and delivery companies (93%), and on a hotel or B&B’s website (92%).
Acknowledgements
First and foremost, our thanks go to all the respondents who gave up their time to take part in the survey.
We would also like to thank the team at Ipsos who made a significant contribution to the project, particularly Dr Ammeline Wang, Claire Bhaumik, Aamina Oughradar, Stephen Finlay, Hannah Harding, Kelly Ward, Kevin Pickering and Dr Patten Smith. We would like to thank FSA Policy colleagues, Claire Voller, Chris Coker, Jonathan Downey and Una Campbell, for their time reviewing the report. Additionally, we would like to thank the FSA’s Welsh Language Translation team.
Authors: Megan Potts, Rachael Shillitoe, Robin Clifford, Matt Jenkins.
Introduction
The Food Standards Agency: role, remit, and responsibilities
The FSA is a non-ministerial government department working to protect public health and consumers’ wider interests in relation to food in England, Wales and Northern Ireland. The FSA’s overarching mission is ‘food you can trust’. The FSA’s vision as set out in the 2022-2027 strategy is a food system in which:
- food is safe
- food is what it says it is
- food is healthier and more sustainable
Introduction to the FHRS
The Food Hygiene Rating Scheme[footnote 1] (FHRS), which operates in England, Wales and Northern Ireland was launched in 2010 and helps people make informed choices about where to eat out or shop for food by giving clear information about the businesses’ hygiene standards found at the time of local authority food hygiene inspections.
Ratings are given to places where food is supplied or sold directly to people, such as restaurants, pubs, cafés, takeaways, hotels, schools, hospitals, care homes, supermarkets, and other retailers. In Wales, the scheme also includes businesses that trade only with other businesses, for example, manufacturers.
The FSA runs the scheme in partnership with local authorities in England, Wales and Northern Ireland. A food safety officer from the local authority inspects a business to check that it follows food hygiene law so that the food is safe to eat. Businesses are given a rating from 0 to 5. A rating of 5 indicates that hygiene standards are very good and a rating of 0 indicates that urgent improvement is required.
Food businesses are provided with a sticker which shows their rating for display at their premises. In England, businesses are encouraged to display their rating, however in Wales and Northern Ireland food businesses are legally required to display their rating sticker in a prominent place such as their door or window[footnote 2]. Ratings are also available on the FSA ratings website and via other third-party apps.
Food and You 2
Food and You 2 is an official statistic survey commissioned by the FSA, with fieldwork conducted by Ipsos. It is designed to monitor progress against the FSA’s mission and vision, and to inform policy decisions by measuring consumers’ self-reported knowledge, attitudes and behaviours relating to food safety and other food-related topics in England, Wales and Northern Ireland.
This report presents key findings from the Food and You 2 survey relating to the FHRS, including respondents’ awareness, recognition, and use of the FHRS, impact of the FHRS on behaviour, and attitudes toward the FHRS. The data is drawn primarily from wave 11, however where comparable data is available trends from wave 2 (November 2020 to January 2021) to wave 11 (May to August 2025) are included. Previous FHRS publications from this series are available on the Food and You 2 webpage.
Fieldwork for Food and You 2: wave 11 was conducted between 19 May 2025 and 7 August 2025. A total of 5,898 adults (aged 16 years and over) from 4,215 households across England, Wales, and Northern Ireland completed the ‘push-to-web’ survey (see annex A for more information about the methodology).
Wave 11 marks the first in the annual series of Food and You 2, from formerly being biannual between waves 1 and 10.
In wave 11 Scotland was included in Food and You 2, funded by Food Standards Scotland (FSS), however all findings reported in this publication relate to England, Wales and Northern Ireland only.
Depending on their reported knowledge, attitudes, and behaviours not every respondent will answer every question in the survey or module. Fieldwork dates for other waves in which comparable data on FHRS related questions are available are provided in Annex A - Table 1.
The full results from wave 11, and all previous waves, are available in the accompanying data tables and underlying dataset. Further information on the survey’s history, methodology and topics covered can be found in the Food and You 2: wave 11 key findings report and accompanying technical report, which also includes information about the research’s limitations.
Interpreting the findings
Reporting conventions
Percentage calculations are based only on respondents who responded to each question. Reported values and calculations are based on weighted totals. Key information is provided for each reported question in the footnotes, including:
- question wording (question) and response options (response)
- number of respondents presented with each question and description of the respondents who answered the question (Unweighted base = N)
Demographic analysis
Key demographic variables analysed include age, ethnicity, geographical characteristics (country, region, urban/rural classification), household size, presence of children in the household (under 16 or under 6), long term health conditions, annual household income and food security status (see annex A).
However, differences between these sub-groups are typically only included in this report if they are statistically significant at the 5% level (p<0.05) and:
- meet a minimum base size of 100
- are considered of interest or meaningful to the FSA
- represent a difference of 10 percentage points or more between the groups
Some country-level differences are included where the difference is less than 10 percentage points, as these findings are judged to be of policy interest. These differences are indicated with a double asterisk (**).
Other demographic cross breaks are available in the wave 11 data set and tables, but are not captured in this report for brevity, because they do not meet these criteria, or because the subgroups available are too small to draw meaningful conclusions.
Any demographic analysis presented in this report refers to wave 11 findings only.
Trends
Trend analysis is generally included where the question has been asked in at least three survey waves, including wave 11. However, not all available trend data are included in this report. For questions asked for the first time, only wave 11 findings are reported.
To highlight notable differences, variations in responses are reported whenever the absolute difference is 10 percentage points or larger and is statistically significant at the 5% level (p<0.05).
Where a variation in response between waves is less than 10 percentage points but is judged to be of interest, and is statistically significant at the 5% level, these are reported as slight changes and indicated with a double asterisk (**).
Where there is no significant difference between responses across waves, the pattern of responses is described as being stable.
Notes on interpretation
This report is based on data from a mixed-mode survey, using both postal and online questionnaires, using a random probability sampling approach. Weighting is applied to support representativeness of the data; including for some groups that may be underrepresented in online only surveys. However, as with all sample surveys, the findings remain subject to sampling uncertainty and potential non-response bias.
The findings are also based on self-reported data. Although the survey design and methodology are intended to help reduce bias, some responses may be affected by social desirability bias (where people provide answers they believe are more socially acceptable) and recall bias (where people do not remember past events or experiences accurately). In addition, some breakdowns are based on small numbers of respondents, which can limit the level of detail that can be reported.
Further information on the research is available in the technical report.
Chapter 1: awareness and recognition of the FHRS
This chapter provides an overview of respondents’ awareness and recognition of the Food Hygiene Rating Scheme (FHRS).
Awareness and knowledge of the FHRS
In wave 11 (May 2025 to August 2025), around nine in ten respondents (91%) reported that they had heard of the FHRS[footnote 3]. This included 62% who reported that they had heard of the FHRS and knew quite a lot or a bit about it and 29% who had heard of the FHRS but didn’t know much or anything about it. A further 9% had never heard of the FHRS[footnote 4].
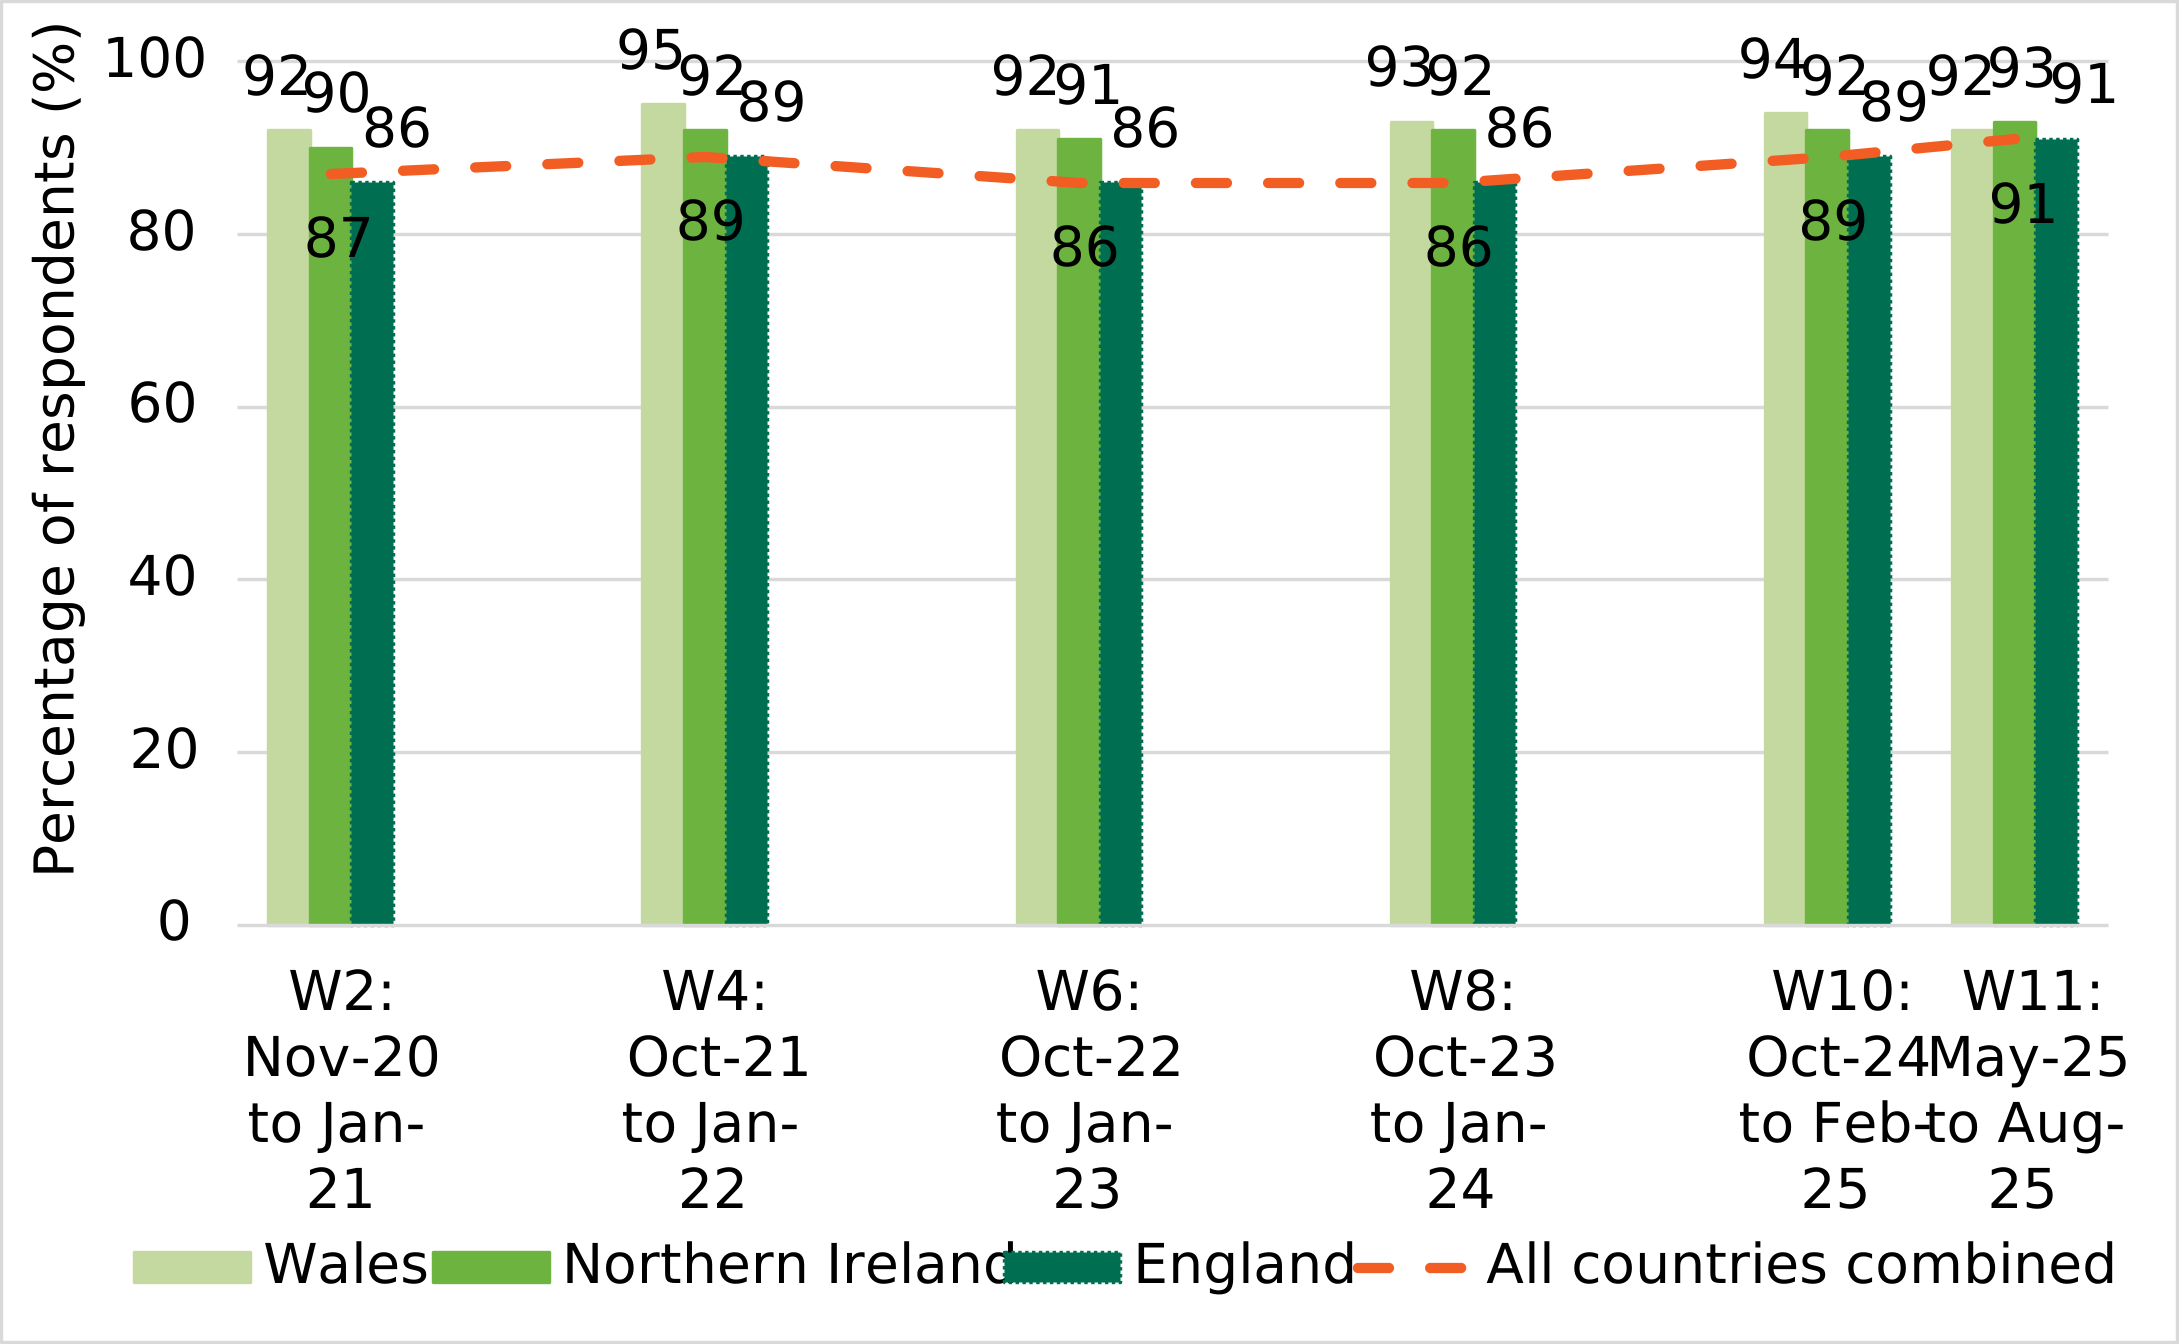
Awareness of the FHRS remained consistently high from wave 2 (November 2020 to January 2021) to wave 11, with around 9 in 10 respondents reporting they had heard of the scheme in each wave (86%-91%**). This reflects high levels of awareness in Wales (92%-95%), Northern Ireland (90%-93%) and England (86%-91%) (Figure 1).
Figure 1: The percentage of respondents in England, Wales and Northern Ireland who had heard of the FHRS from wave 2 to wave 11 (Awareness).
Source: Food and You 2: waves 2, 4, 6, 8, 10 and 11.
While awareness of the FHRS remained high, knowledge of the scheme notably increased over time. The percentage of respondents who reported that they had heard of the FHRS and knew a quite a lot or a bit about it[footnote 5] was lower in wave 2 (November 2020 to January 2021) than in all subsequent waves (47%). After notably increasing to 59% in wave 4 (October 2021 to January 2022), the percentage reporting this remained relatively stable from wave 4 to wave 8 (October 2023 to January 2024) (ranging between 55% to 59%), before increasing slightly to 62% in wave 10 (October 2024 to February 2025) and remaining at that level in wave 11 (May to August 2025).
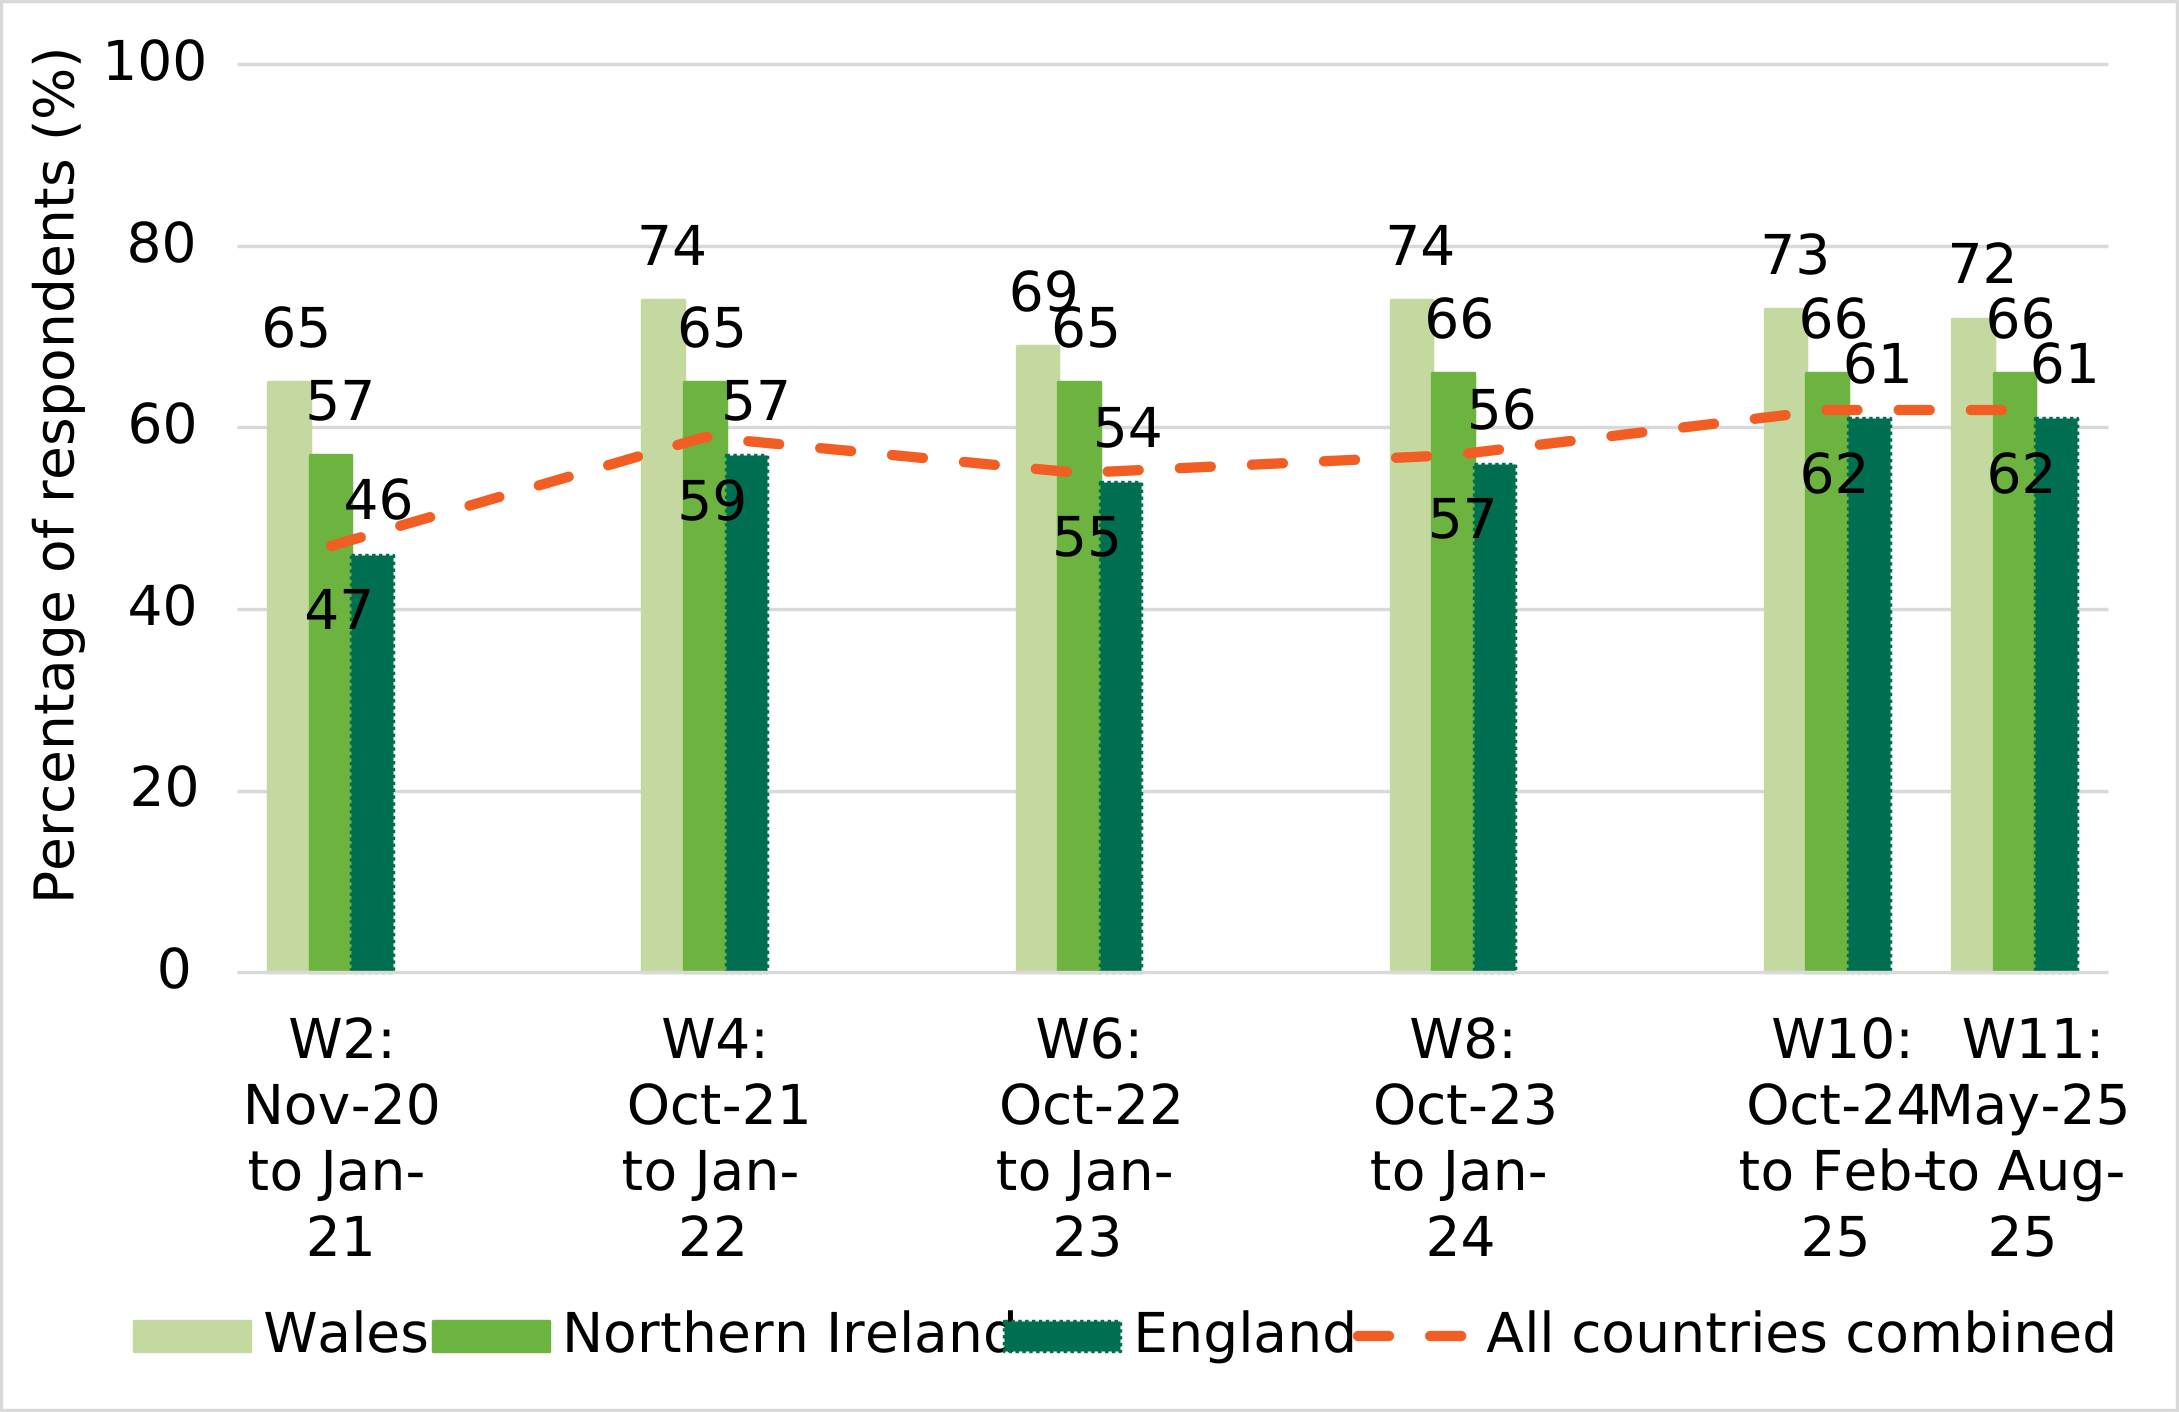
Across most waves, respondents in Wales (65-74%) were more likely to report they had heard of and knew at least a bit about the FHRS than those in Northern Ireland (57-66%)** and England (46-61%) (Figure 2).
Figure 2: The percentage of respondents in England, Wales and Northern Ireland who had heard of the FHRS and had at least a bit of knowledge about it from wave 2 to wave 11.
Source: Food and You 2: waves 2, 4, 6, 8, 10 and 11.
Knowledge of the FHRS (heard of it and know at least a bit about it) also varied among different demographic groups. For example, in wave 11:
Age: Respondents aged between 25 and 64 (64%-68%) were more likely to report knowledge of the FHRS than those aged 16 to 24 (54%) and those aged 75 or older (47%).
Region (England)[footnote 6]: Respondents living in the East Midlands (71%) were more likely to report knowledge of the FHRS than those living in regions such as Yorkshire and the Humber (61%), the East of England (59%), Greater London (59%), the West Midlands (58%), and the South East (57%).
Household size: Respondents living in single adult households (56%) were less likely to say they knew at least a bit about the FHRS than those living in households of 4 (66%).
Sources of awareness of the FHRS
Respondents who had heard of the FHRS were asked where they had come across it. In wave 11 (May 2025 to August 2025), the most common place was a food hygiene rating sticker displayed at a food business premises (84%). Other common sources included on a food business’ website (44%), and a food ordering delivery website or app (for example, Just Eat, Deliveroo, Uber Eats) (26%). Smaller proportions of respondents said they had come across the FHRS on the FSA’s website (18%) and by word of mouth (16%)[footnote 7].
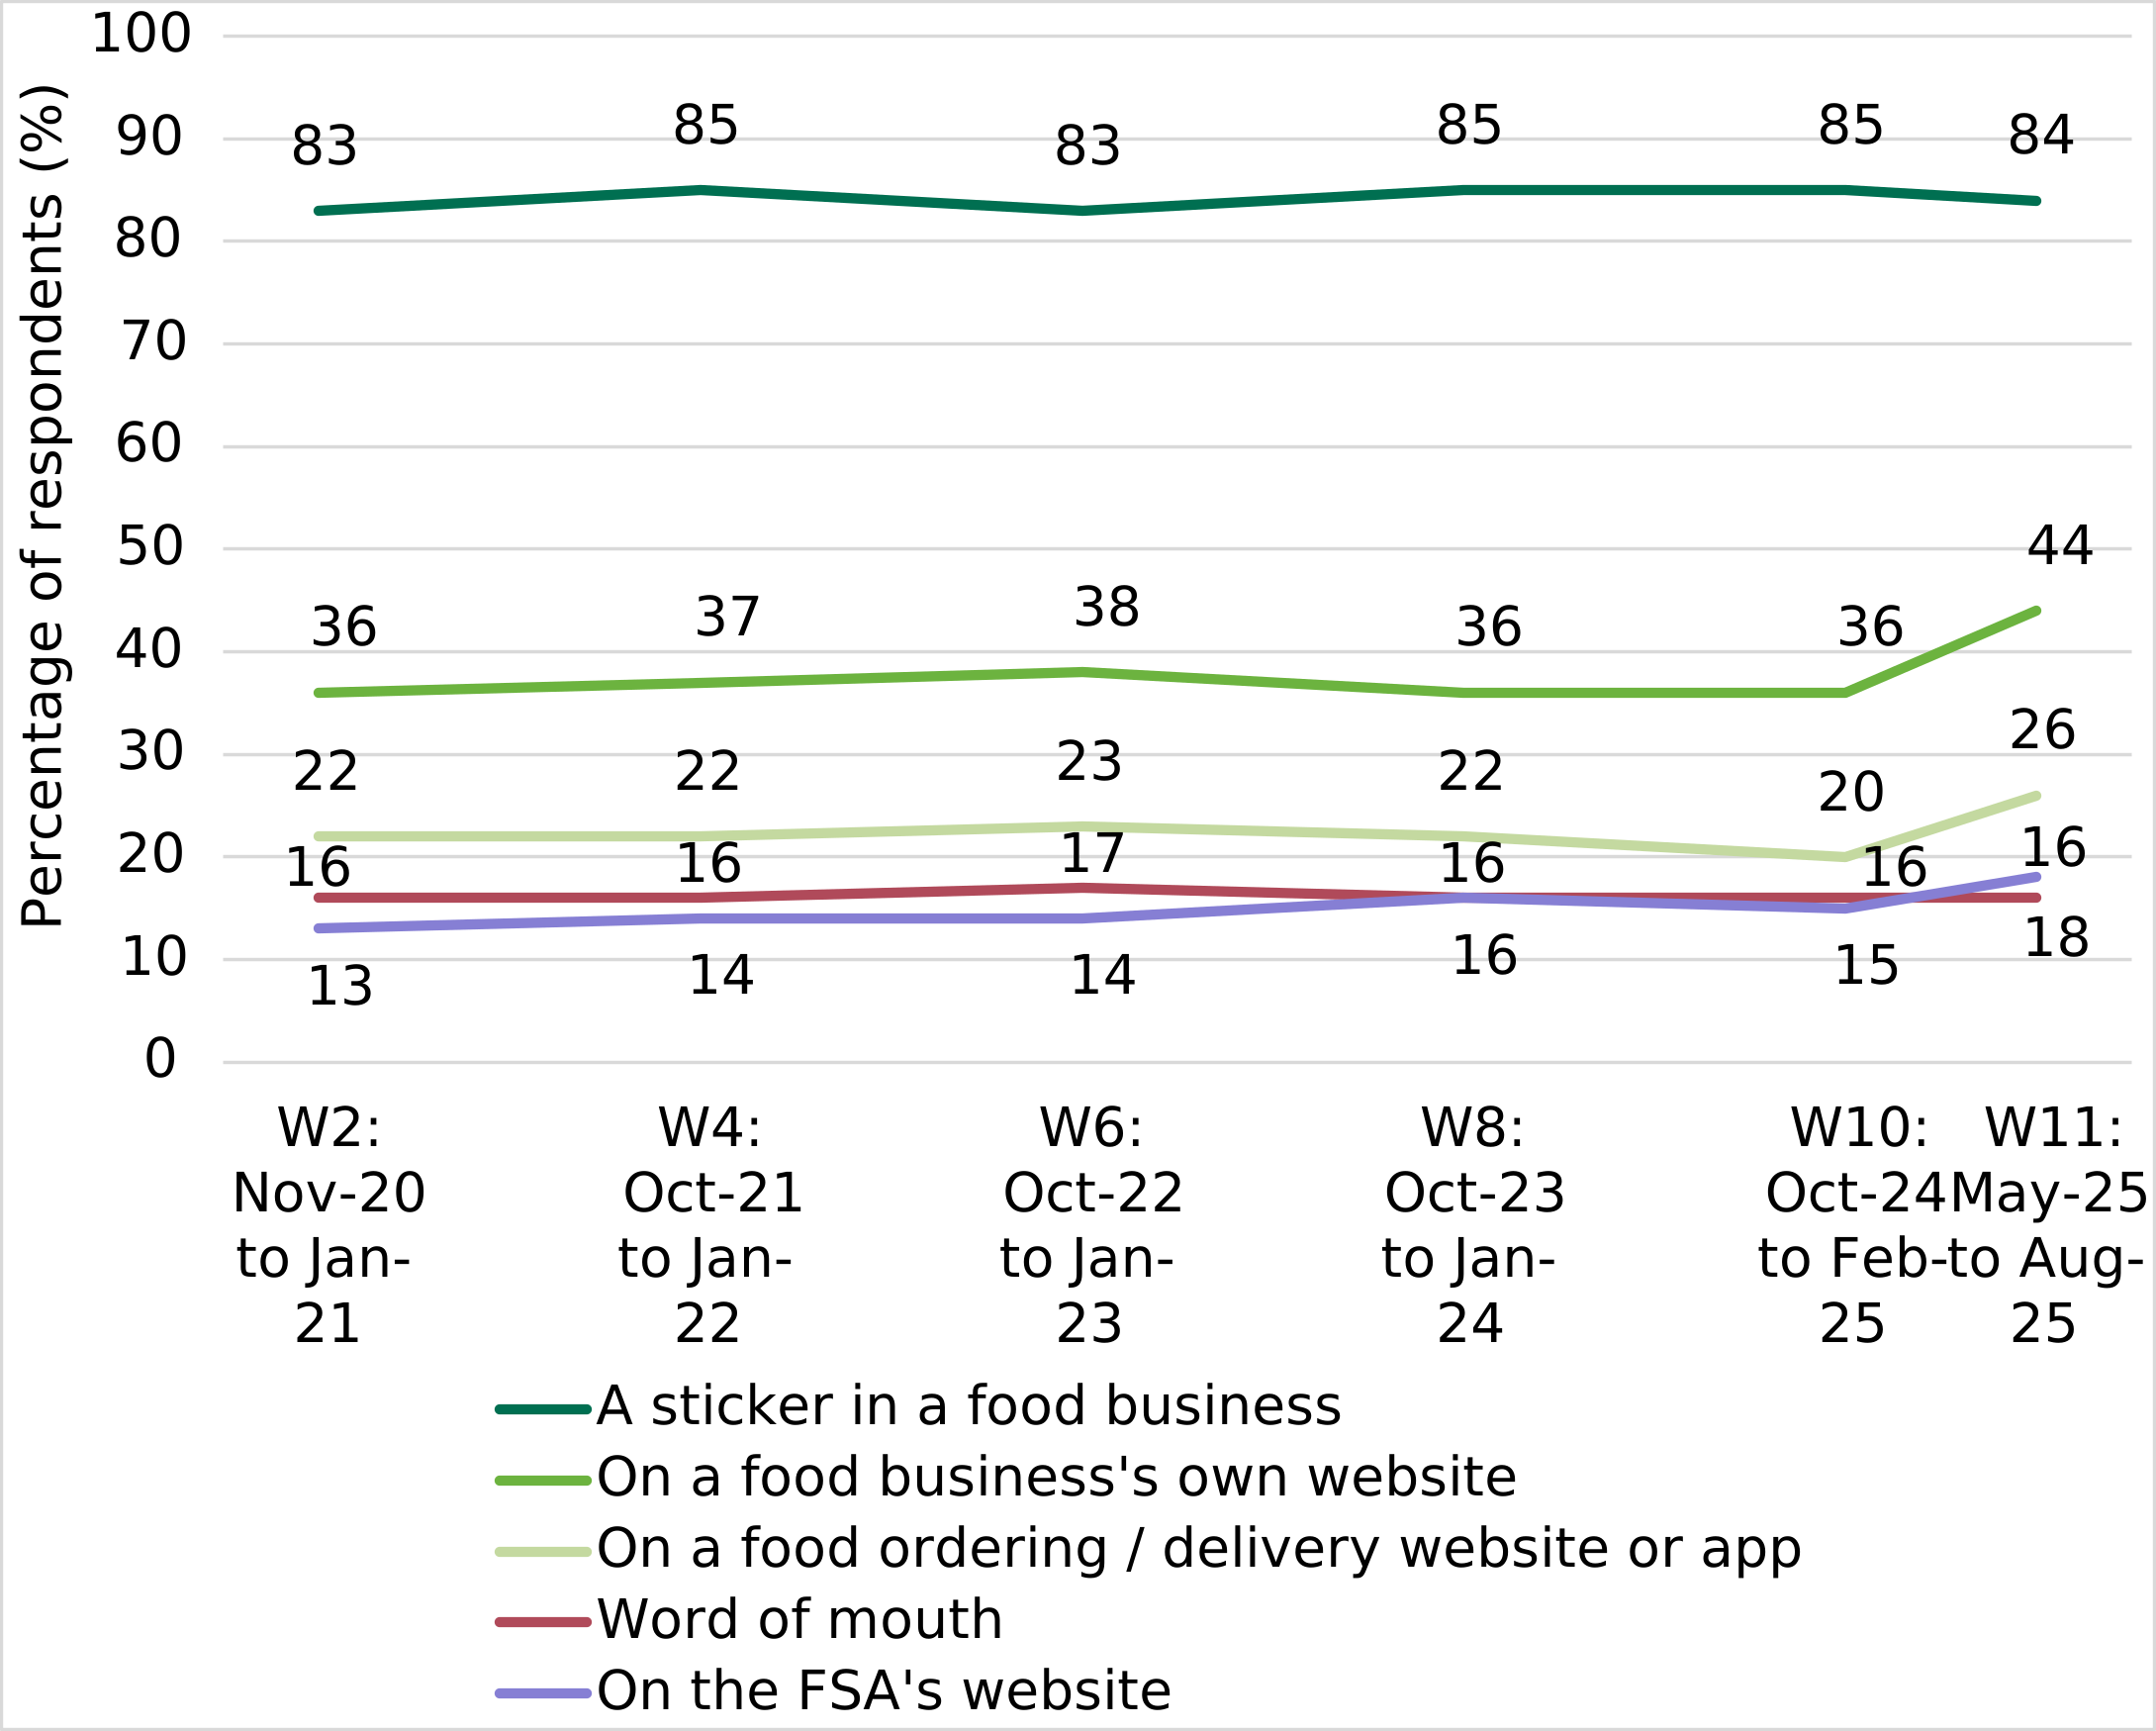
Since wave 2 (November 2020 to January 2021) these five sources were consistently the most common ways respondents reported coming across the FHRS. However, the percentage of respondents reporting the following sources increased slightly in wave 11 compared to all previous waves, where levels had remained stable (Figure 3):
- on a food business’s own website (44% in wave 11, compared to 36%-38% in previous waves**)
- on a food ordering, delivery website or app (26% in wave 11, compared to 20%-23% in previous waves**)
- on the Food Standards Agency’s website (18% in wave 11, compared to 13%-16% in previous waves**)
Figure 3: Top five ways respondents had come across the FHRS from wave 2 to wave 11.
Source: Food and You 2: waves 2, 4, 6, 8, 10 and 11.
In wave 11, the five most common ways respondents reported they had come across the FHRS were consistent across England, Wales and Northern Ireland, although the percentage who reported each source varied slightly by country (see Figure 4). For example:
- respondents in Wales (90%) and Northern Ireland (88%) were slightly more likely to report they had come across the scheme through an FHRS sticker displayed at a food business premises than those in England (84%)**
- respondents in England (44%) and Wales (43%) were slightly more likely than those in Northern Ireland (35%)** to have come across the FHRS on a food business’s own website
- respondents in England (26%) and Wales (25%) were slightly more likely than those in Northern Ireland (19%)** to have come across the FHRS on a food ordering or delivery app (such as Just Eat, Deliveroo, Uber Eats)
- respondents in Wales (23%) and Northern Ireland (19%) were slightly more likely than those in England (15%)** to have come across the FHRS via word of mouth
- respondents in Wales (20%) were slightly more likely than those in Northern Ireland (15%)** to have come across the FHRS on the FSA’s website
Figure 4: Top five ways Wave 11 respondents had come across the FHRS in England, Wales and Northern Ireland.
| Location | England | Wales | Northern Ireland |
|---|---|---|---|
| A sticker in a food business | 84 | 90 | 88 |
| On a food business’ own website | 44 | 43 | 35 |
| On a food ordering, delivery website or app | 26 | 25 | 19 |
| Word of mouth | 15 | 23 | 19 |
| On the FSA’s website | 18 | 20 | 15 |
Source: Food and You 2: wave 11
There were also demographic differences in where respondents had come across the FHRS. The findings below focus on the two most commonly reported sources overall, although differences were observed across a range of sources.
In wave 11, the percentage of respondents who reported they had come across the FHRS via a sticker in a food business (the most commonly reported source overall) varied among the following groups:
Age: Respondents aged under 75 (83%-88%) were more likely to report they had come across the FHRS via a sticker in a food business than those aged 75 and older (73%).
Household income: Respondents with higher annual household incomes, for example those with an annual household income of £96,000 or more (92%), £64,000-£95,999 (89%) and £32,000-£63,999 (89%) were more likely to report they had come across the FHRS via a sticker in a food business than those with an annual household of less than £19,000 (77%).
Region (England)[footnote 8]: Respondents living in the East of England (89%), North West (88%), and South West (88%) of England were more likely to report they had come across the FHRS via a sticker in a food business compared to those living in the North East (78%), and West Midlands (78%).
The percentage of respondents in wave 11 who reported they had come across the FHRS on a food business’ own website (the second most commonly reported source overall) also varied by age, annual household income and region:
Age: Respondents in middle aged groups were more likely to report they had come across the FHRS on a food business’ own website than those in both younger and older age groups. For example, 52% of those aged 35 to 44 reported this, compared to 40% of those aged 16 to 24, 42% of those aged 55 to 64, 38% of those aged 65 to 74 and 29% of those aged 75 or over.
Household income: Respondents with higher annual household incomes, for example £96,000 or more (54%) and £64,000-£95,999 (52%), were more likely to report they had come across the FHRS on a food business’ own website compared to those with an annual household of £19,000-£31,999 (40%) and less than £19,000 (35%).
Region (England): Respondents living in the East of England (49%) were more likely to report they had come across the FHRS on a food business’ own website compared to those living in the North West (39%) and Greater London (38%).
Recognition of the FHRS sticker
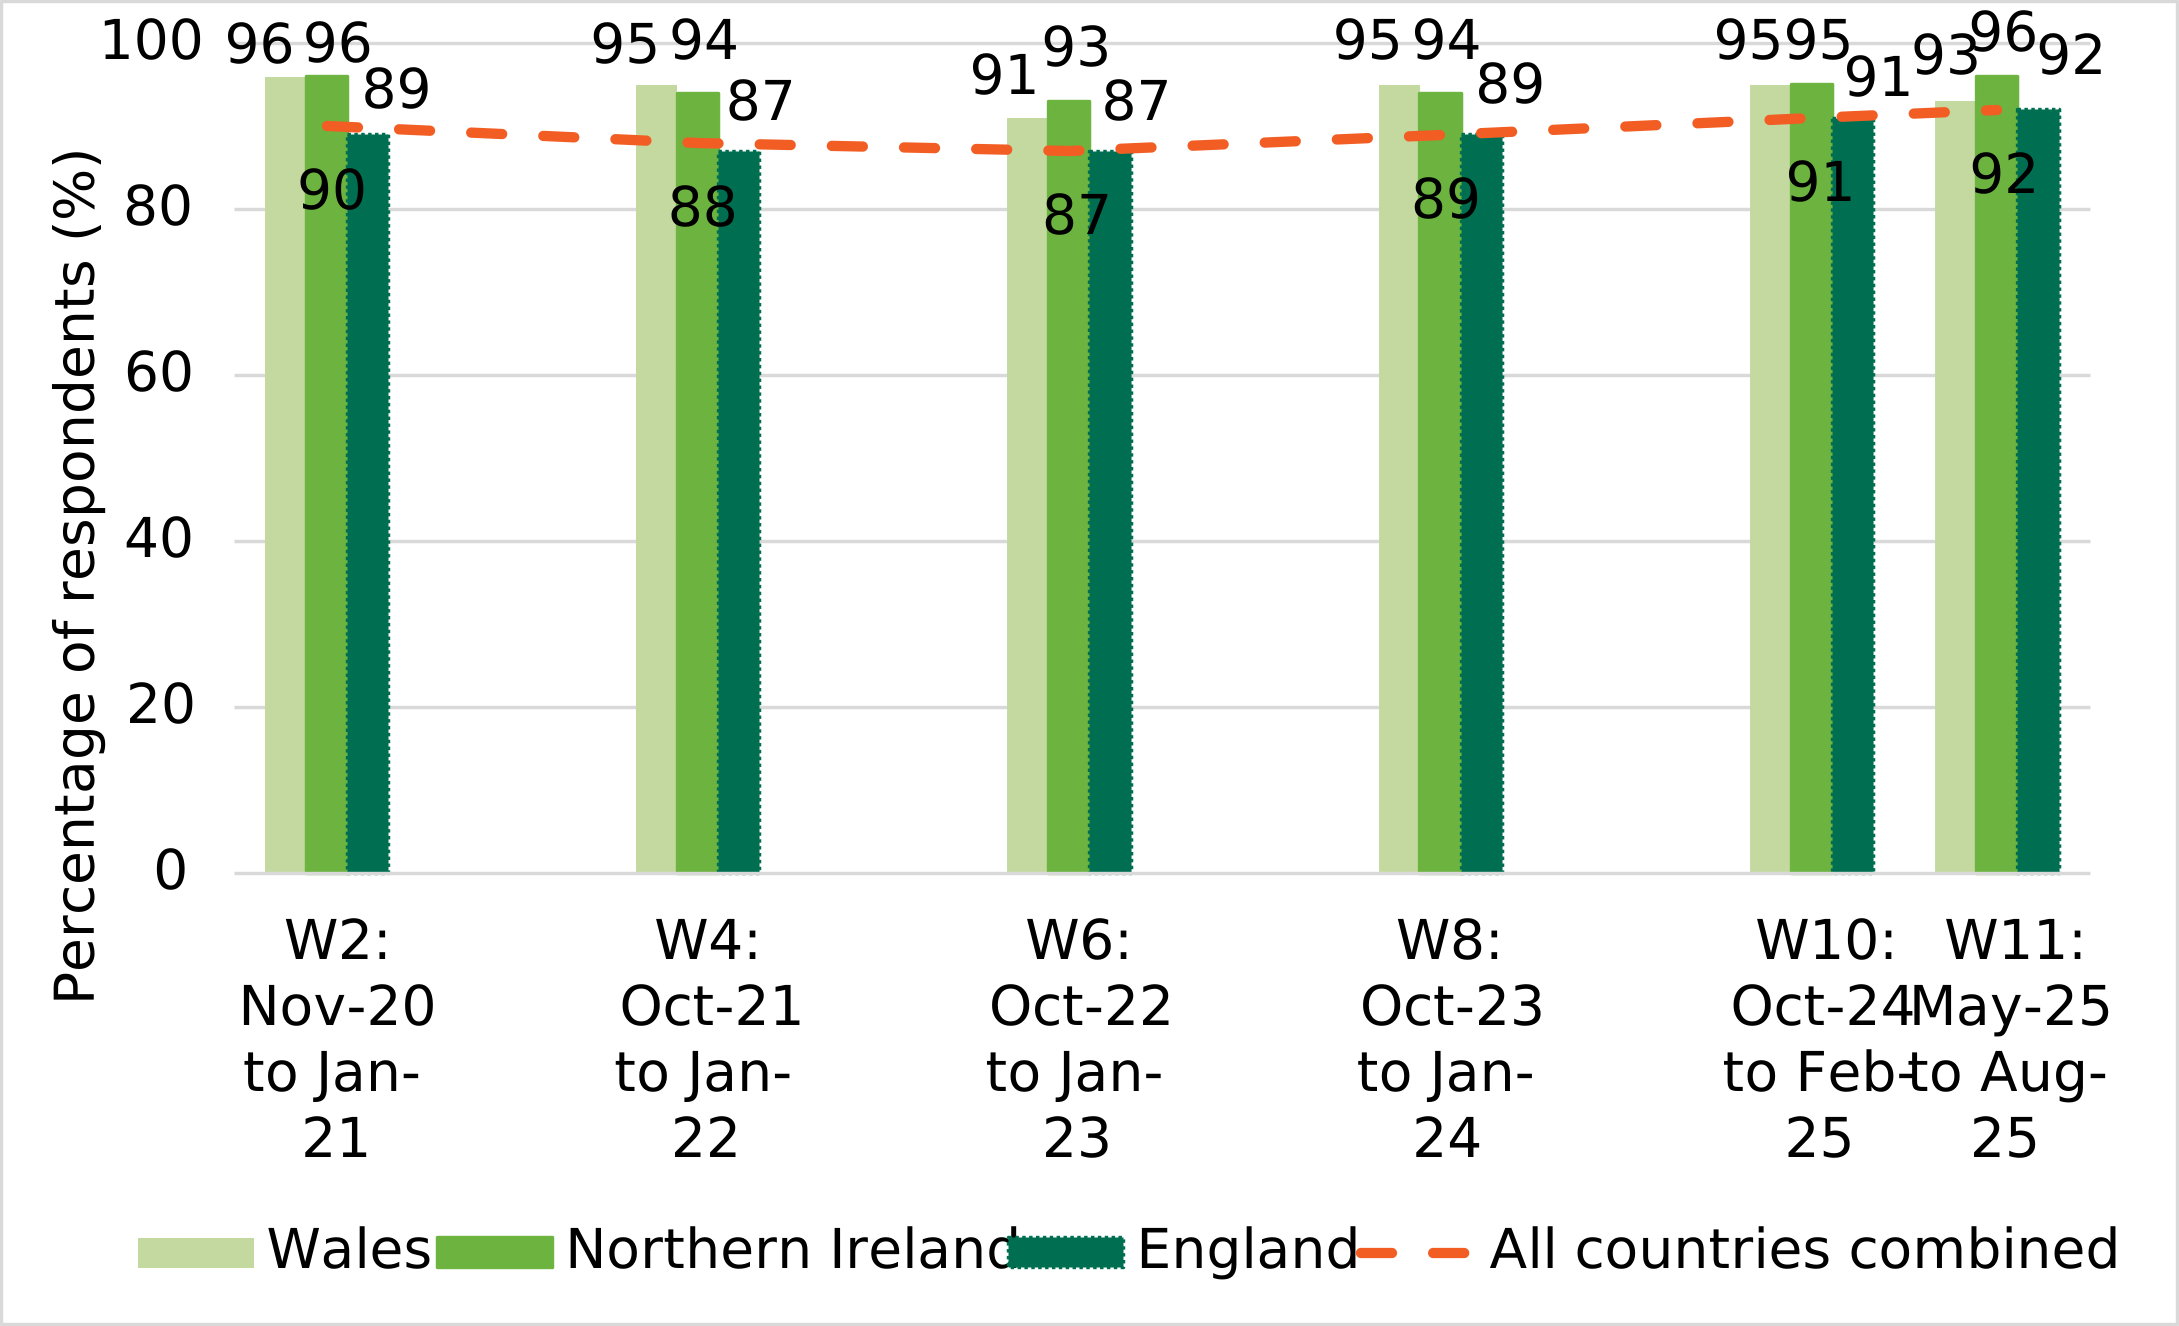
In wave 11 (May 2025 to August 2025), when shown an image of the food hygiene rating sticker, 92% of respondents reported that they had seen the sticker before[footnote 9]. Recognition of the sticker remained high since wave 2 (November 2020 to January 2021), despite some slight fluctuations between waves (87%-92%**) (Figure 5).
In most waves, recognition of the food hygiene rating sticker was slightly higher in Northern Ireland (93-96%) and Wales (91-96%) than in England (87-92%)**. However, in wave 11 recognition was slightly higher in Northern Ireland (96%) than both Wales (93%) and England (92%)**.
Figure 5: Recognition of the food hygiene rating sticker in England, Wales and Northern Ireland from wave 2 to wave 11.
Source: Food and You 2: waves 2, 4, 6, 8, 10 and 11.
Recognition of the food hygiene rating sticker also varied across demographic groups. For example, in wave 11:
Age: Respondents aged under 75 were more likely to recognise the FHRS sticker than those aged 75 or over. For example, 97% of those aged 25 to 34 and 35 to 44 said they had seen the FHRS sticker before, compared to 70% of those aged 75 and older.
Household size: Respondents living in households of 3 or more people (for example, 95% of those living in households of 3 or 4) were more likely to recognise the FHRS sticker than those living in single adult households (83%).
Chapter 2: use of the FHRS
This chapter provides an overview of respondents’ use of the Food Hygiene Rating Scheme (FHRS).
Checking food hygiene ratings
All respondents, regardless of their knowledge about the scheme, were asked if they had checked the food hygiene rating of a food business in the previous 12 months (either at the business’ premises or online) regardless of whether they decided to buy food there or not.
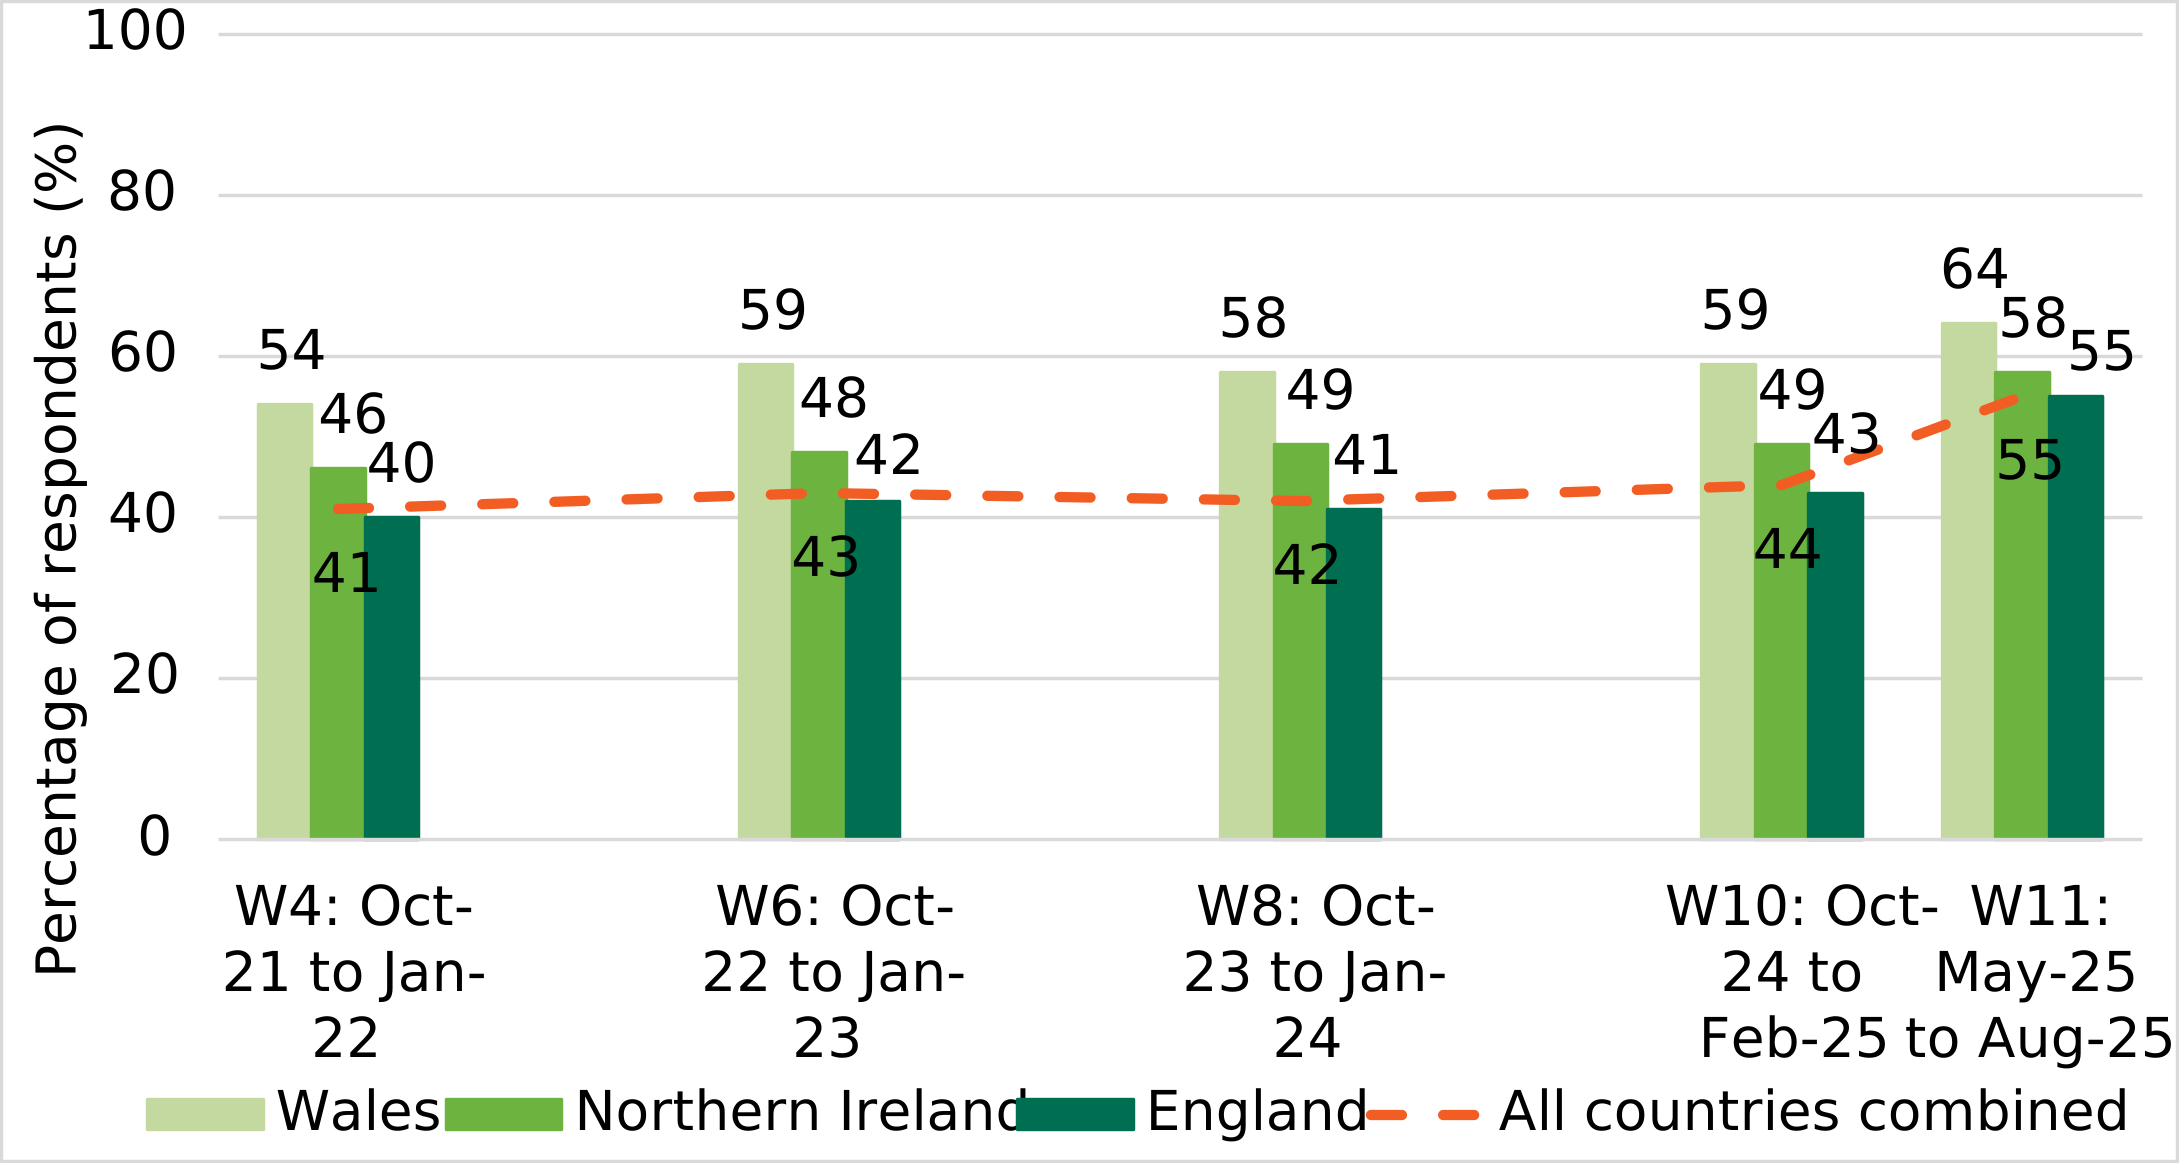
In wave 11 (May 2025 to August 2025), over half (55%) of respondents had checked the food hygiene rating of a food business in the previous 12 months[footnote 10]. This was a notable increase compared to all previous waves where levels had remained broadly stable (41%-44%) (Figure 6).
Respondents in Wales were consistently more likely to have checked the food hygiene rating of a business than those in England, and those in Northern Ireland. For example, in Wave 11, 64% of respondents in Wales reported they had checked the food hygiene rating of a business in the last 12 months, compared to 58%** of respondents in Northern Ireland and 55%** of respondents in England.
Figure 6: The percentage of respondents who had checked the hygiene rating of a food business from wave 4 to wave 11.
Source: Food and You 2: waves 4, 6, 8, 10 and 11.
There was some variation between demographic groups in the percentage of respondents reporting they had checked food hygiene rating of a food business. For example, in wave 11:
Age: Younger respondents were more likely to report they had checked the food hygiene rating of a food business. For example, 67% of those aged 16 to 24 reported they had done this, decreasing with age to 57% of those aged 45 to 54, 50% of those aged 55 to 64, 49% of those aged 65 to 74 and 29% of those aged 75 and over.
Household size: Respondents living in larger households were more likely to report they had checked the food hygiene rating of a food business. For example, 64% of those living in a household of 5 or more, 60% of those in households of 4 and 58% of those in households of 3, compared to 44% of those living in single adult households.
Children in household: Respondents with children aged under 16 present in the household (62%) were more likely to report they had checked the food hygiene rating of a food business than those with no children aged under 16 present in the household (52%).
Region (England)[footnote 11]: Respondents living in the East Midlands (62%) were more likely to report they had checked the food hygiene rating of a food business, compared to those living in South East (52%), East (50%) and South West (49%) of England.
Ethnicity[footnote 12]: Respondents who are Asian or Asian British (64%) were more likely to report they had checked the food hygiene rating of a food business, compared to those who are White (54%).
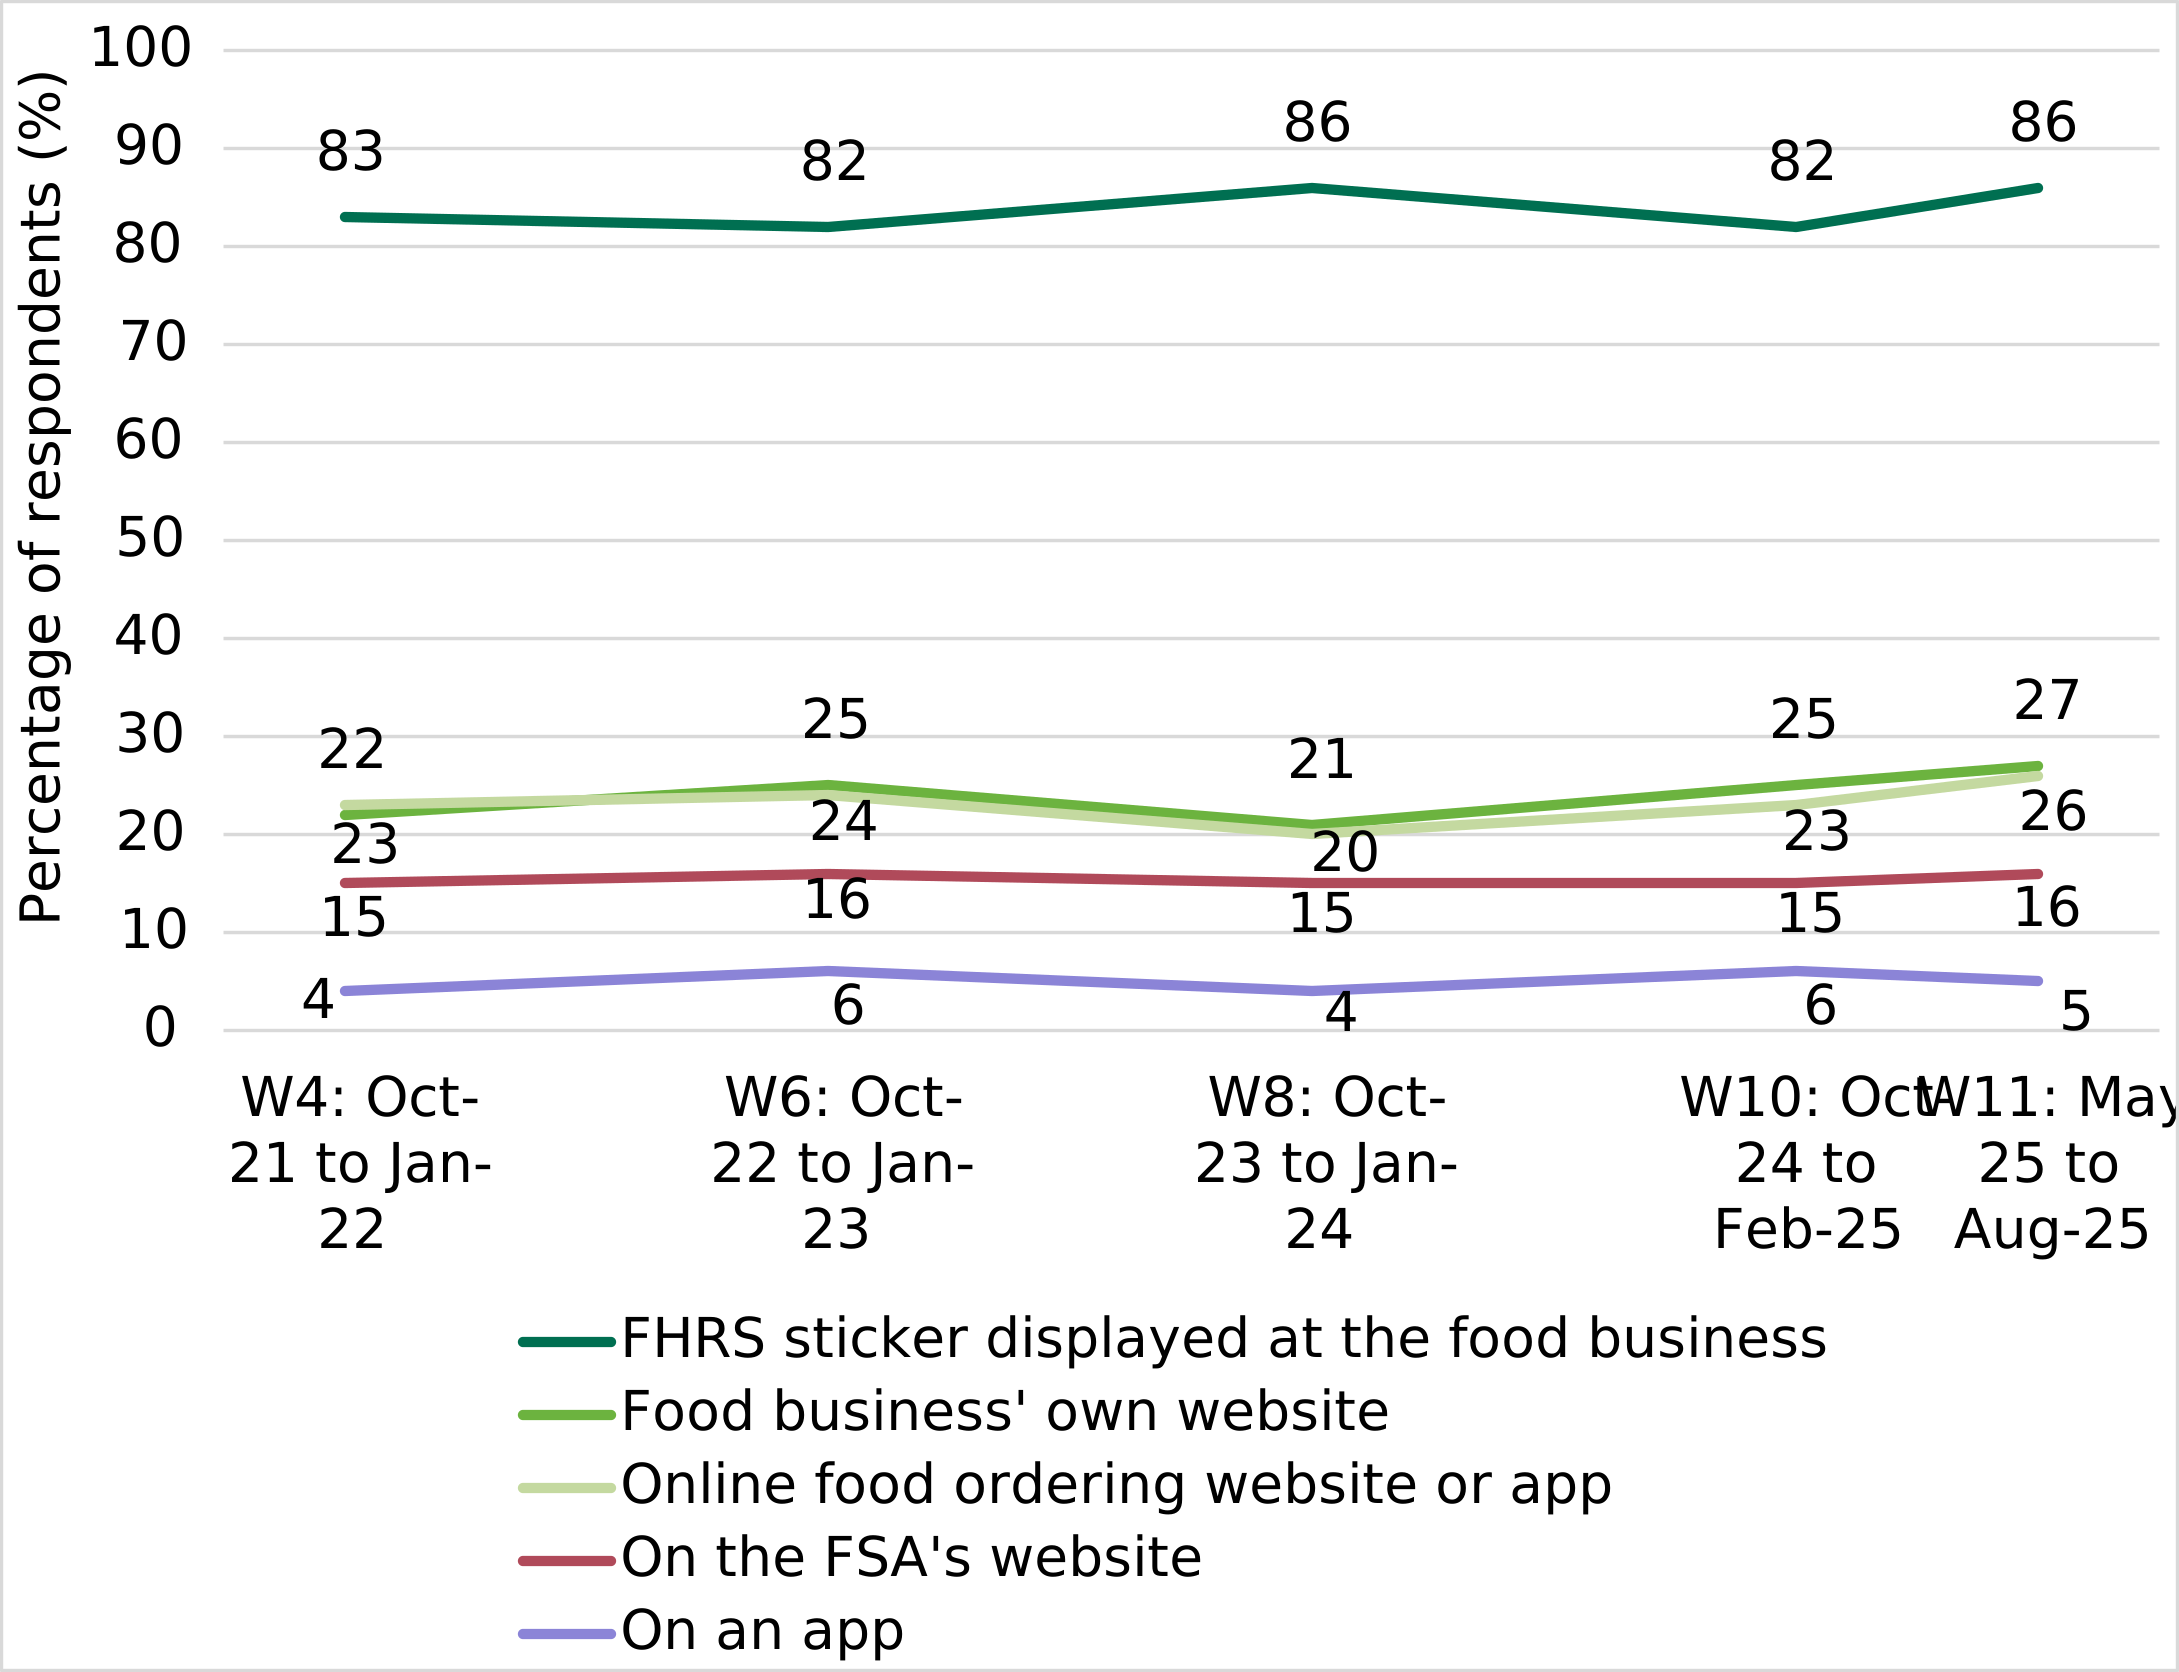
Respondents who had checked the food hygiene rating of a business were asked how they had checked the rating. In wave 11, most (86%) respondents had looked at the food hygiene rating sticker displayed at the food business. Around a quarter had checked the food hygiene rating of a business on a food business’ own website (27%), or via an online food ordering website or app (for example, Just Eat, Deliveroo, Uber Eats) (26%). A smaller proportion of respondents had checked on the FSA’s website (16%)[footnote 13].
Across all waves, checking the sticker displayed at the food business remained the most commonly reported method, despite some slight fluctuations over time (82%-86%**). Between wave 8 (October 2023 to January 2024) and wave 11 (May 2025 to August 2025), there was a slight increase in the percentage of respondents who reported checking the hygiene rating of a food business on a food business’s own website (from 21% to 27%)**, and on an online food ordering website or app (from 20% to 26%**). Other methods for checking the food hygiene rating of a business remained broadly stable across waves (Figure 7).
Figure 7: Top five ways respondents had checked the hygiene rating of food businesses from wave 4 to wave 11.
Source: Food and You 2: waves 4, 6, 8, 10 and 11.
The percentage of respondents who reported they had checked the food hygiene rating of a business using these methods varied slightly by country. For example, in wave 11 (Figure 8):
- respondents in Northern Ireland (92%) and Wales (89%) were slightly more likely to have checked the food hygiene rating of a business by looking at a sticker displayed in the food businesses window, than those in England (85%)**
- respondents in England (28%) and Wales (27%) were slightly more likely to have checked the food hygiene rating of a business by checking a food business’ own website, than those in Northern Ireland (19%)**.
- respondents in England (27%) and Wales (21%) were slightly more likely to have checked the food hygiene rating of a business by checking an online food ordering website or app, than those in Northern Ireland (13%)**
- respondents in Wales (18%) and England (16%) were slightly more likely to have checked the food hygiene rating of a business by the FSA’s website, than those in Northern Ireland (12%)**
Figure 8: Top five ways wave 11 respondents had checked FHRS ratings in England, Wales, and Northern Ireland.
| How the hygiene rating was checked | England | Wales | Northern Ireland |
|---|---|---|---|
| FHRS sticker displayed at the food business | 85 | 89 | 92 |
| Food businesses’ own website | 28 | 27 | 19 |
| Online food ordering website or app (for example, Just Eat, Deliveroo or Uber Eats) | 27 | 21 | 13 |
| On the FSA’s website | 16 | 18 | 12 |
| On an app (for example, Scores on the Doors Food Hygiene Rating) | 5 | 4 | 4 |
Source: Food and You 2: wave 11.
In wave 11, there were also differences in how respondents said they had checked food hygiene ratings by age groups. For example:
- respondents aged 16 to 24 (91%) and aged 65 to 74 (93%) were more likely to say they had checked an FHRS sticker displayed at the food business, compared to those aged 25 to 34 (80%)
- respondents aged 35 to 44 (34%) were more likely to say they had checked food business’ own website, compared to those aged 16 to 24 (21%) and those aged over 75 (20%)
- respondents aged under 45 (for example 38% of those aged 35 to 44) were more likely to say they had checked an online food ordering website or app, compared to those aged over 55 (for example 7% of those aged 65 to 74)
- respondents aged between 25 and 44 (for example 24% of those aged 35 to 44) were more likely to say they had checked on the FSA’s website, compared to those aged 16 to 24 (10%) and those aged over 65 (for example 4% of those aged over 75)
Additionally, there were a number of regional (England)[footnote 14] differences in how respondents in wave 11 said they had checked food hygiene ratings. For example:
- respondents in Greater London (90%) and the South West (88%) were more likely to say they had checked an FHRS sticker displayed at the food business, compared to those in the West Midlands (78%)
- respondents in Greater London (35%), West Midlands (31%) and the North West (28%) were more likely to say they had checked on an online food ordering website or app, compared to those in the South West (17%)
- respondents in the East of England (24%) were more likely to say they had checked on the FSA’s website, compared to those in the West Midlands (13%), Greater London (13%) and the South West (10%)
Consideration of food hygiene ratings when eating out or ordering a takeaway
Respondents were asked which factors, from a given list of responses, they generally considered when deciding where to eat out or order a takeaway from[footnote 15].
In wave 11 (May 2025 to August 2025), of those who had ordered food from a takeaway, the factors most commonly taken into consideration when deciding where to order from, were the respondents’ previous experience of the takeaway (82%) and the quality of food (80%).
Just under half (48%) of respondents considered the food hygiene rating when deciding where to order a takeaway from (Figure 9)[footnote 16]. Respondents in Wales (52%) and England (48%) were more likely to consider the food hygiene rating than respondents in Northern Ireland (40%)**.
Figure 9: Ten most common factors taken into consideration when ordering a takeaway (wave 11).
| Factor considered | Percentage of respondents |
|---|---|
| Previous experience of the takeaway | 82 |
| Quality of food | 80 |
| Price (including cost of delivery) | 70 |
| Recommendations from family or friends | 65 |
| Type of food (for example, cuisine or vegetarian or vegan options) | 58 |
| Offers, deals or discounts available | 52 |
| Location of takeaway | 49 |
| Delivery or collection times | 49 |
| Food Hygiene Rating | 48 |
| Reviews (for example, on TripAdvisor, Google or social media) | 45 |
Source: Food and You 2: wave 11.
Of those who eat out, the factors most commonly taken into consideration when deciding where to eat were the quality of food (86%) and the respondents’ previous experience of the place (81%) (Figure 10)[footnote 17].
Food Hygiene ratings were not among the top ten most commonly reported considerations, with just under half (48%) of respondents saying they generally consider this when deciding where to eat out. Respondents in Wales (57%) were more likely to consider the food hygiene rating when deciding where to eat than respondents in England (47%) and Northern Ireland (46%).
Figure 10: Ten most common factors taken into consideration when eating out (wave 11).
| Factor considered | Percentage of respondents |
|---|---|
| Quality of food | 86 |
| Previous experience of the place | 81 |
| Price | 77 |
| Recommendations from family or friends | 74 |
| Location | 74 |
| Cleanliness of the place | 71 |
| Quality of service | 66 |
| Type of food (for example, cuisine or vegetarian or vegan options) | 60 |
| Ambiance or atmosphere | 57 |
| Offers, deals or discounts available | 50 |
Source: Food and You 2: wave 11.
Ease of finding FHRS ratings in-person and online
Respondents were asked how easy or difficult it is to find FHRS ratings when ordering or shopping for food online and eating out or shopping for food in person.
When ordering or shopping for food online, 29% of respondents in wave 11 (May 2025 to August 2025) said they found it (quite or very) easy to find FHRS ratings. 13% of respondents said they found it (quite or very) difficult, and a further 15% said they found it neither easy or difficult to find. Around one in five respondents said they do not look for FHRS ratings when ordering or shopping for food online (22%) or they didn’t know if there were easy or difficult to find (20%) (Figure 11)[footnote 18].
Respondents in England (30%) and Wales (28%) were slightly more likely to report finding it easy to find FHRS ratings when ordering or shopping for food online than those in Northern Ireland (24%)**.
Figure 11: Ease of finding FHRS ratings when ordering or shopping for food online (wave 11).
| Ease of finding FHRS ratings | Percentage of respondents |
|---|---|
| Very easy to find | 10 |
| Quite easy to find | 19 |
| Neither easy nor difficult to find | 15 |
| Quite difficult to find | 10 |
| Very difficult to find | 4 |
| I do not look for FHRS ratings when ordering or shopping for food online | 22 |
| Don’t know | 20 |
Source: Food and You 2: wave 11.
There were differences among demographic groups in the reported ease of finding FHRS ratings when ordering or shopping for food online. For example:
Age: Younger respondents (including 37% of those aged 16 to 24, 45% of those aged 25 to 34, and 39% of those aged 35 to 44) were more likely to say they find it quite or very easy to find FHRS ratings when ordering or shopping for food online compared to those aged 55 to 64 (21%), those aged 65 to 74 (14%) and those aged over 75 (10%).
Household size: Respondents living in larger households (for example 43% of those in households of 5 or more and 38% of those living in households of 4) were more likely to say they find it quite or very easy to find FHRS ratings when ordering or shopping for food online compared those living in households of 2 (24%) and those living in single adult households (17%).
Children in household: Respondents with children present in the household were more likely to say they find it quite or very easy to find FHRS ratings when ordering or shopping for food online. For example, 40% of those with children aged under 16 present in the household reported this compared to 25% of those with no children aged under 16 present in the household. Similarly, 46% of those with children aged under 6 present in the household reported this, compared to 27% of those with no children aged under 6 present in the household.
Region (England)[footnote 19]: Respondents living in the North East of England (42%) and Yorkshire and the Humber (37%) were more likely to say they find it quite or very easy to find FHRS ratings when ordering or shopping for food online, compared to those in the South East (26%), East of England (23%), and South West (23%).
Rural and urban areas: Respondents living in urban areas (32%) were more likely to say they find it quite or very easy to find FHRS ratings when ordering or shopping for food online, compared to those in rural areas (20%).
Food security[footnote 20]: Respondents who were classified as food insecure (those with low or very low food security) were more likely to say they find it quite or very easy to find FHRS ratings when ordering or shopping for food online (43%), compared to those classified as food secure (those with high or marginal food security; 26%).
Ethnicity[footnote 21]: Respondents who are Asian or Asian British (45%) were more likely to say they find it quite or very easy to find FHRS ratings when ordering or shopping for food online, compared to those who are White (27%).
When eating out or shopping for food in-person, over half (56%) of respondents in wave 11 said they found it (very or quite) easy to find FHRS ratings. Only 5% said they found it (quite or very) difficult to find. 16% of respondents said they were neither easy or difficult to find, and a further 16% of respondents said they do not look for FHRS ratings when eating out or shopping in person (Figure 12)[footnote 22].
Respondents in Wales (68%) and Northern Ireland (64%) were more likely to say it was easy to find FHRS ratings when eating out or shopping for food in person than those in England (55%)**.
Figure 12: Ease of finding FHRS ratings when eating out or shopping for food in person (wave 11).
| Ease of finding FHRS ratings | Percentage of respondents |
|---|---|
| Very easy to find | 21 |
| Quite easy to find | 35 |
| Neither easy nor difficult to find | 16 |
| Quite difficult to find | 4 |
| Very difficult to find | 1 |
| I do not look for FHRS ratings when eating out or shopping in person | 16 |
| Don’t know | 7 |
Source: Food and You 2: wave 11.
There were also demographic differences in reported ease of finding FHRS ratings when eating out or shopping for food in person. For example:
Age: Younger respondents (including 68% of those aged 16 to 24, 65% of those aged 25 to 34 and 62% of those aged 35 to 44) were more likely to say they find it quite or very easy to find FHRS ratings when eating out or shopping for food in person, compared to 51% of those aged 55 to 64, 49% of those aged 65 to 74 and 34% of those aged 75 or over.
Household size: Respondents living in larger households (for example 66% of those in households of 5 or more and 63% of those in households of 4) were more likely to say they find it quite or very easy to find FHRS ratings when eating out or shopping for food in person, compared to 52% of those in households of 2 and 45% of those in single adult households.
Children in household: Respondents with children aged under 16 present in the household (64%) were more likely to say they find it quite or very easy to find FHRS ratings when eating out or shopping for food in person compared to those with no children aged under 16 present in household (54%).
Region (England)[footnote 23]: Respondents living in the North East (71%) and East Midlands (63%) were more likely to say they find it quite or very easy to find FHRS ratings when eating out or shopping for food in person, compared to those in the South East (52%) and East of England (49%).
Chapter 3: use of the FHRS in decision making
This chapter provides an overview of how people use the FHRS when deciding where to eat out or buy food.
Acceptable food hygiene ratings
Respondents were asked what they would usually consider the lowest acceptable food hygiene rating when considering buying food from somewhere. In wave 11 (May 2025 to August 2025), 14% of respondents who had heard of the FHRS said they would only consider a rating of 5 acceptable, while most said that a rating of 4 (52%) or 3 (25%) was the lowest rating they would consider acceptable. A minority of respondents considered a rating of 2 (2%), 1 (1%) or 0 (1%) to be acceptable (Figure 13)[footnote 24].
In most waves, a rating of 4 (good) was the most popular lowest acceptable level selected by respondents, followed by a 3 (generally satisfactory). The proportion selecting a rating of 4 (good) notably increased over time, from 39% in wave 2 (November 2020 to January 2021) to 52% in wave 11 (May to August 2025).
There has also been a slight increase in the percentage reporting they would only consider a rating of 5 acceptable in wave 11 (14%), compared to all previous waves (8%-9%)**. Conversely, the percentage of respondents selecting a rating of 3 (generally satisfactory) notably decreased in wave 11 (25%), compared to all previous waves (36%-41%).
Figure 13: What rating respondents, who have heard of the FHRS, would consider the lowest acceptable food hygiene rating from wave 2 to wave 11.
| Survey wave | 5: very good | 4: good | 3: generally satisfactory | 2: improvement necessary | 1: major improvement necessary | 0: urgent improvement necessary |
|---|---|---|---|---|---|---|
| W11: May-25 to Aug-25 | 14 | 52 | 25 | 2 | 1 | 1 |
| W10: Oct-24 to Feb-25 | 9 | 44 | 36 | 4 | 1 | 1 |
| W8: Oct-23 to Jan-24 | 8 | 44 | 37 | 4 | 0 | 1 |
| W6: Oct-22 to Jan-23 | 8 | 42 | 39 | 4 | 0 | 1 |
| W4: Oct-21 to Jan-22 | 8 | 41 | 40 | 4 | 0 | 1 |
| W2: Nov-20 to Jan-21 | 8 | 39 | 41 | 5 | 0 | 1 |
Source: Food and You 2: waves 2, 4, 6, 8, 10 and 11.
In wave 11, there were demographic differences in the lowest FHRS rating respondents would generally consider acceptable. Focusing on those who reported that 5 (very good) was the lowest rating they would usually consider acceptable, the following differences were observed:
Country: Respondents in Northern Ireland and England (both 14%) were more likely to say that 5 was the lowest FHRS rating they would usually consider acceptable compared to those in Wales (10%)**.
Region (England)[footnote 25]: Respondents living in the East Midlands (20%) were more likely to say that 5 was the lowest FHRS rating they would usually consider acceptable compared to those living in the North East (9%) of England.
Age: Older respondents (for example 22% of those aged 75 or over and 23% of those aged 65 to 74) were more likely to say that 5 was the lowest FHRS rating they would usually consider acceptable compared to 9% of those aged 35 to 44, 10% of those aged 25 to 34 and 6% of those aged 16 to 24.
Impact of FHRS rating stickers on behaviour
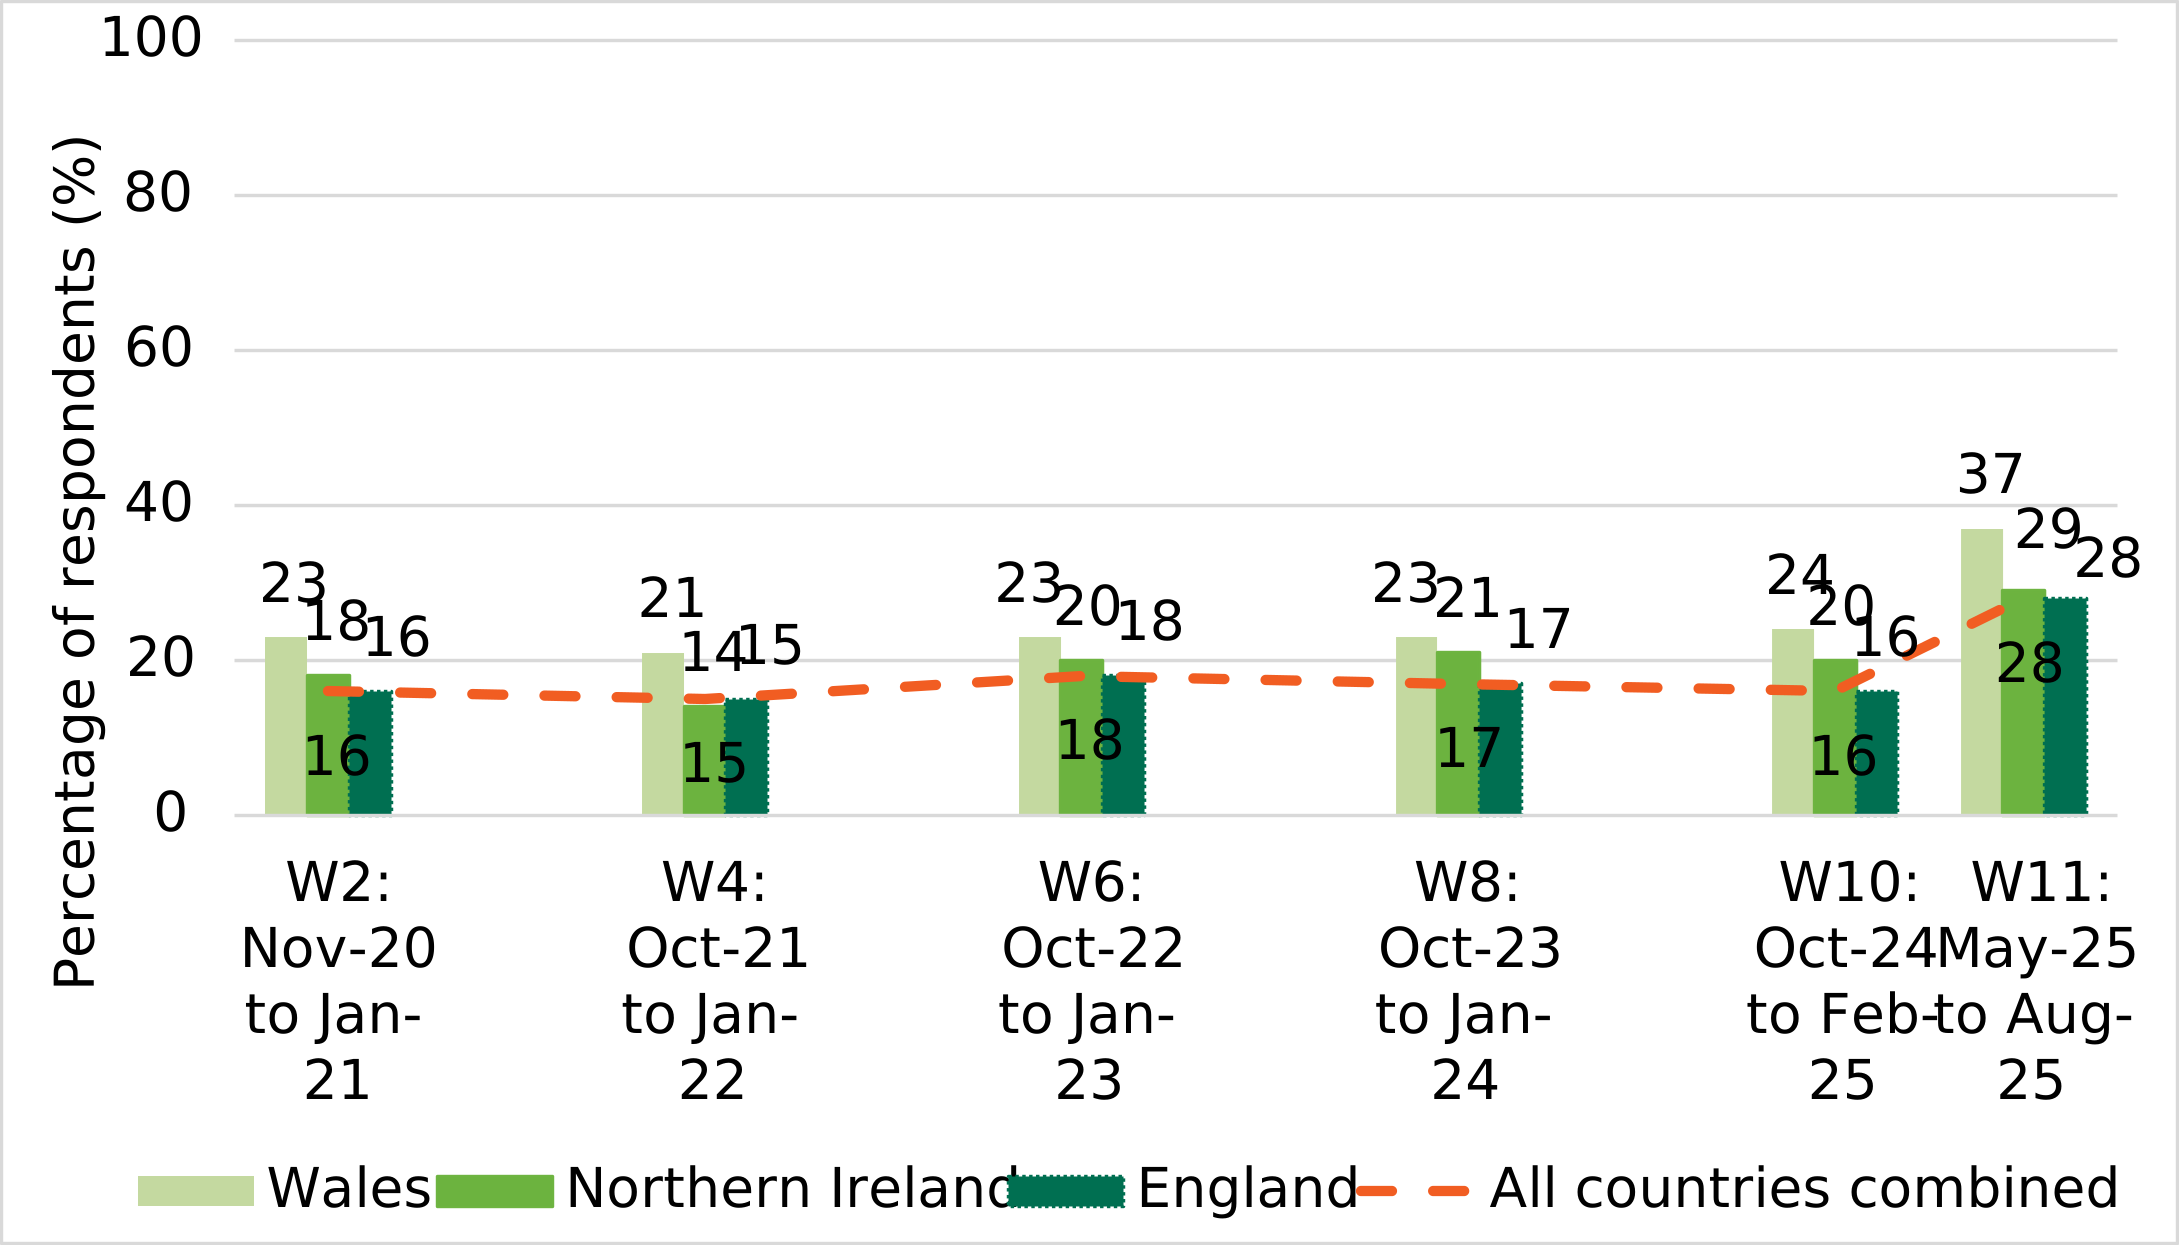
Respondents were asked if, in the last 12 months, they had decided against using a food business because it did not display it’s FHRS sticker. Among those who had heard of the FHRS, there was a notable increase in the percentage of respondents who reported they had done this in wave 11 (May 2025 to August 2025) (28%), compared to all previous waves where this had remained broadly stable (15%-18%) (Figure 14)[footnote 26].
Across all waves there have been differences by country, for example in wave 11, respondents in Wales (37%) who had heard of the FHRS were more likely to report that they had decided against using a food business because it did not display its FHRS sticker in the last 12 months, than those in Northern Ireland (29%) and England (28%)**. Despite these differences, all three countries showed a similar pattern of change over time, with levels in wave 11 higher than those observed in previous waves.
Figure 14:The percentage of respondents who in the last 12 months had decided against using a food business because it did not display it’s FHRS sticker, among those who had heard of the FHRS from wave 2 to wave 11.
Source: Food and You 2: waves 2, 4, 6, 8, 10 and 11.
Concerns about food businesses not displaying an FHRS rating
Respondents were asked what concerns they would have if they visited a food business that did not display its food hygiene rating sticker at the premises[footnote 27].
In wave 11 (May 2025 to August 2025), when presented with a list of options, respondents who had heard of the FHRS were most likely to report that they would be concerned that a non-displaying food business had poor hygiene standards (53%) and that the food business had a poor or low food hygiene rating and was trying to hide it (49%). This was closely followed by concern about the safety of eating at the food business (48%), and that there would be a higher risk of food poisoning, illness or infection when eating there (47%) (Figure 15).
Figure 15: Concerns those who had heard of the FHRS in wave 11 would have if a food business did not display their food hygiene rating sticker at the premises.
| Type of concern | Percentage of respondents |
|---|---|
| Business had poor hygiene standards | 53 |
| Business had a low or poor food hygiene rating and was trying to hide it | 49 |
| Safety of eating at the business | 48 |
| Higher risk of food poisoning, illness or infection | 47 |
| Whether the business has been inspected by the relevant authorities | 41 |
| Business doesn’t meet legal requirements | 40 |
| I would not notice the missing sticker | 23 |
| I would not be concerned | 3 |
Source: Food and You 2: wave 11.
The most commonly reported concerns in wave 11, that the food business had poor hygiene standards, and that it had a poor or low food hygiene rating and was trying to hide it, were also the two most commonly reported concerns across all earlier waves. However, the percentage of respondents who reported these concerns varied slightly over time, ranging from 48% to 53%** and from 45% to 52%**, respectively.
Other concerns have also varied slightly across waves, for example concern of a higher risk of food poisoning, illness or infection ranged from 40% to 47% between wave 2 and 11** and concern about the safety of eating at the food business was slightly higher in wave 11 (48%) than in wave 10 (44%)**.
The percentage of respondents who reported they would not notice the missing sticker was slightly lower in waves 10 and 11 (23%-24%), than in earlier waves (26%-27%)**.
Chapter 4: attitudes toward display of food hygiene ratings
Food businesses are provided with a sticker which shows their food hygiene rating. In England businesses are encouraged to display their food hygiene rating sticker, however in Wales and Northern Ireland food businesses are legally required to display their food hygiene rating sticker prominently at their premises[footnote 28].
This chapter provides an overview of attitudes towards the FHRS, including views on mandatory display and where food hygiene ratings should be displayed online.
Views on mandatory display at food business premises
Respondents were asked whether they thought that food businesses should be required by law to display their food hygiene rating at their premises, or if it should be up to the business to decide whether to or not.
In wave 11 (May 2025 to August 2025), 94% of respondents who had heard of the FHRS thought that food businesses should be required by law to display their food hygiene rating on the premises, and 3% thought it should be up to the business to decide whether to display their food hygiene rating. A further 3% of respondents said they didn’t know whether this should be a legal requirement or up to the business to decide.
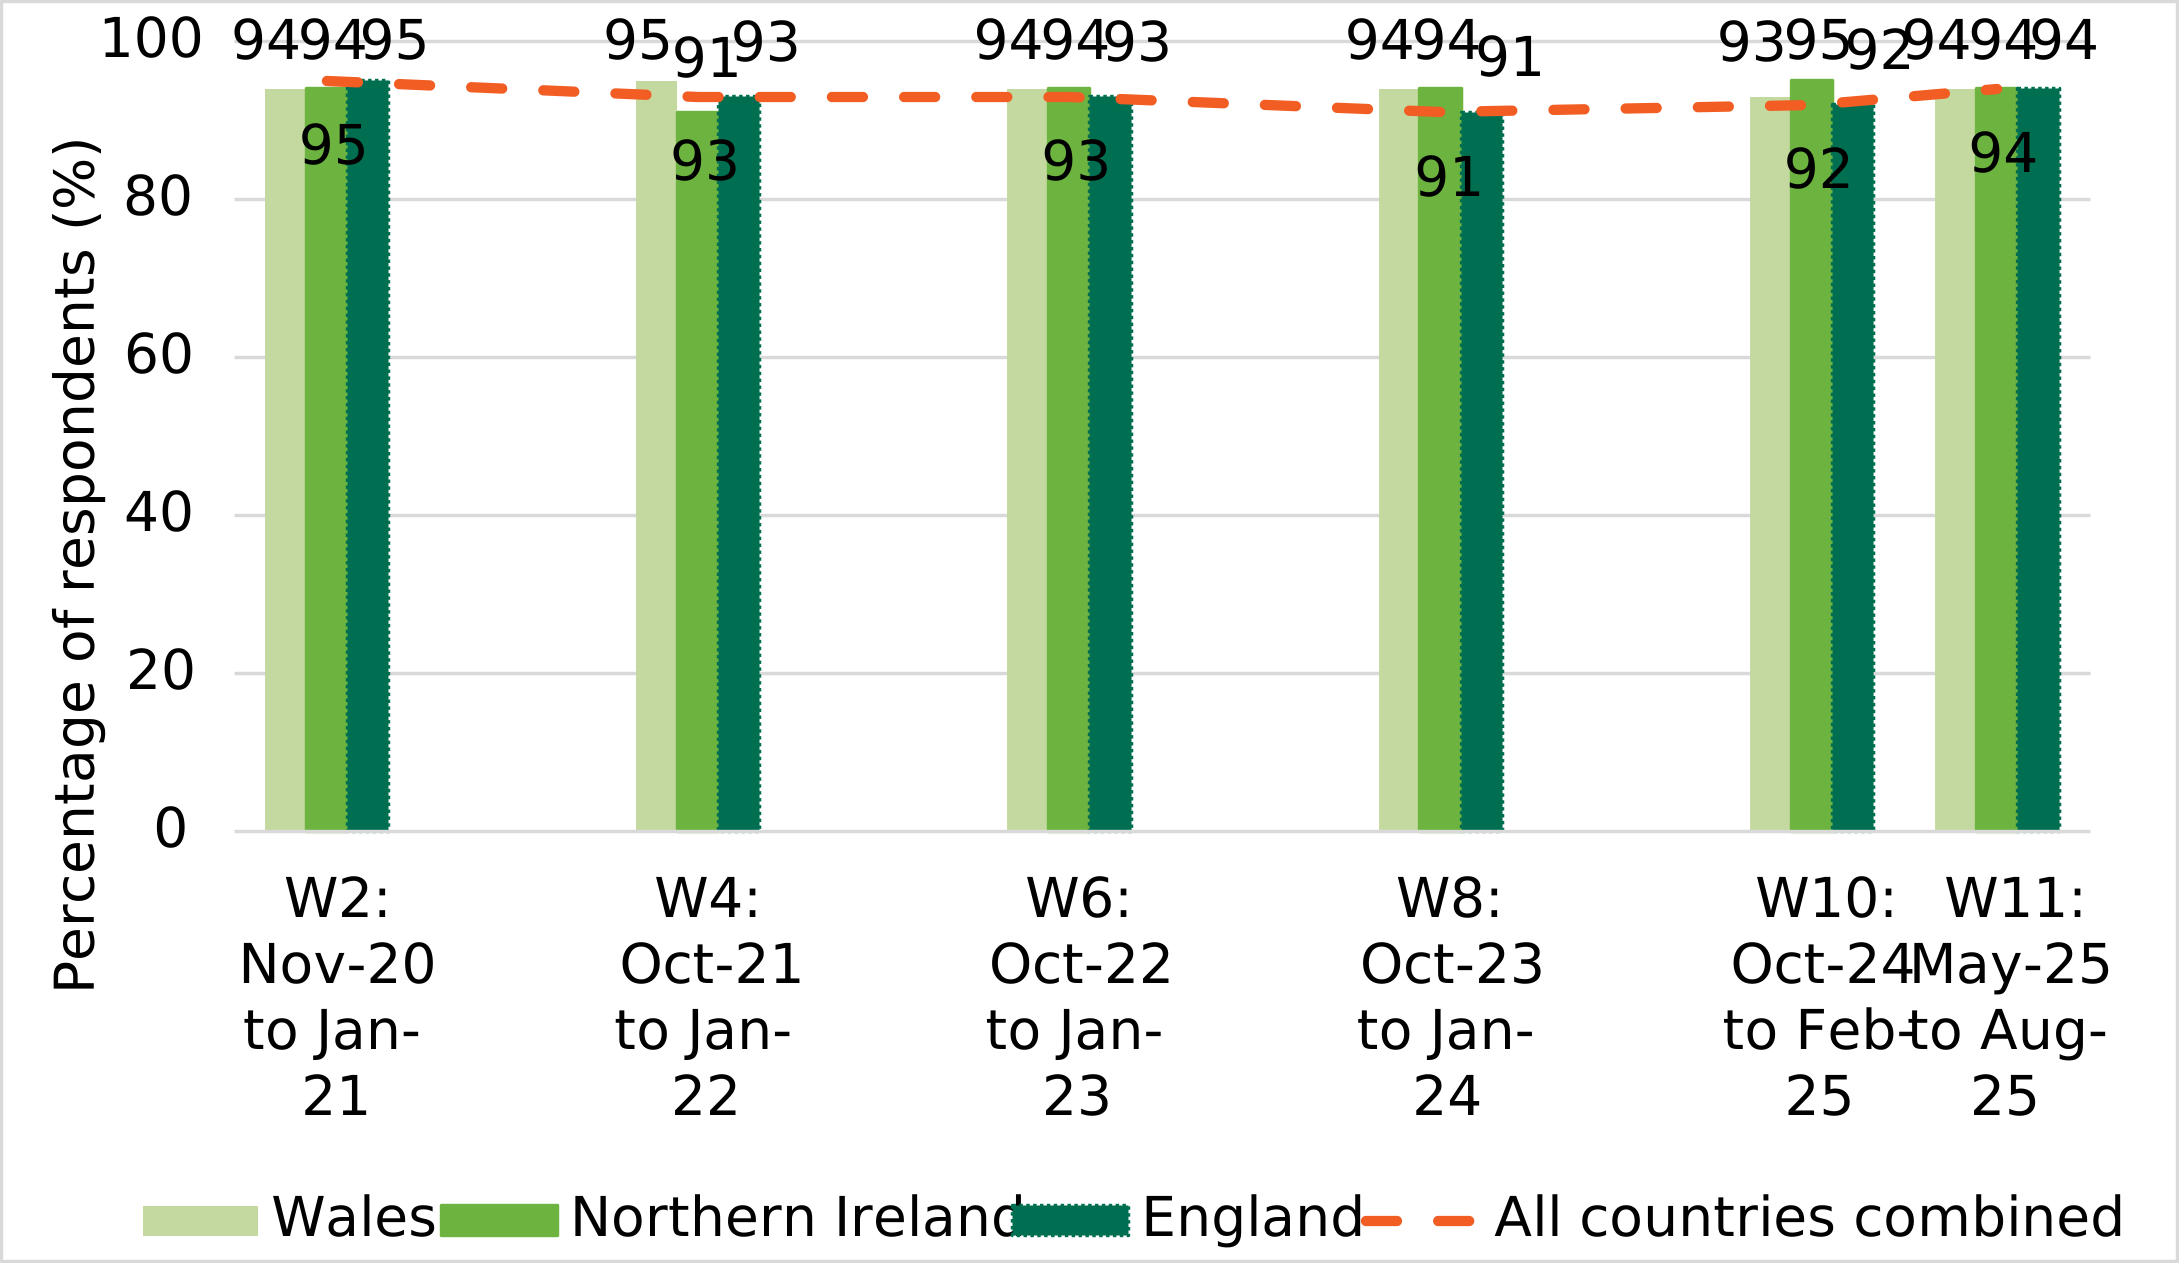
Support for mandatory display of food hygiene ratings at food business premises remained consistently high over time, and in all three countries. In all waves, over 9 in 10 (91-95%) respondents who had heard of the FHRS, reported that food businesses should be required by law to display their food hygiene rating at their premises (Figure 16)[footnote 29].
Figure 16: The percentage of respondents who thought that food businesses should be required by law to display their food hygiene rating on the premises, among those who had heard of the FHRS from wave 2 to wave 11.
Source: Food and You 2: wave 2, 4, 6, 8, 10 and 11.
Views on online display of food hygiene ratings
Respondents were asked where they thought hygiene ratings should be displayed online, from a given list of locations.
In wave 11 (May 2025 to August 2025), most respondents thought that food hygiene ratings should be displayed on a takeaway’s own website (94%), a restaurant or café own website (93%), on the websites or apps of food ordering and delivery companies (93%), and on hotel or B&B websites (92%). Around 8 in 10 respondents thought that food hygiene ratings should be displayed on supermarket websites (84%) and on food business’s social media sites (81%) (Figure 17). There were no notable changes between waves[footnote 30].
Figure 17: Online locations where respondents in wave 11 think food hygiene ratings should be clearly displayed.
| Location | Percentage of respondents |
|---|---|
| Takeaway’s own website | 94 |
| Restaurant’s or café’s own website | 93 |
| Food ordering or delivery companies’ apps or websites | 93 |
| Hotel’s or B&B’s own website | 92 |
| Supermarket’s own website | 84 |
| Food business’ social media site | 81 |
Source: Food and You 2: wave 11.
Annex A
Fieldwork dates
Table 1: Fieldwork dates and responses for Food and You 2 waves in which questions about the FHRS were included and comparable data are available.
| Wave | Fieldwork dates | Number of respondents | Number of households |
|---|---|---|---|
| 2 | 20 November 2020 to 21 January 2021 | 5,900 | 3,955 |
| 4 | 18 October 2021 to 10 January 2022 | 5,796 | 4,026 |
| 6 | 12 October 2022 to 10 January 2023 | 5,991 | 4,217 |
| 8 | 12 October 2023 to 8 January 2024 | 5,808 | 4,006 |
| 10 | 9 October 2024 to 7 February 2025 | 5,690 | 3,965 |
| 11 | 19 May 2025 to 7 August 2025 | 5,898 | 4,215 |
Technical terms and definitions
Statistical significance is indicated at the 5% level (p<0.05). This means that where a significant difference is reported, there is reasonable confidence that the reported difference is reflective of a real difference at the population level.
Food security means that all people always have access to enough food for a healthy and active lifestyle (World Food Summit, 1996). The United States Department of Agriculture (USDA) has created a series of questions which indicate a respondent’s level of food security. Food and You 2 incorporates the 10 item U.S. Adult Food Security Survey Module and uses a 12 month time reference period. Respondents are referred to as being food secure if they are classified as having high food security (no reported indications of food-access problems or limitations), or marginal food security (one or two reported indications—typically of anxiety over food sufficiency or shortage of food in the house. Little or no indication of changes in diets or food intake). Respondents are referred to as being food insecure if they are classified as having low food security (reports of reduced quality, variety, or desirability of diet. Little or no indication of reduced food intake) or very low food security (reports of multiple indications of disrupted eating patterns and reduced food intake).
Contact us
For enquiries about this publication, contact the Food Standards Agency.
Project reference
Project reference: FS430662.
-
The Food Hygiene Information Scheme operates in Scotland under the responsibility of Food Standards Scotland. ↩
-
Legislation for the mandatory display of FHRS ratings was introduced in November 2013 in Wales and October 2016 in Northern Ireland. ↩
-
Includes ‘Yes, I’ve heard of it and know quite a lot about it’, ‘Yes, I’ve heard of it and know a bit about it’, ‘Yes, I’ve heard of it but don’t know much about it’, ‘Yes, I’ve heard of it but don’t know anything about it’. ↩
-
Question: Have you heard of the Food Hygiene Rating Scheme? Responses: Yes, I’ve heard of it and know quite a lot about it, Yes, I’ve heard of it and know a bit about it, Yes, I’ve heard of it but don’t know much about it, Yes, I’ve heard of it but don’t know anything about it, No, I’ve never heard of it. Unweighted total across waves 2, 4, 6, 8, 10 and 11 (all countries combined) = 30,118 (range between 4,737 in wave 4 and 5,881 in wave 11), all respondents in relevant questionnaires (answering). Please note: this question was not included in wave 1. Whilst data is available for waves 3, 5, 7 and 9 it is not directly comparable due to changes in question ordering and methodology in the survey design. ↩
-
Includes ‘Yes, I’ve heard of it and know quite a lot about it’ and ‘Yes, I’ve heard of it and know a bit about it’. ↩
-
Due to sample sizes, regional commentary is provided for England only and is not available for Wales and Northern Ireland. ↩
-
Question: Where have you come across the Food Hygiene Rating Scheme? Responses: A sticker in a food business, On a food business’ own website (such as a restaurant website), On a food ordering/delivery website or app (such as Just Eat, Deliveroo, Uber Eats etc.), Word of mouth, On the Food Standards Agency’s website, In the local newspaper, On social media (e.g. Twitter, Facebook Marketplace), In an advert or magazine article, On another app (e.g. Scores on the Doors Food Hygiene Rating) (please specify), On another website, Somewhere else. Unweighted total across waves 2, 4, 6, 8, 10 and 11 (all countries combined) = 27,460 (range between 4,355 in wave 4 and 5,412 in wave 11), all respondents in relevant questionnaires (answering). Please note: this question was not included in waves 1, 3, 5, 7 or 9. ↩
-
Due to sample sizes, regional commentary is provided for England only and is not available for Wales and Northern Ireland. ↩
-
Question: Have you ever seen this sticker before? Responses: Yes, No, Don’t know / not sure. Unweighted total across waves 2, 4, 6, 8, 10 and 11 (all countries combined) = 29,954 (range between 4,723 in wave 4 and 5,793 in wave 11) all respondents in relevant questionnaires (answering). Please note: this question was not included in waves 1, 3, 5, 7 or 9. ↩
-
Question: In the last 12 months, have you checked the hygiene rating of a food business? You may have checked a rating at the business premises, online, in leaflets or menus; whether or not you decided to purchase food from there. Responses: Yes, I have checked the Food Hygiene Rating of a food business, No, I have not checked the Food Hygiene Rating of a food business, Don’t know. Unweighted total base across waves 4, 6, 8, 10 and 11 (all countries combined) = 25,222 (range between 4,734 in wave 4 and 5,868 in wave 11), all respondents in relevant questionnaires (answering). Please note: this question was not included in waves 1, 2, 3, 5, 7 or 9. ↩
-
Due to sample sizes, regional commentary is provided for England only and is not available for Wales and Northern Ireland. ↩
-
Commentary is provided for White and Asian or Asian British groups only, this is due to small sample sizes for other ethnic groups. ↩
-
Question: How did you check these ratings? Responses: I looked at an FHRS sticker displayed at the food business (such as in a business’ window or on the door), I checked an online food ordering website or app (e.g. Just Eat, Deliveroo, Uber Eats), I checked the food business’ own website, I checked on the Food Standards Agency’s website, I checked on an app (e.g. Scores on the Doors Food Hygiene Rating), I checked on another website, I checked in a local newspaper, Other, Don’t know. Unweighted total across waves 4, 6, 8, 10 and 11 = 12,249 (range between 2,075 in wave 4 and 3,241 in wave 11), all respondents in relevant questionnaires, who have checked the Food Hygiene Rating of a food business in the previous 12 months (answering). Please note there has been minor rewording across the waves. This question was not included in wave 1, 2, 3, 5, 7 or 9. ↩
-
Due to sample sizes, regional commentary is provided for England only and is not available for Wales and Northern Ireland. ↩
-
Including takeaway ordered directly from a takeaway shop or restaurant or via an online food delivery company. ↩
-
Question: Generally, when ordering food from takeaways (either directly from a takeaway shop or restaurant or from an online food delivery company like Just Eat, Uber Eats or Deliveroo) what do you consider when deciding where to order from? Responses: My previous experience of the takeaway, Quality of food, Price (including cost of delivery), Type of food (e.g. cuisine or vegetarian/vegan options), Recommendations from family or friends, Food Hygiene Rating, Location of takeaway, Whether there is a delivery or collection option, Offers, deals or discount available, Delivery/ collection times, Whether food can be ordered online (e.g. through a website or app), Reviews (e.g. on TripAdvisor, Google, social media, or in newspapers and magazines), Whether it is an independent business or part of a chain, Whether healthier options are provided, Whether allergen information is provided, Whether information about calories is provided, None of these, Don’t know. Unweighted base in wave 11 = 3325, all online respondents who order takeaways. ↩
-
Question: Generally, when you eat out, what do you consider when deciding where to go? Please think about eating out in restaurants, pubs/ bars, and cafés/coffee shops/ sandwich shops. Responses: Quality of food, My previous experience of the place, Cleanliness of the place, Quality of service, Recommendations from family or friends, Price, Location, Type of food (e.g. cuisine or vegetarian/vegan options), Food Hygiene Rating, Ambiance / atmosphere, Offers, deals or discount available, Reviews e.g. on TripAdvisor, Google, social media, or in newspapers and magazines, Whether it is an independent business or part of a chain, Whether healthier options are available, Whether the place is child-friendly, Whether allergen information is provided, Whether information about calories is provided, None of these, Don’t know. Unweighted base in wave 11 = 3748, all online respondents who eat out. ↩
-
Question: How easy or difficult is it to find Food Hygiene Rating Scheme ratings when ordering or shopping for food online? Responses: Very easy to find, Quite easy to find, Neither easy nor difficult to find, Quite difficult to find, Very difficult to find, I do not look for Food Hygiene Rating Scheme ratings when ordering or shopping for food online, Don’t know. Unweighted base in wave 11 = 5,830, all respondents (answering). Please note: this question was introduced in wave 11 and not asked in waves 1 to 10. ↩
-
Due to sample sizes, regional commentary is provided for England only and is not available for Wales and Northern Ireland. ↩
-
The definition of food security and measures used are described in annex A. ↩
-
Commentary is provided for White and Asian or Asian British groups only, this is due to small sample sizes for other ethnic groups. ↩
-
Question: How easy or difficult is it to find Food Hygiene Rating Scheme ratings when eating out or shopping for food in person? Responses: Very easy to find, Quite easy to find, Neither easy nor difficult to find, Quite difficult to find, Very difficult to find, I do not look for Food Hygiene Rating Scheme ratings when eating out or shopping for food in person, Don’t know. Unweighted base in wave 11 = 5,858, all respondents (answering). Please note: this question introduced in wave 11 and was not asked in waves 1 to 10. ↩
-
Due to sample sizes, regional commentary is provided for England only and is not available for Wales and Northern Ireland. ↩
-
Question: From a rating of 0 to 5, what is the lowest rating you would usually consider acceptable, if you were considering buying food from somewhere? Responses: 0 - urgent improvement necessary, 1 - major improvement necessary, 2 - improvement necessary, 3 - generally satisfactory, 4 – good, 5 - very good, Don’t know, I do not usually notice the rating when I go into a food business. Unweighted total across waves 2, 4, 6, 8, 10 and 11 = 27,098 (range between 4,269 in wave 4 and 5,338 in wave 11), all respondents in relevant questionnaires, excluding those who have not heard of the Food Hygiene Rating Scheme or ‘Not stated’ whether they had heard of it (answering). Please note: this question was not included in waves 1, 3, 5, 7 or 9. ↩
-
Due to sample sizes, regional commentary is provided for England only and is not available for Wales and Northern Ireland. ↩
-
Question: In the last 12 months, did you ever decide against using a food business, because it did not display its Food Hygiene Rating Scheme sticker? Responses: Yes, No, Don’t know / can’t remember. Unweighted total base across waves 2, 4, 6, 8, 10 and 11 = 27,455 (range between 4,345 in wave 4 and 5,398 in wave 11), all respondents in relevant questionnaires, excluding those who have not heard of the Food Hygiene Rating Scheme or ‘Not stated’ whether they had heard of it (answering). Please note: this question was not included in waves 1, 3, 5, 7 or 9. ↩
-
Question: If you visited a food business that did not display their Food Hygiene Rating Scheme sticker on the premises, would you be concerned about any of the following? Responses: That the food business had poor hygiene standards, The food business had a low/poor Food Hygiene Rating and was trying to hide it, There would be a higher risk of food poisoning/illness/infection when eating there, The safety of eating at the food business, The food business doesn’t meet legal requirements, Whether the food business has been inspected by the relevant authorities or not, I would not be concerned about anything, I would not notice that the sticker is missing, Other, Don’t know. Unweighted total across waves 2, 4, 6, 8, 10 and 11 = 27,486 (range between 4,350 in wave 4 and 5,409 in wave 11), all respondents in relevant questionnaires, excluding those who have not heard of the Food Hygiene Rating Scheme or ‘Not stated’ whether they had heard of it (answering). Please note: this question was not included in waves 1, 3, 5, 7 or 9. ↩
-
Legislation for the mandatory display of FHRS ratings at premises was introduced in November 2013 in Wales and October 2016 in Northern Ireland. ↩
-
Question: Do you think that food businesses should be required by law to display their Food Hygiene Rating at their premises, or should it be up to the business to decide whether to or not? Responses: They should have to, It should be up to them to decide, Don’t know. Unweighted total across waves 2, 4, 6, 8, 10 and 11 = 27,476 (range between 4,350 in wave 4 and 5,406 in wave 11), all respondents in relevant questionnaires, excluding those who have not heard of the Food Hygiene Rating Scheme or ‘Not stated’ whether they had heard of it (answering). Please note: this question was not included in waves 1, 3, 5, 7 or 9. ↩
-
Question: Do you think the hygiene ratings should be clearly displayed on…. a) A food ordering and delivery companies’ apps and websites (such as Just Eat, Deliveroo, Uber Eats etc.) that allow you to order food from a range of local restaurants and takeaways? / b) A restaurant’s or cafe’s own website? / c) A takeaway’s own website? / d) A hotel’s or B&B’s own website if they provide food? / e) A supermarket’s own website? / f) A food business’s social media site (such as Facebook, Instagram etc.)? Responses: Yes, No, Don’t know. Unweighted total across waves 2, 4, 6, 8, 10 and 11 = a) 29,826 (range: 4,706 in wave 4 and 5,836 in wave 11) b) 29,800 (range: 4,688 in Wave 4 and 5,843 in wave 11) c) 29,705 (range: 4,673 in wave 4 and 5,827 in wave 11) d) 29,766 (range: 4,680 in wave 4 and 5,844 in wave 11) e) 29,676 (range: 4,681 in wave 4 and 5,802 in wave 11). Please note option f) ‘A food business’s social media site’ was not asked in wave 2. Unweighted total for this: 24,826 (range: 4,659 in wave 4 and 5,752 in wave 11). All respondents in relevant questionnaires (answering). Please note: none of these questions were included in waves 1, 3, 5, 7 or 9. Note: for wave 11 the word ‘clearly’ was added to the question wording. ↩