Derelict Buildings Fund: methodology note
Published 28 October 2026
Applies to England

© Crown copyright 2026
This publication is licensed under the terms of the Open Government Licence v3.0 except where otherwise stated. To view this licence, visit nationalarchives.gov.uk/doc/open-government-licence/version/3 or write to the Information Policy Team, The National Archives, Kew, London TW9 4DU, or email: psi@nationalarchives.gov.uk.
Where we have identified any third party copyright information you will need to obtain permission from the copyright holders concerned.
This publication is available at https://www.gov.uk/government/publications/derelict-buildings-fund-methodology-note/derelict-buildings-fund-methodology-note
Overview
This methodology outlines place selection and allocations for the Derelict Buildings Fund. This fund provides £125 million on funding and support. £120 million is allocated directly to 60 local authorities, with £5 million retained to provide specialist support, guidance and technical assistance to participating authorities.
Local authorities are selected based on employment deprivation and then receive a proportionate share of the funding, relative to their population, with funding capped at no lower than £1 million and no higher than £3 million per authority.
The full list of local authorities selected, and their allocation, is listed below.
Selection methodology in England
Local authority districts (LADs) were used as the selection geography for the Derelict Buildings Fund, primarily led by local employment deprivation. The place selection process follows 4 steps:
-
Exclude major urban cores receiving City Densification Funding
-
Select LADs with the highest employment deprivation
-
Calculate population shares for each of the selected LADs
-
Allocate funding in proportion to population share, subject to a £1 million floor and a £3 million cap
Step 1: Exclude major urban cores receiving City Densification Funding
The 6 Mayoral Strategic Authorities (MSAs) receiving the first round of City Densification Funding (CDF) are matched to LADs using the exact-fit lookup from the ONS Geography Portal, and the LADs defined according to their rurality in the ONS Rural Urban Classification. The ‘Urban: Majority nearer to a major town or city’ LAD with the single largest mid-2025 population in each of the 6 CDF MSAs is then excluded.
Step 2: Select LADs with the highest employment deprivation
The remaining LADs are ranked according to their average score in the Employment deprivation subdomain of the Indices of Deprivation, and the 60 LADs with the highest employment deprivation score are selected.
Step 3: Calculate population shares for each of the selected LADs
A population share was calculated for each of the 60 selected local authorities according to its mid-2025 population relative to the combined population of all 60 selected authorities.

where 𝑝𝑖 is the population share of authority 𝑖.
Step 4: Allocate funding in proportion to population share, subject to a £1m floor and a £3m cap
The £120 million funding envelope was allocated across the 60 selected authorities according to:

where 𝑝𝑖 is authority 𝑖’s population share and 𝑘 is a scaling factor chosen so that:
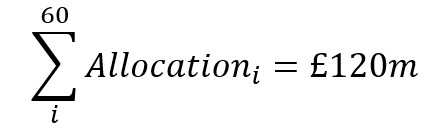
In practice, this means that funding was allocated in proportion to population, subject to a minimum allocation of £1 million and a maximum allocation of £3 million per authority. Authorities whose population-based allocation fell below £1 million received the £1 million floor, whilst authorities whose population-based allocation exceeded £3 million received the £3 million cap.
For authorities between the floor and cap, funding increased in proportion to population at a common per-capita rate. 𝑘 was chosen so that the full £120 million funding envelope was allocated whilst maximising allocations within the £1 million floor and £3 million cap constraints.
Final allocations
| Local Authority Name | Local Authority Allocation (£m) |
|---|---|
| Ashfield | £1.23m |
| Barking and Dagenham | £2.25m |
| Barnsley | £2.39m |
| Blackburn with Darwen | £1.55m |
| Blackpool | £1.35m |
| Bolsover | £1.00m |
| Bolton | £2.92m |
| Bradford | £3.00m |
| Burnley | £1.00m |
| Calderdale | £1.99m |
| Chesterfield | £1.00m |
| County Durham | £3.00m |
| Darlington | £1.07m |
| Derby | £2.60m |
| Doncaster | £3.00m |
| Dudley | £3.00m |
| East Lindsey | £1.39m |
| Eastbourne | £1.00m |
| Enfield | £3.00m |
| Folkestone and Hythe | £1.06m |
| Gateshead | £1.91m |
| Great Yarmouth | £1.00m |
| Hackney | £2.51m |
| Halton | £1.24m |
| Haringey | £2.51m |
| Hartlepool | £1.00m |
| Hastings | £1.00m |
| Hyndburn | £1.00m |
| Isle of Wight | £1.33m |
| Kingston upon Hull, City of | £2.58m |
| Knowsley | £1.55m |
| Leicester | £3.00m |
| Mansfield | £1.07m |
| Middlesbrough | £1.44m |
| North East Lincolnshire | £1.51m |
| Nottingham | £3.00m |
| Oldham | £2.38m |
| Pendle | £1.00m |
| Plymouth | £2.56m |
| Preston | £1.55m |
| Redcar and Cleveland | £1.32m |
| Rochdale | £2.24m |
| Rotherham | £2.63m |
| Salford | £2.80m |
| Sandwell | £3.00m |
| Sefton | £2.71m |
| South Tyneside | £1.43m |
| St Helens | £1.79m |
| Stockton-on-Tees | £1.96m |
| Stoke-on-Trent | £2.57m |
| Sunderland | £2.71m |
| Tameside | £2.27m |
| Tendring | £1.50m |
| Thanet | £1.36m |
| Torbay | £1.32m |
| Wakefield | £3.00m |
| Walsall | £2.79m |
| Wigan | £3.00m |
| Wirral | £3.00m |
| Wolverhampton | £2.66m |