
Data strategy update 2026
Published 30 October 2026

© Crown copyright 2026
This publication is licensed under the terms of the Open Government Licence v3.0 except where otherwise stated. To view this licence, visit nationalarchives.gov.uk/doc/open-government-licence/version/3 or write to the Information Policy Team, The National Archives, Kew, London TW9 4DU, or email: psi@nationalarchives.gov.uk.
Where we have identified any third party copyright information you will need to obtain permission from the copyright holders concerned.
This publication is available at https://www.gov.uk/government/publications/data-strategy-update-2026/data-strategy-update-2026

Message from the Senior Director of the Office for the Internal Market
I am pleased to present the Office for the Internal Market (OIM)’s third update to its Data strategy roadmap.
Robust evidence from a range of sources is crucial to building a shared understanding of how the UK internal market is operating. The Office for National Statistics (ONS) and statistics teams within the devolved administrations collect and publish data on trade within the UK. This evidence has been invaluable to the OIM’s work and, as this update sets out, its continued development is welcome.
This update provides an exploratory first look at what the ONS industry-to-industry payments data set can tell us about the internal market. This is a highly positive development, and we look forward to exploring the data further as part of our next annual report.
The OIM is grateful to the statisticians, economists, academics and other colleagues who have worked so openly and constructively with us. We are keen to explore further opportunities for the OIM to add value in the data landscape and welcome engagement from all interested stakeholders.
Adam Land: Senior Director - Office for the Internal Market and Subsidy Advice Unit

Introduction and data strategy
The OIM’s third data strategy update covers developments since our previous update in June 2025.
Under the UK Internal Market Act 2020, the OIM monitors and reports on the UK internal market and advises the 4 UK governments on how to support its effective operation.
Reliable intra-UK data builds evidence on economic relationships between the 4 nations, helping the OIM identify trends, assess the internal market over time and support informed decision-making. This update reviews developments in the OIM’s evidence base, including established data sets and new sources that may offer further insights into economic connections across the UK.
Main data sources used by the OIM and recent developments
This section summarises the main data sets used in the OIM’s work and recent developments in their availability, coverage and potential uses.
ONS interregional trade estimates
The ONS interregional trade estimates examine trade flows within the UK. The OIM used the ONS interregional estimates in its 2025 to 2026 annual report to explore the total value of intra-UK trade and its relative importance to each of the 4 UK nations in 2021.
The ONS has committed to continue publishing these estimates. We anticipate that data for 2022 and 2023 will be made available in Q1 2027.
Devolved administrations’ trade data
The Scottish Government, the Welsh Government and Northern Ireland Statistics and Research Agency produce trade statistics for their respective nations, which provide figures on intra-UK trade.
These are:
- Trade Survey for Wales (TSW)
- Export Statistics Scotland (ESS)
- Northern Ireland Economic Trade Statistics (NIETS)
TSW: In July 2024, the Welsh Government released provisional TSW data for 2022. TSW fieldwork collecting 2025 data runs September to December 2026 with provisional results expected by autumn 2027.
ESS: 2022 and 2023 data were released by the Scottish Government in November 2025. ESS is a biennial publication, with data collection for 2024 and 2025 expected to take place between winter 2026 and summer 2027.
NIETS: Results for 2024 were published in March 2026. We expect 2025 results to be published by end 2026.
Business Insights and Conditions Survey (BICS)
Business Insights and Conditions Survey (BICS) is a voluntary fortnightly survey that captures business views on impact on turnover, workforce, prices, trade and business resilience. Quarterly waves ask questions relating to intra-UK trade.
We will analyse the insights from the latest BICS waves as part of our 2026 to 2027 annual report. We are exploring whether the results could be used to give a more granular look at sectoral intra-UK trade engagement over time.
New and developing data sources
Organisation for Economic Co-operation and Development (OECD) Trade in Value Added (TiVA) project
In October 2026, the OECD, with support from the Department for Business, Innovation, Science and Trade and the ONS produced the first experimental estimates of how the 12 UK UK International Territorial Level 1 (ITL1) regions participate in domestic and global value chains, filling an important evidence gap on subnational supply chains.
The dataset covers the 12 UK ITL1 regions, 36 industries and 80 partner countries, from 2017 to 2021. Future work will link trade to regional jobs and incomes and improve the timeliness of the estimates by incorporating more recent data.
UK industry-to-industry payment flows
The ONS released its industry-to-industry payment flows data set in January 2026. It covers more than 3.4 million UK organisations (companies, charities and governmental organisations), representing around 40% of all UK organisations. This release introduces regional sectoral breakdowns of industry-to-industry payment flows. The data set offers new opportunities to monitor the operation of the internal market and understand how businesses across the UK nations are connected through payment relationships. This data strategy update presents some early examples of how it could be used.
New insights on the operation of the internal market from industry-to-industry payment data
The data set provides monthly data for 2019 to 2025 on payments between organisations made through Faster Payments, Bacs Direct Debit and Bacs Direct Credit. It excludes payments to or from consumers and records both the value of payments in pounds and the number of transactions, rounded to the nearest 100, between industries and regions.
The data set divides the UK into 12 regions: Scotland, Wales and Northern Ireland each form one region, while England is divided into nine. Regional data is available for broad industry groups, with more detailed industry breakdowns available for the UK as a whole.
Several limitations should be considered when interpreting the data. The sample covers around 40% of all businesses, and some payments cannot be allocated to a region or industry. In addition, payments may be attributed to a business’s head office rather than the location where spending occurred. The data is not adjusted for inflation meaning that changes over time may partly reflect price changes rather than underlying economic activity. In addition, at more detailed sector levels, some data may be suppressed to prevent individual companies from being identified.
With these limitations in mind, Figures 1 to 4 illustrate how the data set can be used to explore payment relationships between UK nations.
Share of cross-nation payments 2019 to 2025
Figure 1: Percentage share of UK industry-to-industry payments value that is cross-nation (Source: ONS Industry-to-industry payment flows.)
| Year | Percent of transaction value |
|---|---|
| 2019 | 7.2 |
| 2020 | 7.3 |
| 2021 | 7.6 |
| 2022 | 7.6 |
| 2023 | 7.6 |
| 2024 | 7.6 |
| 2025 | 7.6 |
Commentary on figure 1:
Figure 1 shows that cross-nation payments (a payment that goes from one UK nation to another) accounted for 7.6% of the value of all recorded UK industry-to-industry payments in 2025.
This chart shows that the proportion of recorded payments that were cross-nation remained broadly stable, even during the Covid-19 pandemic. Monitoring this measure over time could help identify changes in economic connections between businesses across the UK.
Payment flows from each UK nation 2025
Figure 2: UK Nation destination of industry-to-industry payments by UK Nation (Source: ONS Industry-to-industry payment flows.)
| Payer nation | England | Scotland | Wales | Northern Ireland | Total |
|---|---|---|---|---|---|
| England | 96.2 | 2.4 | 0.9 | 0.5 | 100 |
| Scotland | 61.5 | 37.5 | 0.5 | 0.6 | 100 |
| Wales | 73.8 | 1.2 | 24.6 | 0.3 | 100 |
| Northern Ireland | 39.2 | 2 | 0.4 | 58.5 | 100 |
Commentary on figure 2:
The percentage split, by value, of recorded industry-to-industry payments originating from each UK nation according to their destination in 2025:
-
England received the most cross-nation payments in terms of value
-
England had the highest proportion of payment value retained within the same nation, followed by Northern Ireland
-
the largest share of industry-to-industry payments by value from Scotland and Wales were made to firms based in England
Tracking these patterns over time could help provide insights into the economic connections between businesses across the UK and how payment relationships between nations evolve.
Cross-nation payments sectoral breakdown 2025
Figure 3: UK cross-nation industry-to-industry payments by payee sector, 2025 (Source: ONS Industry-to-industry payment flows.)
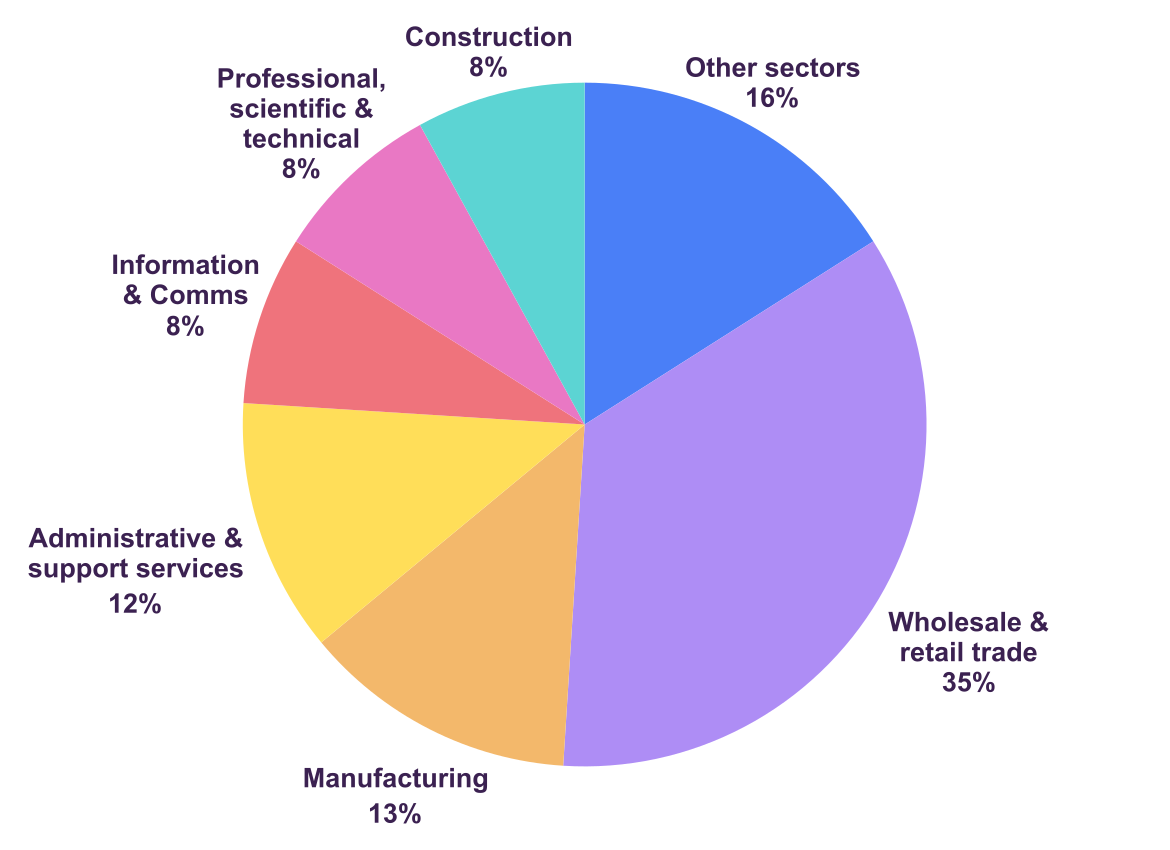
Commentary on figure 3:
This data set can help us look at payment flows on a sectoral basis. Figure 3 shows:
-
the composition of total recorded cross-nation industry-to-industry payment values by sector of origin of the payment in 2025
-
wholesale and retail trade accounted for the largest share at 35%, followed by Manufacturing at 13% and Administrative and Support Services at 12%
-
the remaining sectors in the top 6 each accounted for around 8% whilst the 15 other sectors collectively accounted for 16%
Further analysis could present these results separately for each UK nation, helping to provide insights on whether the sectors driving cross-nation payment flows differ across the four UK nations
Share of overall industry-to-industry payments that are cross-nation, sectoral breakdown 2025
Figure 4: Share of overall industry-to-industry payments received that are cross-nation by top 5 payee sectors, 2025 (Source: ONS Industry-to-industry payment flows.)
| Payee sector | Percentage |
|---|---|
| Mining and quarrying | 27.3% |
| Manufacturing | 10.7% |
| Wholesale and retail trade | 9.8% |
| Accommodation and food service activities | 8.3% |
| Agriculture, forestry and fishing | 7.8% |
Commentary on figure 4:
This data set can help us look at how payments within the UK internal market have a differential impact on sectors. Figure 4 shows:
-
the five sectors that received the largest proportion of their recorded industry-to-industry payments value from businesses in another UK nation in 2025
-
although mining and quarrying accounted for only a small share of total recorded cross-nation receipts (Figure 3), 27.3% of the sector’s recorded payment value came from another UK nation
-
the equivalent shares were 7.8% to 10.7% for the other sectors in the top 5
-
amongst sectors outside the top five, the equivalent shares ranged from 3.7% to 7.4%
Further analysis could help identify which sectors are most reliant on cross-nation payment flows within each UK nation.
Opportunities for further research and collaboration
The analysis set out in this update provides an exploratory first step in understanding how the industry-to-industry payment data set can support research into the operation of the UK internal market.
Each year, the OIM draws on a range of UK data sets to assess the effectiveness of the internal market in its annual report. We will consider how findings from this data set can contribute to that assessment.
Areas where this data set may offer particular value, and where we would welcome potential collaboration, include:
-
Examining patterns of cross-nation payment linkages over time, both across and within sectors (such as manufacturing, wholesale trade and professional services at both Standard industrial classification of economic activities (SIC) Section and 2-digit level).
-
Exploring how insights from the industry-to-industry payments data set compare with, and complement, evidence from Intra-UK trade statistics and the BICS.
-
Identifying which SIC Sections and 2-digit sectors are particularly prominent in cross-nation payments within each UK nation and the extent to which this prominence has changed over time.
-
Providing insights into existence and composition of cross-nation supply chains, including through sector specific case studies.
-
Exploring cross-nation payment patterns at a subnational or regional level (for example) English border regions, over time and by sector.
While the industry-to-industry payments data set represents a promising source of insight, it forms part of a broader programme of work to strengthen the evidence base on the operation of the UK internal market. We are eager to explore additional data sources and research partnerships that could enhance our understanding of economic relationships between the four nations of the UK. In our 2025 data strategy update we identified five areas of research interest.
These were:
-
How could retail data be used to analyse changes in patterns of trade within economic sectors across UK nations?
-
Is there data that can tell us about how goods and services are traded between the border regions of the UK?
-
Could data on the procurement of goods and services by the public sector be used to assess how the internal market is changing? If so, how?
-
Could data on consumer purchasing behaviour be used to provide insights on the effectiveness of the internal market? If so, how?
-
Could differences in regional pricing be used to assess the effects of regulatory differences across the UK? If so, how?
While these topics may require further data development and present methodological challenges, they offer promising opportunities to deepen understanding of the UK internal market.
We would also welcome feedback from interested stakeholders, including academics and policymakers, on the insights presented in this update and the potential for further research.
If interested, please contact us by email: oim@cma.gov.uk.
