Costs of compliance
Published 23 September 2026

© Crown copyright 2026
This publication is licensed under the terms of the Open Government Licence v3.0 except where otherwise stated. To view this licence, visit nationalarchives.gov.uk/doc/open-government-licence/version/3 or write to the Information Policy Team, The National Archives, Kew, London TW9 4DU, or email: psi@nationalarchives.gov.uk.
Where we have identified any third party copyright information you will need to obtain permission from the copyright holders concerned.
This publication is available at https://www.gov.uk/government/publications/costs-of-compliance/costs-of-compliance
1. Executive Summary
1.1 Introduction and Background
1. The Office for Product Safety and Standards (OPSS) commissioned IFF Research to quantify the financial and time costs that businesses incur in order to comply with regulations enforced by OPSS. The study surveyed 604 UK manufacturing businesses across all sectors known to produce consumer goods.
2. Findings are weighted to represent approximately 170,000 regulated businesses. The report aims to provide evidence-based insights to inform proportionate policy, and support businesses in maintaining compliance efficiently while safeguarding product safety.
3. All figures presented in this report should be interpreted as best estimates rather than precise measurements. Missing data was modelled, and many cost estimates were derived from reported hours and salary data using assumptions such as average working days, hours, and employment uplift rates.
4. Determining which businesses fall under OPSS regulatory remit was complex; despite robust screening, a small number of out-of-scope businesses may be included. Respondents may also have struggled to separate costs that could be directly attributable to regulatory changes from broader operating expenses, introducing uncertainty at the individual level.
5. To improve recall accuracy, the survey focused on recent regulatory changes (within the past five years or since business establishment), meaning historic compliance costs may not be fully captured. Many businesses provided estimates rather than precise figures due to the nature of telephone-based data collection, meaning respondents had to rely on memory in the moment rather than calculating precise figures; furthermore, businesses do not always record hours spent on by their staff on specific tasks, meaning responses related to time spent could only be an estimate. Labour costs were calculated using synthetic workforce categories aligned with ONS classifications.
1.2 Profile of Participating Businesses
6. The survey data is weighted by size and sector in line with the manufacturing business population. Reflecting this, the majority were micro businesses (88%) with 0-9 employees, just under one in ten (9%) were small businesses with 10-49 employees, 3% were medium businesses with 50-249 employees, and less than 0.5% were large businesses with 250 or more employees.
7. Most firms were long-established, with nearly eight in ten operating for more than 20 years. Manufacturing activities were diverse, with metal products (21%), wood-based products (18%), and textiles (14%) being the most common sectors. Awareness of specific OPSS regulations was low: 21% believed no product safety standards applied to them, and 37% were unsure. Only a small minority could name regulations such as the Electrical Equipment (Safety) Regulations 2016 or Supply of Machinery (Safety) Regulations 2008.
1.3 Compliance Management and RegTech
8. Only 16% of businesses had a dedicated compliance team, though this rose to 94% among large firms. Confidence in managing new regulations was generally high (71%), especially among firms with compliance teams (88%).
9. RegTech (short for regulatory technology) refers to the use of technology – particularly software, data analytics, artificial intelligence, and automation – to help organisations comply with regulatory requirements more efficiently and effectively. Adoption of RegTech was limited (5% overall), but those investing in RegTech were more confident than businesses without RegTech in their ability to manage new regulations (85% compared to 71%).
1.4 One-Off Labour and External Costs
10. Only 7% of businesses reported experiencing regulatory changes in the past five years.
11. Among those affected, staff time was a substantial contributor to compliance costs. Businesses spent a median of 55 hours on familiarisation, 40 hours ensuring compliance, and 30 hours on administrative tasks related to monitoring and complying with new or changed regulations, equivalent to around 16 working days in total. Median time spent was similar across size bands, although medium and large businesses spent slightly more time on ensuring compliance, potentially as a result of manufacturing a greater volume or range of products.
12. These activities translated into median labour costs of £3,060 for familiarisation, £1,670 for ensuring compliance, and £1,320 for administration. The median total labour cost per business, among those affected, was £6,950, though mean costs were much higher (£25,780), reflecting a small number of larger businesses incurring very high costs. The median cost for each activity was slightly higher among medium and large businesses incurring each cost, although the median total labour cost was similar across both broad size bands.
13. External support was common: 58% used services such as training or consultancy, with a median spend of £5,000. Use of external training was most frequent (34%), followed by legal/accounting advice (29%) and other consultants (26%). Median costs for external training were £2,800, while specialist consultancy services had the highest median cost (£10,000).
1.5 One-Off Capital and Material Costs
14. Regulatory changes often required investment in new equipment or materials. Among affected businesses, 43% invested in new production equipment or software, incurring a median upfront cost of £4,000 and median annual ongoing costs of £1,200.
15. Nearly a third of businesses (31%) that had experienced a change in regulation purchased new materials, most commonly to replace non-compliant stock. For those replacing materials, 71% said this was due to regulatory changes, and more than half (54%) experienced cost increases of 10% or less, though a fifth (20%) faced increases of 25–50%, and one business reported an increase of over 100%
16. Loss of stock was reported by 17% of businesses, with a median cost of £10,000 and a mean of £20,250; these costs varied widely, ranging from £400 to £1 million.
1.6 Overall One-Off Regulatory Cost Burden
17. Previous figures reflected only those businesses that incurred costs following new or changing regulations. However, the following figures present overall one-off costs as an average across all businesses that had experienced a regulatory change, including those that did not incur any costs (10% of the group).
18. Taking into account both those businesses that did and did not incur costs, the overall median one-off cost for businesses subject to new or amended regulations was £10,430. This figure varied by business size: micro and small firms had a median cost of £10,360, whereas medium and large firms reported a median of £30,080. The mean costs were notably higher, at £37,200 for micro and small businesses and £182,850 for medium and large firms, highlighting that a few businesses faced particularly substantial expenditures.
1.7 Ongoing Labour and external Compliance Costs
19. A quarter of businesses (25%) reported that their staff spent time on day-to-day compliance activities, rising to 60% among large firms. Among businesses that spent staff time on day-to-day compliance, monitoring products accounted for the greatest share of time (median 50 hours annually), followed by internal training and staying up to date (median 24 hours each). For medium and large businesses, the total median time commitment was 460 hours per year, equivalent to around 60 working days, compared to 94 and 100 hours respectively for micro and small businesses.
20. Median annual labour costs were £2,940 overall, rising to £12,510 for medium and large businesses. Costs varied widely, and the mean annual labour cost across all businesses with costs was £9,220, reflecting the fact that some larger businesses reported substantially higher costs.
21. Use of external support for ongoing compliance was less common than for one-off regulatory changes: 80% of businesses did not use any external services in the last 12 months. Among those that did, the most frequent service was external training (11%), followed by other consultants (10%) and external legal or accounting advisers (8%). The median spend on external services was £2,500, although the mean was £6,270, reflecting that some businesses incurred considerably higher costs (up to £307,500).
22. Among businesses adopting RegTech, the median upfront cost of this was £2,000 and the median annual ongoing cost was £1,000, including some businesses that reported annual costs of £0. Among those that had faced any annual cost the median was £1,200. Most of the businesses that had invested in RegTech reported efficiency gains. The estimated labour cost saving due to RegTech was a median £1,480 annually, marginally outweighing the median annual cost.
23. Penalties and recalls were extremely rare, reported by fewer than 0.5% of businesses.
24. Looking at ongoing costs overall, including both labour and external costs, businesses with higher turnover incurred higher absolute costs; however, these expenses represented a smaller proportion of their overall approximate turnover compared to smaller firms. For example, companies with turnover between £100,000 and £500,000 faced median annual compliance costs of £2,360, equating to 0.8% of the mid-point of that turnover band, while those with turnover between £2 million and £10 million had median costs of £22,530, amounting to just 0.1% of the mid-point of that turnover band. This demonstrates that the relative burden of compliance diminishes as business size increases.
1.8 Overall Annual Ongoing Regulatory Cost Burden
25. Figures for ongoing costs in the previous section were based only on those businesses that incurred any costs related to ongoing compliance in the previous 12 months. However, the following figures present overall ongoing costs as an average across all businesses, including the majority of businesses that did not incur any such costs, to give an indication of the regulatory cost burden across the manufacturing sector as a whole.
26. Only about a third of businesses (35%) reported having any annual compliance costs, with the majority (65%) [footnote 1] reporting annual costs of £0. As a result, the median annual cost across all businesses was £0, as more than half of businesses did not incur any costs. In contrast, a small number of larger businesses faced significant compliance expenses, which raised the average (mean) annual ongoing cost across all businesses to £3,540. As larger businesses were more likely to face costs, their median annual cost was £990. By sector, manufacturers of computers, electronics, and optical products reported the highest median ongoing annual cost (£1,500), followed by those in chemicals (£740); all other sectors reported a median ongoing annual cost of £0.
1.9 Other Compliance Costs
27. Regulatory uncertainty affected 12% of businesses, limiting investment and hiring decisions. The most common impacts were reduced confidence to invest (88%) and foregone internal or external investment. Businesses suggested clearer communication of current and forthcoming regulations, consistency in interpretation, and financial support as ways to reduce uncertainty.
1.10 Conclusions
28. One-off vs. ongoing costs: one-off compliance costs are substantially higher than ongoing annual costs. Almost all businesses affected by new or changing regulations incurred some cost, with a median one-off cost of £10,430, compared to a median of £0 for ongoing annual costs. This reflects that once compliance processes are embedded, most businesses do not face regular additional expenses.
29. Variation by size: larger businesses faced higher absolute costs, but these represented a smaller proportion of turnover compared to smaller firms. For example, businesses with turnover between £100,000 and £500,000 faced median annual compliance costs equivalent to 0.8% of turnover, compared to just 0.1% for businesses with turnover between £2 million and £10 million. This indicates a proportionally greater burden on smaller firms.
30. Sector differences: certain sectors, such as manufacturers of computers, electronics, optical products, and chemicals, reported higher ongoing costs and greater engagement with compliance activities, including investment in RegTech. These sectors also showed higher awareness of relevant OPSS regulations, suggesting that businesses producing more complex or regulated products face greater compliance challenges.
31. Impact of RegTech: Confidence in managing new regulations was generally high (71%) but even higher among firms with compliance teams or those investing in RegTech (85%). Adoption of RegTech remains limited (5%), yet businesses that invested typically reported efficiency gains. Among those reporting gains, the median annual labour saving (£1,480) slightly outweighed the median annual technology cost (£1,200), suggesting that wider adoption could help reduce compliance burdens, particularly for medium and large firms.
2. Introduction
2.1 Background
32. The Office for Product Safety and Standards (OPSS) is the UK’s national product regulator. It has the aim of reducing product related harm and helps ensure that consumers and businesses can buy and sell products with confidence. A key part of this remit is maintaining a robust evidence base on how product safety regulations affect UK businesses, particularly those involved in manufacturing and assembly.
33. To strengthen this evidence base, OPSS commissioned IFF Research to undertake the Cost of Compliance Survey. The project forms part of OPSS’s wider research programme to quantify and understand the financial and time costs associated with meeting regulations enforced by OPSS. This research contributes to OPSS’s strategic aim of developing proportionate, evidence-led policy and supporting businesses to comply efficiently while maintaining high safety standards.
34. The study provides detailed insight into how regulatory compliance costs vary by business size and sector, including micro, small, medium and large manufacturers, and across industries producing any consumer goods. By examining the full range of costs, including labour and material costs, these findings enable OPSS to identify where regulatory compliance activity may place disproportionate burdens and where guidance or support could most effectively reduce them.
2.2 Research objectives
35. The overarching aim of the project was to generate robust, quantitative evidence on the costs faced by businesses in complying with OPSS-administered product regulations. Specifically, the research sought to:
- Quantify one-off and ongoing costs of compliance, including labour, material and external expenditure.
- Assess variation in these costs by business size, sector and regulatory experience.
- Explore the extent to which regulatory change, uncertainty or enforcement activity (such as recalls or penalties) contributes to overall compliance costs.
- Examine how businesses manage compliance, including the use of internal teams, training, and investment in regulatory technology (RegTech).
36. Together, these objectives provide OPSS with a clear and evidence-based view of the total compliance burden across regulated sectors, supporting future policy development and evaluation.
2.3 Methodology overview
37. Fieldwork for the survey was conducted with 604 eligible businesses between May and August 2025. Interviews were completed using Computer-Assisted Telephone Interviewing (CATI) with business owners, directors or staff responsible for compliance. Each interview lasted around 20 minutes and covered all major aspects of compliance activity, from familiarisation with new regulations to ongoing monitoring, training and external support.
38. The achieved sample included UK businesses involved in the manufacture of OPSS-regulated products. Sampling was stratified by sector and business size (micro, small, medium and large) to ensure representativeness. Data were weighted to reflect the true structure of the regulated manufacturing population, estimated at around 170,000 businesses operating across Great Britain.
39. Further detail on sampling, data treatment, weighting and analysis procedures is provided in the Technical Appendix.
2.4 Report structure
40. The remainder of this report is structured as follows:
- Chapter 3 – Profile of participating businesses, including awareness of relevant product regulations.
- Chapter 4 – One-off labour costs associated with regulatory change or business set-up.
- Chapter 5 – Capital and material costs of compliance.
- Chapter 6 – Ongoing costs of compliance, covering both internal and external expenditure.
- Chapter 7 – Other costs of compliance, including reformulation, regulatory uncertainty and enforcement activity.
- Chapter 8 – Compliance management, including team structures, confidence and investment in RegTech.
41. The report concludes with an aggregation of findings to estimate total compliance costs across the regulated business population and to highlight implications for future OPSS policy and research.
2.5 Caveats
42. Presented in this report are best estimates of the costs manufacturers face in order to ensure they are compliant with OPSS regulatory requirements. A number of assumptions have been made to reach these figures, which should be acknowledged ahead of interpreting the data. Outlined below are some of the key caveats, for more detail please see the technical appendix and caveat list.
- Modelled and Estimated Data: Missing data has been modelled, and many cost estimates are derived from reported hours and salary data using general statistics (such as assumptions on average working days, hours, and employment uplift rates). These figures should be interpreted as best estimates rather than precise measurements.
- Scope and Coverage: Determining which businesses fall under the regulatory OPSS remit is complex; despite robust screening, a small number of out-of-scope businesses may be included. This could slightly elevate non-response rates but is unlikely to have a systemic impact on overall findings.
- Attribution of Costs: Respondents may struggle to separate costs directly attributable to regulatory changes from broader operating expenses, introducing a degree of uncertainty to individual estimates. However, the large and diverse sample is expected to offset these variances at an aggregate level.
- Time Horizon: The survey focused on recent regulatory changes (within the past five years or since business establishment) to improve recall accuracy. As a result, ongoing or historic compliance costs may not be fully captured.
- Survey Limitations: Many businesses provided cost and time estimates rather than precise figures, due to the nature of telephone-based data collection meaning respondents generally had to rely on recall in the moment rather than calculating precise figures; furthermore, businesses do not always record hours spent on by their staff on specific tasks, meaning responses related to time spent could only be an estimate.
- Labour cost calculations: Labour costs were estimated using average salary data reported against three synthetic workforce categories aligned with ONS classifications, converted to hourly cost figures multiplied by the number of hours reported for each compliance activity. Missing salary and hours data was modelled. More details on the modelling and calculation process can be found in the technical annex.
- Unquantifiable Costs: Some regulatory impacts, such as uncertainty or foregone opportunities, are inherently difficult to quantify and we did not attempt to collect costs data on these within this research.
- Sampling and Weighting: Larger businesses were intentionally oversampled to maximise data quality. Statistical weighting has been applied to ensure findings are representative of the wider manufacturing sector, though cost estimates may be more granular for larger firms.
2.6 Reporting conventions
43. Throughout the report, references to businesses or manufacturers are used to refer to participants of the survey.
44. References to businesses’ size are based on number of employees. Due to the often-limited number of surveys completed with businesses that experienced each type of cost, throughout the report businesses with more than 50 employees are grouped together and referred to as ‘medium and large sized’ businesses for all costs analysis. Similarly, businesses with fewer than 50 employees are also often grouped together and are referred to as micro and small businesses. ‘Large’ businesses refer to those with 250 employees or more, ‘medium’ refers to 50-249 employees, ‘small’ refers to 10-49 employees and ‘micro’ refers to 1-9 employees, including sole traders.
45. Unless explicitly noted, all findings are based on weighted data. Unweighted bases (the number of responses from which the findings are derived) are displayed on tables and charts as appropriate to give an indication of the robustness of results. Differences in percentages between subgroups are statistically significant unless stated otherwise. However, mean and median cost estimates are reported by business size even where differences are not statistically significant. In these cases, the absence of statistical significance is likely to reflect small base sizes rather than the absence of underlying differences.
46. To reinforce that the figures presented are best estimates, costs that have been derived through calculations based on hours and salaries are presented to the nearest £10. When costs are mentioned that came directly from businesses (such as cost of external training) these costs are presented as the business reported them.
47. For certain costs, a few exceptionally high values were reported, which were several times greater than the next highest figure. Given the relatively small base sizes for some cost measures and subgroups, these had a disproportionate effect on the mean estimates in these cases. In line with best practice for small samples with high variability, we therefore primarily report medians throughout this report. Outliers were assessed and only clearly atypical values were identified. These rare but genuine responses have been retained to illustrate the range of costs experienced by some businesses. To maintain transparency and avoid misunderstanding, mean values are shown both including and excluding the most extreme outliers where relevant, ensuring the full distribution of reported costs is accurately reflected.
3.Profile of participating businesses
3.1 Business size and main activity
48. The survey data is weighted by size and sector in line with the manufacturing business population. Reflecting this, the majority were micro businesses (88%) with 0-9 employees, just under one in ten (9%) were small businesses with 10-49 employees, 3% were medium businesses with 50-249 employees, and less than 0.5% were large businesses with 250 or more employees.
49. As shown in Figure 3.1 below, the most common sectors were the manufacture of basic or fabricated metal products (21%), manufacture of wood, cork, paper or straw products (18%) and manufacture of textiles or wearing apparel (14%).
50. Around one in ten (11%) of businesses came from other manufacturing, which is a separate SIC classification that includes a number of different manufacturers including: manufacturers of jewellery; instruments; games and toys as well as others.
Figure 3.1 Main activity of business
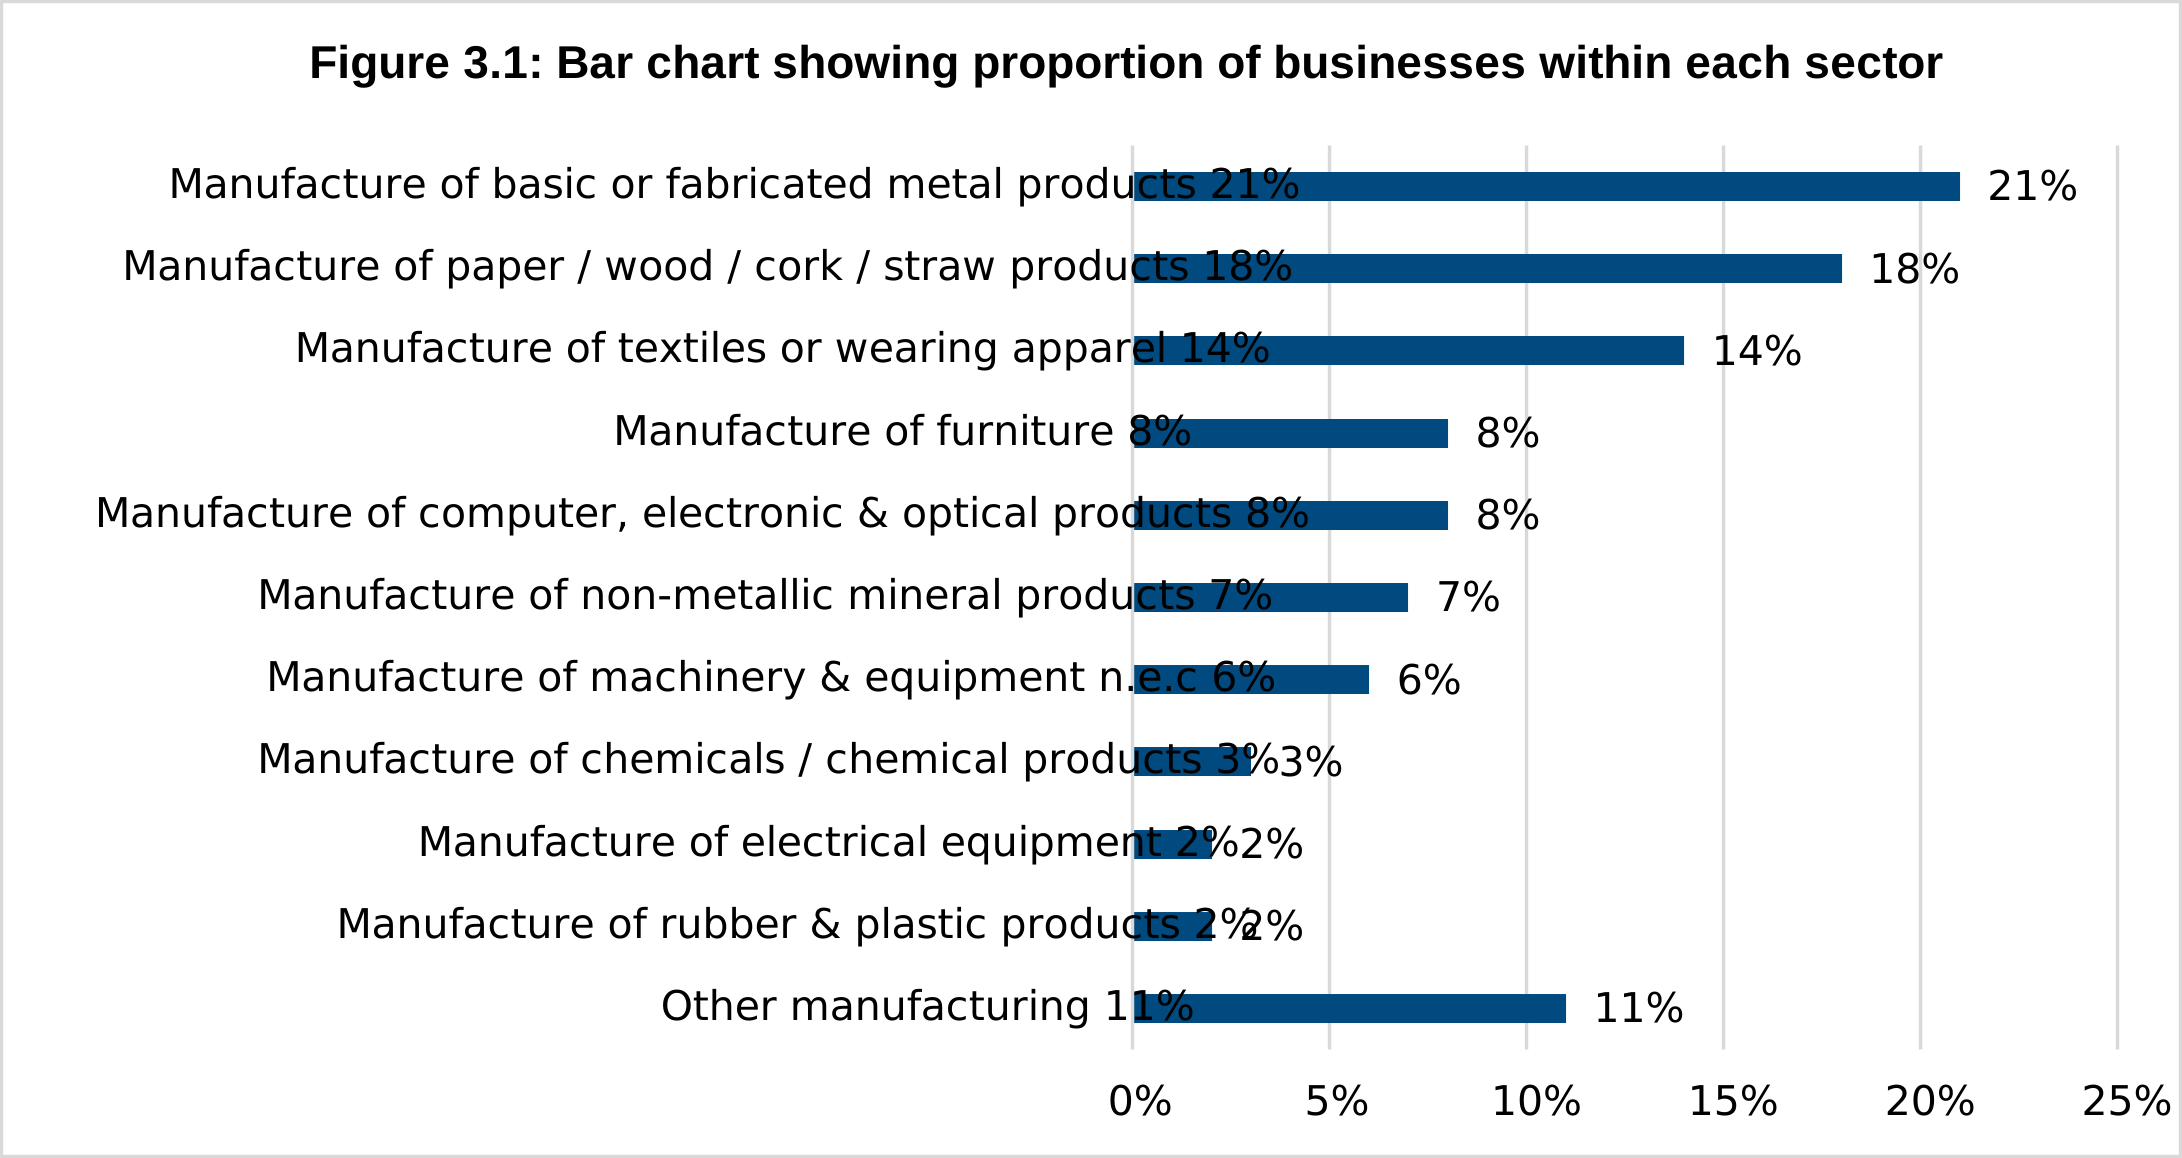
S1/S1a. What is the main activity of your business? Base: All businesses (604)
For unweighted population figures, please refer to the Technical Appendix.
3.2 Length of time operating
51. The majority of businesses were well established, across all size bands, with the majority in operation for 10 years or more, and nearly eight in ten having operated for more than 20 years.
Table 3.1: Length of time business has operated
| Time operating | All | Micro (0-9) | Small (10-49) | Medium (50-249) | Large (250+) |
|---|---|---|---|---|---|
| Base | 604 | 236 | 157 | 187 | 24 |
| 0-1 years | <0.5% | 0% | 1% | 0% | 0% |
| More than 1 up to 2 years | <0.5% | <0.5% | 0% | 0% | 0% |
| More than 2 up to 5 years | 2% | 2% | 1% | 2% | 0% |
| More than 5 up to 10 years | 7% | 7% | 2% | 2% | 3% |
| More than 10 up to 20 years | 12% | 12% | 14% | 7% | 7% |
| More than 20 up to 50 years | 63% | 64% | 62% | 52% | 27% |
| More than 50 years | 16% | 15% | 20% | 37% | 63% |
| Don’t know | <0.5% | <0.5% | <0.5% | 0% | 0% |
A2. How long has your business been operational? Base: All businesses.
3.3 Types of products manufactured
52. Businesses manufactured a wide range of products; the most common are shown in Figure 3.2 below. Just over a fifth (21%) manufactured furniture or soft furnishings, nearly double the proportion manufacturing the next most common product, household or garden fittings (11%). Other common products, each reported by 10% of businesses, were steel and metal products, sport and leisure items, homeware, and electronics.
53. It is worth noting that businesses could list multiple products, meaning that the most common products do not align precisely with the broad business sectors shown in Figure 3.1. Furthermore, businesses within the same broad sectors often produced different types of goods; for example, among businesses in the manufacture of basic metals sector, products commonly listed included steel and metal, machinery and equipment, plumbing or heating components, and sports or leisure items, as well as a number of other product categories selected by individual businesses.
Figure 3.2: Types of products manufactured
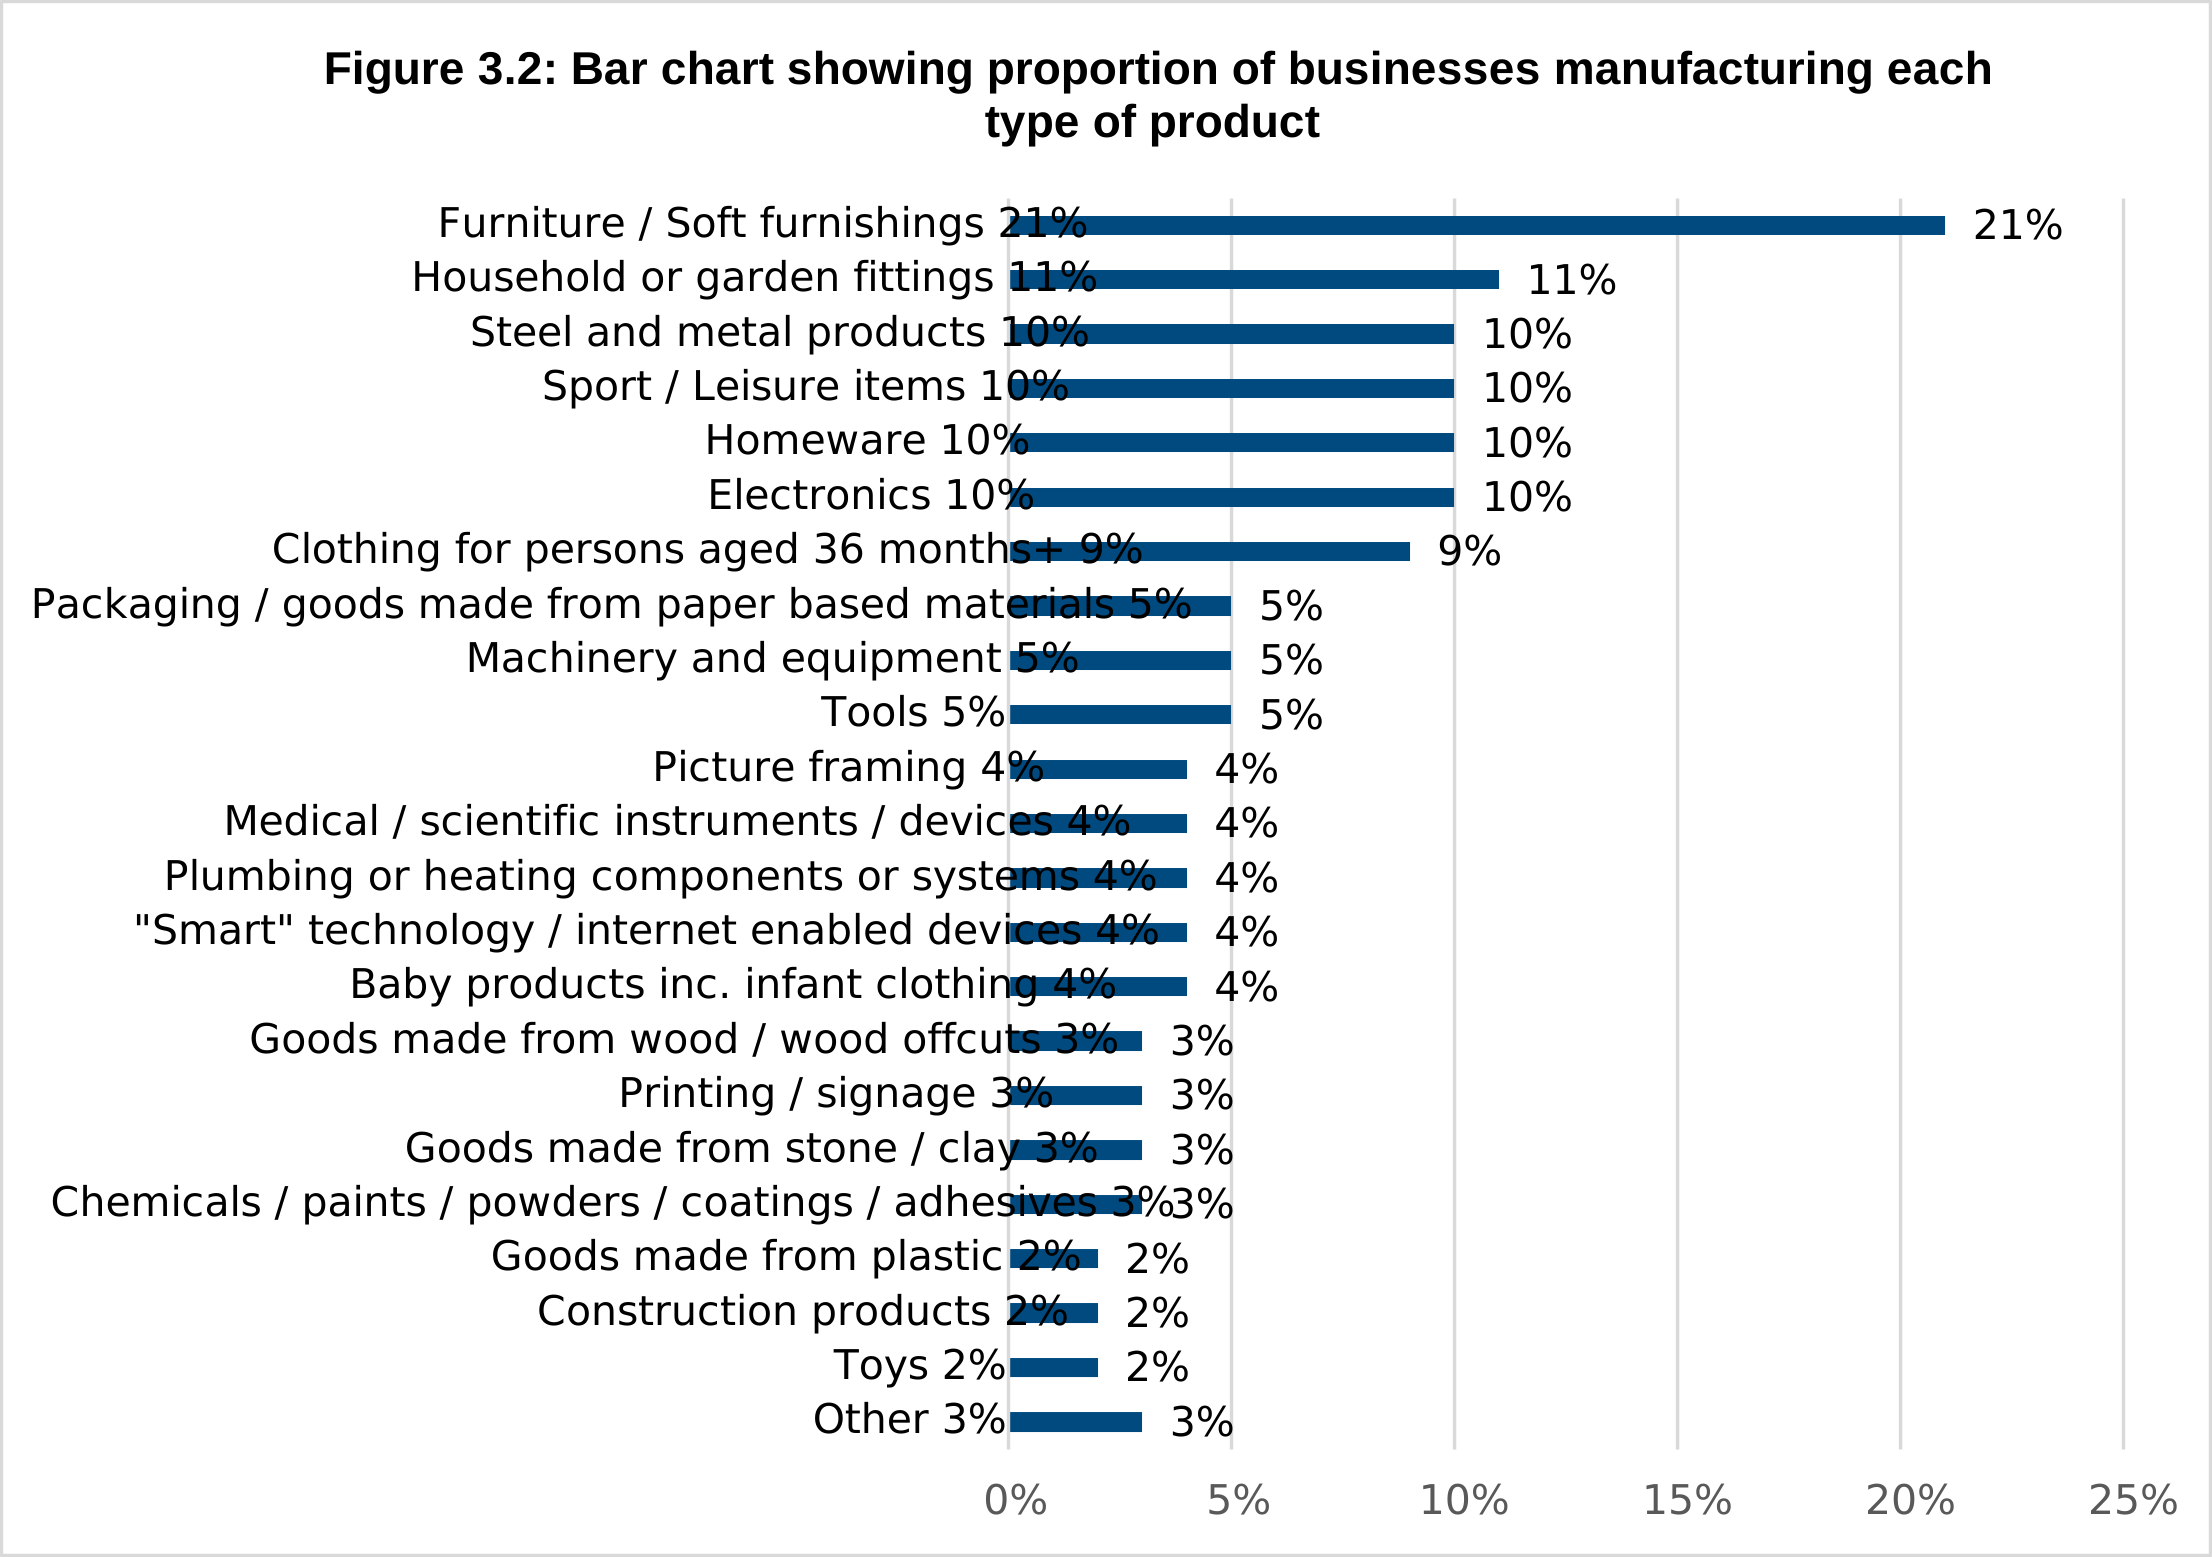
S3. What type of products do you manufacture? Base: All businesses (604). Note product types reported by fewer than 2% of businesses not shown.
Awareness of relevant regulations
54. Businesses were asked, unprompted, to name any product safety regulations that impacted their business;[footnote 2] spontaneous awareness of regulations enforced by OPSS was very low.
55. Just over a fifth (21%) of businesses stated there were no product safety standards or regulations that impacted their business, and a further 37% said they did not know if any product safety standards or regulations impacted their business. Medium and large businesses were less likely to state they were not aware of any regulations (8%) or that they did not know (14%).
56. Businesses of all sizes also struggled to separate product safety standards or regulations from other regulatory or standard-related requirements, with regulations listed including general mentions of health and safety (14%), environmental / waste (5%), and building / construction (4%), as well as specific regulations not directly related to product standards or safety, such as the Quality Management Standard ISO 9001 (4%).
57. The most commonly reported regulations enforced by OPSS were the Supply of Machinery (Safety) Regulations 2008 (5%) and Electrical Equipment (Safety) Regulations 2016 (4%).
58. The following regulations were each mentioned by 1% of businesses:
- The Equipment and Protective Systems Intended for Use in Potentially Explosive Atmospheres Regulations 2016;
- The Measuring Instruments Regulations 2016;
- The Furniture and Furnishings (Fire) (Safety) Regulations 1988 ;and
- The Electromagnetic Compatibility Regulations 2016.
59. The following regulations were each mentioned by fewer than 0.5% of businesses:
- Regulation 1223/2009 of the European Parliament and of the Council on cosmetic products;
- Noise Emissions in the Environment by Equipment for Use Outdoors Regulations 2001;
- Non-Automatic Weighing Instruments Regulations 2016;
- Regulation 2016/425 of the European Parliament and of the Counsil on personal protective equipment as brought into UK law and amended, and the Personal Protective Equipment (Enforcement) Regulations 2018;
- The Pressure Equipment (Safety) Regulations 2016;
- The Simple Pressure Vessels (Safety) Regulations 2016;
- The Toys (Safety) Regulations 2011;
- The Radio Equipment Regulations 2017;
- The Plugs and Sockets etc. (Safety) Regulations 1994; and
- Hallmarking Act 1973.
60. While overall spontaneous awareness of specific OPSS regulations was limited, there were notable variations between manufacturing sectors:
- Electrical equipment: 25% mentioned the Electrical Equipment (Safety) Regulations 2016, and 13% mentioned the Supply of Machinery (Safety) Regulations 2008.
- Machinery and equipment not elsewhere classified: 16% mentioned Electrical Equipment (Safety) Regulations 2016, 6% mentioned the Electromagnetic Compatibility Regulations 2016, and 5% mentioned the Equipment and Protective Systems Intended for Use in Potentially Explosive Atmospheres Regulations 2016.
- Wood / products of wood and cork; paper and paper products: 13% mentioned Supply of Machinery (Safety) Regulations 2008.
- Computer, electronic and optical products: 11% mentioned Electrical Equipment (Safety) Regulations 2016, 5% mentioned the Electromagnetic Compatibility Regulations 2016.
- Chemicals and chemical products manufacturers: 11% mentioned Regulation 1223/2009 of the European Parliament and of the Council on cosmetic products, and 10% mentioned the Furniture and Furnishings (Fire) (Safety) Regulations 1988.
- Furniture sector: 6% mentioned the Furniture and Furnishings (Fire) (Safety) Regulations 1988.
4. Compliance Management
61. In this chapter, we will show how businesses managed compliance. This includes whether they have an in-house compliance team, their confidence in their ability to comply with UK standards and regulations, and whether they have invested in RegTech. RegTech (short for regulatory technology) refers to the use of technology – particularly software, data analytics, artificial intelligence, and automation – to help organisations comply with regulatory requirements more efficiently and effectively.
Summary of findings on other costs of compliance
- Just 16% of all surveyed manufacturing businesses reported having a dedicated compliance team, with this figure rising to 94% among large firms and falling to 13% among micro firms.[footnote 3]
- Overall, seven in ten (71%) manufacturers felt confident in their ability to understand and comply with new regulations, with confidence highest among medium and large firms (92%) and lowest among those in the ‘other manufacturing’ sector (51%).
- Firms with a dedicated compliance team expressed greater confidence (88%) in dealing with new regulations compared to those without such a team (68%).
- Adoption of RegTech solutions remained limited across the sector, with only a minority of businesses reporting investment in regulatory technology to support compliance activities.
4.1 Compliance teams
62. The likelihood of businesses having a compliance team varied considerably by business size. As might be expected, larger businesses were more likely to have a team dedicated to compliance. As can be seen in Figure 4.1, 16% of all businesses had a dedicated compliance team. However, there was considerable variation by size, ranging from just 13% of micro firms, to 64% of medium firms. Nearly all large firms (94%), though due to the small number of large businesses that took part in the research this figure should be treated with caution.
Figure 4.1 Proportion of businesses with dedicated compliance team by size.
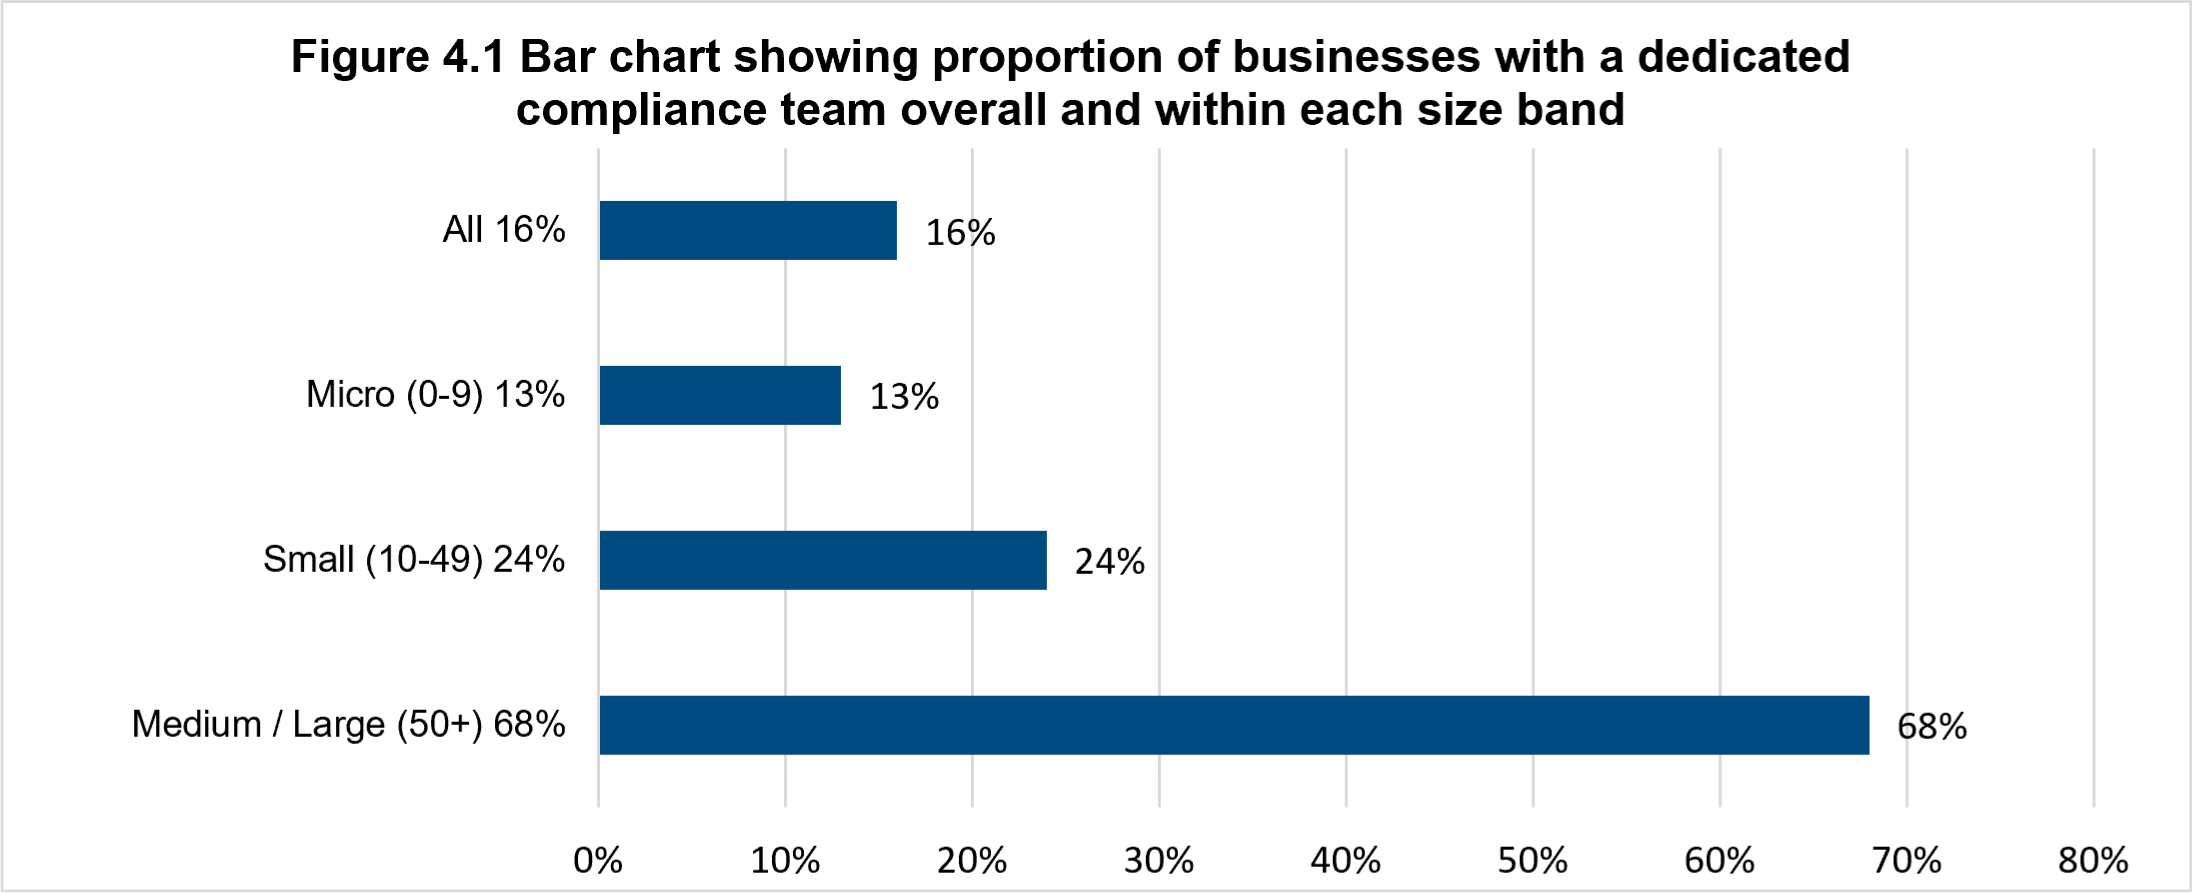
F1. Does your business have a dedicated compliance team? Base: All businesses impacted by uncertainty (604); Micro (236); Small (157); Medium / Large (211).
63. By sector, manufacturers of computers, electronics and optical products were most likely to have a dedicated compliance team (34%), followed by manufacturers of machinery and equipment (24%).
4.2 Confidence in dealing with new regulations
64. Businesses were asked how confident they were in their firm’s ability to understand and comply with new regulations. As shown in Figure 4.2 below, businesses were generally confident in their ability to understand and comply with new regulations. Overall, seven in ten (71%) manufacturers said they were confident, with three in ten (31%) saying they would have no concerns at all. Medium sized businesses were more likely than average to say they had confidence (92%), and almost all large businesses interviewed also said they were confident (96%). Only one in twenty (5%) manufacturers felt unconfident in their ability to understand and comply with new regulations.
65. Businesses that were spontaneously aware of at least one OPSS product safety regulation were more likely to be confident in their ability to understand and comply with new regulations (83%). Those unable to name any OPSS regulations, or who said they were not aware of any safety regulations, were less confident in their ability to understand and comply with new regulations (70%).
Figure 4.2 Confidence in firm’s ability to understand and comply with new regulations
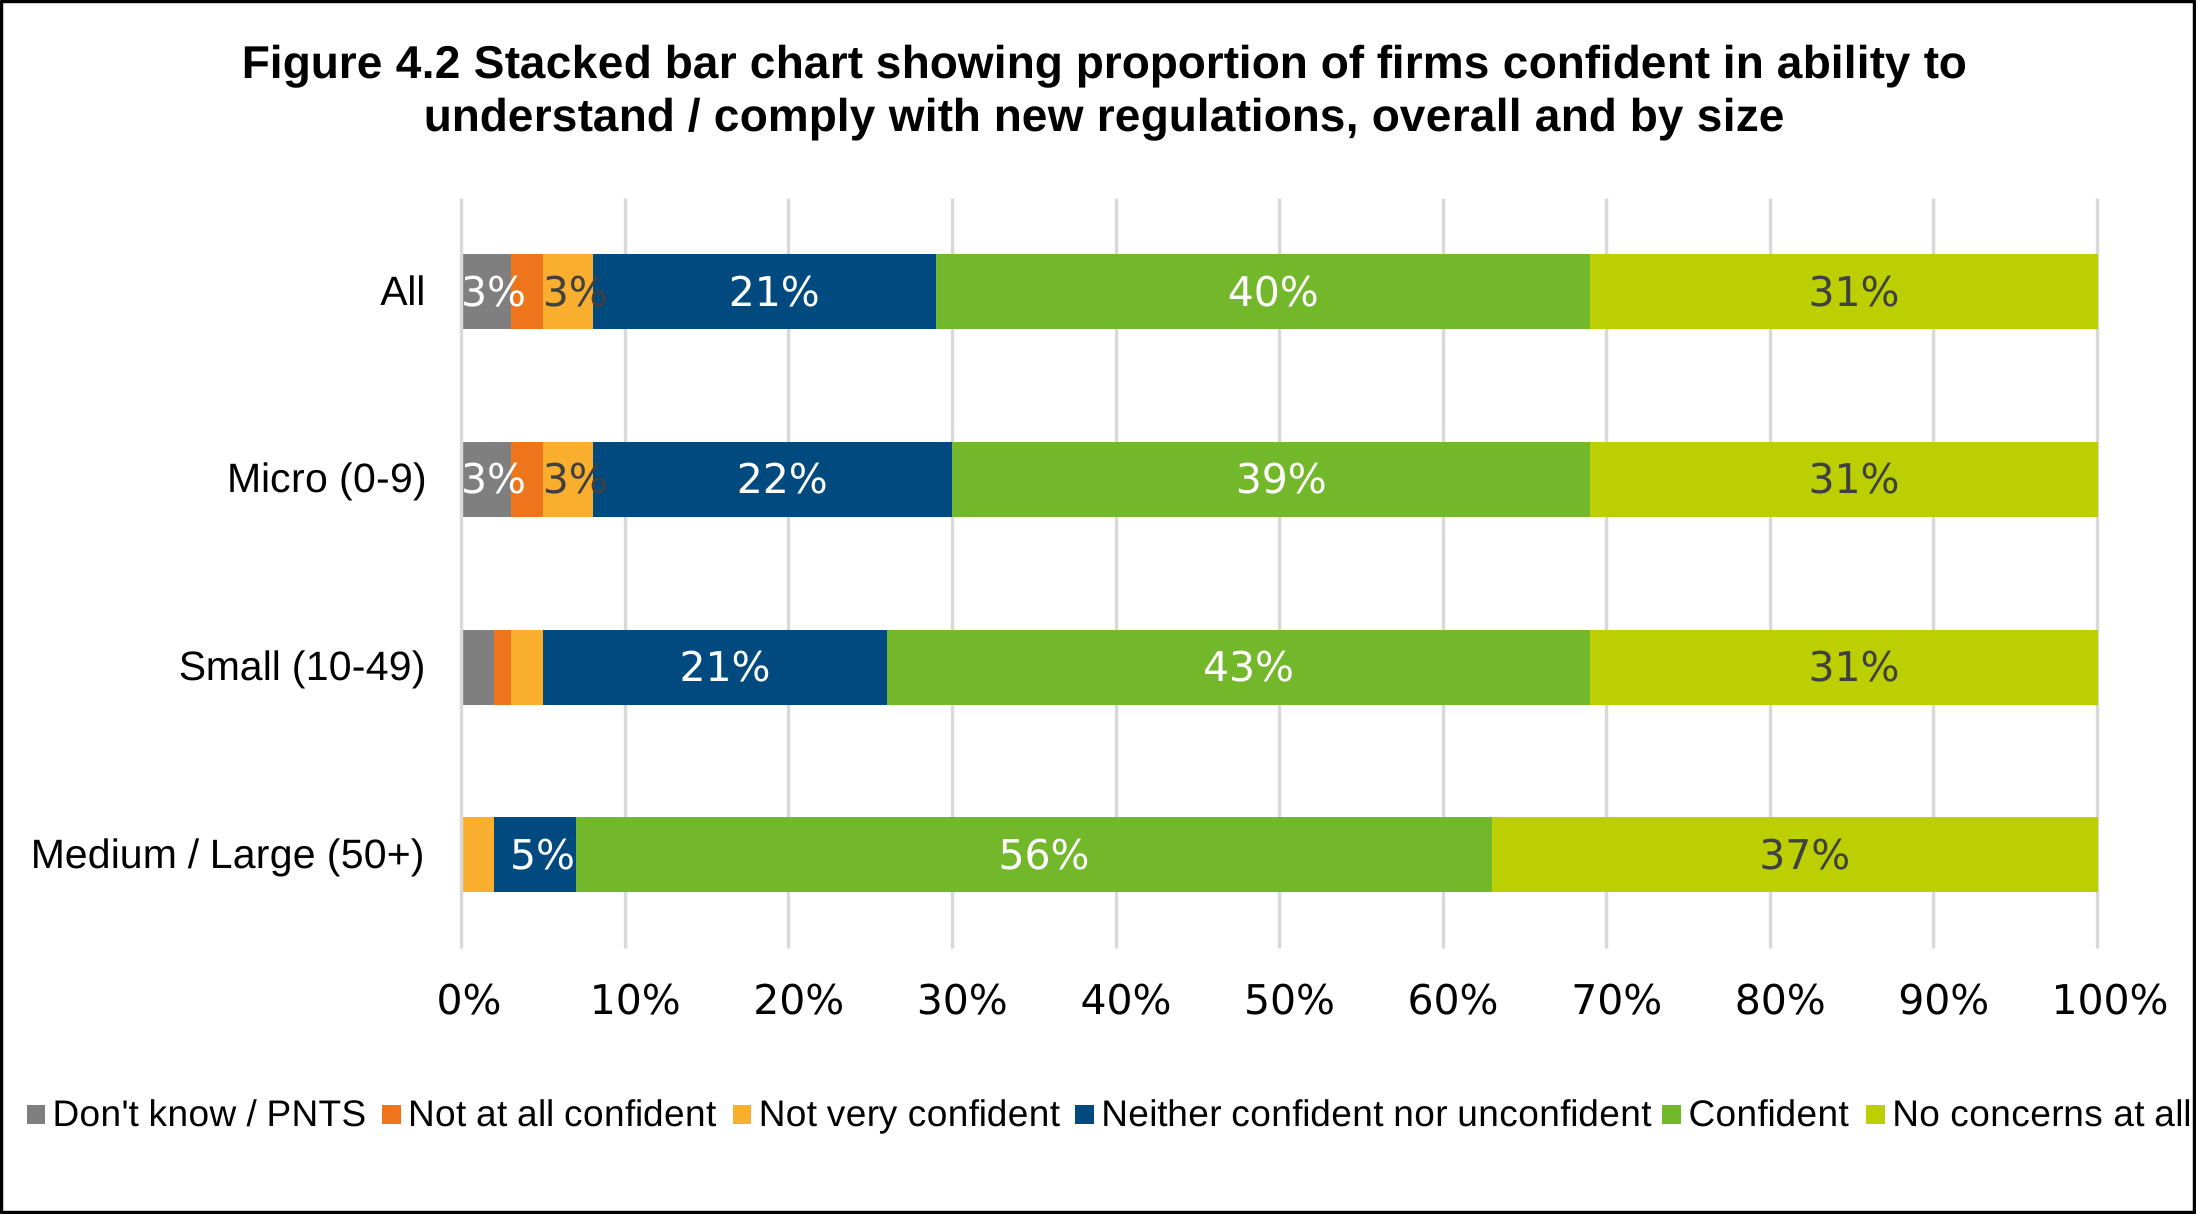
H2. How confident are you in your firm’s ability to understand and comply with new regulations? Base: All (604), Micro (236), Small (157), Medium / Large (211).
66. By size, medium and large firms were more likely to feel confident (56%). By sector, there were higher levels of confidence among manufacturers of electrical equipment (88%) and machinery and equipment not elsewhere classified (82%), while those in the Other manufacturing sector were less likely to feel confident (51%).
67. Businesses with a turnover of over £10 million were also more likely to be confident (94%). Furthermore, those with a dedicated compliance team were more likely to feel confident in their ability to understand and comply with new regulations (88% compared to 68% without a compliance team), as were those who had invested in regulatory technology or ‘RegTech’ (85% compared to 71% who had not invested)
68. Businesses that said they had experienced a change in regulations in the previous 5 years were more likely to say they were confident than those who had not (90% vs 70%). This could mean that the necessity of complying with these regulations has built confidence; however, it is also possible that businesses that were aware and are on top of changing regulations were more confident in their ability to comply than those who were less aware of the changing regulatory landscape.
RegTech
69. RegTech (short for regulatory technology) refers to the use of technology – particularly software, data analytics, artificial intelligence, and automation – to help organisations comply with regulatory requirements more efficiently and effectively.
70. The Literature review found that RegTech has become an increasingly significant feature of regulatory costs. However, use of RegTech among manufacturers remains low with just one in twenty (5%) reporting that their businesses had invested in this technology. As might be expected this increased with size. As shown in Figure 4.3, likelihood to invest in RegTech increased with size, from 4% of micro and 3% of small businesses, to nearly a fifth (17%) of medium businesses, and nearly two-fifths (38%) of large businesses.
Figure 4.3 Proportion of manufacturers that have invested in RegTech
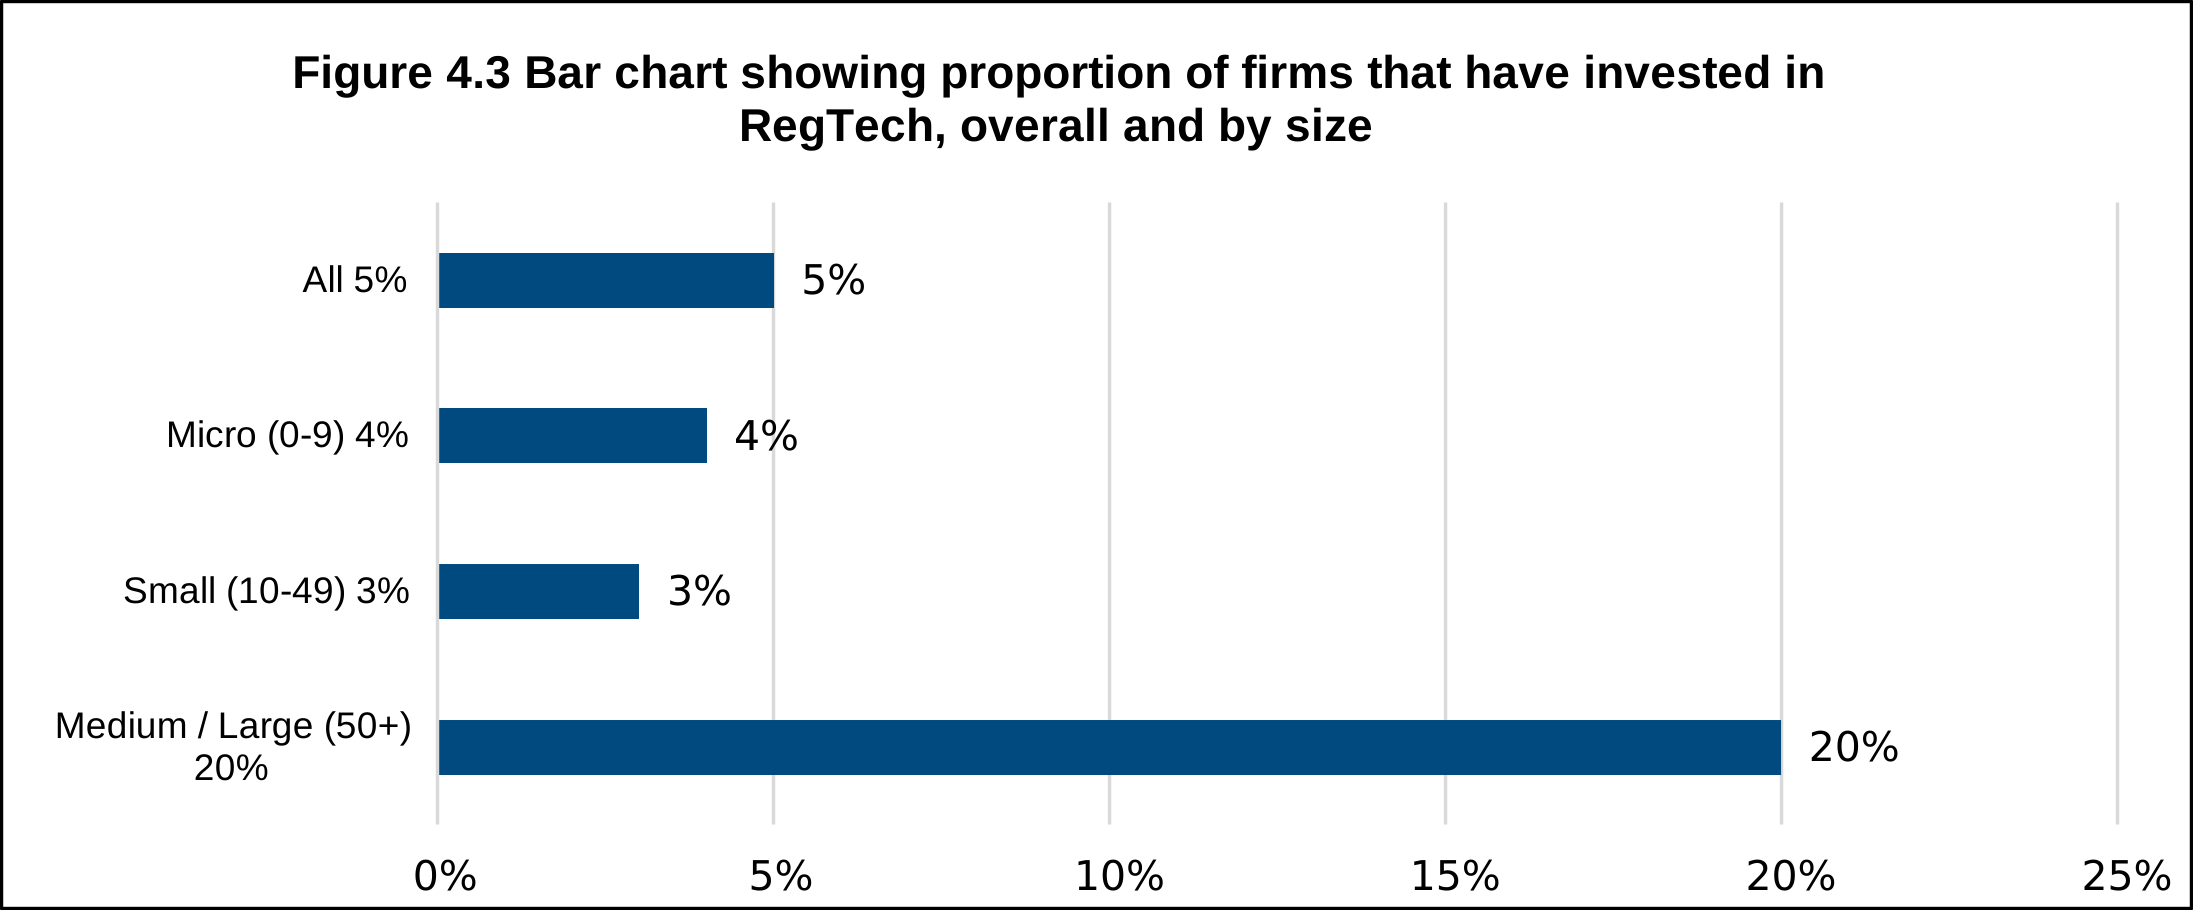
H5. Have you invested in any software related to regulatory compliance (RegTech)? Base: All (604), Micro (236); Small (157); Medium / Large (211). *Figures should be treated with caution due to low base.
71. Manufacturers of chemicals and chemical products were most likely to have invested in RegTech (44%), while manufacturers of computer, electronic and optical products (25%) were also more likely to invest compared to an average business. Businesses that had been impacted by new or changing regulations in the past 5 years were also more likely to have invested in RegTech (20% compared to 4% of those that had not been impacted). The proportion investing in RegTech was also higher among businesses with a dedicated compliance team (10% compared to 4% among those without a compliance team).
72. Those that had invested in RegTech were asked when this investment was first made; nearly three-quarters (64%) had first invested more than 12 months ago, just over a quarter (26%) had invested between 6 and 12 months ago, while just under one in ten (9%) had invested within the last 6 months.
5. One-off Costs of Regulatory Compliance
73 In this chapter, we examine one-off labour costs that businesses incurred as a result of a change in regulations or needing to ensure compliance with existing regulations for the first time during the start-up phase of the business. These costs include time spent by staff on familiarisation, implementation and administration related to compliance.
Summary of findings on one-off labour costs
-
Complying with product safety regulations during initial set-up of a business or following regulatory changes can incur substantial labour and external costs. However, only a small minority (7%) of manufacturers had experienced any such regulatory change in the past 5 years.
-
Staff time spent learning about new requirements, implementing compliance, and administration resulted in median total labour costs of £6,950 per business, with medium and large firms facing higher costs than micro and small businesses.
-
External support – such as training, legal, or consultancy services – was used by over half of affected businesses, with a median spend of £5,000; use of specialist consultancy services incurred the highest costs on average.
-
Medium and large businesses were more likely to use external trainers, while firms without in-house compliance teams relied more on external legal or accounting advice.
5.1 Incidence of regulatory change or initial set-up
74. Very few businesses operational for more than two years were aware of any changes to product safety regulations in the last five years (7%). As noted in the previous chapter, only a small minority of businesses had been operational for less than two years (equivalent to 0.3% of all businesses) and were able to give information on costs related to compliance incurred during the initial setup of the business.
Figure 5.1 Proportion of businesses experiencing a change in regulation
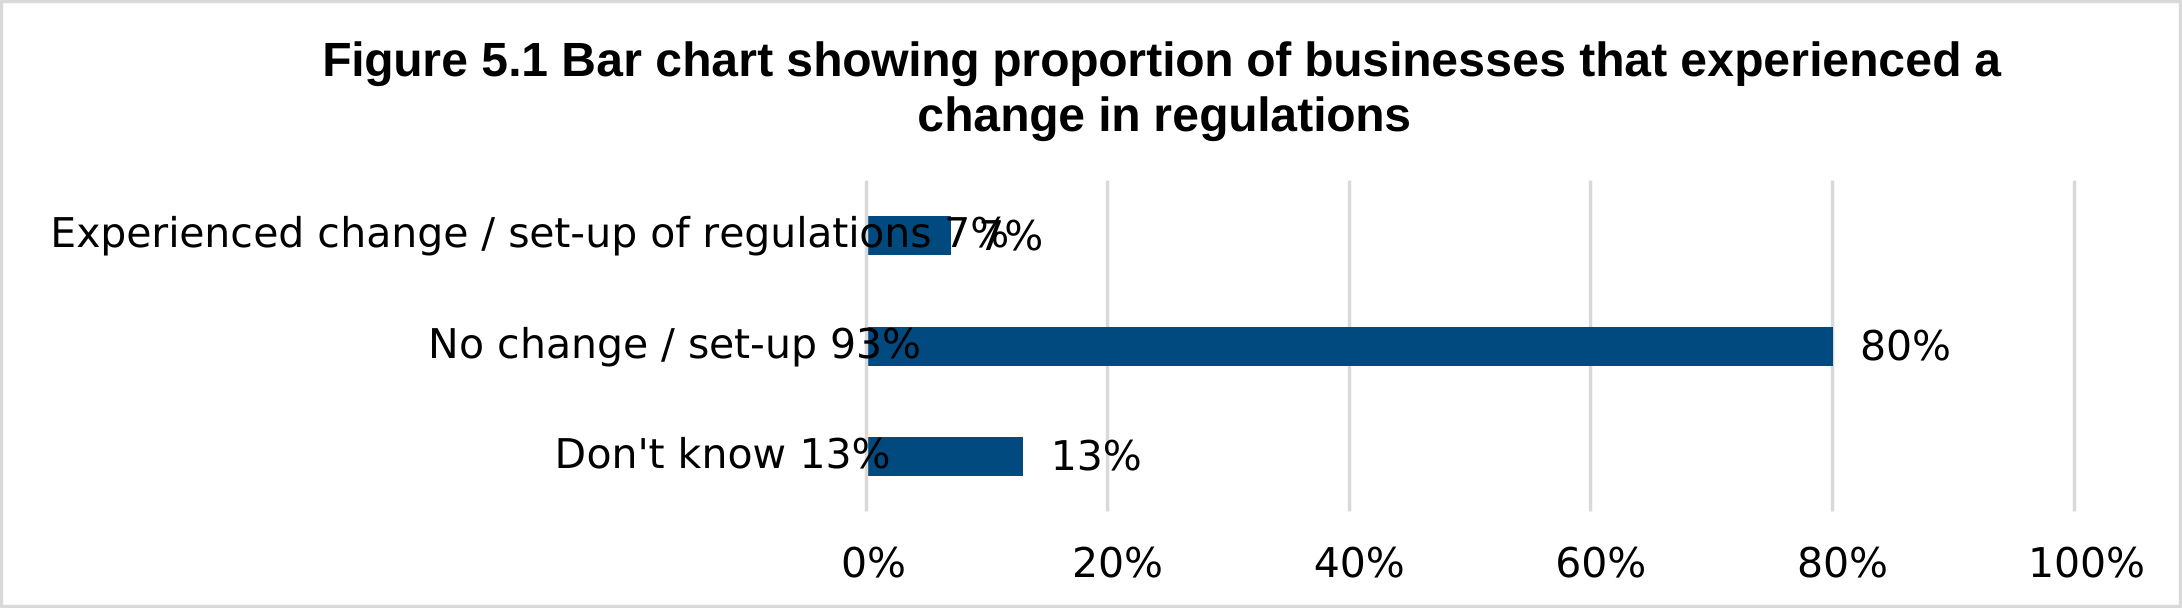
B1: In the past 5 years, have there been any changes to product safety regulations, or the introduction of new product safety standards or regulations, which have impacted your business? Base: All businesses operational for more than 2 years (602).
5.2 Internal labour costs of regulatory change or set-up
75. Businesses that had experienced a change in regulations, or undertaken compliance activities for the first time as a new business, were asked about staff time spent on:
- Learning about new regulations and how these impact the business;
- Ensuring products and services comply with new or changed product safety standards or regulations; and
- Administrative tasks related to monitoring and complying with new or changed product safety standards or regulations.
Staff time related to regulatory change or set-up
76. As shown in Figure 5.2 below, learning about new or changed regulations (familiarisation), accounted for the largest amount of staff time, with a median of 55 hours spent (equivalent to just over 7 standard working days). This was followed by time spent ensuring products complied with the relevant regulations or standards (median 40 hours) and time spent on related administrative tasks (median 30 hours).
Figure 5.2: Median hours spent on tasks related to a change in regulations or during initial set-up of the business
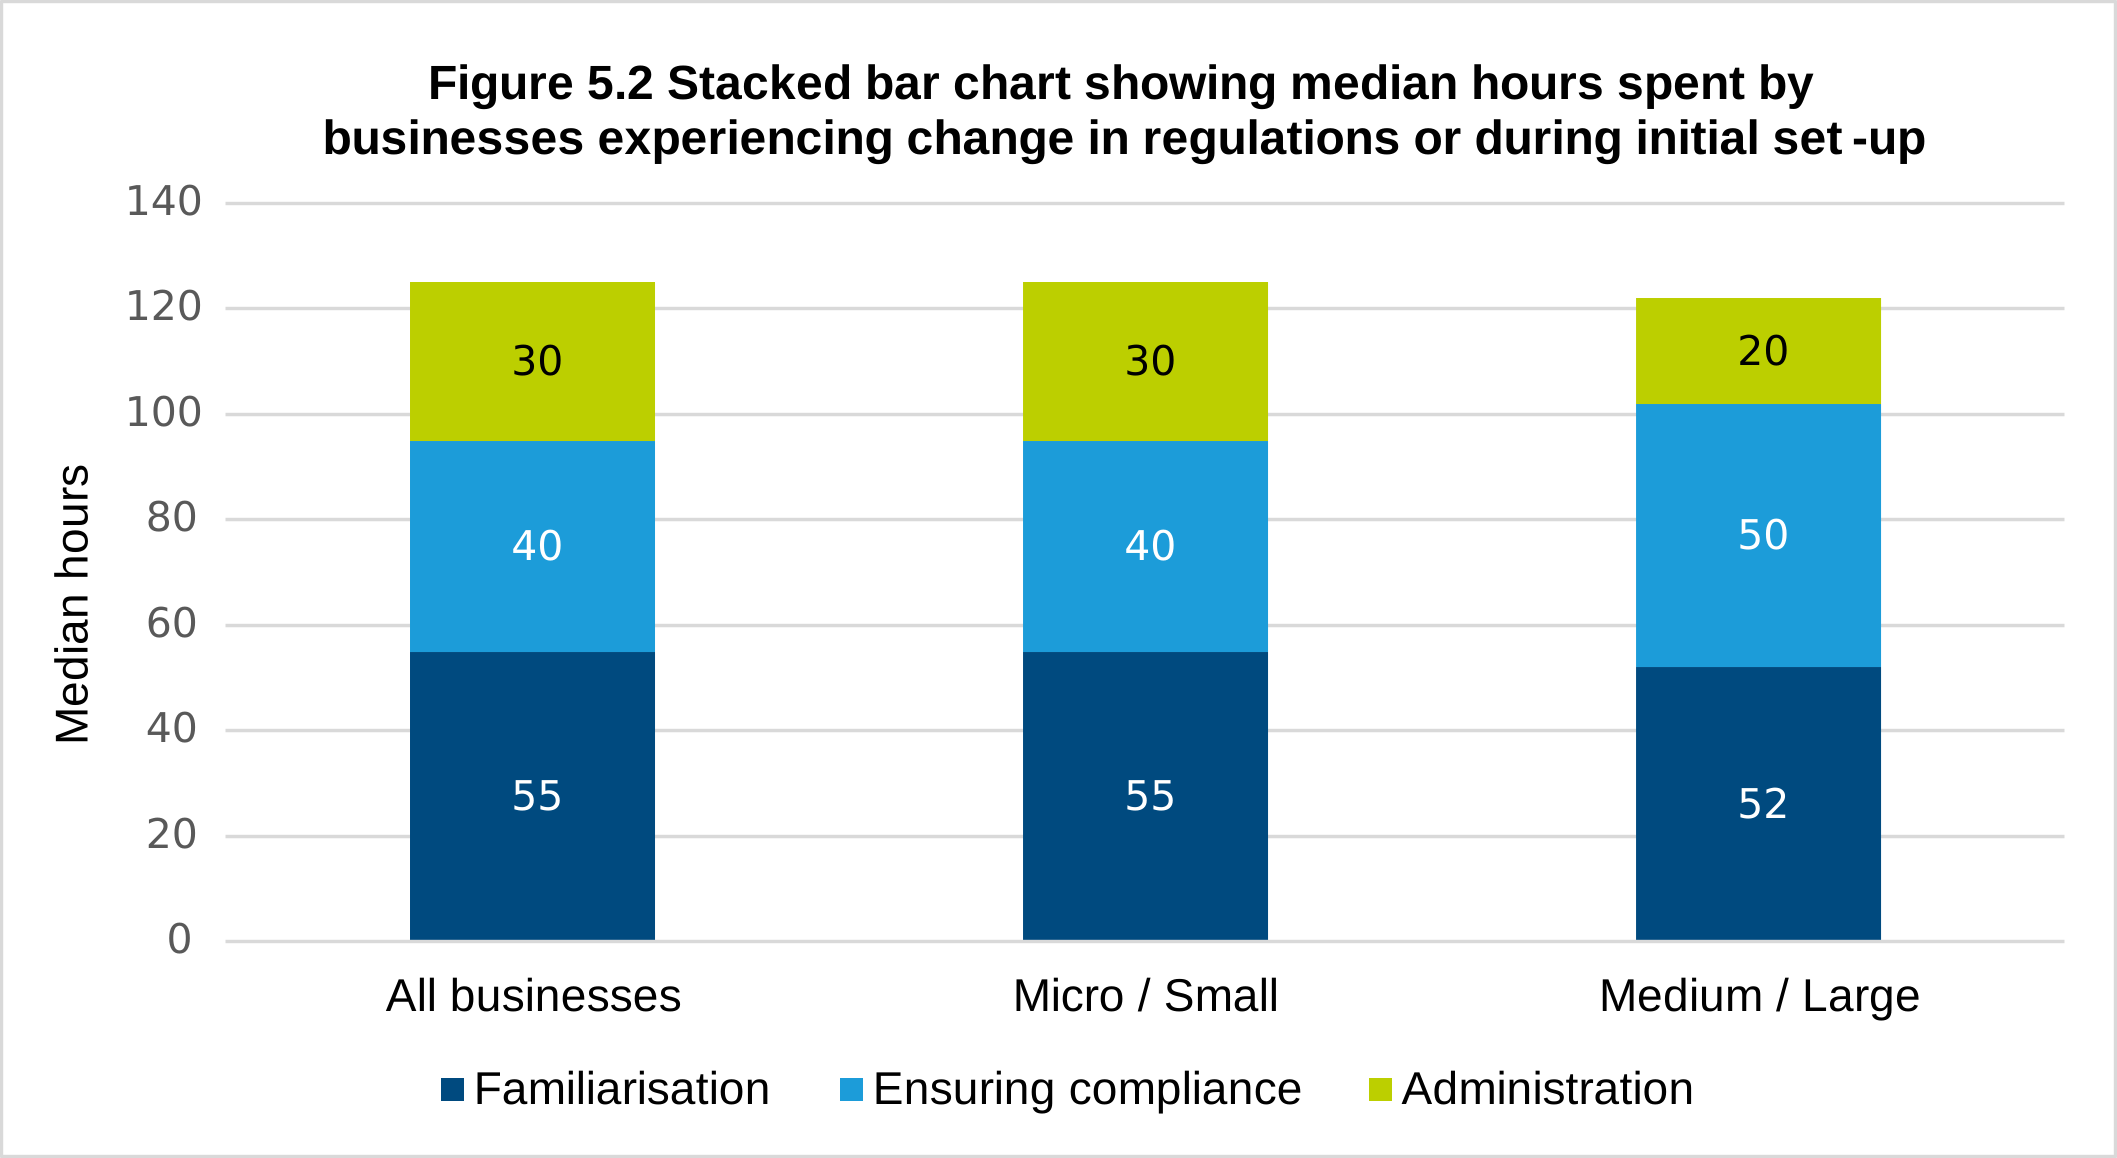
B3/B5/B6: When first setting up your business / For the most recent change in product safety standards or regulations, what was the total number of hours employees spent [learning about new regulations and how these impact your business / ensuring your products and services complies with the new or changed product safety standards or regulations / on administrative tasks related to monitoring and complying with the new or changed product safety standards or regulations]? Base: Businesses experiencing a change in regulations or new businesses operating 2 years or less: All (126); Micro / Small (54); Medium / Large (72).
77. There was little difference by size band, with medium and large businesses spending slightly less time on familiarisation and administration, and slightly more time on ensuring compliance of their products on average, potentially as a result of manufacturing a greater volume or range of products.
Costs of staff time spent on regulatory change or set-up
78. In this section, we will examine the associated labour costs incurred by businesses as a result of time spent on each activity.
79. In line with having taken the most staff hours on average, the business cost for familiarisation with changed or new regulations was a median £3,060. Ensuring products were compliant had a median labour cost of £1,670, and administration relating to monitoring and complying with new or changed regulations had a median labour cost of £1,320, as shown in Table 5.1 below. The median cost for each activity was slightly higher among medium and large businesses incurring each cost, although the median total labour cost was similar across both broad size bands. Mean costs were higher for each activity and overall, among medium and large businesses, reflecting a small number of larger businesses incurring substantially higher costs.
Table 5.1 Estimated mean and median labour costs relating to a change in regulations or during initial set-up of the business
| Activity | Base Median Mean | All | Micro / Small* | Medium / Large |
|---|---|---|---|---|
| Learning about new or changed product safety standards or regulations and how these impact the business | Base | 104 | 41 | 63 |
| Learning about new or changed product safety standards or regulations and how these impact the business | Median | £3,060 | £2,920 | £3,060 |
| Learning about new or changed product safety standards or regulations and how these impact the business | Mean | £9,720 | £8,840 | £13,850 |
| Ensuring compliance with new or changed product safety standards or regulations | Base | 97 | 39 | 58 |
| Ensuring compliance with new or changed product safety standards or regulations | Median | £1,670 | £1,490 | £2,300 |
| Ensuring compliance with new or changed product safety standards or regulations | Mean | £9,980 | £9,820 | £10,750 |
| Administration related to monitoring and complying with new or changed product safety standards or regulations | Base | 90 | 38 | 52 |
| Administration related to monitoring and complying with new or changed product safety standards or regulations | Median | £1,320 | £1,320 | £1,850 |
| Administration related to monitoring and complying with new or changed product safety standards or regulations | Mean | £6,710 | £5,200 | £15,270 |
| Total labour costs relating to a change in regulations or during initial set-up of business | Base | 104 | 41 | 63 |
| Total labour costs relating to a change in regulations or during initial set-up of business | Median | £6,950 | £6,950 | £6,520 |
| Total labour costs relating to a change in regulations or during initial set-up of business | Mean | £25,780 | £23,540 | £36,360 |
B3/B5/B6. Thinking about the most recent change in product safety standards or regulations, how much staff time did your business spend on: Learning about the requirements (Base: 104; Micro / Small: 41; Medium / Large: 63); Ensuring compliance (Base: 97; Micro / Small: 39; Medium / Large: 58); and Administration related to monitoring and meeting the regulations (Base: 90; Micro / Small: 38; Medium / Large: 52. Total labour cost relates to all reporting any staff time (Base: 104 Micro / Small: 41; Medium / Large: 63).*Figures should be treated with caution due to low base sizes. Base: All businesses incurring each cost.
5.3 External costs relating to regulatory change or set-up
80. Businesses were asked if they had incurred costs for the following external support services in response to changed or new regulations or during their initial set-up:
- External legal or accounting advice;
- External training or trainers to help ensure compliance; and
- Any other kind of external consultants.
Use of external support services
81. As shown in Figure 5.3 below, the most common service was external training or trainers, used by around a third (34%) of these businesses, followed by external legal or accounting advice (29%) and any other external consultants (26%). Other consultants used were primarily services related directly to product quality or safety standards testing. Overall, just over two-fifths (42%) of businesses had not used any external services in response to new or changing regulations, with no significant difference between size bands.
Figure 5.3 Proportion of business incurring costs for external training, advice or consultancy

B7. Turning to external costs that your business incurred due to the most recent change in product safety standards or regulations / regarding product safety standards or regulations when first setting up your business, did your business incur costs for any of the following? Base: All businesses experiencing a change in regulations or new businesses able to report on initial set-up costs. All (126); Micro / Small (54); Medium / Large (72).
82. Medium and Large sized businesses were more likely to have used external training or trainers (49%) compared to micro and small businesses (32%). However, there was no difference between the sizes in the use of external legal or accounting advice or other external consultants.
83. Businesses without a dedicated in-house compliance team were more likely to have incurred costs for external legal or accounting advice (37%) compared with those with an in-house compliance team (17%). Conversely, those with an in-house compliance team were more likely to have used external trainers or training (46%) compared to those without a dedicated compliance team (27%).
Costs of external support services
84. Businesses that had experienced a change in regulations or undertaking one-off compliance activities during their start-up phase spent a median of £5,000 on external support services in total, and a mean of £25,650. The difference between these two figures reflects the wide spread of expenditures, ranging from just £500 up to £1 million.
85. The highest costs were incurred among those using other external consultancy services, which generally covered specialist services relating to product testing and compliance, with a median spend of £10,000 and a mean of £42,610. Note the maximum cost reported for other external consultants was £1,000,000, which stands out as a clear outlier. The next highest cost was £200,000. When excluding the outlier, the mean cost incurred for other external consultants was £25,080.
86. Use of external training or trainers incurred the lowest median cost (£2,800), just over half the median cost of external legal or accounting advice (£5,000). However, there was less difference between the mean costs for the latter services (£5,900 and £6,730 respectively), despite the use of external legal or accounting advice having a substantially higher maximum cost of £250,000, compared to a maximum cost of £50,000 for external training or trainers.
Table 5.2 Estimated mean, median, minimum and maximum costs of external support services
| External support type | Base | Median cost | Mean cost | Min. cost | Max. cost |
|---|---|---|---|---|---|
| External training or trainers | 48 | £2,800 | £5,900 | £500 | £50,000 |
| External legal or accounting advice | 32* | £5,000 | £6,730 | £500 | £250,000 |
| Other external consultant | 31* | £10,000 | £42,610† | £500 | £1,000,000 |
| Total external support | 69 | £5,000 | £25,655 | £500 | £1,000,000 |
B7. Turning to external costs that your business incurred due to the most recent change in product safety standards or regulations / regarding product safety standards or regulations when first setting up your business, did your business incur costs for any of the following? Base: All incurring costs for external services, excluding don’t know / prefer not to say. *Figures should be treated with caution due to low base size. † Note this mean is impacted by a high outlier.
6.Capital / Material Costs of Regulatory Compliance
87. Capital and material costs typically result from the need to replace production inputs (such as materials) or outputs (such as existing stock) to meet regulatory requirements. Businesses may also incur costs related to investing in new equipment or technology. These investments may be necessary either to comply with regulations or to achieve efficiency gains required to remain commercially viable after a new regulation has come into place.
88. This chapter presents findings on self-reported costs related to one-off replacement of materials, loss of non-compliant stock and capital investments driven by changes to regulation. As previously noted, survey respondents often found it challenging to distinguish costs directly caused by regulation from their baseline operating expenses. In some cases, particularly for capital investments, businesses may amortise these costs over time, which can further complicate efforts to isolate the immediate financial impact of regulatory changes.
Summary of findings on one-off capital and material costs
-
Just over two-fifths (43%) of businesses that had experienced a change in regulations in the last 5 years reported compliance costs from investing in new equipment or production software to meet updated regulatory requirements. There was no significant difference by size.
-
The median upfront cost of investment was £4,000 and the median annual ongoing cost was £1,200.
-
Nearly a third (31%) faced additional costs from investing in new materials, most often to replace existing stock that no longer met compliance standards (71%). The cost of replacing non-compliant materials resulted in production cost increases, typically up to 10%, though 20% of businesses experienced rises of 25–50%, and one reported an increase exceeding 100%.
-
Just under a fifth (17%) experienced direct financial impact from loss of stock rendered non-compliant by regulatory changes, with a median cost of £10,000.
6.1 Types of costs incurred due to regulatory change
89. Businesses that had experienced a change in regulation in the last five years were asked if they had incurred any investment costs in order to comply with the new or updated regulations. [footnote 4] As shown in Figure 6.1 below, just over two-fifths (43%) of businesses that had experienced a change in regulation had invested in new equipment or software related to production, and just under a third (31%) had invested in new materials. A small proportion (1%) had invested in new product design or design changes. Two-fifths (40%) had not made any capital investments due to regulation change. There were no significant differences by size.
90. Reflecting the difficulty businesses experienced in splitting out costs of complying with regulation from general running costs, 16% of businesses mentioned investments not related to product safety or standards at this question.
Figure 6.1 Incidence of capital investments due to regulatory change in past 5 years
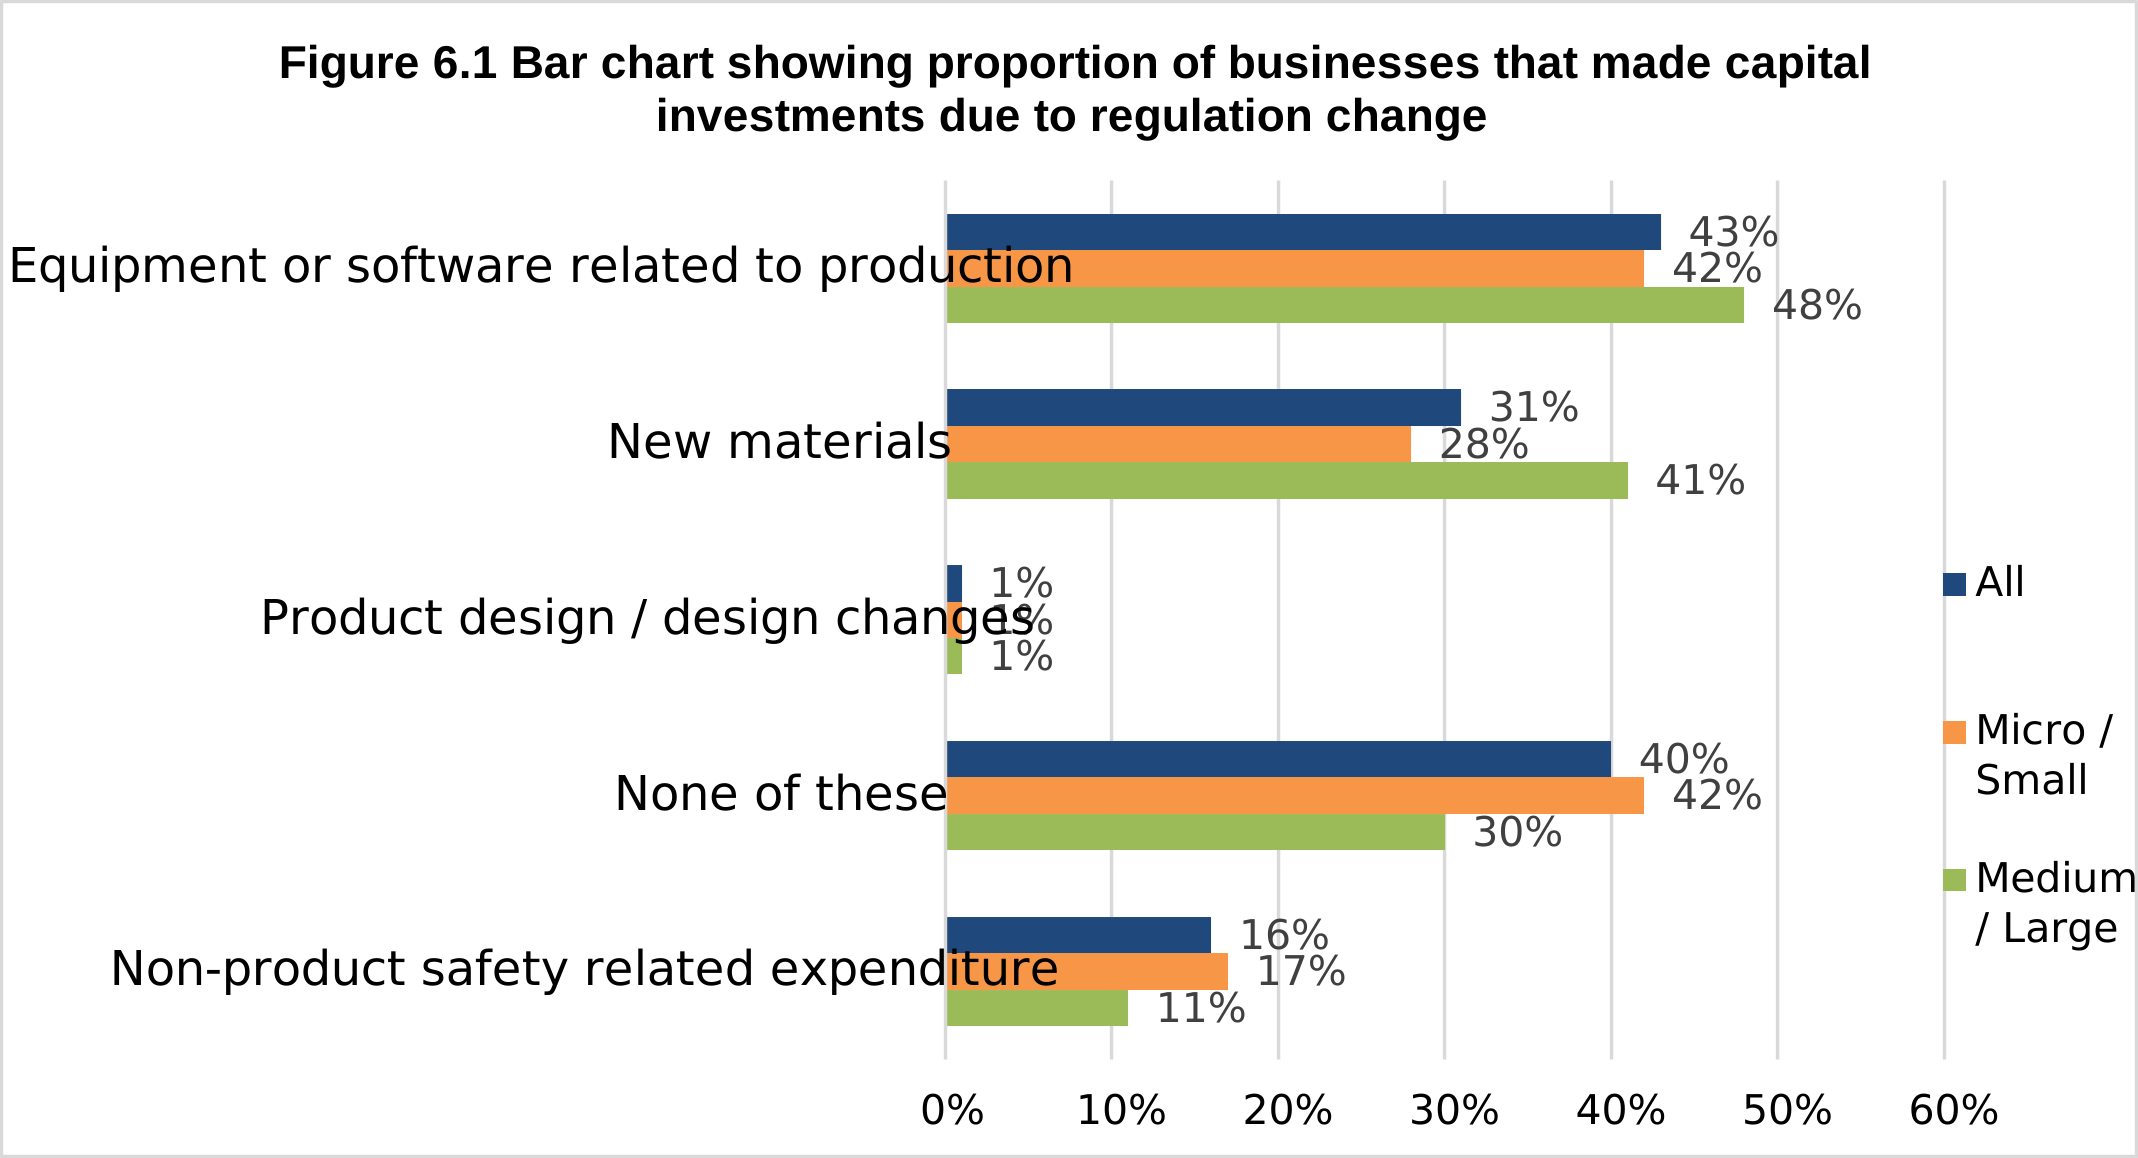
C2. In the past 5 years, which of the following expenditures has your business incurred to comply with new or changing product safety standards or regulations? Base: All businesses experiencing a change in regulations in last 5 years (124).
91. Just under a fifth (17%) of businesses that had experienced a change in regulations in the last 5 years also reported having incurred costs due to the loss of stock that was no longer compliant with regulations.
6.2 Costs of investments and lost stock
Cost increases associated with investment in new materials
92. Among businesses who had invested in new materials due to a change in regulations, the majority (71%) said this was to replace existing materials that were no longer compliant. Those businesses were asked to estimate the percentage increase in production costs caused by replacing the non-compliant materials. The reported increases are shown in Figure 6.2 below, however these figures should be treated with caution due to the low base size. More than half (54%) of businesses experienced an increase at or below 10%, although a fifth (20%) experienced more substantial increases of between 25% and 50%. One business reported an increase of over 100%, due to updated regulations in the Electrical Equipment (Safety) Regulations 2016.
Figure 6.2 Percentage increase in production costs (banded)
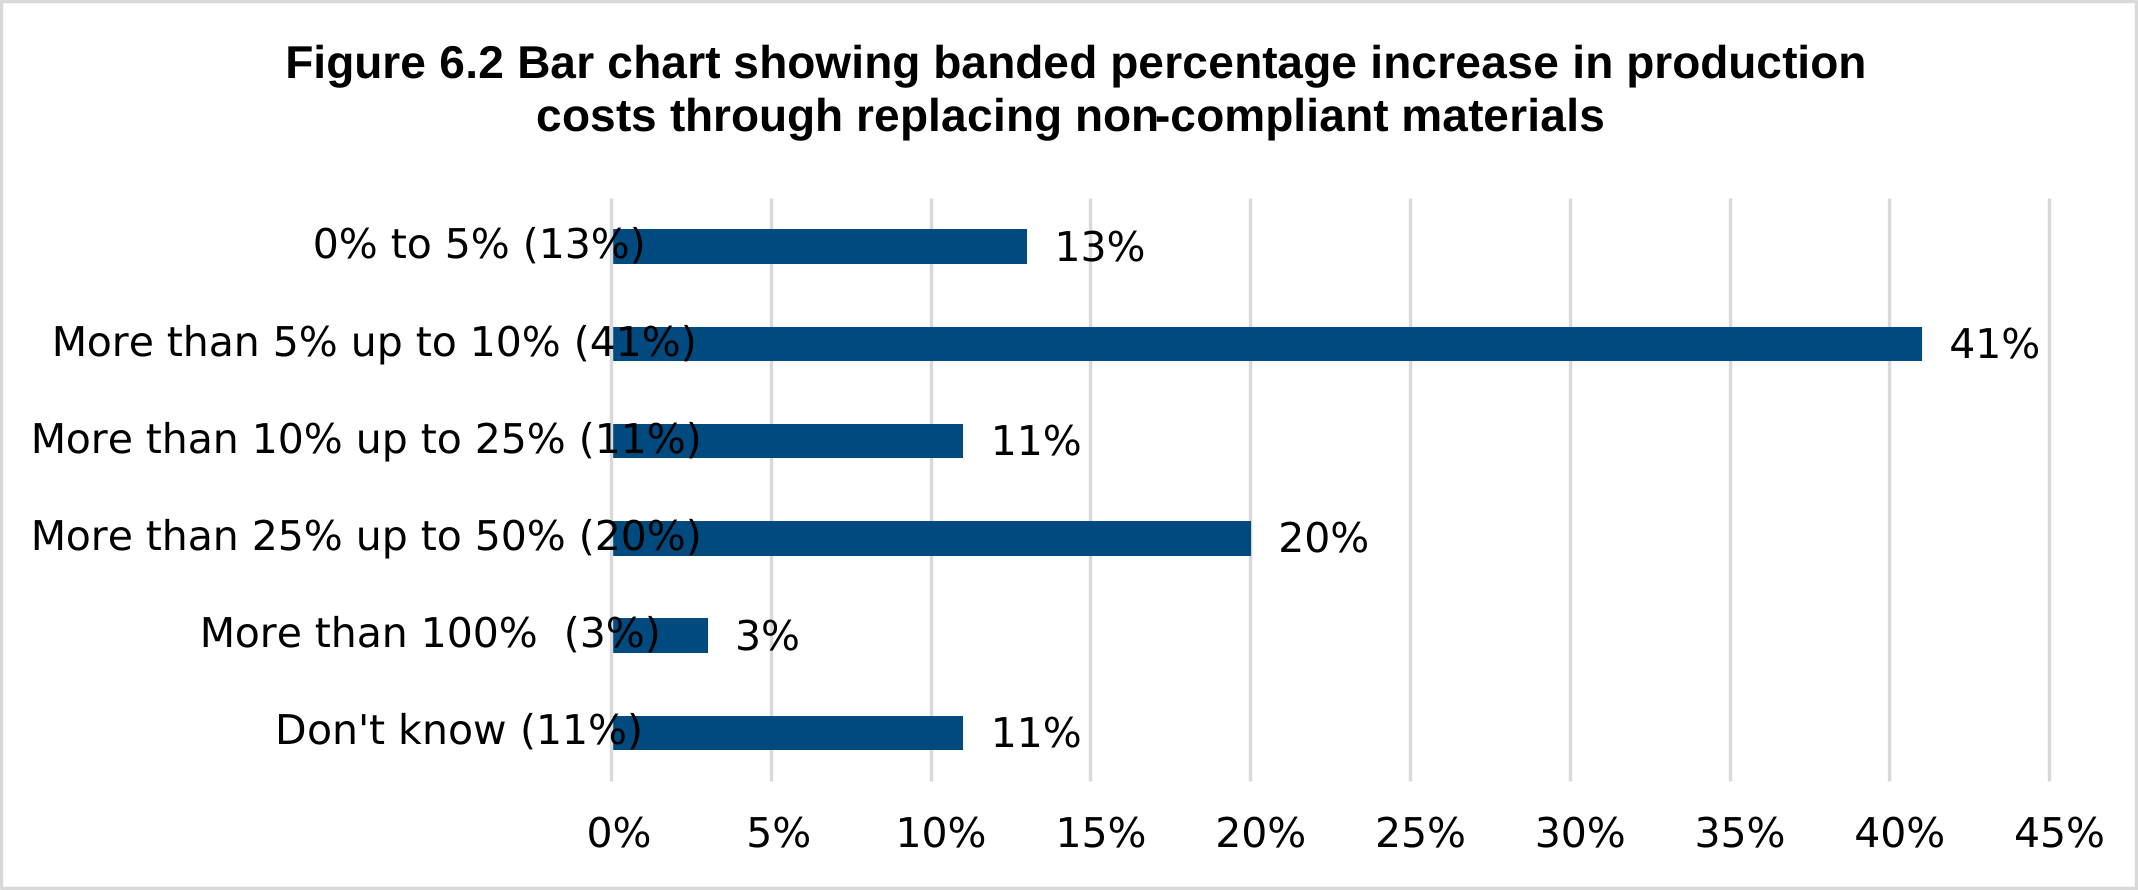
C4. What was the approximate percentage increase in your production costs as a result of the introduction of these new materials? Base: All investing in new materials to replace non-compliant ones (33).
Costs of investment in new equipment or software
93. Those who had invested in new equipment or software as a result of changing regulations were asked to give costs in terms of upfront capital expenditure and any annual ongoing costs (such as software licencing fees).
94. These costs were generally quite modest, with a median upfront capital cost of £4,000 and median annual ongoing cost of £1,200, as shown in Table 6.1 below. The mean costs were substantially higher, at £62,060 and £6,300 respectively, reflecting much higher levels of investment by a small number of businesses. Note the maximum upfront capital expenditure on new equipment or software due to regulation changes was £10,000,000, which is a clear outlier. The next highest cost was £500,000. Excluding the outlier, the mean total one-off cost was £27,280.
Table 6.1 Estimated upfront and ongoing costs of investment in new equipment or software due to changing regulations
| Cost of new equipment or software | Base* | Median cost | Mean cost | Min. cost | Max. cost |
|---|---|---|---|---|---|
| Upfront capital expenditure | 48 | £4,000 | £62,060† | £80 | £10,000,000 |
| Annual ongoing cost | 39 | £1,200 | £6,300 | £60 | £375,000 |
C7. You mentioned that as a result of changing or new product safety standards or regulations you have invested in new equipment or software related to production. What was the total cost in pounds (£) of this investment in terms of: upfront capital expenditure? / Ongoing cost of use over a 12-month period? Base: All incurring each type of cost. *Figures should be treated with caution due to low bases. † Note this mean is impacted by a high outlier.
Costs of replacing lost stock no longer compliant
95. Businesses which had to replace stock that was no longer compliant with regulations were asked the approximate value of this lost stock. Due to the low number of businesses incurring this cost (21) these figures should be treated with caution; however, the reported costs suggest these can be substantial, with a median cost of £10,000 and mean of £20,500. Once again, costs varied very considerably between individual businesses, ranging from just £400 up to £1,000,000.
Table 6.2 Estimated mean, median, minimum and maximum costs of lost stock
| Base* | Median cost | Mean cost | Min. cost | Max. cost | |
|---|---|---|---|---|---|
| Cost of lost stock | 21 | £10,000 | £20,250† | £400 | £1,000,000 |
C6. Approximately what was the cost of the stock that was lost? Base: All who had incurred costs for lost stock due to non-compliance with changed regulations (21). *Figures should be treated with caution due to low base. † Note this mean is impacted by a high outlier.
7. Overall One-Off Regulatory Cost Burden
96. This chapter summarises the overall one-off costs that manufacturers reported facing as a result of complying with new or changing regulations.
97. Chapters 5 and 6 have presented average costs specifically for businesses that were new or had been impacted by a change of regulation and incurred any compliance expenses. The findings presented in this chapter are based on all businesses that were new or that had been impacted by a change in regulation within the past 5 years. This includes those businesses that reported no costs as a result of these changes.
98. This chapter first covers overall one-off labour costs, external costs and other costs that the businesses faced as a result of new or changing regulations before aggregating these into overall summary one-off costs.
99. For further detail regarding the caveats and assumptions underlying these estimates, please refer to the Technical Appendix.
Summary of findings on overall regulatory cost burden
-
Among businesses affected by new or changing regulations, nine in ten (90%) incurred one-off compliance costs.
-
The median one-off cost (including those who faced no one-off costs), was £10,430, but costs varied widely by business size and type.
-
One-off labour costs were moderate for most, with a median of £5,730. External one-off costs were often zero for micro and small businesses, reflecting limited use of outside services.
-
Medium and large businesses were more likely to incur substantial “other” one-off costs, such as lost stock or investment in new materials.
100. As covered in Chapter 5, and 6, new businesses (those started within the two years prior to completing the survey) or businesses that had experienced a change of regulation within the past five years were asked about the one-off costs associated with complying with these new or changing regulations.
101. Most (80%) businesses did not experience regulatory changes in the past five years and were excluded from the summary one-off cost calculations. A further 13% were unsure if they’d faced any changes and were also excluded from these calculations. The figures presented here cover businesses that were either new (operating for less than two years) or had experienced a regulatory change, even if they reported zero cost.
7.1 One-off labour costs
102 Total one-off labour costs were calculated by summing together the labour costs of learning about new or changing regulations, ensuring products and services complied with regulations and administrative tasks related to monitoring or complying with product safety regulations. More detail on businesses that faced these costs can be found in Chapter 5.
103. As shown in Table 7.1, the median one-off labour cost associated with complying with new or changing regulations was £5,730, while the mean was £21,030.
104. The median labour cost among micro and small businesses (£3,310) was around half the median cost to medium and large businesses (£6,120). The mean cost to micro and small businesses was £18,780, while the mean for medium and large businesses was £33,300.
Table 7.1 Estimated total one-off labour costs
| Business size | Base* | Median cost | Mean cost | Max. cost |
|---|---|---|---|---|
| Micro and small | 68 | £3,310 | £18,780 | £286,690 |
| Medium and large | 50 | £6,120 | £33,300 | £546,820 |
| All businesses | 118 | £5,730 | £21,030 | £546,820 |
Derived from B3; B5; B6. Total estimated one-off labour costs. Base: All businesses that were new or had experienced a change in regulation. Businesses that faced one-off costs but were unsure what the costs were are excluded from the base.
7.2 One-off external costs
105. Total one-off external costs were calculated by summing together the cost of external services used, namely: legal or accounting services; external training or trainers; and other costs related to ensuring products complied with regulations. More detail on the individual costs of these areas can be found in Chapter 5.
106. Table 7.2 presents the average estimated external costs businesses faced to ensure they complied with new or changing regulations. The median cost of external services was £5,730, while the mean was £13,080.
107. For micro and small businesses, the median cost of external services was zero reflecting that many of these organisations did not use any external services due to new or changing regulations. The median cost to medium and large businesses was £2,000. Mean costs were £12,440 for micro and small businesses and £16,720 for medium and large businesses.
Table 7.2 Estimated total one-off external costs
| Business size | Base* | Median cost | Mean cost | Max. cost |
|---|---|---|---|---|
| Micro and small | 54 | £0 | £12,440 | £1,000,000 |
| Medium and large | 69 | £2,000 | £16,720 | £319,000 |
| All businesses | 123 | £5,730 | £13,080 | £1,000,000 |
Derived from B8; B10; B13. Total estimated one-off costs. Base: All businesses that were new or had experienced a change in regulation. Businesses that faced one-off costs but were unsure what the costs were are excluded from the base.
7.3 Additional one-off costs
108. Some businesses faced additional one-off costs associated with new or changing regulations, these included:
- Cost of lost non-compliant stock; and
- Investment in new materials required to ensure products meet new or changing regulations.
109. Table 7.3 presents these costs as an average among all businesses that were new or had experienced a change in regulation. One in five (21%) of these businesses had faced an additional one-off cost, including 19% of micro and small businesses and 86% of medium and large businesses. The median cost was £0 for all businesses, but for medium and large businesses this rose to £3,000.
110. The overall means were much higher, at £25,320 for all businesses, £5,690 for small businesses and £142,580 for medium and large sized businesses, reflecting high levels of investment by a small number of businesses.
Table 7.3 Estimated additional one-off costs
| Business size | Base* | Median cost | Mean cost | Max. cost |
|---|---|---|---|---|
| Micro and small | 53 | £0 | £5,690 | £360,000 |
| Medium and large | 67 | £3,000 | £142,580 | £10,000,000 |
| All businesses | 120 | 0 | £25,330 | £10,000,000 |
7.4 Total one-off costs summary
111. The total one-off cost associated with new or changing regulations was calculated by combining all costs previously presented in this chapter. Namely, overall labour costs, external costs and any other costs that businesses faced as a result of new or changing regulations.
112. Among businesses that were less than two years old or had been affected by a regulatory change, nine in ten (90%) incurred one-off compliance costs. As shown in Table 7.4, the median cost was £10,430, but costs varied widely by size: micro and small businesses faced a median of £10,360, while medium and large businesses had a median of £30,080. Mean costs were much higher: £37,200 for micro/small and £182,850 for medium/large firms. This is due to a small number of businesses with extremely high expenditures (up to £10.14 million).
Table 7.4 Total estimated one-off costs
| Business size | Base* | Median cost | Mean cost | Max. cost |
|---|---|---|---|---|
| Micro and small | 53 | £10,360 | £37,200 | £1,140,740 |
| Medium and large | 70 | £30,080 | £182,850† | £10,136,030 |
| All businesses | 123 | £10,430 | £47,130† | £10,136,030 |
Derived from B3; B5; B6; B8; B10; B13; C6; C7_1. Total estimated one-off costs. Base: All businesses that were new or had experienced a change in regulation. Businesses that faced one-off costs but were unsure what the costs were are excluded from the base. † Note this mean is impacted by a high outlier.
113. The maximum estimate total one-off cost was £10,136,030, which is a clear outlier. The next highest cost was £1,171,610. Excluding the outlier, the mean total one-off cost was £47,130.
8.Ongoing costs of compliance
114. This chapter presents the labour and external costs that businesses incurred in the previous 12 months to maintain compliance with product safety standards and regulations on a day-to-day basis.
Summary of findings on ongoing costs of compliance
-
Just over a quarter (25%) of businesses reported staff spending time on ongoing compliance activities in the past 12 months, rising to 60% among large businesses.
-
Monitoring products to ensure regulatory conformity accounted for the greatest share of staff time, with a median of 50 hours annually per business.
-
Medium and large businesses devoted considerably more staff time to compliance, with a median of 460 hours in the last year, compared to 94–100 hours for micro and small businesses.
-
The median annual labour cost for day-to-day compliance was £2,940 per business but rose to £12,510 for medium and large businesses.
-
Use of external support services for ongoing compliance were less common than in relation to one-off regulation changes, with four-fifths (80%) not using any external compliance services in the last 12 months. Median spend on external services was £2,500, although the mean was £6,270, indicating that some businesses incurred substantially higher costs.
-
A third (33%) of businesses that used ‘other external support’ said they had used product safety testing (3% of all businesses).
-
Most (70%) businesses that invested in RegTech reported increased efficiency in compliance as a result.
-
Fewer than 0.5% of businesses reported costs due to fines or product recalls in the last 12 months.
-
Compliance costs as a proportion of turnover decrease as turnover level increases. The median annual cost of compliance for businesses with a turnover between £100,000 and £500,000 was 0.8% of their estimated turnover, while the median annual cost of compliance for businesses with a turnover between £2 million and £10 million was just 0.1% of the mid-point of this band.
8.1 Time spent on ongoing compliance-related activities
115. Businesses were asked if staff at any level had spent time on day-to-day compliance-related activities in the last 12 months (in addition to time spent related to the most recent change in regulations, if applicable). Overall, just over a quarter (25%) said staff had spent any time on compliance-related activities. The likelihood of this increased with size, from 25% of micro businesses to 43% of medium and large businesses, as shown in Figure 8.1.
Figure 8.1 Proportion of businesses spending staff time on compliance over last 12 months.

D1. Have you or your staff spent any time on day-to-day compliance with product safety standards or regulations in the last 12 months, that has not been covered in your previous responses? / D2: In the past 12 months, was the day-to-day work of staff at any of the following levels impacted by tasks related to product safety and standards or regulations? Base: All businesses (604); Micro (236); Small (158); Medium / Large (211).
116. It was more common for businesses to report staff had spent time on day-to-day compliance activities in the last 12 months in the computer, electronic and optical products sector (48%) and the basic or fabricated metal products sector (34%). Those with a dedicated compliance team were also more likely to have spent time (35%) compared to those who did not (24%).
117 Businesses that said that staff at any level had spent at least some time on day-to-day compliance tasks were asked about the amount of staff time spent on:
- In house training related to compliance with OPSS regulations
- Time spent keeping up to date with regulations
- Time spent monitoring products to ensure that they complied with regulations.
Staff time related to regulatory change or set-up
118. Figure 8.2 illustrates that, for businesses where staff dedicated time to compliance tasks over the past 12 months, the activity that required the most time was monitoring products to ensure they met regulatory standards. On average, staff spent a median of 50 hours on this task, which is equivalent to slightly more than six typical working days.
119. The median time allocated to both in-house training for compliance with OPSS regulations and to keeping abreast of regulatory updates was 24 hours each, which corresponds to approximately three working days.
120. There was very little difference in the median amount of time spent on complying with regulations in the last 12 months between micro businesses and small businesses. The total median number of hours spent on day-to-day compliance activities among micro businesses was 94 hours while the total for small businesses was 100 hours. This rose substantially for medium and large sized businesses with the median amount of labour time spent on complying with regulations being 460 hours in the last 12 months, the equivalent of around 60 working days.
Figure 8.2 Median hours spent by staff on ongoing compliance activities in last 12 months
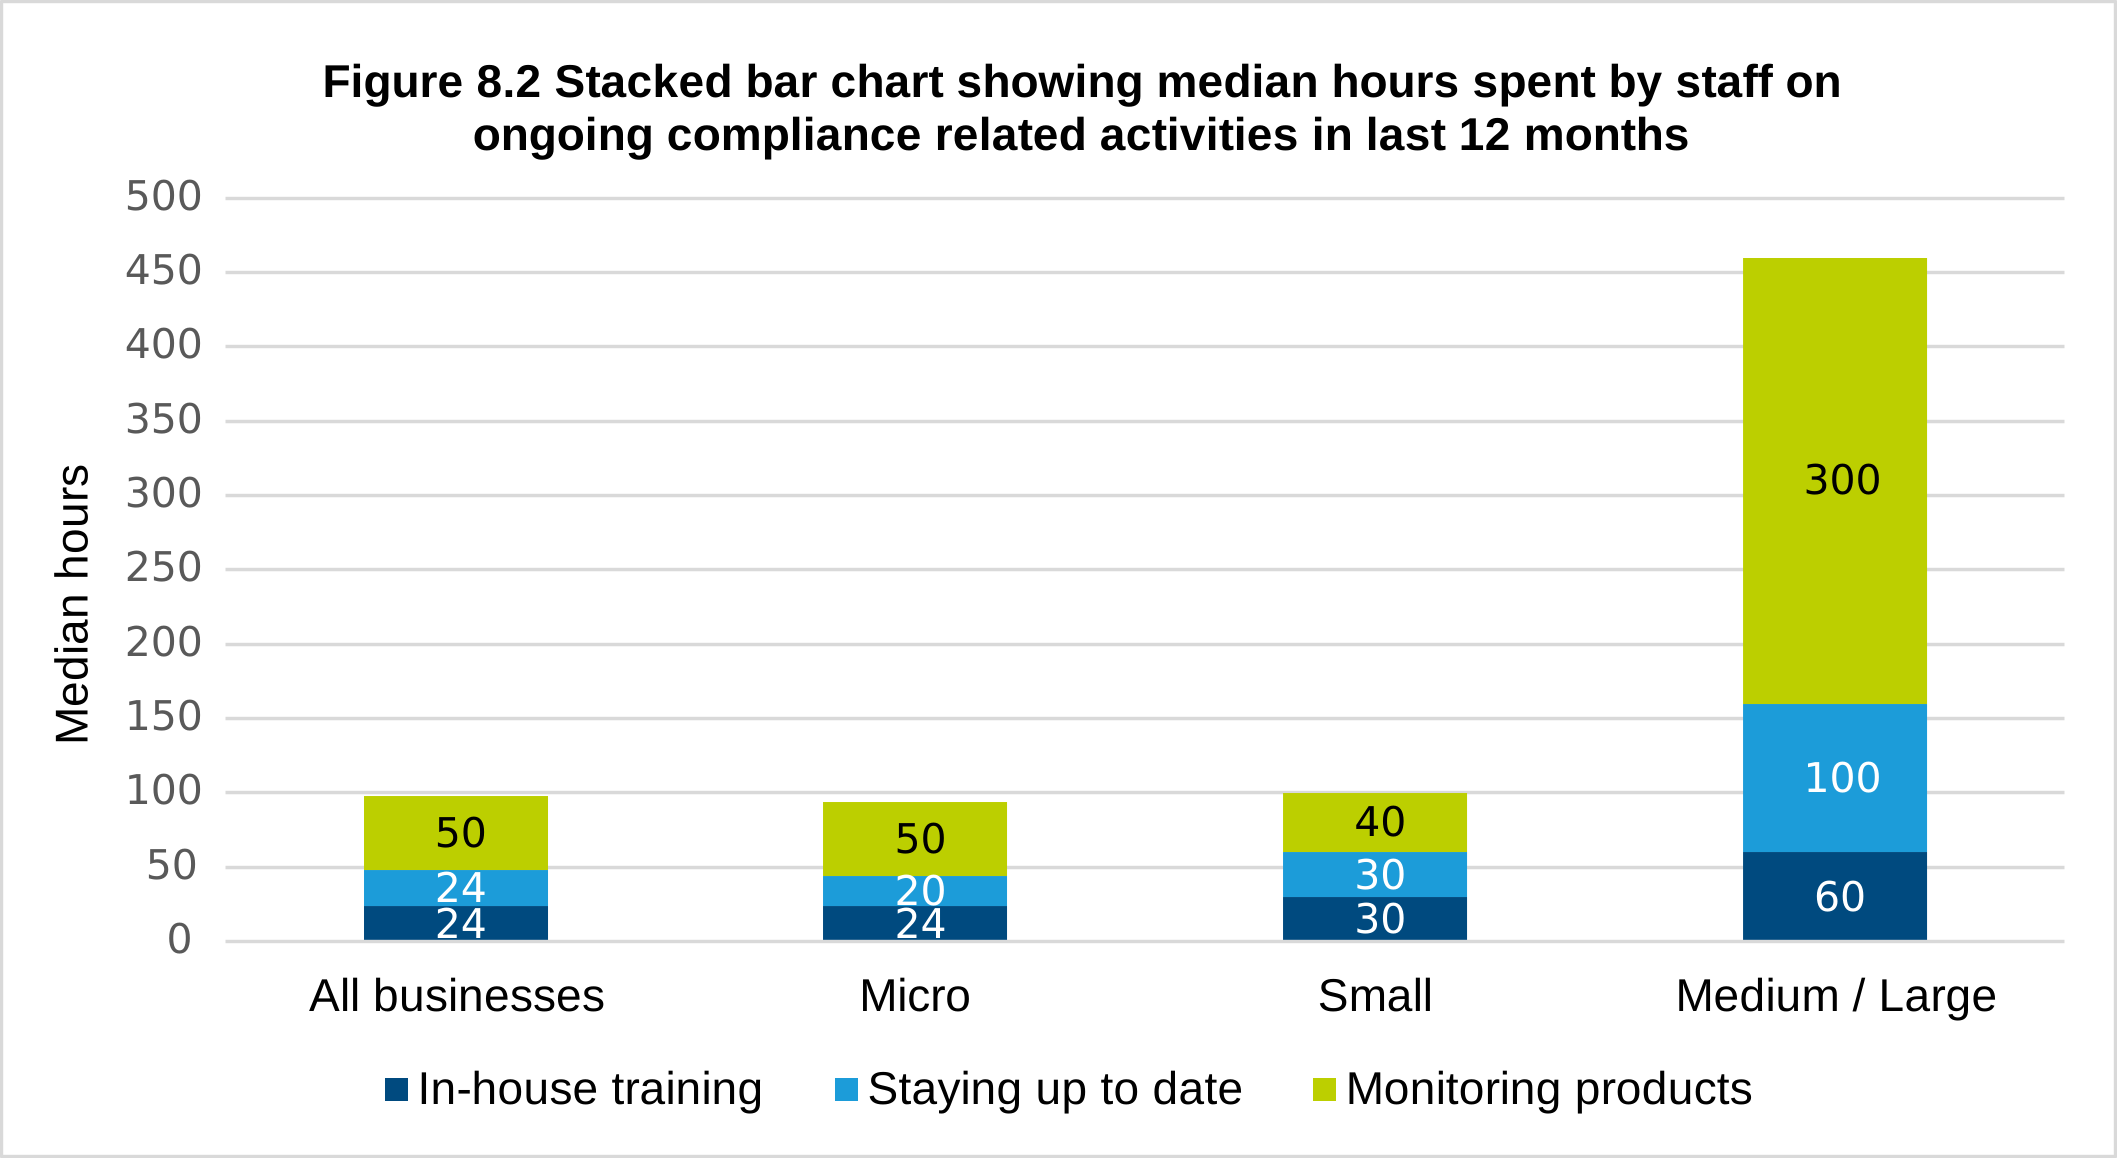
D3/D4/D5. In the past 12 months what is the total number of hours employees have spent [developing and delivering in-house training to ensure that staff understand and comply with product safety standards or regulations? / staying up to date with product safety standards or regulations and ensuring they understand these regulations? / directly monitoring and ensuring that products and services conform to product safety regulatory standards?] Base: All reporting any staff time spent on ongoing compliance (200); Micro (60), Small (49), Medium/Large (91).
121. Across all size bands, most time was spent on monitoring products to ensure they comply with safety standards; this was particularly pronounced among medium and large businesses, where it made up nearly two-thirds (65%) of the median hours spent by staff on day-to-day compliance activities. This is likely due to larger businesses having more products that required monitoring.
8.2 Costs of staff time spent on day-today compliance activities
122. In this section we will examine the associated labour costs incurred by businesses as a result of the time spent on each compliance activity in the last 12 months.
123. As shown in Table 8.1, monitoring and ensuring products conform to regulatory standards had the highest median cost (£1,360), in line with the fact that businesses reported staff spending the most time on this activity. The costs for large businesses on monitoring compliance were particularly high, with a median of £6,150 and a mean of £363,420, reflecting some extremely high costs reported by a small number of larger businesses.
124. Median costs for staying up to date with regulations and in-house compliance training were similar, at £810 and £780 respectively. Again, costs were considerably higher for medium and large businesses, particularly relating to staying up to date with regulations, where their median cost of £3,110 was more than four times the median for micro and small businesses (£750); again, this reflects the higher average hours spent by medium and large businesses on this activity.
125. The total median cost for staff time spent on day-to-day compliance in the last 12 months was £2,940, although medium and large businesses incurred a considerably higher median cost of £12,510.
Table 8.1 Estimated average labour costs from day-to-day compliance activities
| Activity | Base Median Mean | All | Micro / Small* | Medium / Large |
|---|---|---|---|---|
| In house compliance training | Base | 168 | 90 | 78 |
| In house compliance training | Median | £780 | £780 | £1,980 |
| In house compliance training | Mean | £1,820 | £1,550 | £6,560 |
| Costs of staying up to date with regulations | Base | 174 | 93 | 81 |
| Costs of staying up to date with regulations | Median | £810 | £750 | £3,110 |
| Costs of staying up to date with regulations | Mean | £1,920 | £1,680 | £6,310 |
| Cost of monitoring and ensuring products conform to regulatory standards | Base | 174 | 95 | 79 |
| Cost of monitoring and ensuring products conform to regulatory standards | Median | £1,360 | £1,360 | £6,150 |
| Cost of monitoring and ensuring products conform to regulatory standards | Mean | £21,410 | £3,870 | £363,420 |
| Total labour costs relating to day-to-day compliance activities | Base | 187 | 102 | 85 |
| Total labour costs relating to day-to-day compliance activities | Median | £2,940 | £2,580 | £12,510 |
| Total labour costs relating to day-to-day compliance activities | Mean | £9,220 | £6,320 | £64,940 |
Base: All businesses incurring each cost
126. Table 8.2 shows that businesses with a dedicated internal compliance team reported higher average (mean) total staff costs for routine compliance activities, at £18,330, compared to £6,630 for those without such a team. However, the median cost was actually lower for businesses with an in-house compliance team (£2,580) than for those without (£2,940). This difference is because a small number of businesses with in-house teams experienced exceptionally high costs, which substantially increased the mean, even though most businesses incurred much lower expenses. This could be due to the size of their internal compliance teams, or higher salary levels for these roles.
Table 8.2 Estimated average labour costs from day-to-day compliance activities
| Activity | All | With in house compliance team | Without in house compliance team | |
|---|---|---|---|---|
| Total labour costs relating to day-to-day compliance activities | Base | 187 | 85 | 101 |
| Total labour costs relating to day-to-day compliance activities | Median | £2,940 | £2,580 | £2,940 |
| Total labour costs relating to day-to-day compliance activities | Mean | £9,220 | £18,330 | £6,630 |
Base: All businesses incurring each cost
8.3 External ongoing costs related to maintaining compliance with regulations
127. Businesses were asked if they had hired or retained any of the following external support services over the last 12 months, to help ensure ongoing compliance with product safety standards or regulations:
- External legal or accounting advice;
- External training or trainers to help ensure compliance; or
- Any other kind of external consultants.
128. Businesses that had used any of these services in relation to a change in regulations or as part of their initial setup, covered in the previous section, were asked only to include any services used in addition to that.
Use of external support services
129. Use of external support services was considerably less common to help ensure ongoing compliance than to support businesses with a change in regulations. As shown in Figure 8.3 below, the most common service used in the last 12 months to support ongoing compliance was external training or trainers, used by around one in nine (11%) of businesses, followed by external legal or accounting advice (10%) and any other external consultants (8%). Other consultants used were primarily services related directly to product quality or safety standards testing, but also included additional legal, training and administration services. Four-fifths (80%) of businesses had not used any external services in the last 12 months to help ensure ongoing compliance.
Figure 8.3 Proportion of businesses that retained or hired external training, advice or consultancy services in last 12 months
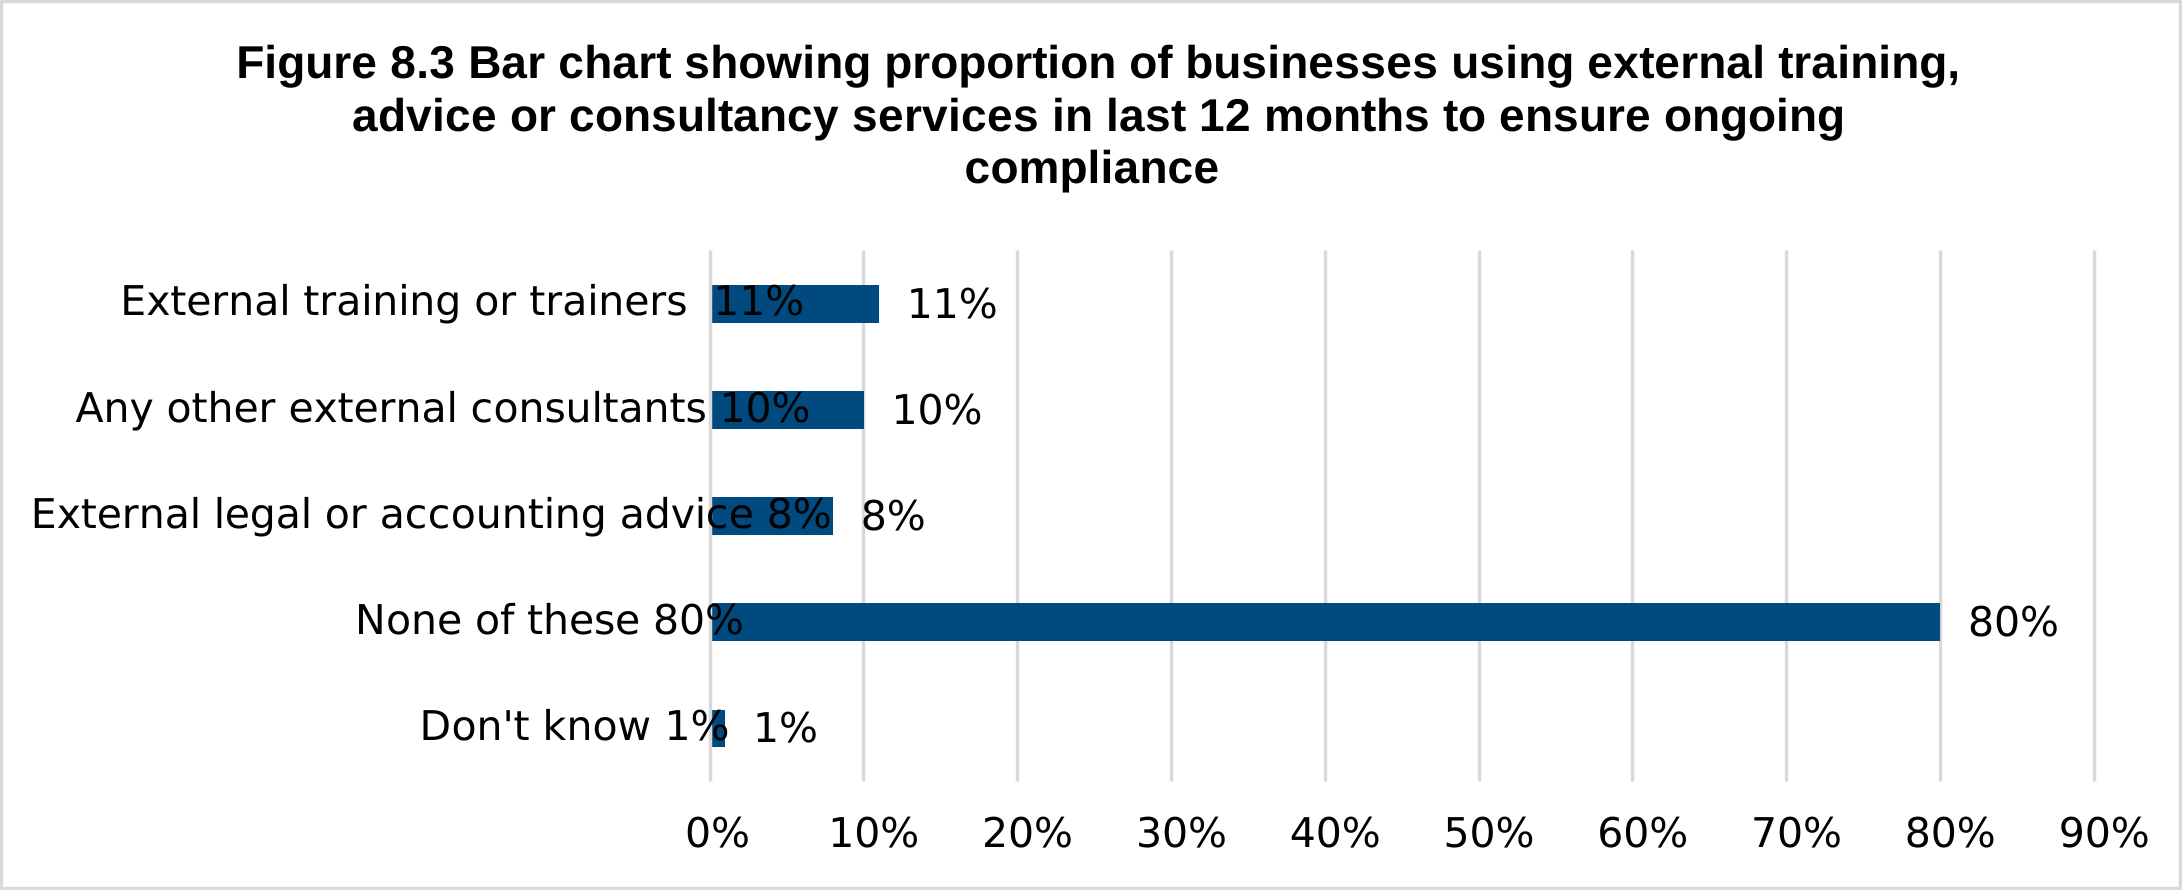
E2. Over the last 12 months, has your business hired or retained any of the following external services to help ensure ongoing compliance with product safety standards or regulations? Base: All businesses (604).
130 Medium and Large sized businesses were more likely than micro and small businesses to have used all three external services:
- External training or trainers (25% vs 10%);
- Other external consultants (18% vs 9%); and
- External legal or accounting advice (16% vs 7% respectively).
131. By sector, those in other manufacturing were more likely than average to have used external legal or accounting advisors (14%), and manufacturers of machinery and equipment were more likely than average to have hired external training or trainers (18%). Manufacturers of computers, electronics and optical products were more likely than average to have hired other external consultants (21%).
132. Businesses that did not have an internal compliance team were more likely to not have used any external support services in the last 12 months (82%) than those that did have such a team (70%), potentially reflecting compliance being of lower importance in those businesses, or fewer resources being available for compliance generally. Businesses that had not invested in RegTech were also more likely not to have used any external services in the last 12 months (81%) compared to those who had invested in RegTech (64%); again, this could reflect differences in priority levels around compliance within these groups of firms or could reflect support engaged to support the RegTech implementation and deployment itself.
Costs of external support services
133. As shown in Table 8.3, there was a clear distinction in the costs businesses faced when engaging different types of external support services for compliance. External legal and accounting advice stood out with the highest median cost of £3,000 and a mean cost of £4,740, indicating that although most businesses paid around £3,000, some paid considerably more (up to £87,500), raising the mean. In comparison, external training or trainers were generally less expensive, with the lowest mean cost (£3,730) and a median of £2,000, suggesting costs were more consistent across businesses.
134. The greatest variability was seen in the ‘other external support’ category’, which included a wide array of services. A third (33%) of businesses that used ‘other external support’ services said this service was related to product testing, amounting to 3% of all businesses.
135 The ‘other external support’ category had the highest mean cost (£6,130), but its the joint lowest median cost (£2,000), highlighting that while most businesses paid relatively moderate amounts, a few incurred considerably higher expenses, with a maximum expenditure of £200,000. This spread in costs likely reflects the diverse nature of services included under ‘other external support’.
Table 8.3 Estimated costs for external support services in the last 12 months
| External support type | Base | Median cost | Mean cost | Min. cost | Max. cost |
|---|---|---|---|---|---|
| External legal or accounting advice | 55 | £3,000 | £4,740 | £300 | £87,500 |
| External training or trainers | 84 | £2,000 | £3,730 | £150 | £62,500 |
| Other external support | 50 | £2,000 | £6,130 | £195 | £200,000 |
| Total external support | 128 | £2,500 | £6,270 | £195 | £307,500 |
E3 / E5 / E8: Over the last 12-month period, how much did this legal advice / the external training or trainers / these consulting services cost? Base: All incurring costs for external services in the last 12 months.
8.4 Costs of RegTech investments
136. As noted in Chapter 4, only 5% of businesses had invested in RegTech. Table 8.4 below shows the median and mean costs of these businesses, both in terms of upfront expenditure and annual ongoing costs. The median upfront expenditure on RegTech was £2,000 and the mean was £5,870. The median 12-month ongoing cost of RegTech was £1,000 and the mean was £3,990. These figures include some businesses that reported no ongoing 12-month cost. Among those that faced annual costs the median was £1,200 and the mean was £6,380.
Table 8.4 RegTech Costs
| Base | Median | Mean | Min cost | Max cost | |
|---|---|---|---|---|---|
| Upfront expenditure | 61 | £2,000 | £5,870 | £0 | £500,000 |
| Ongoing 12-month cost | 61 | £1,000 | £3,990 | £0 | £100,000 |
H6. What have been the costs of this investment in terms of upfront capital expenditure / ongoing costs over the last 12-month period? Base: all investing in RegTech, excluding don’t know / prefer not to say.
137. Seven in ten (70%) businesses that had invested in RegTech felt that it had made their regulatory compliance more efficient, while around a quarter (26%) said that it had not.
138. Among those who reported an annual cost of RegTech and said that RegTech had made their regulatory compliance more efficient, the estimated cost saving in terms of staff hours saved in the past 12 months was a median of £1,480 and a mean of £6,160, as shown in Table 8.5 below. There was a considerable range in the level of savings among individual businesses, ranging from just £50 to one business with an estimated staff costs saving of over £350,000 in the last 12 months. The business with the highest costs is a clear outlier, and with that figure removed the estimated mean annual saving falls to £3,610.
Table 8.5 Financial saving as a result of RegTech in previous 12 months
| Base | Median saving | Mean saving | Min. saving | Max. saving | |
|---|---|---|---|---|---|
| Estimated saving over previous 12 months | 32* | £1,480 | £6,160† | £50 | £364,050 |
H8. What is the total amount number of hours you estimate that staff at different levels have been able to save in the past 12 months as a result of this technology compared with before this was introduced? Base: all reporting reduced staff time over last 12 months due to investment in RegTech, *Figures should be treated with caution due to low base. † Note this mean is impacted by a high outlier.
139. Comparing the estimated annual cost and annual savings for individual businesses able to report both figures shows that the annual cost of RegTech was offset by the efficiencies it brought in. Just over a third (35%) of businesses reported time savings worth more than their annual RegTech cost, and a further quarter (24%) reported time savings equal to the cost. However, two-fifths (40%) of businesses reported an annual RegTech cost that was higher than their estimated savings through reduced staff time, although it is possible that RegTech may have brought other benefits. Note as only 32 businesses were able to report both RegTech costs and staff time savings these figures should all be treated with caution.
8.5 Costs of Non-compliance (Penalties, Fines and Recalls)
140. Instances of fines arising from non-compliance were very rare across the business population. Only two businesses (unweighted) reported fines within the past 12 months, equating to just 0.04% of the business population in the weighted data.
141. Similarly, there were very few instances of businesses being required to conduct a product recall as a result of being non-compliant with product safety standards and regulations. Only four businesses (unweighted) had experienced this within the last 12 months, equivalent to 0.2% of the population in the weighted data. Reasons reported for these recalls included unsuitable materials being used, a construction test failure, and inadequate packaging quality.
8.6 Total annual ongoing costs of businesses
142. While the majority of businesses did not incur ongoing costs, however for those that did, faced a wide range of total ongoing costs. Among the businesses that incurred ongoing compliance costs, the median annual cost of complying with OPSS regulations was £3,020 and the mean was £10,280. For micro and small businesses, the median annual cost was £3,000 and the mean was £7,450. In contrast, medium and large businesses that faced ongoing costs reported substantially higher figures, with a median of £15,580 and a mean of £71,930. More detail on the overall annual burden of compliance among all businesses, regardless of whether they faced costs, is shown in Chapter 9.
Table 8.6: Annual cost of compliance among businesses that reported any cost
| Activity | Base Median Mean | All | Micro / Small* | Medium / Large |
|---|---|---|---|---|
| Annual cost of compliance among businesses that reported any cost | Base | 168 | 90 | 78 |
| Annual cost of compliance among businesses that reported any cost | Median | £780 | £780 | £1,980 |
| Annual cost of compliance among businesses that reported any cost | Mean | £1,820 | £1,550 | £6,560 |
Derived from D3; D4; D5; E3; E5; E8; G3; G5; H6; H8. Estimated total annual cost. Base: Businesses that faced annual costs.
8.7 Total annual costs as a proportion of estimated turnover
143. As might be expected, businesses with a larger turnover often faced higher absolute costs in order to ensure they complied with OPSS regulations. Table 9.7 shows that businesses with a turnover between £100,000 and £500,000 had a median annual compliance cost of £2,360, whereas those with the highest turnover (over £10 million) had a median cost of £22,530. The picture is similar when taking the mean costs, businesses with a turnover between £100,000 and £500,000 had a mean annual compliance cost of £6,100, whereas the mean for businesses with a turnover of over £10 million was more than 10 times greater at £90,410.
144. To provide an indicative sense of annual compliance costs relative to each business’s turnover, Table 8.7 also shows these mean and median costs as a proportion of the mid-point of each turnover band. [footnote 5] This suggests that compliance costs as a proportion of turnover decrease as turnover level increases. The median annual cost of compliance for businesses with a turnover between £100,000 and £500,000 was 0.8% of that turnover band’s midpoint, while the mean annual cost of compliance for this group was 2% of the turnover band midpoint.
145. However, for businesses with a turnover between £2 million and £10 million the median annual cost of compliance was just 0.1% of the mid-point of this band, and the mean was 0.3% of this figure.
146. This suggests that costs of compliance represent a proportionally greater burden for smaller companies, as they have fewer financial and operational resources to absorb them.
Table 8.7 Total estimated annual costs complying with OPSS regulations as a proportion of annual turnover
| Blank space | Base | Median | Median as proportion of turnover | Mean | Mean as proportion of turnover |
|---|---|---|---|---|---|
| £100,000-£500,000 | 38* | £2,360 | 0.8% | £6,100 | 2% |
| Over £500,000 up to £2 million | 69 | £3,780 | 0.3% | £8,270 | 0.7% |
| Over £2 million up to £10 million | 61 | £8,350 | 0.1% | £17,300 | 0.3% |
| Over £10 million | 64 | £22,530 | N/A | £90,410 | N/A |
Derived from D3; D4; D5; E3; E5; E8; G3; G5; H6; H8. Estimated total annual cost. Base: All businesses with turnover of £100,000 or more, except those that faced annual costs but were unsure what the costs were.
*Figures should be treated with caution due to low base. Businesses with a turnover of less than £100,000 are not shown due to the small base size.
147. Further demonstration of the proportional relative cost of compliance is shown in Table 8.8. Here average annual costs as a proportion of turnover have been calculated using the lower and upper limit of the turnover bands. As can be seen the median proportional cost for those with a turnover of £100,000-£500,000 ranged from 2.4%-0.5% and the mean ranged from 6.1%-1.2%. For businesses with a turnover of £500,000-£2 million, the median proportional cost ranged from 0.4% to less than 0.1% and the mean ranged from 0.9%-0.2%.
Table 8.8 Total estimated annual costs complying with OPSS regulations as a proportion of annual turnover using upper and lower turnover bands
| Blank space | Base | Median proportion of lower turnover band limit | Median proportion of upper turnover band limit | Mean proportion of lower turnover band limit | Mean proportion of upper turnover band limit |
|---|---|---|---|---|---|
| £100,000-£500,000 | 38* | 2.4% | 0.5% | 6.1% | 1.2% |
| Over £500,000 up to £2 million | 69 | 0.8% | 0.2% | 1.7% | 0.4% |
| Over £2 million up to £10 million | 61 | 0.4% | <0.1% | 0.9% | 0.2% |
Derived from D3; D4; D5; E3; E5; E8; G3; G5; H6; H8. Estimated total annual cost. Base: All businesses with turnover of £100,000 or more, except those that faced annual costs but were unsure what the costs were. *Figures should be treated with caution due to low base. Businesses with a turnover of less than £100,000 are not shown due to the small base size.
9. Overall Annual Ongoing Regulatory Cost Burden
148. This chapter summarises the overall day-to-day, ongoing costs that manufacturers reported facing as a result of complying with regulations in the last 12 months.
149. Chapter 8 presented average costs based on businesses that incurred any day-to-day compliance expenses in the last 12 months. The findings presented in this chapter are based on all businesses, including those who incurred no costs, providing best estimates for the average annual cost of compliance among all manufacturers within the population. [footnote 6]
150. Reflecting the fact that many businesses did not incur any day-to-day compliance costs many of the median (which is calculated by taking the middle data point) costs presented within this chapter are £0.
151. The chapter starts by summarising the annual labour cost of compliance, followed by the annual cost of external services and finally combines these costs to provide the overall annual cost of compliance.
152. For further detail regarding the caveats and assumptions underlying these estimates, please refer to the Technical Appendix.
Summary of findings on overall annual ongoing regulatory cost burden
-
Ongoing annual compliance costs were reported by around one in three businesses (35%), rising to 50% among medium and large firms.
-
The median annual compliance cost was £0 for most businesses, but medium and large firms faced a median annual cost of £990 and a mean of £28,560.
-
Only a minority of businesses used external services for ongoing compliance, with a median annual external cost of £0 and a mean of £1,050.
-
Two sectors - manufacturers of computers, electronics and optical products, and chemicals - reported median annual compliance costs greater than zero.
9.1 Annual ongoing labour costs
153. The estimated annual labour costs were calculated by summing the related labour costs previously analysed in Chapter 8. These were the costs associated with: developing and delivering in house training; staying up to date with regulations monitoring; and ensuring products conform to regulatory standards.
154. In total, a quarter (26%) of all businesses faced some ongoing, annual labour cost in the last 12 months. As shown in Table 9.1, the median annual labour cost across all manufacturing businesses for complying with regulations was zero, while the mean was £2,350. The median remained zero for both size bands as most businesses did not incur a cost, but the mean costs differed considerably, at just £1,580 for micro and small businesses, compared to £28,260 for medium and large businesses.
Table 9.1 Estimated annual labour costs complying with OPSS regulations
| Business size | Base Median | cost | Mean cost | Max. cost |
|---|---|---|---|---|
| Micro and small | 378 | £0 | £1,580 | £241,590 |
| Medium and large | 198 | £0 | £28,260 | £1,254,350 |
| All businesses | 576 | £0 | £2,350 | £294,300 |
9.2 Annual ongoing external costs
155. The estimated annual external costs were calculated by summing together the annual cost of external services used, namely: legal or accounting services; external training or trainers; and other costs related to ensuring products complied with regulations. More detail on the individual costs of these areas can be found in Chapter 6.
156. The overall ongoing external support costs across all businesses are presented in Table 9.2. In line with the overall labour costs findings, only around one in five (19%) businesses had used external services within the past 12 months to comply with regulations. As a result, median cost for all businesses was £0 as most did not incur a cost through complying with OPSS regulations, while the mean costs were £1,050. The mean annual cost for micro and small businesses was £890, while the mean for medium and large businesses was £6,390.
Table 9.2 Estimated annual external costs complying with OPSS regulations
| Business size | Base | Median cost | Mean cost | Max. cost |
|---|---|---|---|---|
| Micro and small | 389 | £0 | £890 | £160,000 |
| Medium and large | 207 | £0 | £6,390 | £307,500 |
| All businesses | 587 | £0 | £1,050 | £307,500 |
Derived from E3; E5; E8. Estimated total annual cost. Base: All businesses except those that faced costs but were unsure what the costs were.
9.3 Total annual ongoing costs
157. The total ongoing costs incurred in the last 12 months related to maintaining compliance with regulation was calculated by combining the overall annual labour and external costs with the costs faced as a result of non-compliance and the annual cost of any RegTech investment, offset by any savings achieved through RegTech implementation. The average annual costs of businesses that reported any costs are shown in Chapter 8.
158. Ongoing annual compliance costs were reported by around one in three (35%) businesses, although this was considerably higher among medium and large businesses (53%). [footnote 7]
159. For most, the median annual cost was £0, reflecting that more than half of businesses reported no ongoing costs. In contrast, medium and large businesses reported a median annual cost of £990. These findings are shown in Table 9.3.
160. The mean annual cost for all businesses was £3,540. For micro and small businesses, the mean was £2,530 with a maximum cost of £241,590, while for medium and large businesses the mean average cost was £38,560 with a maximum annual cost of £1,314,360.
Table 9.3 Estimated total annual cost of complying with OPSS regulations
| Business size | Base | Median cost | Mean cost | Max. cost |
|---|---|---|---|---|
| Micro and small | 393 | £0 | £2,530 | £241,590 |
| Medium and large | 211 | £990 | £38,560 | £1,314,360 |
| All businesses | 580 | £0 | £3,540 | £1,314,360 |
Derived from D3; D4; D5; E3; E5; E8; G3; G5; H6; H8. Estimated total annual cost. Base: All businesses, excluding those that faced annual costs but were unsure what the costs were.
161. Two sectors had median annual costs that were higher than zero, which means that more than half of the businesses within these sectors experienced at least some annual cost. As shown in Table 9.4, manufacturers of computers, electronics and optical products faced a median annual ongoing cost of £1,500 and manufacturers of chemicals and chemical products faced a median annual cost of £740.
Table 9.4 Estimated total annual cost of complying with OPSS regulations by key sectors
| Business sector | Base | Median cost | Mean cost | Max. cost |
|---|---|---|---|---|
| Computer, electronic and optical products | 43* | £1,500 | £8,320 | £241,590 |
| Chemicals and chemical products | 36* | £740 | £3,050 | £47,150 |
Derived from D3; D4; D5; E3; E5; E8; G3; G5; H6; H8. Estimated total annual cost. Base: Manufacturers of computers, electronics and optical products (36) and manufacturers of chemicals and chemical products (43), excluding those that faced annual costs but were unsure what the costs were. *Figures should be treated with caution due to low base.
10. Other Costs of Regulatory Compliance
162. This chapter covers other compliance-related costs, including reformulation of products, and the impact of regulatory uncertainty. It summarises areas where costs are less frequent and thus less quantifiable but still relevant to understanding the wider impact of OPSS regulations.
Summary of findings on other costs of compliance
-
Only a small subset of the survey population, those manufacturing toys or cosmetics, were asked about reformulation. Costs for these cases could not be robustly quantified due to the low sample size.
-
Regulatory uncertainty affected 12% of businesses, impacting investment and workforce planning decisions, with the effect being more pronounced in certain sectors, possibly due to some sectors manufacturing products that are more heavily regulated.
-
Similarly businesses that invested in RegTech were also more likely to say they had been impacted by regulatory uncertainty; this may be because those concerned about uncertainty are more willing to invest in functions that might help to mitigate the impact of changing regulations, or conversely could be due to those using RegTech having greater awareness of regulatory changes as a result of the technology.
-
The main impacts of regulatory uncertainty included reduced ability or confidence to invest, decreased hiring, and foregone internal and external investment.
-
Businesses most commonly suggested that greater clarity on current and forthcoming regulations would help reduce uncertainty, along with calls for an even-handed regulatory approach and increased financial or general support.
10.1 Reformulation of Stock
163. Businesses who manufacture toys or cosmetics were asked if they had needed to reformulate any toy or cosmetic products in the last five years. However, only 19 businesses (unweighted) fell into this category, of whom four (all cosmetics manufacturers) reported they had needed to reformulate their products. Due to the very low base size, it is not possible to report on the costs associated with these reformulations.
10.2 Regulatory Uncertainty
164. Businesses were asked if uncertainty surrounding product safety standards or regulations affected their investment or staff decisions; 12% reported that it had. This proportion was broadly consistent across size groups (10-16%).
165. By sector, uncertainty around regulations was more likely to have impacted decision making among businesses in the manufacture of basic metals or fabricated metal products sector (23%) and the manufacture of machinery and equipment not elsewhere classified (20%).
166. Businesses that had invested in RegTech were also more likely to report that uncertainty around regulations had affected their investment or staff decisions (37%) compared with those that had not invested in RegTech (10%). This could suggest that businesses feeling more of an impact from perceived regulatory uncertainty may be more motivated to invest in technology related to compliance with regulations. However, it could also mean that after investing in RegTech businesses were more aware of their regulatory responsibilities.
167. Among those affected, the main impacts of this uncertainty related to investment and workforce planning, as shown in Figure 10.1. Nearly nine in ten (88%) reported reduced ability or confidence to invest, two-thirds (66%) had reduced their investment in hiring, half (50%) had foregone internal investment, and just over two-fifths (43%) had foregone external investment.
Figure 10.1 Impacts of regulatory uncertainty on the business
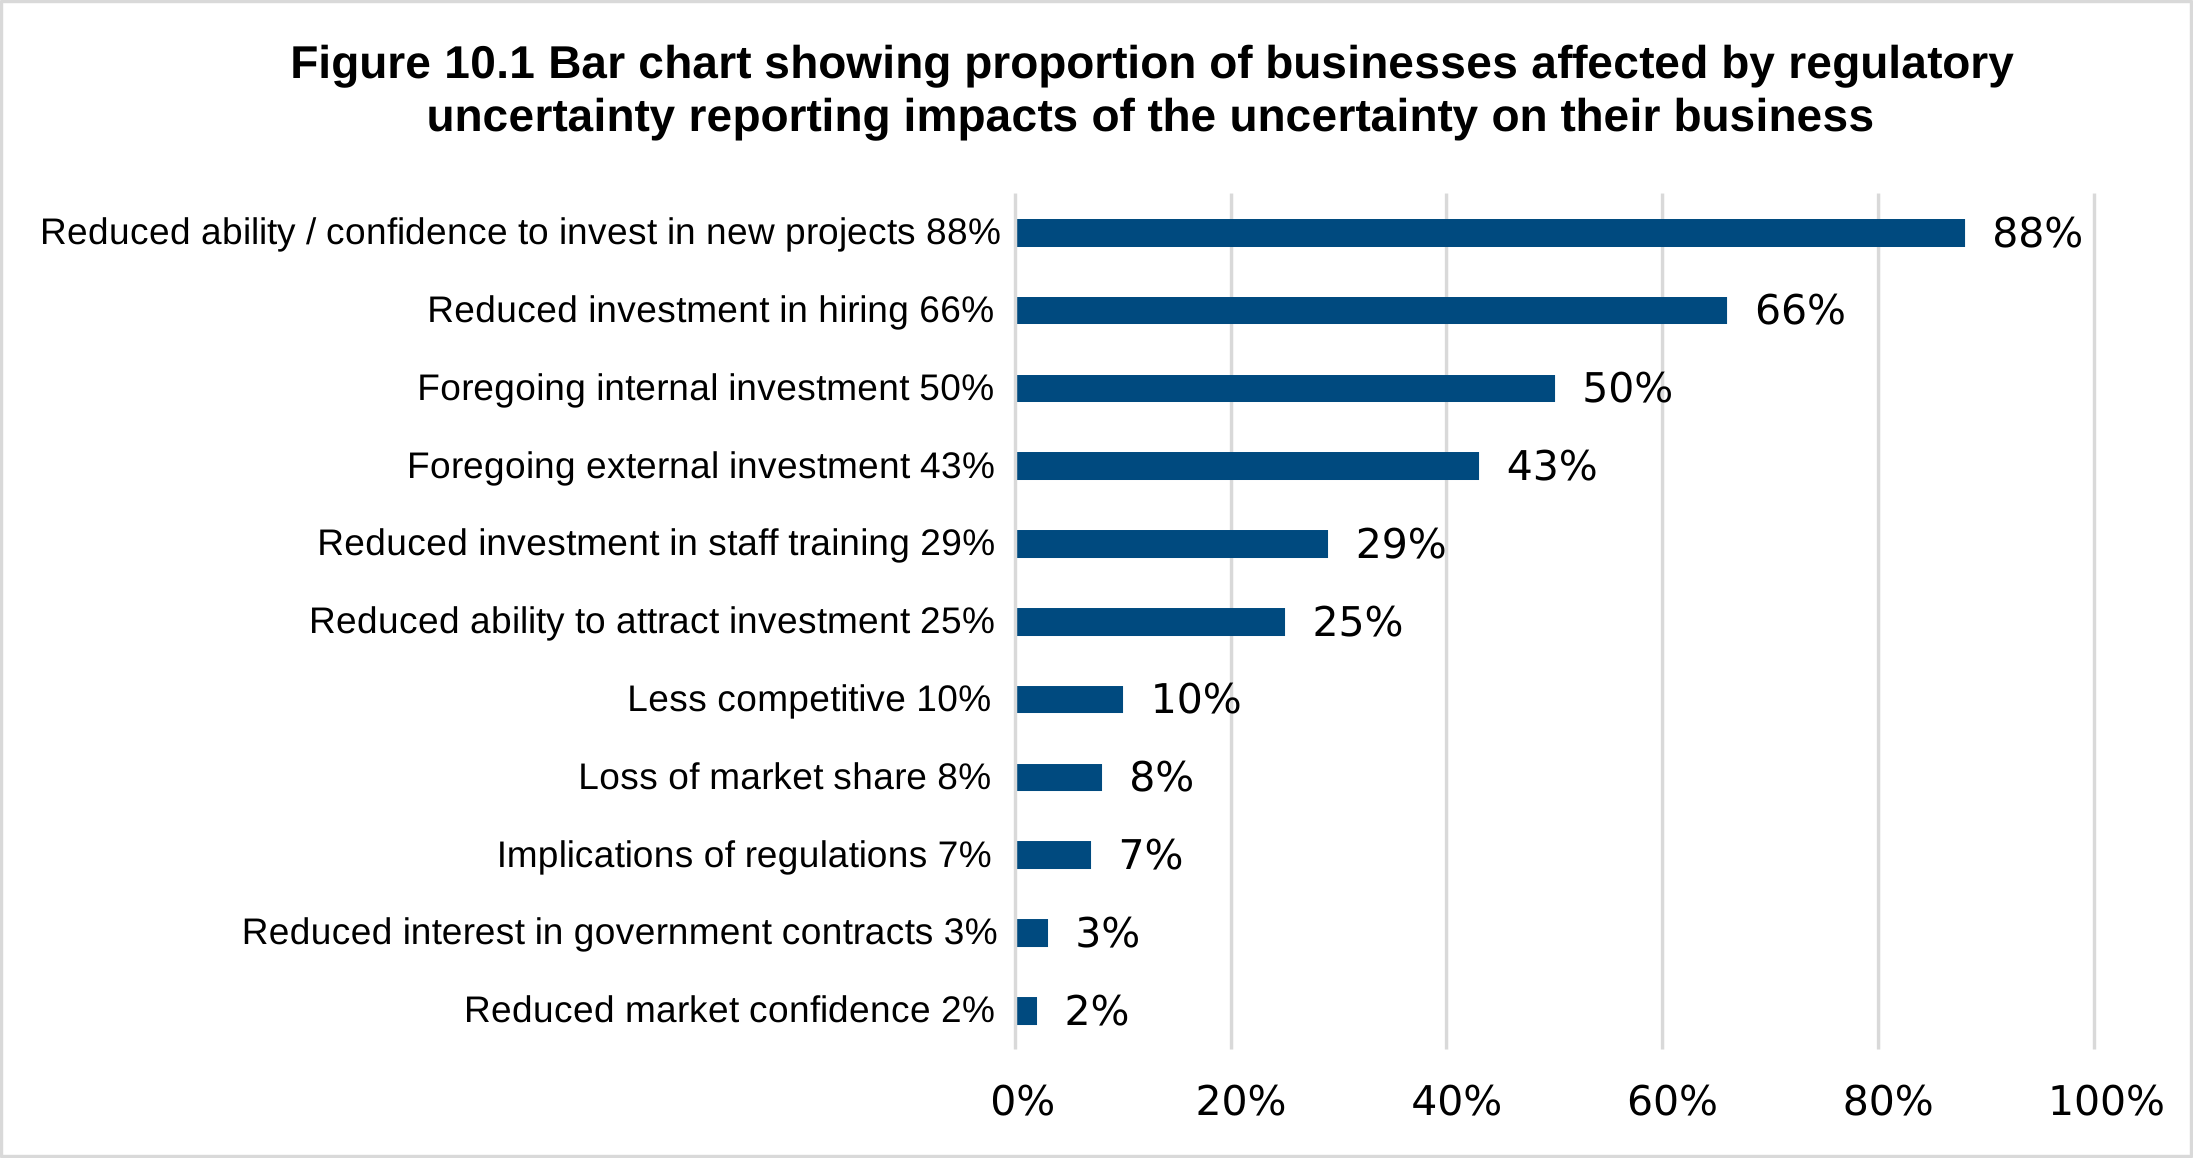
F2. Which, if any, of the following have been the impact of this lack of certainty on your business? Base: All businesses impacted by uncertainty (81). Impacts reported by fewer than 2% not shown.
- When asked how uncertainty could be reduced, the most common response, by around a third (34%) of businesses, was to have clarity on current regulations and any changes to regulations, followed by an even-handed approach to regulatory requirements (19%), more funding or financial support (17%) and better support more generally (15%).
168. When asked how uncertainty could be reduced, the most common response, by around a third (34%) of businesses, was to have clarity on current regulations and any changes to regulations, followed by an even-handed approach to regulatory requirements (19%), more funding or financial support (17%) and better support more generally (15%).
Figure 10.2 What could be done to reduce regulatory uncertainty
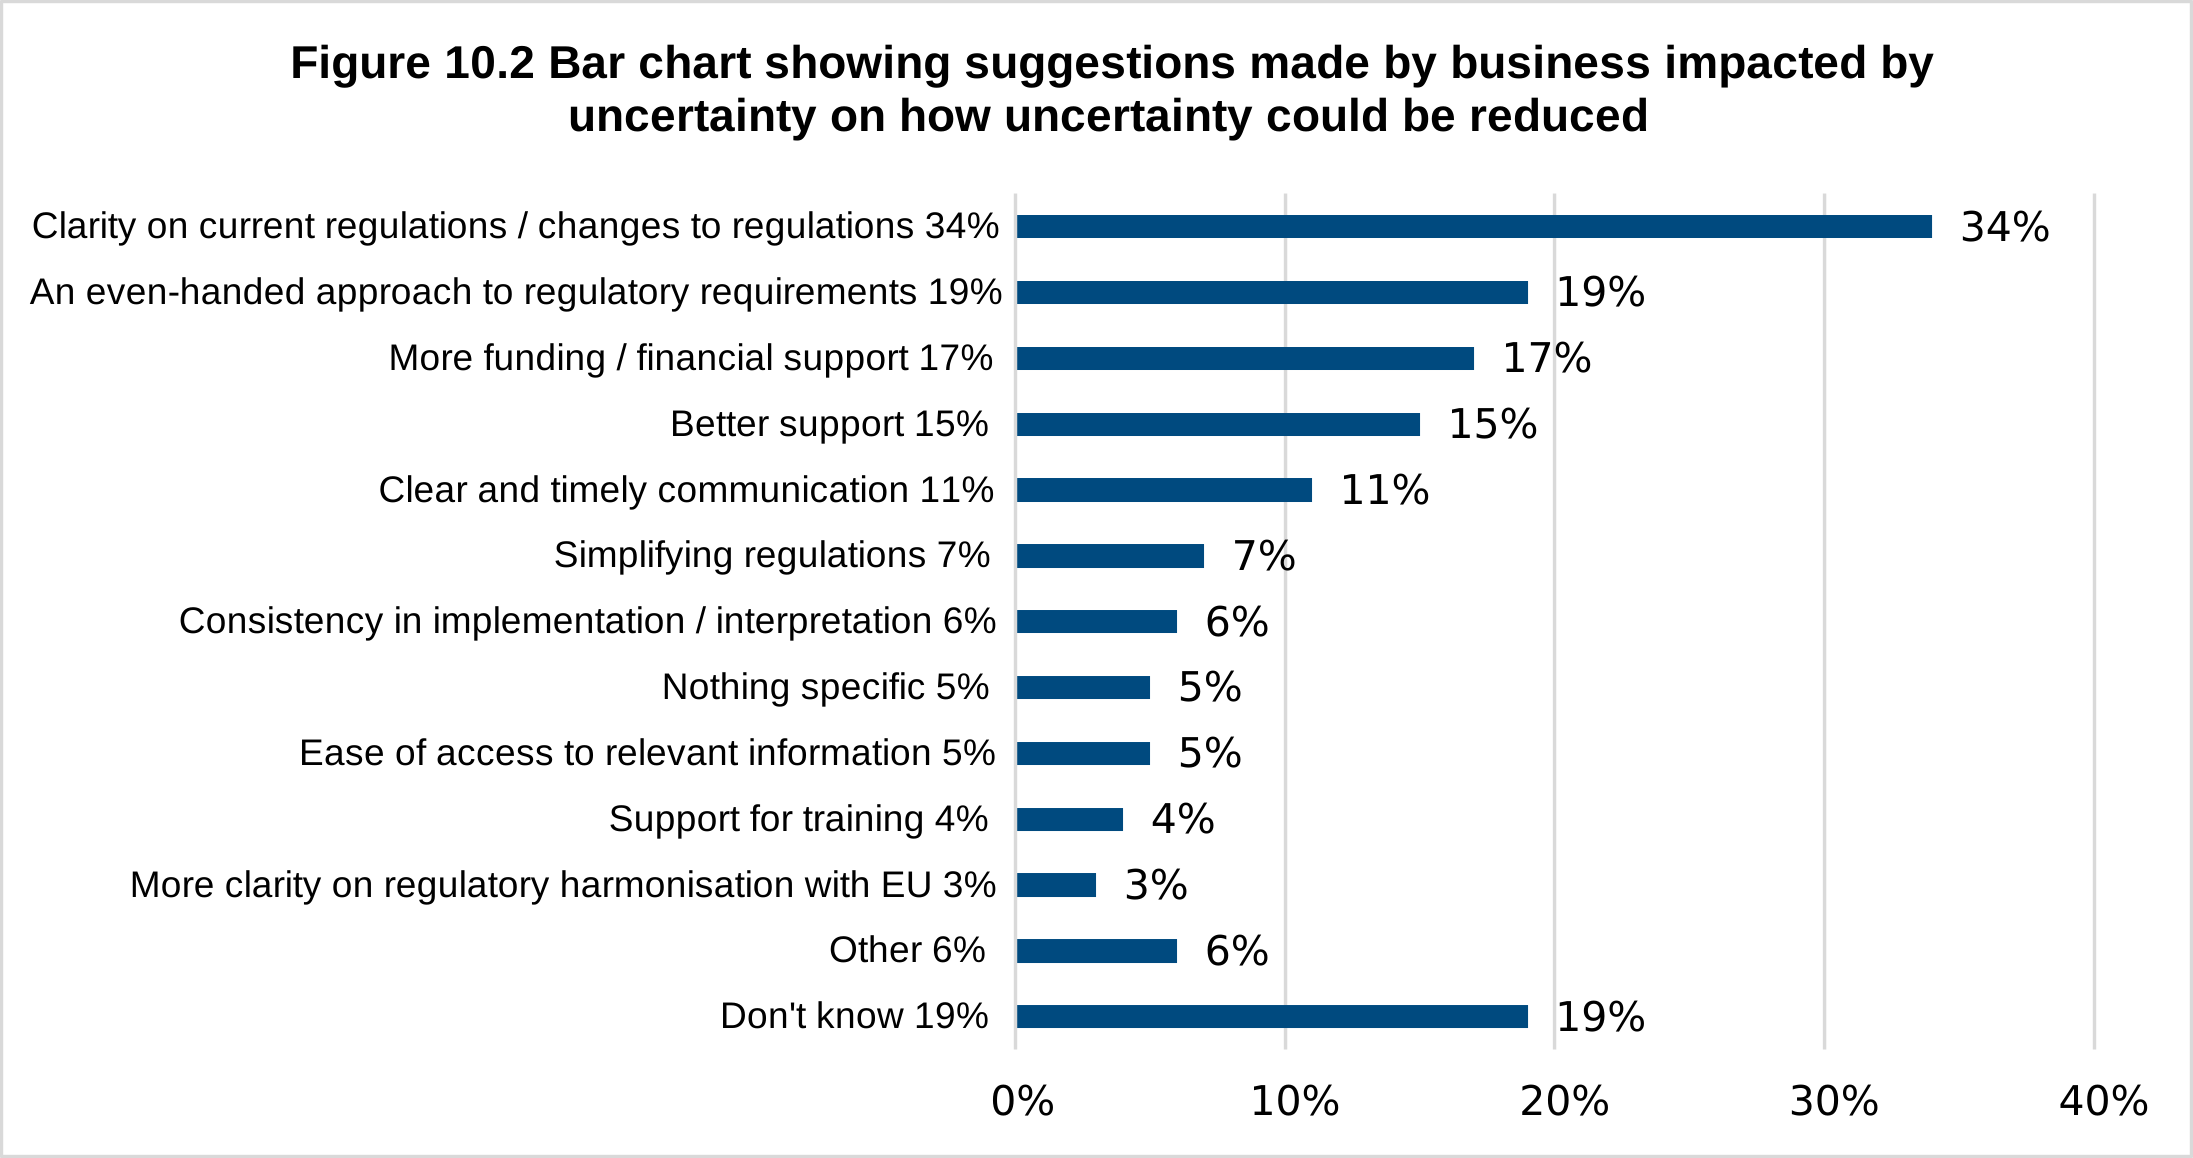
F3. What, if anything, could be done to reduce this uncertainty? Base: All businesses impacted by uncertainty (81). Suggestions mentioned by fewer than 2% not shown.
11. Conclusions
169. The conclusions presented here reflect the experiences and perspectives of businesses that responded to the survey, with results weighted by sector and size to represent the wider business population within OPSS’s remit. However, it should be recognised that there may be some non-response bias which cannot be measured (for example, non-compliant businesses may have been less likely to participate) meaning these findings may not represent all businesses within the population.
170. One-off vs. Ongoing Costs: One-off compliance costs (incurred during business start-up or following regulatory changes) were significantly higher than annual ongoing costs. Almost all businesses that were new or had been impacted by a new or changing regulation incurred some sort of cost, whereas only around a third (35%) of businesses reported some form of ongoing cost.
171. Businesses impacted by new or changing regulations spent substantial labour time familiarising themselves with the new regulations and on ensuring their products complied with the new or changing regulations. Additionally, these businesses were more likely to use external consultants (52%) compared to those maintaining routine compliance (19%). Furthermore, one-off external costs associated with regulatory compliance were often much higher than ongoing external costs, demonstrating that businesses affected by regulatory changes are willing to make considerable investments to meet updated requirements.
172. Median total one-off costs among all businesses affected by new or changing regulations were £10,430, but this varied widely, with some businesses reporting substantially higher costs. In contrast, ongoing annual costs were zero for most businesses, possibly reflecting that once compliance processes are embedded, they require less additional resource. It is also possible businesses found it harder to extrapolate compliance with product safety regulations specifically from other day-to-day operational costs, such as internal quality assurance, and therefore did not regard this an additional time cost.
173. Awareness of regulations: There was generally low spontaneous awareness of product safety regulations among businesses. More than one in five (21%) reported that no product safety related regulations applied to them, while 37% were unsure which regulations were relevant to their operations. It should be noted that businesses were not provided with a list of regulations but were instead asked, through an open-ended question, which product safety regulations they were aware of. Future research could usefully explore in more depth how businesses that do not believe product safety regulations apply to them perceive product safety, and whether their products actually comply with the relevant regulations.
174. Variation by sector: Sectors such as manufacturers of computers, electronics, optical products, and manufacturers of chemicals reported higher ongoing costs but also greater engagement with compliance activities such as investment in RegTech. These sectors also showed higher awareness of relevant OPSS regulations, possibly suggesting that businesses producing more complex or regulated products face greater compliance challenges.
175. Variation by size: Costs of regulatory compliance for manufacturers varied considerably, with most businesses incurring moderate or no costs, but a minority experiencing more substantial expenditure. This was most likely to be the case among larger firms and those affected by recent regulatory changes. These findings highlight the importance of considering both business size and sector when assessing the burden of compliance, as well as the need for targeted support for those facing the highest costs. The high proportion of businesses reporting no time or expenditure related to compliance, and the low levels of awareness of relevant product safety standards and regulations, could suggest that there is room for improvement in making businesses’ aware of their requirements for meeting safety standards.
176. Relative financial burden: Larger businesses incurred higher absolute ongoing costs, but these represented a smaller proportion of turnover compared to smaller businesses. Businesses with turnover between £100,000 and £500,000 faced median annual compliance costs equivalent to 0.79% of the midpoint of that turnover band, compared to just 0.14% for businesses with turnover between £2 million and £10 million. This indicates that, while across businesses of all sizes compliance costs were low relative to their overall annual turnover, there is a proportionally greater burden on smaller firms, which have fewer resources to absorb these expenses.
177. Impact of RegTech: Confidence in managing new regulations was generally high (71%), but was significantly higher among firms with compliance teams (88%) or those investing in RegTech (85%). Despite, this adoption of RegTech remains limited (5%) and it may not be appropriate for some manufacturers. Among businesses that incurred ongoing costs for RegTech and reported efficiency gain, the median annual saving in labour costs (£1,480) slightly outweighed the median annual technology cost (£1,200). This suggests that wider adoption of RegTech could help reduce compliance burdens, particularly for medium and large firms. Additionally, it is possible that businesses that are already more engaged with regulation and compliance are also more likely to invest in technology that may help them to ensure compliance.
12. Technical appendix
12.1 Survey Overview
178. The Cost of Compliance Survey was commissioned by OPSS to provide robust, quantitative evidence on the costs faced by businesses in meeting product regulations enforced by OPSS. The findings inform policy and evaluation work across the UK product safety system.
179. Fieldwork took place between May and August 2025, with 604 interviews completed among businesses involved in the manufacture of regulated products. All results are weighted to represent the estimated population of around 170,000 regulated businesses operating in the UK.
180. The research was originally designed to be a post-to-web survey; however, this was amended following an initial pilot phase due to the low response rate. More detail on this can be found in the fieldwork methodology section.
12.2 Sampling and Population Frame
181. The survey population included UK manufacturers classified under Standard Industrial Classification (SIC) codes relevant to OPSS-regulated products. A total of 15,064 business records were obtained from Market Location. [footnote 8] The original sample obtained was 10,000 records, however due to concerns raised over low response rates to the initial mailout, and the potential for high screen out rates, Market Location provided an additional 5,000 records. This additional sample was received during the mainstage fieldwork.
182. Stratified random sampling was used to ensure adequate representation across business sizes and sectors. Four size bands were selected: Micro and sole traders (0–9 employees), Small (10–49), Medium (50–249), and Large (250+).
183. Eligible sectors were determined using OPSS data to check which specific five-digit SIC codes were impacted by regulations enforced by OPSS. IFF then grouped these codes at the broader two-digit SIC level, and this grouping was used as the foundation for creating the sample stratification. The final total sample by size and sector, including the additional records, is shown in Table 1. The final achieved sample is shown in Table 2.
Table 1. Total starting sample of businesses by size and sector
| SIC code | SIC description | 1-9 (inc. sole trader) | 10-49 | 50-249 | 250+ | All |
|---|---|---|---|---|---|---|
| 13 | Manufacture of textiles | 688 | 214 | 117 | 12 | 1,031 |
| 14 | Manufacture of wearing apparel | 559 | 178 | 58 | 7 | 802 |
| 16 | Manufacture of wood and of products of wood and cork | 552 | 203 | 60 | 2 | 817 |
| 17 | Manufacture of paper and paper products | 172 | 128 | 161 | 21 | 482 |
| 20 | Manufacture of chemicals and chemical products | 346 | 198 | 239 | 45 | 828 |
| 22 | Manufacture of rubber and plastic products | 391 | 238 | 189 | 26 | 844 |
| 23 | Manufacture of other non-metallic mineral products | 435 | 161 | 124 | 26 | 746 |
| 24 | Manufacture of basic metals | 164 | 99 | 89 | 16 | 368 |
| 25 | Manufacture of fabricated metal products, except machinery and equipment | 1,575 | 548 | 306 | 42 | 2,471 |
| 26 | Manufacture of computer, electronic and optical products | 677 | 251 | 223 | 33 | 1,184 |
| 27 | Manufacture of electrical equipment | 360 | 223 | 224 | 34 | 841 |
| 28 | Manufacture of machinery and equipment n.e.c. | 1,168 | 522 | 399 | 75 | 2,164 |
| 31 | Manufacture of furniture | 622 | 182 | 88 | 14 | 906 |
| 32 | Other manufacturing | 1,071 | 248 | 218 | 43 | 1,580 |
| Total | 8,780 | 3,393 | 2,495 | 396 | 15,064 |
Table 2. Final achieved sample
| SIC code | SIC description | 1-9 (inc. sole trader) | 10-49 | 50-249 | 250+ | All |
|---|---|---|---|---|---|---|
| 13 | Manufacture of textiles | 22 | 14 | 8 | 1 | 45 |
| 14 | Manufacture of wearing apparel | 12 | 3 | 1 | 0 | 16 |
| 16 | Manufacture of wood and of products of wood and cork | 10 | 9 | 7 | 1 | 27 |
| 17 | Manufacture of paper and paper products | 3 | 4 | 17 | 1 | 25 |
| 20 | Manufacture of chemicals and chemical products | 8 | 11 | 16 | 3 | 38 |
| 22 | Manufacture of rubber and plastic products | 16 | 9 | 16 | 5 | 46 |
| 23 | Manufacture of other non-metallic mineral products | 19 | 1 | 5 | 2 | 27 |
| 24 | Manufacture of basic metals | 5 | 10 | 8 | 1 | 24 |
| 25 | Manufacture of fabricated metal products, except machinery and equipment | 29 | 25 | 33 | 1 | 88 |
| 26 | Manufacture of computer, electronic and optical products | 19 | 13 | 12 | 1 | 45 |
| 27 | Manufacture of electrical equipment | 8 | 5 | 17 | 2 | 32 |
| 28 | Manufacture of machinery and equipment n.e.c. | 27 | 23 | 22 | 4 | 76 |
| 31 | Manufacture of furniture | 17 | 10 | 8 | 1 | 36 |
| 32 | Other manufacturing | 41 | 20 | 17 | 1 | 79 |
| Total | 236 | 157 | 187 | 24 | 604 |
12.3 Questionnaire Design
184. The questionnaire was developed jointly with OPSS to capture both quantitative and qualitative information on compliance costs. The questionnaire was originally designed as an online survey; however, this was then updated to a CATI survey following a low response rate in the online pilot.
185. The CATI survey was piloted with 50 businesses and following this the wording, routing, and sequencing was refined ahead of the full launch of the survey. The questionnaire covered:
- Initial setup and familiarisation with regulations;
- Ongoing activities such as training, monitoring, and record-keeping;
- One-off compliance events and associated costs;
- External advice and material expenditure;
- Business perceptions of regulatory proportionality and benefit.
12.4 Fieldwork methodology and Data Collection
186. The initial research approach was to conduct a post-to-web survey. This method was selected as it allowed participants time to gather the necessary cost-related information before responding. For the pilot, 2,000 invitation letters were dispatched on 29th April 2025, with fieldwork running through to 19th May 2025. Each letter included a personalised survey link, instructing recipients to access the survey online via their web browser. A limited telephone chasing exercise was also conducted to encourage businesses to complete. However, the final response rate was very low, and as a result, a decision was made to switch the survey to a Computer Assisted Telephone Interviewing (CATI) methodology. The breakdown of responses from the first pilot is shown in Table 3.
Table 3. Original pilot sample outcomes
| Data status | Number of respondents |
|---|---|
| Completed | 6 |
| Started survey but dropped out | 3 |
| Stopped by questionnaire at A4 (OPSS regs) | 5 |
| Incorrect respondent, said they would pass the survey on to someone else, but that business did not go on to complete | 2 |
| Incorrect respondent and could not pass on to correct respondent | 1 |
| Clicked on the link but did not start the survey | 11 |
| Total (who accessed the link) | 28 |
187. The rationale for adopting telephone interviews was that interviewers could actively encourage businesses to participate, thereby improving response rates. However, a trade-off of this approach is that respondents had to rely on memory when providing information about costs, rather than consulting records. For further details please refer to the caveats log outlined below.
188. A second pilot was conducted to test the validity of this updated methodology, and 50 surveys were completed. Sample outcomes for the second pilot are shown in Table 4.
Table 4. Second pilot sample outcomes
| Outcome | Number of respondents |
|---|---|
| Completed | 50 |
| Appointments for businesses to complete the survey at a later date | 59 |
| Refused to take part | 51 |
| No definitive outcome | 1,183 |
| Total contacted | 1,343 |
189. Following some revisions to the survey and screener mainstage fieldwork was launched on the 22nd of July 2025 and ran until 1st of September 2025. Interviews were carried out by trained researchers using Computer-Assisted Telephone Interviewing (CATI). Each interview lasted around 20 minutes and was conducted with business owners, directors, or staff responsible for compliance.
190. Quotas ensured coverage across all size and sector strata. Progress was monitored throughout fieldwork to address any emerging shortfalls through targeted callbacks.
12.5 Response rates
191. A total of 7,612 businesses were approached, from a total starting sample of 15,064 records. This resulted in 604 completes, an effective response rate of 4%. The overall response rate for the survey was 15%, calculated as ‘achieved interviews’ as a proportion of all businesses in scope where a definite outcome could be reached was 25%. The final sample outcomes are shown in Table 5.
Table 5. Final sample outcomes
| Total | Percentage | |
|---|---|---|
| Completed interviews | 604 | 4% |
| Refused / opt out | 562 | 4% |
| Number unobtainable | 1,070 | 7% |
| Not available during interviewing period | 139 | 1% |
| Active records at close (Records where a definitive call outcome had not been reached at end of fieldwork period e.g. call attempts went to voicemail or no answer) | 11,556 | 77% |
| Over quota (Records removed as target quota reached) | 115 | 1% |
| Total starting sample | 15,064 | 100% |
12.6 Weighting and Data Treatment
192. Survey data was weighted to align with the true structure of the regulated business population by size and sector. Weighting adjusted for differential response rates and ensured that overall results reflect the composition of businesses within OPSS’s regulatory remit.
193. Weights were calculated using data on business population from the official Business Population Estimates (2024) produced by DBT. Weights were applied by size and sector, using RIM weighting which adjusts each variable independently to match population target.
194. Where achieved responses in a SIC sector were fewer than 25, similar sectors were combined (e.g., SIC 13 and 14 for textiles and apparel) to maintain robust weighting and avoid instability in estimates. It is important to note that data was weighted to the population profile of these in-scope businesses and not to all UK businesses.
Table 6. Weighted and unweighted counts- by business type and size
| Business type | Unweighted | Weighted | Estimated population size | Weighted proportion |
|---|---|---|---|---|
| Total | 604 | 604 | 173,535 | 100% |
| 13 and 14 manufacture of wearing apparel and textiles | 62 | 84 | 23,515 | 13.55% |
| 16 and 17 Manufacture of wood and of products of wood and cork and manufacture of paper | 52 | 107 | 29,795 | 17.17% |
| 20 - Manufacture of chemicals and chemical products | 38 | 17 | 5,130 | 2.96% |
| 22 - Manufacture of rubber and plastic products | 46 | 14 | 4,230 | 2.44% |
| 23 - Manufacture of other non-metallic mineral products | 27 | 40 | 11,325 | 6.53% |
| 24 and 25 - Manufacture of basic metals and fabricated metals | 112 | 127 | 37,475 | 21.60% |
| 26 - Manufacture of computer, electronic and optical products | 45 | 48 | 13,030 | 7.51% |
| 27 - Manufacture of electrical equipment | 32 | 15 | 4,105 | 2.37% |
| 28 - Manufacture of machinery and equipment n.e.c | 76 | 39 | 12,810 | 7.38% |
| 31 - Manufacture of furniture | 36 | 46 | 12,575 | 7.25% |
| 32 - Other manufacturing | 78 | 67 | 19,545 | 11.26% |
| Size | 604 | 604 | 173,535 | 100% |
| Micro and sole traders (1-9) | 236 | 534 | 153,320 | 88.35% |
| Small (10-49) | 157 | 52 | 15,110 | 8.71% |
| Medium (50-249) | 187 | 16 | 4,425 | 2.55% |
| Large (250+) | 24 | 2 | 680 | 0.39% |
12.7 Data Modelling and validation
195. All survey data underwent detailed validation and cleaning before analysis. Automated logic checks were embedded in the CATI system to prevent invalid responses, while further cleaning involved range checks, open-text review, and cross-verification of reported figures.
196. Particular attention was given to ensuring internal consistency between component and total cost values. Outliers were reviewed on a case-by-case basis and missing or implausible values were imputed conservatively to avoid overstating results. All adjustments were logged and reviewed by the analytical team.
197. Free text responses to the screener question S3 “What type of products do you manufacture?” were reviewed to check if the listed products would fall within the scope of regulations enforced by OPSS; 16 records were removed from the dataset following this review, leaving a total of 604 valid interviews.
Modelled data
198. Businesses were asked to provide salary data for three broad employee groups:
- Factory, production, or administrative employees;
- Professional staff (e.g., accountants and finance officers);
- Directors or senior managers
199. To estimate labour costs, an average salary was required for each employee group within each business. All businesses were invited to report a specific average annual salary for each group. If they were unable or unwilling to provide a numeric value, they were instead asked to select the most appropriate salary band from a set of predefined ranges. The midpoint of each selected range was then used as the estimated average salary for that group. For the highest salary band, where no upper bound existed, the estimated salary was calculated using the mean salary reported by businesses whose self-reported salaries fell within that top band.
200. For businesses that did not provide salary data at all (neither a numeric value nor a range), estimated salaries were modelled. This was done by calculating, for each sector, the mean salary reported by businesses that had provided useable salary information. These sector-level means were then assigned to businesses with missing salary data, separately for each employee group.
201. Once salary data was modelled, the cost calculations outlined below were used to work out a cost per hour for each employee group for each business.
202. A similar process was applied to model hours data. For each question relating to compliance-related hours, businesses were asked to provide a figure for the total number of hours employees at each level spent on each compliance activity. For those unable or unwilling to provide a figure, they were then prompted with a range of hours to select. For businesses that gave a range the mid-point of the band they selected was used as the modelled numeric value.
203. For businesses that selected the highest band, the modelled number of hours was calculated by taking the median of businesses that gave numeric responses which fell within that top range. For example, businesses that selected don’t know or prefer not to say at B3_1 but then gave a ranged response that was ‘more than 50 hours’ were given a modelled hours figure of 250 hours. This was the median response from the 24 businesses that gave a figure greater than 50 hours at this question.
12.8 Cost calculations
204. In order to calculate the labour costs to businesses related to hours spent on compliance activities from annual salary data, it was necessary to convert the average annual salaries into an hourly rate, and to factor in additional employment costs incurred by businesses (such as National Insurance contributions) on top of basic salary amounts. The following steps were taken to calculate the final hourly labour cost:
- Basic salary figures (including modelled data) were multiplied by an upweight to take account of National Insurance, employer pension contributions, overtime and other additional elements
- Upweighted salary figures were then divided by the average number of days worked per year by full-time workers to give a daily cost figure *Daily cost figures were then divided by average number of hours worked per day by full-time workers to give a final hourly labour cost figure.
205. Total costs were calculated for each compliance activity and each employee level as follows: [Hours Spent] x [Final Hourly Labour Cost] = Total cost.
206. To calculate the total labour cost to each business of each compliance activity, the total costs for each of the three employee levels for each activity were then summed together.
207. All calculations were performed using variables incorporating the modelled data.
208. This approach replicates the method used to calculate labour costs in the Department for Education’s Investment in Training (IiT) survey. [footnote 9] IiT is a key government survey which has developed a robust methodology for deriving labour costs from survey data on staff time and salaries, which has been refined and tested over multiple waves for over a decade. As such, it represents a tried and tested approach to calculating labour costs data.
12.9 Analysis Procedures
209. Analysis was conducted using standard statistical software with survey weights applied throughout. Cross-tabulations and mean estimates were produced by size and sector, with statistical testing undertaken where subgroup base sizes were sufficient. Confidence intervals were calculated at the 95% level.
210. Monetary figures were rounded to the nearest £10 to avoid false precision. Results are presented in real terms and should be interpreted as indicative averages rather than exact values.
211. The survey contained open-ended questions, allowing respondents to offer any additional relevant responses. These responses were coded by IFF Research’s in-house coding team and incorporated into the final SPSS data file.
12.91 Interpretation and Limitations
212. All findings are subject to sampling variation. Confidence intervals should be considered when interpreting subgroup differences, particularly where base sizes are small. While weighting corrects for observable imbalances, some degree of non-response bias may remain.
213. As the data are based on self-reported information, they may also be affected by recall or estimation error. Extreme values were checked and treated with care to avoid distorting averages. For subgroups with fewer than 50 responses, figures should be viewed as indicative only.
214. Overall, the methodology provides a robust and transparent evidence base for assessing regulatory compliance costs across OPSS-regulated sectors, while acknowledging the inherent limitations of survey-based research.
13. Caveat and decision justification list
215. The following represents a log of caveats that should be understood when interpreting the data from the cost of compliance research. It is meant to highlight the assumptions and limitations of the research process, and therefore to guide interpretation of the data. These caveats are particularly important to consider when analysing data about regulatory compliance costs given the highly uncertain nature of these costs and the need for respondents to provide estimates for cost and time figures during telephone-based survey approaches.
13.1 Difficulty determining which businesses / products fall under OPSS remit
216. Discussion: Given the highly complex and interdependent nature of production in advanced economies like the UK, it is particularly difficult to determine which businesses fall under the OPSS regulatory remit. This is especially the case given that it is possible, and even likely, that individual manufacturers will fall under the remit of many different regulatory authorities.
217. Mitigation(s): IFF implemented a detailed set of screener questions to exclude manufacturers not directly linked to OPSS’s regulatory remit. To ensure the data remained as valid as possible, a cautious approach was adopted: any business producing goods known to be outside the OPSS’s regulatory remit was excluded, even if they also manufactured potentially regulated products. However, businesses that indicated they only produced goods not included on the pre-coded screener list were not automatically excluded, as this might have been overly restrictive and risked omitting relevant businesses. In short, businesses were excluded that were outside OPSS’s regulatory remit without automatically excluding those that might still be relevant, even if their products weren’t on the initial list. As a result, a small number of out-of-scope businesses may have been included in the final sample. IFF carried out sense checks on responses and removed any that were clearly outside the OPSS regulatory remit.
218. Implications for Data Interpretation: Because most potential impacts on the data were mitigated by the screener questions, it is unlikely that uncertainty about regulatory coverage will have had any systemic impact on data outputs. However, it is possible that a small number of out-of-scope businesses made it through the screener questions and were unable to meaningfully answer questions about regulations enforced by OPSS, meaning that rates of non-response (high proportion of ‘don’t know’ responses, etc.) might be slightly elevated.
13.2 Caveat: Difficulty separating costs of changes in product safety regulations from other business costs
219. Discussion: The distinction between costs imposed by regulatory changes and those considered part of ‘normal’ operating expenditure is inherently fluid and often assumed rather than explicitly defined. In many cases, it will be difficult for survey respondents to disentangle these costs.
220. Mitigation(s): IFF took steps to mitigate these concerns by inserting repeated reminders that respondents should only report on costs imposed by product safety regulations as opposed to other kinds of business costs.
221. Implications for Data Interpretation: Asking respondents to isolate costs specifically attributable to changes in product safety regulations from broader business expenditure inevitably introduces a degree of estimation and uncertainty. As a result, individual cost estimates may diverge from the actual financial impact of compliance with the regulation in question – either overstating or understating the true cost. However, given the large and diverse sample engaged by IFF, it is reasonable to expect that such variances will, to some extent, offset each other across the dataset, thereby supporting the robustness of aggregate findings.
13. 3 Caveat: Challenges associated with identifying the time horizon regulatory costs
222. Discussion: Related to the above, the time horizon during which a regulatory change can be considered to impose a discrete cost is finite. Over time, such costs typically transition from being viewed as exceptional to being absorbed into the standard cost structure of the industry. This has implications for how compliance costs are measured and interpreted, particularly in longitudinal or retrospective analyses.
223. Mitigation(s): To mitigate this time-horizon problem, IFF asked businesses to focus on product safety regulation changes that impacted them recently. Specifically, respondents were directed to consider either the costs associated with compliance with regulations enforced by OPSS at the point of business establishment (if this occurred within the last two years), or the costs resulting from regulatory changes introduced within the past five years. When discussing ongoing costs, businesses were asked for hours and costs related data from the previous 12 months.
224. Implications for Data Interpretation: This approach was designed to improve recall accuracy and relevance, while also aligning with the timeframes most likely to reflect recent compliance activity. While this framing improves the quality of data collected, it also means that residual costs associated with long-standing regulatory burdens are not captured. However, given the inherently uncertain nature of such costs, it is unlikely that any methodological approach could accurately quantify them.
224.1 Caveat: Challenges Associated with Cost Estimation
225. Discussion: Throughout the survey, respondents were asked to provide detailed information on both one-off and ongoing costs associated with compliance with regulations enforced by OPSS. However, many businesses – particularly smaller organisations – may not have had this information readily available, resulting in responses that are necessarily based on estimation. This was a particular challenge given the need to switch to a telephone-based survey approach after the push-to-web design failed to produce sufficient engagement to generate meaningful data.
226. Mitigation(s): IFF Research deployed a team of highly experienced telephone interviewers with a strong track record of collecting complex economic data from corporate respondents. To further support data quality, a series of cognitive interviews were conducted during the pilot phase to test comprehension and response accuracy. These interviews confirmed that respondents generally felt confident in their ability to provide answers with an acceptable degree of precision, despite the complexity of the data being collected.
227. Implications for Data Interpretation: While these mitigation strategies are likely to have reduced distortions arising from respondent uncertainty, the data collected remains best understood as estimated rather than precisely measured. Nonetheless, given the inherent challenges associated with cost estimation – particularly in relation to regulatory compliance – it is reasonable to conclude that this survey-based approach offers a level of accuracy comparable to, if not greater than, alternative methodological options.
13.5 Caveat: Challenges Associated with Estimating Employee Time Put Towards Regulatory Compliance
228. Discussion: A related source of uncertainty stems from the need to ask respondents to estimate the time that potentially large workforces have spent complying with regulations enforced by OPSS within the confines of a 20-minute phone survey. This makes it very difficult for respondents to provide accurate information on how long their workforces must put towards regulatory compliance and the labour costs associated with these efforts.
229. Mitigation(s): To simplify this aspect of data collection, and thus increase the accuracy of data collected, IFF asked respondents to consider their workforce through the lens of three synthetic categories based on ONS classifications likely to be most relevant to a manufacturing workforce – namely, factory/production workers, professional staff, and directors/senior managers.
230. Implications for Data Interpretation: While these categories were designed to align with common organisational structures, they may not precisely reflect the internal hierarchies or job roles within individual firms. Consequently, data on hours worked – and the cost estimates derived from them – should be interpreted as approximations. Nonetheless, this structured approach offers a more reliable framework than the alternative of asking respondents to estimate compliance costs without reference to workforce segmentation and is likely to yield more consistent and interpretable results across the sample.
13.6 Caveat: Inability to Measure Unquantifiable Regulatory Compliance Costs (Uncertainty, etc.)
231. Discussion: As noted in the literature review, a portion of regulatory cost is inherently abstract or counterfactual in nature, making it highly speculative and resistant to quantification. These costs often relate to foregone opportunities, delayed investments, or strategic decisions influenced by regulatory uncertainty. Given their intangible character, such costs cannot be measured empirically, even through direct engagement with businesses.
232. Mitigation(s): Given these challenges, IFF Research did not attempt to quantify the costs associated with regulation-induced uncertainty. Instead, these impacts were explored qualitatively – for example, by asking businesses whether uncertainty around regulations enforced by OPSS had led them to forgo investment or delay strategic decisions, rather than attempting to assign a monetary value to such outcomes.
233. Implications for Data Interpretation: While uncertainty is not included in the quantitative cost estimates presented in this research, the survey did capture valuable qualitative data on how OPSS might reduce regulatory uncertainty. This includes feedback from businesses on the types of regulatory ambiguity that affect decision-making and suggestions for improving clarity and predictability in future regulatory changes.
13.7 Caveat: Issues Related to Size Sampling and Quotas
234. Discussion: The pilot phase of data collection revealed that larger businesses were generally better equipped to provide detailed and accurate responses to questions about regulatory compliance costs, particularly in relation to regulations enforced by OPSS. In light of this, IFF Research made a strategic decision to prioritise engagement with larger firms during the main stage of fieldwork. This adjustment was intended to maximise the quality and reliability of the data collected but comes with the risk of skewing the data towards the experience of these larger organisations.
235. Mitigation(s): To address the intentional oversampling of larger businesses during fieldwork, IFF applied statistical weighting to the final dataset. This weighting ensures that the results accurately reflect the true distribution of business size and industry within the UK manufacturing economy, thus ensuring that the data is representative while preserving the higher data quality obtained from larger firms.
236. Implications for Data Interpretation: While the decision to oversample larger businesses during the survey runs the risk of introducing a sampling bias, the application of statistical weighting ensures that the final dataset reflects the actual distribution of business sizes and sectors in the UK manufacturing economy. As a result, the data can be interpreted as both representative and robust. Analysts should remain mindful, however, that cost estimates may be more granular for larger firms and more approximate for smaller ones.
13.8 Caveat: Outliers influencing averages
237. Discussion: In some cost variables there are a small number of responses with extremely high values that were many times greater than the next highest value. These are clear outliers but also appear to be genuine responses based on manual review of the interview recordings. Including these responses has a disproportionate effect on the mean but excluding them from the data removes an apparently legitimate response and no longer reflects the potential scale of costs faced by a minority of firms.
238. Mitigation(s): These extreme outliers have been retained in the data set, however where they occur averages have been presented both with and without the outlier. In line with best practice for small samples with high natural variation, medians are the primary measure reported throughout. This approach balances transparency, accuracy, and the need to reflect the full distribution of reported costs.
239. Implications for Data Interpretation: Caution should be applied when interpreting means throughout the report due to the wide variance in cost data reported by businesses. This is especially true in instances where extreme outliers occur.
14.Literature review
240. Ahead of the research project, OPSS commissioned a literature review to determine the current understanding of best practice when measuring regulatory costs. The literature was produced in April and May 2025 and is presented below. The wording for this report has not been updated and the research and questionnaire design being referred to relates to the research conducted for this report.
14.1 Introduction: Different approaches to measuring regulatory costs
241. Developing widely agreed upon methods of quantitatively assessing regulatory costs have proven to be deceptively difficult for both policymakers and regulation economists. At the heart of the issue is that while categorically identifying different types of regulatory costs – that is, the different types of costs that accompany regulatory changes – has been successful, assigning an exact figure to these costs at either the firm or industry level is less straightforward. The reasons for such difficulties are many and range from the complexity of technical requirements in reporting standards, to cross-industry differences in these standards, and uneven governance regimes and enforcement capacities. The ultimate impact of these challenges is that a large portion of regulations remain either un- or ambiguously- costed. Trebbi & Zhang, 2023.
242. Given these challenges, it is necessary to survey the field to identify different approaches to the quantification of regulatory costs. For the present study, it will be particularly important to identify approaches that will lend themselves to both survey-based research methods and the specific regulatory burdens inherent in product markets.
14.2 Cost of compliance/non-compliance
243. The most common approach is to examine the costs of compliance directly, either by attempting to quantify the ex-ante costs that businesses incur during efforts to meet regulatory requirements or the ex-post costs that they incur for failing to meet these requirements. Given the uneven nature of regulatory enforcement, mechanisms across different regulatory regimes (or over time within one regulatory regime) Siglitz, 2009, the former is likely to produce a more reliable measure than the latter Davis, 2016. To this end, both academic and industry specialists have devised a number of approaches to measure the costs that businesses incur while trying to ensure compliance and thus pre-empt any regulatory sanction. We explore several of the most relevant below.
14.3 Labour and administrative costs vs. expenditure and capital costs
244. Perhaps the most straightforward way to explore this subliterature as it relates to survey questionnaire design is to divide it between attempts to quantify the labour costs of regulatory compliance versus the amount of expenditure and capital cost that must be incurred to ensure compliance.
245. Of the two, the labour-cost approach has become increasingly popular in recent years (especially in studies of financial regulation), both due to a recognition that labour-based compliance costs are one of the primary components of regulatory compliance spending across advanced industrial economies and because of the inherent complexity of measuring changes to expenditure and investment Trebbi & Zhang, 2023; Simkovic & Zhang, 2020; Corlytics, n.d.. Relatedly, for present purposes, labour-based costs of compliance come with the added benefit of being relatively more straightforward for participants to engage with in survey-based research methodologies compared with approaches that attempt to measure capital and materials costs of regulation. This is because while labour costs can be derived from information that is readily available to corporate managers, estimating materials costs requires complex counterfactual estimation about how production processes/costs have changed due to regulation and how these changes interact with highly uncertain price fluctuations over time.
14.4 Quantifying the labour costs of product market regulation
246. The basic methodological approach to estimating labour costs (the specifics of which will vary from study to study) is to measure firms’ wage costs on compliance-related activities. This can be done either in aggregate or against total wage costs and add this to non-wage labour costs (such as pension contributions, healthcare costs, etc.). For instance, internal labour costs might include familiarisation processes, understood here as the number of hours and grade of staff that have to read and understand new regulations and requirements. Or they might include costs associated with more formal training processes (dissemination) in which the preparation of formal training programmes and briefing sessions demand time resources from both specialist compliance staff (trainers) and the staff that are learning new regulatory procedures (trainees).
247. Labour costs of regulatory compliance can also crop up throughout the production process. For instance, conformance costs (the costs associated with monitoring and ensuring that products and services conform to existing quality standards) will express themselves, in part, as labour costs Gilliland and Manning, 2002. Ensuring that a product conforms with regulatory standards (as well as non-regulatory quality standards) will involve a number of labour-based appraisal activities, such as audits, testing, inspection and review. Relatedly, there will also be administrative labour costs associated with monitoring and registering ongoing compliance. To this end, most regulations will impose informational obligations on regulated companies, which will translate into labour (and other costs) associated with collecting, safely storing, and (if requested) sharing information demonstrating regulatory compliance to government or other third parties OECD, 2014.
248. The most straightforward way of estimating these labour costs is by identifying the different tasks that a given company must undergo in the process of regulatory compliance, disaggregating the discrete contribution that each employee makes to these change processes, and tallying up the number of hours that each employee must commit to these processes multiplied by their average wages rates and indirect (non-wage compensation) costs to the firm. Data on wage rates can typically either be gathered by asking firms directly for wage rates and benefits costs or by estimating these labour costs by using industry-level data OECD, 2014.
249. Finally, in addition to a company’s internal labour costs that are attributable to regulatory compliance, external labour costs will frequently also have to be considered. This relates to the fact that, for most businesses, regulatory changes will require that they consult with external legal, accounting or other specialist services to ensure proper compliance at potentially significant cost (Regulatory Policy Committee, 2019). These are perhaps the easiest labour costs to quantify, as they can be measured directly by asking firms how much they paid for consulting services, information that should be readily available on company accounts.
Impact on our questionnaire design
We have included questions to break down internal time spent on familiarisation, formal and informal training, conformance (audits, reviews, quality assurance, etc.), and data management that result from the need to ensure regulatory compliance. To quantify these costs, participants are then asked to estimate the amount of time that employees at three different levels of seniority (production/administrative workers, professional staff and directors/senior management) spend on different tasks associated with regulatory compliance. These hours will then by multiplied by average wage rates for each category, which will be collected from participants at the end of the survey. We have also included questions to ask for costs of any external labour used (for instance, legal counsel, external auditing or training consultations). To account for the fact that labour costs can be both one-off (in response to a new or changed regulation) and ongoing throughout the regular production process, we will collect one-off vs. ongoing labour costs separately as required (with only businesses having incurred any one-off costs with the previous 5 years asked about these).
Questions on the above are demonstrated in the following survey sections: B (one-off costs of compliance); D (Labour costs of ongoing regulatory compliance); E (Ongoing external costs).
14.5 Expenditures and other investment costs
250. As mentioned above, a second approach to measuring regulatory costs is to examine the costs of compliance in terms of non-labour expenditure. To this end, Cordes et al. 2022, p. 6 identify pre-emptive compliance costs as those that include “capital investments necessary to meet regulatory requirements, changes in production processes or use of inputs, and/or ongoing operation and maintenance costs”. This process of pre-emptively uprating technologies to comply with regulatory standards (‘displacement’) is most frequently explored by the literature on environmental and financial regulation, but is applicable to all kinds of regulatory regimes Braden et al., 1987.
251. Similarly, expenditure and investment costs can also be understood using the language of conformance costs. Here, preventative conformance costs relate to those expenditures that are aimed at ensuring products or production processes are compliant with relevant regulations. For instance, in many cases, new regulations will come with a variety of equipment costs associated with the capital equipment that businesses purchase to ensure conformity.
252 The primary challenged associated with quantifying these costs arise from difficulties in separating regulation-induced investment from that associated with standard business operations. For instance, investment in new machinery might be catalysed by regulatory changes, but these investments also yield important productivity benefits to the company or might replace capital stock that has already depreciated appreciably. In such cases, while the regulation might well present some cost to the firm, separating regulation cost out from ‘normal’ operating costs will be difficult or impossible, even for individuals within the company itself [footnote 10]. Some studies attempt to estimate these costs (for instance, see OECD, 2014: p. 34), but doing so typically requires pre-selection of a relevant industry where recent and wide-spread capital improvements allow for a large degree of subsequent costs to be attributable to the regulatory change – a prerequisite that does not necessarily apply to the industries in question in the present study.
253. More relevant for present purposes is the rise of ‘RegTech’ as an increasingly significant feature of regulatory costs. Here, firms are embracing new technology solutions such as artificial intelligence and machine learning in order to (among other reasons) reduce the number of labour hours needed for compliance. Indeed, by some estimates RegTech spending has the potential to make up 50% of global compliance budgets by 2026. Estimating the costs associated with RegTech will depend on the time horizon that researchers choose to examine because while these technologies come with an upfront cost, their potential to ensure productivity-enhancing savings has the potential to produce savings in the medium- and long-term Compliance Digest, n.d.. Although RegTech is likely to be most impactful in the financial sector Barclays, 2023, it is likely to have an impact across all regulatory spaces and thus should be studied further when assessing costs in product markets.
254. Finally, materials costs represent perhaps the most relevant cost for a study of product market regulation. Materials costs are defined as “the incremental costs incurred in changing some of the material inputs used in the production process in order to ensure regulatory compliance” OECD, 2014: p. 38. Unfortunately, quantifying these costs presents significant challenges, especially for survey-based research. For one, like capital investment, it can be difficult for participants to separate out the cost of materials related to regulatory change from baseline operating costs. Further, accurate quantification requires researchers to compare existing market prices for different types of inputs and project these costs into the future. This can either be done by using current market prices as proxies for future prices, or by using advanced econometric techniques to try and estimate how a regulation might impact future prices OECD, 2014. Both, ultimately, are highly uncertain and run the risk of introducing significant margins of error into the analysis of overall costs.
Impact on our questionnaire design
We have included questions aimed at quantifying the costs of a number of regulation-induced investment expenditures. These include questions on costs that will be easiest for participants to identify and report.
Firstly, to quantify capital costs, participants that indicate being subject to a regulatory change at any point in the last five years are asked to provide estimates of both the upfront and annual ongoing costs associated with this change. However, as suggested above, quantifying the costs of materials and capital expenditure that are explicitly caused by regulation present unique challenges that make them difficult to capture in survey-based research. Thus, these questions will be monitored closely during the pilot stage and should be interpreted with caution.
We also ask questions about the costs associated with investment in new materials. To attempt to quantify materials costs we have taken an indirect approach by asking participants how the changes to the materials used in production have contributed to changes in overall production costs. This was determined to be the best approach to avoid the challenges associated with separating regulation induced costs from standard operating costs in a survey format.
Finally, we ask questions on compliance management and costs associated with expenditure on technologies aimed at assisting regulatory compliance (RegTech).
Questions on the above are demonstrated in the following survey sections: C (Capital and materials costs of OPSS regulatory compliance); H (Compliance management).
14.6 Costs of delay and uncertainty
255. Aside from the direct costs of regulation, there are important indirect costs associated with regulatory uncertainty. Although difficult to measure, these costs can be understood as those that arise as ambiguous regulatory statute, or ambiguity around future regulatory change, which can depress business activity. Here, studies have shown that regulatory uncertainty has the potential to impose opportunity costs, as businesses forgo investment and hiring opportunities, or decline to start new projects Cordes et al., 2022; Hasan et al.2019; Marcus, 1981. On the flip side, however, clearly-articulated regulatory regimes (in relation to environmental regulation) have been shown to reduce uncertainty and thus induce investment that might otherwise have failed to materialise Porter & Linde, 1995.
256. One limitation of uncertainty-based efforts to measure regulatory costs is a significant limitation in the capacity to quantify the ‘cost’ for forgone investment opportunities. The ‘true’ price of these opportunities will be highly speculative and dependent on a number of variables that are themselves uncertain. Thus, many of these studies e.g. Calomiris et al., 2020; Hasan et al., 2019 rely instead on text based approaches that examine various corporate statements to determine if investment opportunities have been forgone, but not how much these opportunities have cost the firms in question. As such, while there is some evidence that shifts in regulatory policymaking have increased cost of uncertainty and imposed a cost on firms in the form of foregone investment opportunities, there have been few successful efforts to measure these impacts quantitatively using survey-based approaches.
Impact on our questionnaire design
Quantifying the regulatory costs of delay and uncertainty presents a challenge in survey-based research. This is because assessing these costs requires participants to engage in speculative calculations about counterfactual costs and investment opportunities. As such, we do not recommend attempting to assess these costs quantitatively and instead include questions aimed at qualitatively capturing these impacts. Specifically, we include questions aimed to capture whether or not OPSS regulations have affected decisions around investment, hiring and future decision making more generally. These include questions about compliance management and confidence about ability to understand and comply with changing regulations. We also ask participants for feedback on how OPSS might reduce any costs identified with uncertainty.
Questions on the above are demonstrated in the following survey sections: F (Uncertainty).
14.7 Costs of non-compliance: Fines and fees
257. Perhaps the most direct costs of regulation are those associated with non-compliance. Most directly, these costs come in form of fines levied by regulators against firms that run afoul of regulatory standards. While most commonly associated with financial services and tech industries, given the headline-grabbing size of fines that are administered in these regulatory spaces – fines and the threat of fines represents a potentially significant concern for large and small businesses across any industry or regulatory jurisdiction Wu, 2024; Crain & Crain, 2023; Hoskins & Labonte, 2015.
258. In addition to the direct costs, non-compliance can also impose more indirect costs to business. These take the form of steps taken to proactively avoid sanctions when a business realises it is potentially in violation of a new or existing regulations. For product markets, the most significant of these indirect costs comes in the form of product recalls. The cost of a recall can be both significant and lasting, and will involve costs associated with the logistics of product recovery and destruction, manufacturing rework, lost sales and production disruptions Ravindranath, 2024; Thirumalai & Sinha, 2011.
Impact on our questionnaire design
To quantify the costs of fines for non-compliance we will ask participants if they have been fined or forced to recall products due to OPSS regulatory enforcement. If participants indicate the have been the subject of regulatory sanction, we will then collect information about the regulations that they were deemed to have violated and the ultimate cost of the sanctions imposed.
Questions on the above are demonstrated in the following survey sections: G (Cost of penalties and fines).
14.8 Distributional costs
259. Another indirect, but important, aspect of regulatory costs is the distributional cost imposed by a regulatory regime. This primarily relates to the disproportionate impact that regulatory burden might have on micro, small and medium businesses relative to their larger counterparts. Here, the fixed costs of regulatory compliance per unit of output will be much larger for smaller firms relative to large ones. Shapiro & Borie-Holz 2020, for instance, find that the administrative and staffing costs of regulatory compliance are particularly burdensome on small businesses. These concerns are further borne out by research on the American economy, where there is some evidence that regulatory burden per employee could be more than twice as high for small businesses than their larger counterparts Crain & Crain, 2023. This dynamic is likely to accelerate in the short term with the turn to RegTech, as the up-front costs of these technologies will be more easily borne by larger businesses. Schizas et al., 2009.
260. As such, it will be important for any attempt to quantify the costs of regulatory burden to account for the potential for maldistribution of burden across firm size.
Impact on our questionnaire design
In order to capture how businesses of different sizes experience the impact of OPSS regulation we have included a number of firmographic questions at the end of the survey. This will allow us to break down every answer in the survey based on firm size (defined either by the number of employees or by annual turnover) and identify statistical correlations between these size variables and experience with OPSS regulations.
Footnotes
-
These figures exclude businesses that did not know if they faced any costs. ↩
-
Due to the large number of relevant OPSS regulations this question was asked open-ended, as opposed to a read out list; therefore, respondents may have faced challenges recalling the details of specific regulations. ↩
-
Figure for Large businesses should be treated with caution due to the small number (24) of large businesses that took part in the research. ↩
-
New businesses were not asked about capital and material costs as it would not be possible to differentiate costs incurred specifically due to compliance with regulation from general set-up costs ↩
-
Turnover was collected within the survey as a banded variable. For the purpose of these calculations, the mean and median values have been divided by the midpoint of each band to calculate these percentages. This was not possible for the highest band because of the lack of an upper limit to calculate the midpoint from. These percentages should be treated as a rough approximation for illustrative purposes. ↩
-
Excluding those that said they faced costs but did not know what those costs were. ↩
-
This excludes businesses that were unsure whether they faced a cost. ↩
-
This is a commercially available database of UK businesses, similar to Dun & Bradstreet or Experian. Market Location uses AI and its own call centre to keep contacts up to date. ↩
-
Employer Skills Survey 2022-2024: methodology - Explore education statistics - GOV.UK ↩
-
A similar challenge exists for expenditures associated with regulatory compliance of ‘overhead costs’. These include the costs of “rent, office equipment, utilities and other inputs used by staff engaged in regulatory compliance activities”. Here again, the challenge of estimating overhead costs is that it is difficult to isolate these costs from standard operating costs, as it is likely that the office space and equipment will be available for employees doing compliance and non-compliance activities. As such, overhead costs are typically much easier to quantify in larger firms that are more likely to have corporate units assigned to regulatory compliance than in smaller counterparts that are more likely to ‘resource share’ across many different corporate functions. Given these challenges, adopting a benchmark for estimating overhead costs is seen the best way to estimate compliance costs in a way that is comparable across different firms. For instance, an Australian RIA manual suggests that overheads should be assumed to be equal to 50% of the direct wage costs attributable to regulatory compliance (OECD, 2014: p. 32). ↩