COVID-19 testing data: methodology note
Updated 21 August 2020

© Crown copyright 2020
This publication is licensed under the terms of the Open Government Licence v3.0 except where otherwise stated. To view this licence, visit nationalarchives.gov.uk/doc/open-government-licence/version/3 or write to the Information Policy Team, The National Archives, Kew, London TW9 4DU, or email: psi@nationalarchives.gov.uk.
Where we have identified any third party copyright information you will need to obtain permission from the copyright holders concerned.
This publication is available at https://www.gov.uk/government/publications/coronavirus-covid-19-testing-data-methodology/covid-19-testing-data-methodology-note
The Coronavirus cases in the UK: daily updated statistics page is no longer updated with daily statistics. We have consolidated publication of COVID-19 testing statistics to make it easier to find the latest data.
Statistics on deaths and COVID-19 cases will continue to be published daily on the COVID-19 dashboard. More detailed information on tests and testing capacity will be published weekly on the COVID-19 dashboard and will also be included in the weekly Test and Trace publication.
For the government’s past daily briefing data on COVID-19, please see the slides and datasets to accompany coronavirus press conferences.
Testing
Tests in the UK are carried out through a number of different routes:
- pillar 1: swab testing in Public Health England (PHE) labs and NHS hospitals for those with a clinical need, and health and care workers
- pillar 2: swab testing for the wider population, as set out in government guidance
- pillar 3: serology testing to show if people have antibodies from having had COVID-19
- pillar 4: blood and swab testing for national surveillance supported by PHE, the Office for National Statistics (ONS), and research, academic, and scientific partners to learn more about the prevalence and spread of the virus and for other testing research purposes, such as the accuracy and ease of use of home testing
See the government’s national testing strategy for more information on the different pillars.
These different routes are administered in different ways and that has an influence on how they are reported. Reporting is described in more detail below.
Coverage
Daily testing data published by DHSC covers the whole of the UK. Data is published by testing pillar.
Data sources
Several organisations feed data, from multiple sources, into the daily statistics on testing. The different data streams are collated centrally by DHSC.
Pillar 1 data for England is provided by the NHS and PHE, and data from the devolved administrations are provided by the Department of Health of Northern Ireland, the Scottish Government, and Public Health Wales.
Public Health Wales provide combined pillar 1 and partial pillar 2 data where tests are processed in NHS Wales labs.
Pillar 2 data for the UK (excluding Wales tests processed in NHS labs in Wales) is collected by commercial partners.
Pillar 3 data is provided for England by NHS England and Improvement (NHSEI).
Pillar 4 data is collected by the NHS, PHE, and individual research study leads for the UK.
Methodology
The number of tests made available
Tests in the UK are carried out through a number of different routes. Tests are measured and reported in different ways depending on the route and how they are administered.
The tests that are within the control of the central testing programme are counted when they are processed in our laboratories. For any tests that go outside the control of the central programme, they are counted when they leave the programme, for example, the tests that are mailed out to people at home and the tests that are sent out through satellite sites.
The length of time it takes for the results of tests to be processed and made reported varies depending on the testing route and the different processes involved. This means tests carried out on a particular day will not always be measured and reported at the same time.
How tests made available are counted
All tests in pillar 1 are counted at the point they are processed by a lab. Nose and throat swabs are counted together as one sample.
Tests in pillars 2 and 4 are administered in 2 different ways and therefore fall into 2 categories, those that are counted when they are dispatched and those that are counted when they are processed by a lab. As in pillar 1, pillar 2 nose and throat swabs are counted together as one sample. Pillar 4 tests, depending on the study, either counts swabs or blood samples.
Pillar 2 have now retired this metric (on 12 August 2020) and at the same time made a revision to the historic data that was made available going back to 29 March. These changes were made as a result of more accurate data becoming available.
Tests in pillar 3 are counted at the point when they are processed by a lab. Blood samples are taken and processed in laboratories.
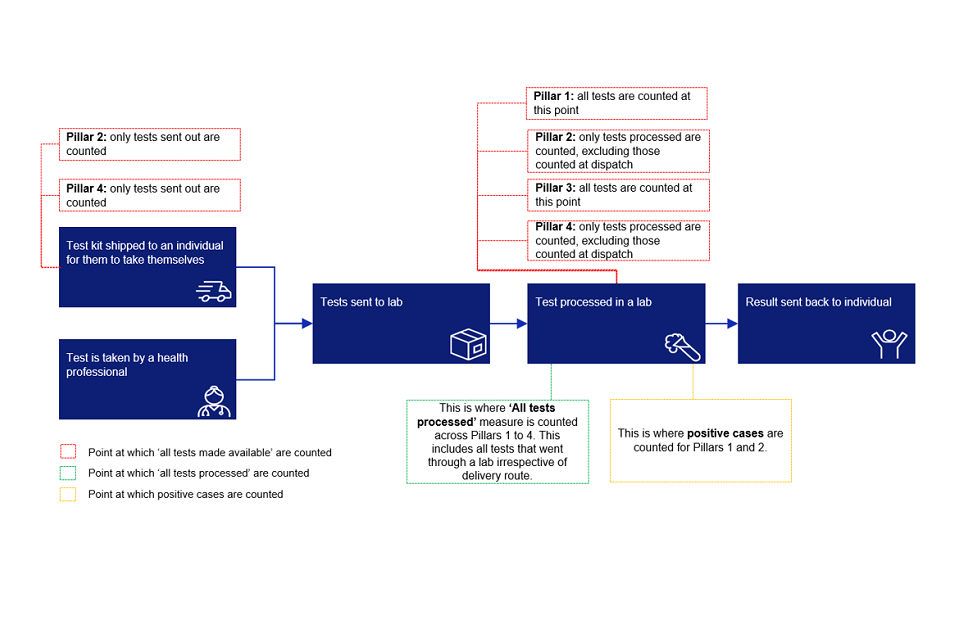
Figure 1: Typical testing process and results count
Tests processed through laboratories
These are counted at the time of processing in the laboratory and not when they are issued to people. Tests are never double-counted. This includes:
- all tests under pillar 1 and pillar 3
- ‘in-person’ testing routes under pillar 2, for example, tests carried out at the mobile testing units and the drive-through and walk-through regional testing sites
- ‘tests processed’ under pillar 4, for example, tests carried out as part of surveillance testing either where they are administered by health care professionals employed by the research programmes or where blood donations to the NHS Blood and Transfusion service are processed and tested for COVID-19
Tests sent to individuals at home or to satellite testing locations
These are counted when tests are dispatched and not at the time of processing in the laboratory. Tests are never double-counted. This includes:
-
‘delivery’ testing routes under pillar 2, for example, swab tests carried out at satellite testing centres (NHS trust locations and care homes), and home swab testing kits delivered by post
-
‘delivery’ testing routes under pillar 4, for example, tests carried out as part of surveillance testing where they are administered by individuals, rather than health care professionals employed by the central programme
Not all tests that are sent out to individuals at home or carried out at satellite locations are returned back to the labs.
Following the historic revisions to pillar 2 data, this figure is now reported separately.
The number of tests processed
We have also started publishing an ‘all tests processed’ measure, which counts all tests that have remained within the control of the programme (and were counted at the time of when it was processed in labs) and those that have been sent out and subsequently returned to be processed in a lab.
All tests processed are counted irrespective of testing channel. These figures are taken from the labs processed data.
The ‘all tests processed’ measure is lower than ‘all tests made available’ for a number of reasons, including:
- tests sent out may take longer to return and be processed through a lab
- some tests do not get returned at all, for example if they are spoilt
- some tests are returned without the individual having registered the test kit to themselves and cannot be processed
We’re always working on reducing the prevalence of these last 2 issues.
Wales submit testing data for pillars 1 and some of pillar 2 tests processed in NHS Wales labs, which are reported under pillar 1. Testing of samples of Welsh residents undertaken outside of NHS Wales labs is now being reported under pillar 2. However, as mentioned above, some of the testing which in other countries would be regarded as pillar 2 testing is reported under pillar 1 testing for Wales when it relates to samples processed in NHS Wales labs.
Adjustments to the historical ‘tests made available’ data
An adjustment of -1,308,071 has been made to the historic data for the ‘tests made available’ metric.
The adjustments have been made as a result of more accurate data collection and reporting processes recently being adopted within pillar 2 and a subsequent recalibration of the data we reported between 29 March 2020 and 11 August 2020.
These new data processed identified tests that had previously not been readily identifiable at the labs processing stage, and tests that had been sent out by a testing channel on behalf of another channel.
This resulted in a double-counting of test kits that had been dispatched and which had not been removed from the labs processed data.
In identifying this data pillar 2 established that fewer in-person tests had been conducted than originally reported, and more tests had been sent to NHS trusts and care homes than originally reported.
Pillar 4 studies
Testing in this pillar is designed to understand the spread of the virus and the reliability of different testing methods. There are several studies being run at the moment, including:
PHE P4 serological study
This is a weekly serology testing of blood samples obtained from existing sources that will provide baseline data source of the population presenting with antibodies. Weekly reports published by PHE can be found on their website.
ONS COVID-19 Infection study
This is a study using a representative population sample that uses repeat household visits to establish the prevalence of symptomatic and asymptomatic COVID-19 infection, the prevalence of COVID-19 antibodies and how this antibody response varies over time.
Data from weekly reports released by ONS can be found on the ONS website
UK Biobank
This study using a fixed cohort of 20,000 registered with UK Biobank who self-administer capillary blood samples that are analysed for antibody levels once a month for 6 months to establish levels of asymptomatic infection, population seroprevalence, the strength of the immune response and how this varies over time.
REal-time Asessment of Community Transmission (REACT) REACT-1
This is a study to establish baseline prevalence of infection at the end of lockdown and provide reference data. Initial study had approximately 120,000 people swabbed over one month, with additional information collected on demographics, occupation and symptoms to assess an infection point prevalence at national and local levels.
REACT-2
This is a study to determine prevalence of antibodies at end of June and hence provide reference data. This initial study involves around 100,000 people taking a finger prick antibody test in their own home.
Care homes
This is a major study focussed on infection prevalence, transmission and mitigation factors across England where residents and carers undergo repeat blood and swab tests whilst care home managers take part in a telephone survey.
Schools
This is a small pilot focusing on serology and swab tests of children and staff that is collecting data from up to 100 schools from across England to better understand rates of transmission.
Vivaldi 1 has been conducted earlier and counted under pillar 2.
The number of people tested
The number of tests is not the same as the number of people tested. For clinical reasons, some people are tested more than once. Therefore, the number of tests will be higher than the number of people tested.
There are several valid reasons why some individuals may be tested more than once, including:
- regular testing of health and care workers
- individuals who have the virus, test positive, and have a subsequent test to see if they can return to work
- participation in early trials comparing healthcare professionals administered tests with self-administered tests, resulting in two results on the same day
- participation in research studies conducting routine tests on the same people each month
- some tests may come back as ‘void’ and a retest would be issued
- individuals with early symptoms who test negative, develop more symptoms and are retested and found to be positive
People tested figures are published as part of the weekly Test and Trace publication. Many people are retested multiple times for valid reasons, such as regular testing of health and care workers over several months.
The ‘people tested’ measure was initially used to avoid counting one person tested several times in a short space of time. It does not reflect the volume of tests carried out each week, especially given the importance of regularly testing workers in social care settings. We’re publishing tests processed which shows the number of tests we have results for.
Positive cases
COVID-19 cases are identified by taking specimens from people and sending these specimens to laboratories around the UK to be tested. If the test is positive, this is referred to as a lab-confirmed case. Confirmed cases only report on cases tested positive so this is likely to undercount the total number of cases across the UK. Cases in people who have not been tested are not included in the confirmed case counts.
We’ve updated the methodology of reporting positive cases on 2 July to remove duplicates within and across pillars 1 and 2, to ensure that a person who tests positive is only counted once. To remove these instances, we have moved to a new data source and re-examined the records. This means the figures are not directly comparable with the figures previously reported. Methodologies between nations differ and we will be making future revisions to align approaches as much as possible across the 4 nations.
If a person has both a negative and a positive test, then only their positive test will be counted. If a person is tested as positive under both pillar 1 and pillar 2, then only the first positive case is counted.
Pillar 1 and 2 UK
There are separate reporting processes for each of the four nations of the UK. England, Northern Ireland and Scotland each provide data based on tests carried out in NHS (and PHE) laboratories. These represent ‘pillar 1’ of the government’s mass testing programme. Wales provides data based on tests carried out in NHS laboratories. This includes ‘pillar 1’ and partial ‘pillar 2’, as part of the mass-testing programme in Wales is carried out by NHS labs. Wales separately publishes pillar 2 data returned by commercial partners processing the samples outside of NHS labs.
Combined counts from the 4 nations give daily and total (cumulative) count of lab-confirmed cases.
Pillar 1 and 2 England
The laboratory surveillance system where pillar 1 and 2 results are recorded de-duplicates by running a complex algorithm to identify whether several reports relate to the same individual. A range of different identifiers are utilised in this process, such as NHS Number, surname and forename, hospital number, date of birth and postcode. There is a small percentage of records where NHS Number is not provided (and cannot be retrieved by comparison with information held on the patient’s summary care record) or individual information is incomplete or missing. This means that some repeat tests may still be included in counts of positive cases.
Positive cases are deduplicated within pillar 1 and 2 separately as well as across pillars. Where an individual gets tested under both pillars, the first positive record is taken and recorded to ensure an individual is only counted once. This means that pillar 1 positive cases and pillar 2 positive cases may be undercounted due to the removal of duplicates across pillars.
Pillar 1 and 2 Scotland and Northern Ireland
Scotland and Northern Ireland have their own methodologies for processing tests and identifying individuals. Similar to the England testing methodology, positive cases are deduplicated within and across pillars 1 and 2. For Scotland, where an individual is tested in both pillars, only the first positive record will be counted. For Northern Ireland, the latest positive record would be counted. Further details are available on the Scottish government website and the Northern Ireland government website.
Pillar 1 and 2 Wales
Wales also has its own methodology for processing tests and identifying individuals. Positive cases for Wales are currently deduplicated at patient-episode level for tests processed in NHS Wales labs (pillar 1 plus some of pillar 2). Wales has recently also included this de-duplication step for tests processed by commercial partners. This has only recently started and figures presented here will be subject to additional revisions in the next 1 to 2 weeks. This is due to the incorporation of this testing data from non-NHS Wales laboratories, and data processing to improve the quality of our data sources. As such, results may vary on a day-to-day basis as the changes are fully incorporated. The Welsh testing time series published on GOV.UK will be revised when the cleaned data are available.
Wales currently deduplicates records based on a 42-day patient episode window. This is deduplicated by running a complex algorithm to identify whether several reports relate to the same individual. A range of different identifiers are utilised in this process, such as NHS Number, surname and forename, date of birth and postcode. There are a small percentage of records where NHS Number or individual information is incomplete or missing. Where this information cannot be completed using information from the Welsh Demographic Service there’s the possibility that some repeat tests may still be included in counts of positive cases.
As Wales data is deduplicated on 42-day episodes, if someone is tested twice, 43 days apart, they will be included in this measure twice.
Further details are available on the Public Health Wales website.
Pillars 3 and 4
We do not report positive cases for tests in pillars 3 and pillar 4 studies aimed at antibody testing. The aim of pillars 3 and 4 is to understand the spread of the disease in the community, as well as the efficacy of different testing methods, rather than how many people are testing positive for COVID-19 each day (pillars 1 and 2). All tests in pillar 3 and some tests in pillar 4 test for the presence of antibodies, not the presence of the virus itself.
It is a legal requirement that all positive cases for presence of the virus are reported to Public Health England, irrespective of pillar. As such, when pillar 4 research studies (for antigen testing) identify positive cases, Public Health England are notified and this data flows into the Surveillance system. This means that currently all positive cases identified by pillar 4 surveillance studies (for antigen testing) are captured under pillar 1 or 2.
Time series of testing data
The testing figures page on GOV.UK includes a ‘time series’ section, which provides testing data going back to late March. This includes, number of tests and positive cases.
Cases by date of reporting is included in the ‘time series of testing statistics’ CSV file. This shows positive cases under the old methodology, where some duplication was present due to retesting. From 2 July 2020, positive cases under the new methodology is provided, which deduplicates cases within and across pillars. Figures between the old and new methodology are not directly comparable.
A fully deduplicated time series of positive cases is published and updated regularly by date of when the swab was taken. This is available in the ‘time series of positive cases by specimen date’ CSV file. This includes positive cases for England, Scotland and Norther Ireland. Wales data will be supplied in due course.
Date of reporting
The testing figures published daily on GOV.UK on the number of positive cases are shown by reported date (when the tests were processed through the labs and reported to DHSC). This will include tests for which the swab was taken from a few days ago.
The fully deduplicated time series will report positive cases processed through the labs by the date of when the swab was taken. This means the figures in this time series will not match the figures previously reported in the tables.
This approach of reporting for positive cases over time is consistent with the COVID-19 dashboard of positive cases by region and local authority area. See further detail on the dashboard data.
Historic data revisions
Daily totals reflect actual counts reported for the previous day. Each day there may be corrections to previous reported figures, for example, where labs (or studies under pillar 4) returned the results late or duplicates were identified and removed. This means that previously published daily counts will not necessarily sum to the latest cumulative figure. It also means that today’s cumulative count may not match the previous day’s cumulative count plus today’s daily count.
Data is provided daily from several different electronic data collection systems and these can experience technical issues which can affect daily figures, usually resulting in lower daily counts.
If the quality of source data improves, there may be further revisions to historic time series. If this does occur, the rationale and impact of these revisions will be clearly highlighted.
Timelines
A time series of daily testing data is updated each day.
The early parts of these series include some historical data revisions and series backdating as administrative systems were being developed at the time. This means that individual figures will not necessarily align with what was published at the time in the daily tweet or on GOV.UK.
Different pillars started testing at different stages, and therefore a full time series of testing data is not available across all pillars and nations.
The testing time series include data from 21 March 2020 onwards.
Timings
Activity stamps
The testing statistics published each day refer to despatching and processing activity on the previous day. However, they do not refer to consistent time stamps across pillars and devolved administrations.
For pillar 1 testing statistics refer to activity between:
- midnight and 11:59pm for England
- 9am and 9am for Northern Ireland
- 8am and 8am for Scotland
- 1pm and 1pm for Wales
For pillars 2, 3 and 4, testing statistics refer to activity between midnight and 11:59pm on the previous day. For pillar 2 positive cases for Wales there is a 1pm to 1pm window for data entering the systems used by Public Health Wales to extract the relevant data for Wales.
Capacity
Coverage
Lab capacity statistics cover the whole of the UK and are published by pillar. It is not possible to split capacity data by country or region as tests are not necessarily processed in the same place the sample is taken.
Data sources
Daily capacity estimates are made locally by the labs themselves and fed into DHSC by pillar leads.
Methodology
COVID-19 tests are processed in several separate labs. Projected lab capacity is an estimate of each lab’s constrained capacity each day based on the staff, chemical reagents and other resources it has available.
The labs provide their testing capacity estimates to the individual pillars each day. Estimates are collated centrally, and an updated time series is published weekly. For each pillar, capacity relates to the following labs:
- pillar 1 capacity – projected lab capacity for NHS, PHE and Roche labs for England and lab capacity from Devolved Administrations.
- pillar 2 capacity – projected lab capacity in the Pillar 2 network, including labs in Northern Ireland, Glasgow, Manchester, Milton Keynes and Cambridge
- pillar 3 capacity – projected current capacity to process serology tests to show if people have antibodies from having had COVID-19
- pillar 4 capacity – projected lab capacity for the Oxford University laboratory (COVID 19 infection Study, Biobank Seroprevalence Survey and an element from the care homes study), Eurofin lab capacity for Ipsos MORI swab tests
Swab tests from the ONS COVID-19 Infection Survey are counted under pillar 4 testing statistics. However, as they are processed by pillar 2 labs, capacity for these tests is included under pillar 2.
Pillar 4 capacity fluctuates over time due to the nature of the research studies that it comprises. These research studies will run for a fixed period of time.
These definitions cover the capacity to process the tests outlined under ‘Tests processed through our laboratories’ and those ‘delivery’ testing routes under pillars 2 and 4 that are processed through the labs. They do not cover the count of tests despatched via ‘delivery’ testing routes under pillars 2 and 4.
Given the time lag and return rates for home and satellite tests, on occasion more tests are despatched than lab capacity on a given day. This could mean that the capacity number is slightly lower than total number of tests.
Timelines
A time series of daily capacity data is published each week.
Different pillars started testing at different stages, and therefore a full time series of testing capacity is not available across all pillars and Nations. The testing time series include data from 21 March onwards.
Notes on interpreting daily data
Although some data is being reported daily, direct comparisons of change should not be made between weekdays and weekends/bank holidays. Some testing streams do not provide any tests on weekends or bank holidays, and others may have constrained capacity at these times.
Related statistics
This document provides methodology information about testing data. We also publish daily figures on deaths involving COVID-19, for those with a positive lab confirmed test, including detailed notes about those statistics, at Number of coronavirus (COVID-19) cases and risk in the UK.
Testing statistics are also published in other places, including the COVID-19 dashboard, which is updated daily. This shows positive cases at local authority level by date of when the swab was taken rather than when it was processed through a lab.
You can also view slides, datasets and transcripts from the press conferences at 10 Downing Street in response to coronavirus.
Devolved administrations also publish testing data. This may not align exactly with DHSC published data due to different time stamps or backdated revisions. Testing data and methodology of devolved administrations are available here: