Climate scenario analysis: internal data collection
Published 7 September 2026

© Crown copyright 2026
This publication is licensed under the terms of the Open Government Licence v3.0 except where otherwise stated. To view this licence, visit nationalarchives.gov.uk/doc/open-government-licence/version/3 or write to the Information Policy Team, The National Archives, Kew, London TW9 4DU, or email: psi@nationalarchives.gov.uk.
Where we have identified any third party copyright information you will need to obtain permission from the copyright holders concerned.
This publication is available at https://www.gov.uk/government/publications/climate-scenario-analysis-internal-data-collection/climate-scenario-analysis-internal-data-collection
Robust climate scenario analysis relies on high quality internal data to support risk management, decision making, and reporting. This guide is particularly relevant for public sector bodies using scenario analysis to meet Task Force on Climate-related Financial Disclosure (TCFD)-aligned climate reporting requirements, as it draws heavily on the TCFD-aligned disclosure application guidance published by HMT (“application guidance”).
Under the application guidance, detailed scenario analysis is required where climate is a principal risk, or where it is otherwise material to your organisation. The depth of analysis and data collection should be proportionate to your organisation’s exposure and the materiality of climate-related risks and opportunities.
Knowing what data you need and where it sits in your organisation is often the hardest first step. Information relevant to climate-related risks can be fragmented across multiple teams, held in different formats with varying levels of quality and completeness.
This guide helps you:
- Define what you need
- Identify existing internal sources and systems
- Map what data you have, and
- Identify and address data gaps
The goal is not a perfect dataset on day one, but a coherent, decision-useful evidence base that can be refined over time as your capabilities mature.
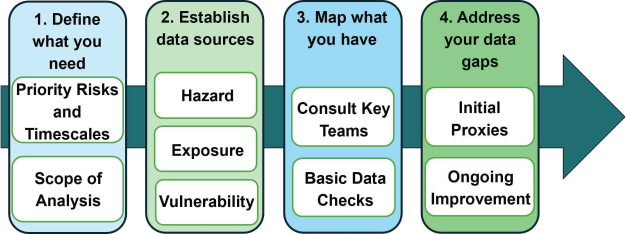
Credit: GAD
1. Define what you need
Start by defining what you want the climate scenario analysis to inform and the timeframes you intend to cover, including the 2050s as a mandatory requirement. This sets the scope of your analysis and targets your data search, ensuring the outputs can be integrated into your organisation’s broader risk management framework. See Getting started with climate scenario analysis for more information on setting an appropriate scope.
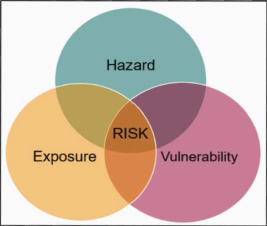
To assess climate-related risks under any chosen scenario, you need to understand which climate hazards matter to your organisation, where and how you are exposed to those hazards, and how vulnerable your assets and operations are. Being explicit about these three dimensions – hazards, exposure, and vulnerability – will help you create a clear list of data items. This will make it easier to engage with internal teams and ask for specific information that will meaningfully improve your climate scenario analysis.
Credit: GAD
HAZARD refers to the potential occurrence of climate-related physical events or trends that may cause damage and loss. Physical hazards can include extreme weather events such as floods and storms. Transition hazards can include sudden shifts in policy, carbon pricing or technology - for example, a new regulation that affects your energy costs or supply chain.
EXPOSURE indicates the presence of assets, services, resources and infrastructure that could be adversely affected. These will be unique to an organisation based on its operations and infrastructure.
VULNERABILITY is the propensity or predisposition of assets and / or operations to be adversely affected. Vulnerability may also change over time, for example if allowing for expected adaptation / risk mitigation measures.
Top tip: Alongside the hazard-exposure-vulnerability framework, agree early what “impact” means for your organisation by tracing the pathway from each hazard through to its potential impacts. These pathways may not always result in direct financial impacts. Consider the operational impacts (such as service disruption, reduced capacity, safety issues) as well as the wider outcomes (such as harm to vulnerable groups, failure to meet statutory duties, lower resilience to shocks). Linking to your organisation’s existing risk management approach will make it easier to compare and prioritise climate-related risks consistently with other risks across your organisation.
2. Establish data sources
To build a useful picture of hazards, exposure, and vulnerability, you will need data from multiple parts of the organisation. Relevant data is rarely held in one place. Where you can source external data will depend on your budget and resources. For the main data types, the table below sets out what to collect, where to find it, and what to watch out for.
| Data type | What to collect | Where to find it | Watch out for | |
|---|---|---|---|---|
| Hazard | - Climate metrics (temperature, rainfall intensity, flood levels) | - Met Office observed data (HadUK-Grid) and future projections (UKCP18) - Specialist data providers are also available |
Site location data must be able to link to external hazard layers - this may require specialist support. | |
| Exposure | - Site location (postcode and boundary) -Asset inventory (item, function and who relies on it) - Measure of criticality (critical, important or routine) - Dependencies (power, telecommunications, water and transport) - Operations profile (operating hours and seasonal peaks) |
- Internal asset registers - Estates systems and operations data - Ordnance Survey or local authority data to confirm locations |
Data is typically quantitative and location-specific. Maintain a single, controlled data catalogue and master dataset for key fields, with clear links back to source systems. This simplifies audit trails and makes data extraction more straightforward. |
|
| Vulnerability | - Building details (age, type, materials and use) - Existing protections (defences against floods, heatwaves and storms) - Past damage and repairs (date, type, duration and impact) - Resilience measures (backup power, IT recovery and alternative access) - Operational thresholds (such as a site closing above a specified temperature or a road becoming blocked above a specified level of rainfall) |
- Internal assessments - Insurer records - Government guidance - Engineering or regulatory standards - Internal incident logs |
Data is often a mixture of quantitative and qualitative information. Where bespoke site reviews are needed, prioritise key sites and the highest risks first. |
Top tip: Turn your data needs into a simple checklist. For each dataset, note the minimum detail required, where it comes from, how complete and accurate it needs to be, how often it should be updated, and who owns it.
3. Collect what you have
Ask teams across the organisation to list what data they already hold, even if it is not labelled as “climate” data. Much of what you need will already be held in day-to-day systems and records but stored in different places and potentially different formats.
When requesting data, specify the exact output format and structure (fields, definitions, units, validation rules) and the required file type (e.g. CSV or .xlsx) to streamline collection and avoid inconsistencies.
The table below shows examples of where data may be held. This is not an exhaustive list and the range of data held may be bespoke to your organisation.
| Function/team | Examples of relevant information they may hold |
|---|---|
| Risk | Risk registers, risk management frameworks (including governance frameworks), risk appetite statements and risk management guidance |
| Finance | Insurance claims, costs linked to disruption or repairs, asset valuations (especially in climate-exposed locations) |
| Operations | Operational records and operating limits, service constraints, incident and near-miss logs, seasonal demand patterns, energy and water consumption data |
| Estates & asset management | Asset inventories, condition surveys, maintenance records, site drawings/plans, flood risk assessments and drainage surveys, energy performance certificates, lease and tenure data |
| Procurement & supply chain | Critical supplier lists, contract dependencies, delivery routes, service level agreements |
| HR & business continuity | Staffing impacts, remote working capability, continuity plans, alternative sites |
| Sustainability | Adaptation actions, previous climate risk assessments, climate reporting disclosures and metrics, net zero and decarbonisation plans, Scope 1, 2 and 3 emissions data, nature and biodiversity assessments |
| Policy, programme & delivery | Demand and caseload data, service performance records, programme dependencies, critical national infrastructure links, impact assessments |
| Digital, commercial & analytical | IT system dependencies, commercial contracts, management information, statistical datasets, geographic/spatial data |
Top tip: Check data quality early so you don’t build up analysis on unreliable records. Focus on key fields such as location, asset IDs and dates, and make sure categories are used consistently. Standardise formats so you can link internal records to external hazard data – for example, by using consistent postcodes or coordinates.
4. Address your data gaps
Use proxies to get started (and document them)
Use simple proxies, such as 1-5 scores, or red/amber/green ratings for vulnerability or criticality. Where possible, align scoring bands with those already used across the organisation so results are comparable.
For each proxy, record what you used, why you chose it, when it was applied, and the level of uncertainty.
Start with the essentials: location (an exposure factor), criticality, and a basic vulnerability rating.
Improve data collection for future cycles
Set clear ownership: appoint one person to oversee climate data collection and assign owners for each priority risk area (based on climate risk and/or existing organisational risk management governance structures). Data on climate-related risks should be regularly shared with the team or committee that manages your organisation’s risk register, where relevant.
Agree on the key exposure and vulnerability fields, especially for priority sites. Where possible, track financial and operational impacts of climate-related events and update incident templates so they record whether a hazard contributed.
Use standard templates across teams to keep data consistent.
Top tip: Over time, keep a central store of scenario relevant data and build data on incidents and impacts to track how risk exposure changes over time. Compare actual impacts and costs with scenario results to refine assumptions over time and improve future decisions. Refresh the dataset routinely to keep it accurate and current.
Key takeaway
You do not need perfect data to start climate scenario analysis, but you do need consistent, high quality internal records, clear ownership and a process for handling gaps. By building improvements into routine data capture each scenario cycle becomes quicker, more robust and better tailored to your department. This supports effective decision making, risk management and clear, consistent TCFD-aligned disclosures over time.
GAD can explain how to follow this process and help maximise efficiencies using your organisation’s internal data. For information on how to contact GAD, go to our website or reach out to our email address: climate.change@gad.gov.uk.