Arts - Taking Part Survey 2019/20
Published 16 September 2020
Applies to England

© Crown copyright 2020
This publication is licensed under the terms of the Open Government Licence v3.0 except where otherwise stated. To view this licence, visit nationalarchives.gov.uk/doc/open-government-licence/version/3 or write to the Information Policy Team, The National Archives, Kew, London TW9 4DU, or email: psi@nationalarchives.gov.uk.
Where we have identified any third party copyright information you will need to obtain permission from the copyright holders concerned.
This publication is available at https://www.gov.uk/government/statistics/taking-part-201920-arts/arts-taking-part-survey-201920
The Taking Part survey is a continuous face to face household survey of adults aged 16 and over and children aged 5 to 15 years old in England. This chapter summarise results from adults (16+) and their participation in arts from the 2019/20 survey, which ran from April 2019 to March 2020.
Differences between groups are only reported on in this publication where they are statistically significant i.e. where we can be confident that the differences seen in our sampled respondents reflect the population [footnote 1].
1. Arts engagement
In 2019/20, 76% of respondents had engaged with the arts at least once in the last 12 months. This proportion is the same as in 2005/06 (76%). In 2017/18, the two arts engagement questions (attendance and participation) were changed to make them easier for respondents to answer and therefore caution should be exercised when comparing data with previous years.
Figure 1.1: Proportion of respondents who had engaged with the arts in the last 12 months, 2005/06 to 2019/20
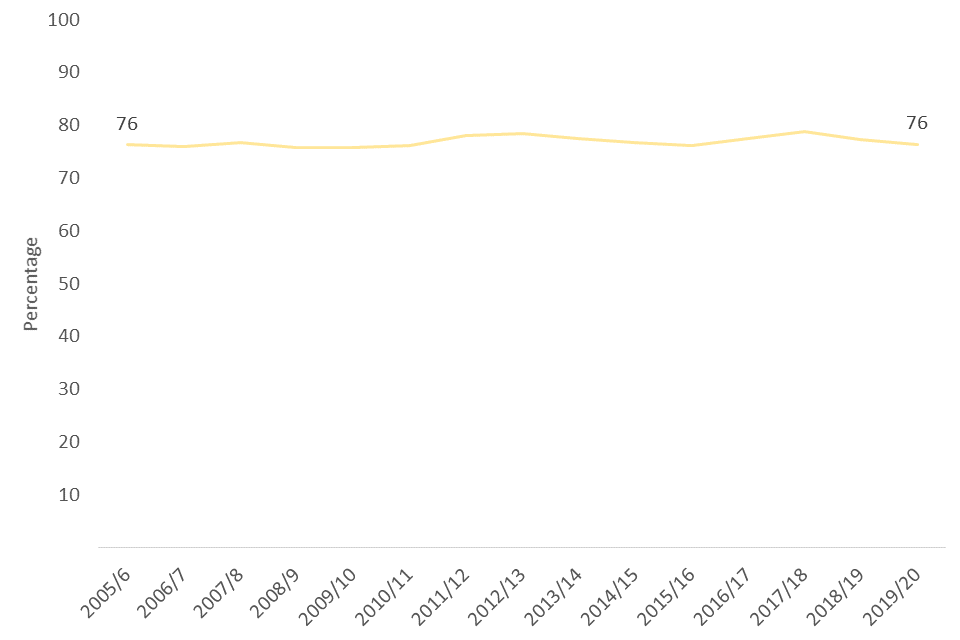
Percentage of respondents who have engaged in arts in the last 12 months, 2005/6 – 2019/20
In 2019/20, an estimated 61% had engaged with the arts three or more times in the last 12 months and 24% had not engaged at all. In between these extremes, 9% had engaged once and 7% twice in the 12 months prior to interview.
Figure 1.2: Frequency of engagement with the arts in the last 12 months, 2018/19 and 2019/20
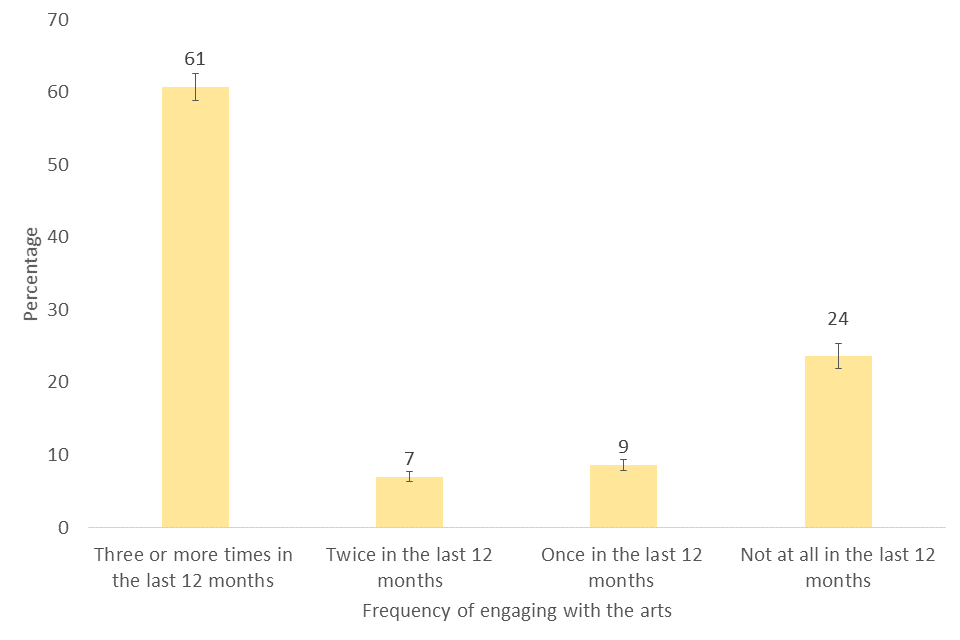
Frequency of engaging with the arts in the last 12 months, 2019/20
Respondents who did not attend arts events were asked why they did not. The most common reasons given were not being interested (43%), not having time (31%) and having a health problem or disability (21%). These were also the three most commonly reported barriers to participating in arts activities.
Figure 1.3: The five most common barriers reported by respondents to attending arts events in the last 12 months, 2019/20
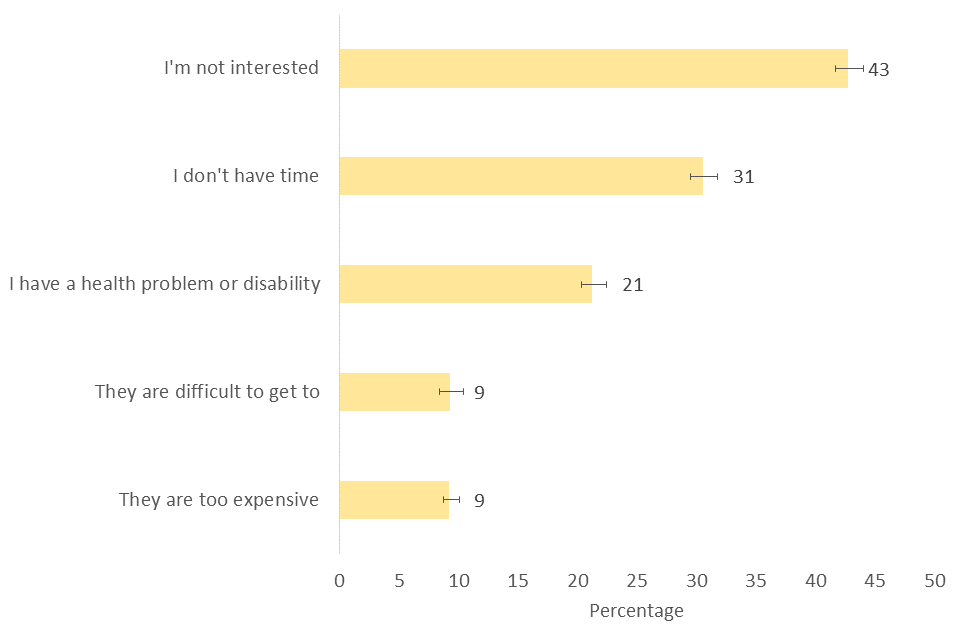
Bar chart showing the most common barriers for attending arts events, 2019/20
2. Digital Participation in Arts
Respondents were asked if they had looked at a website or used an app related to the arts. In 2019/20, 28% of respondents reported having done so, a significant increase from 2018/19 (24%).
Respondents were asked for their reasons for visiting an arts website or app. In 2019/20, the most common reasons were to find out more about an event (75%), find out more about an artist or performer (53%), and buy tickets for an arts performance or exhibition (51%).
The reason ‘to view or download part or all of a film’ showed an increase in popularity from 19% in 2018/19 to 24% in 2019/20.
Figure 1.4: Five most common reasons for visiting an arts website in the last 12 months, 2019/20
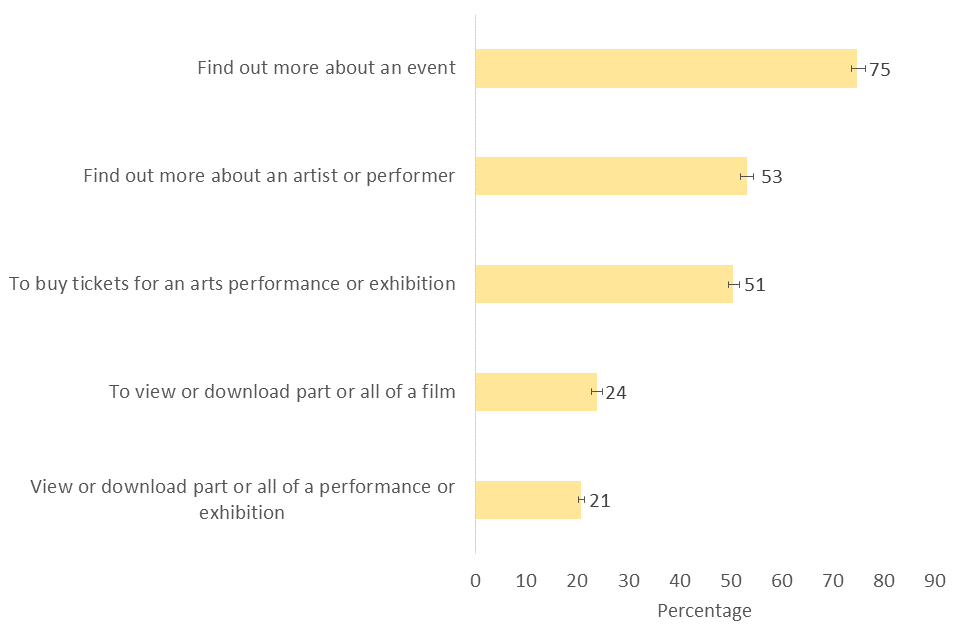
Bar chart showing the most common reasons for visiting an arts website, 2019/20
Respondents were also asked if they had created music, artistic photos, films or videos and uploaded these to the internet in the last 12 months. Of those who had played an instrument or written music in the past 12 months and had internet access, 21% had created and uploaded music in 2019/20, a significant increase from 2018/19 (14%).
Of those who had taken photos in the past 12 months and had internet access, 76% had created and uploaded photos. Of those who had internet access and created film/video in the past 12 months, 71% had uploaded this media.
Figure 1.5: Proportion of respondents who have created digital content and uploaded to the internet, 2019/20
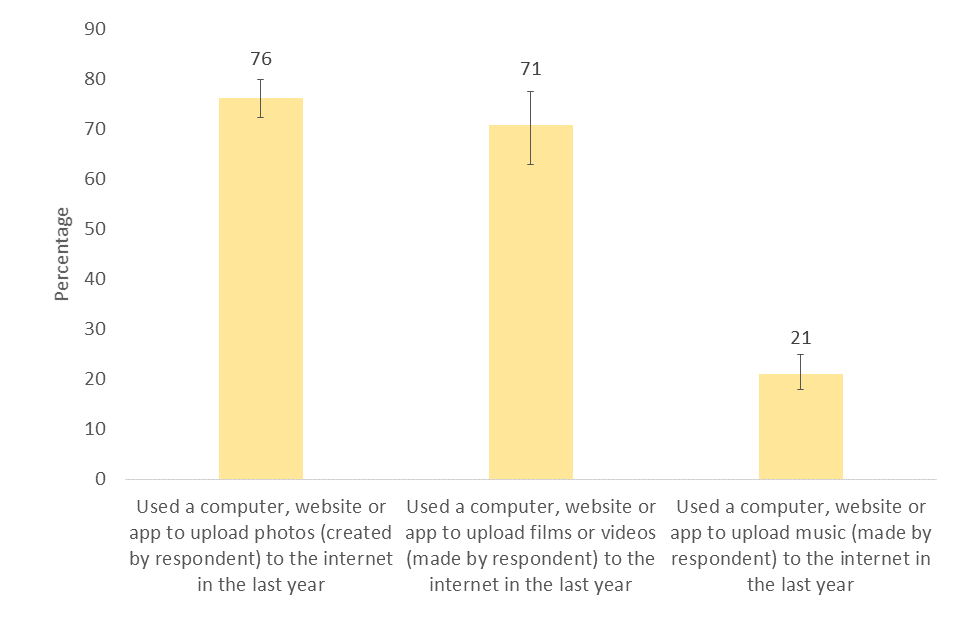
Bar chart showing, out of those who had created photos/videos/music, the proportion of respondents who had uploaded them to the internet, 2019/20
3. Video games and eSports
Playing video games as a free time activity was reported by 26% of respondents, with 42% of these respondents playing video games at least once a day.
Respondents were also asked about engagement and participation in eSports, i.e. professionally organised computer or video game tournaments. In 2019/20, 7% of respondents reported having watched a professionally organised computer or video game tournament online in the last year and 1% had played in a professionally organised computer or video game tournament online in that period.
4. Volunteering in arts
An estimated 8% of respondents reported having volunteered in a sector connected with the arts in the past 12 months. For headline statistics on volunteering please see results from DCMS’ Community Life Survey.
5. Who engages with the arts?
Respondents with different characteristics have different patterns of engagement with the arts.
Examining engagement with the arts by age group, findings showed that in 2019/20 those aged 75 years or older were the least likely to have engaged with the arts (64%) compared to all other age groups (73-81%).
Figure 1.6: Proportion of respondents who have engaged with the arts in the last 12 months by age group, 2019/20
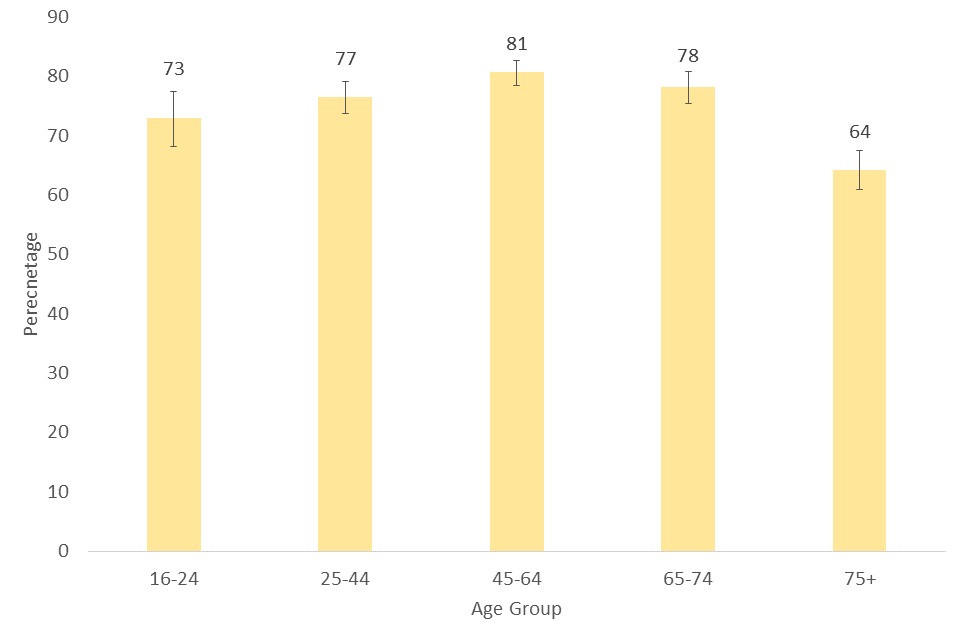
Percentage of respondents who have engaged in arts in the last 12 months by age, 2019/20
Of those living in the 10% most deprived geographic areas [footnote 2], 59% reported having engaged with the arts at least once in the past 12 months whilst this was 83% for those living in the 10% least deprived areas.
Figure 1.7: Arts engagement in the last 12 months by Index of Multiple Deprivation decile, 2019/20

Percentage of respondents who have engaged in arts in the last 12 months by Index of Multiple Deprivation, 2019/20
In 2019/20, those of White or Mixed ethnicity were more likely to have engaged with the arts (78-81%) than those of Black or Asian ethnicity (61-63%). This trend is similar to that observed in 2018/19.
Figure 1.8: Arts engagement in the last 12 months by ethnicity, 2019/20
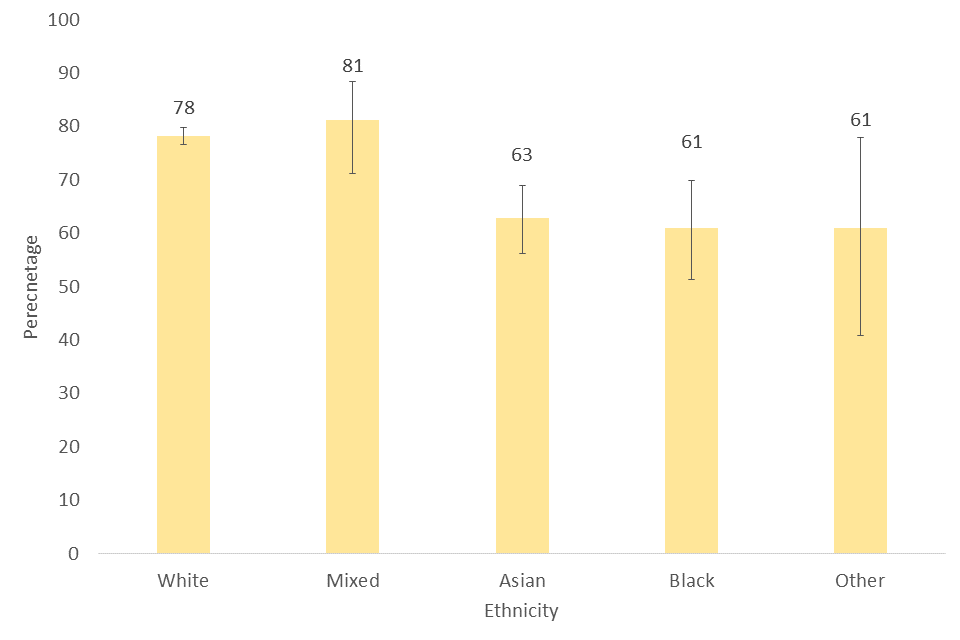
Percentage of respondents who have engaged in arts in the last 12 months by ethnicity, 2019/20
Arts engagement rates differ between regions. Respondents from the East of England (82%) or South West (87%) were more likely to have engaged than those from the North East, North West or London.
Figure 1.9: Arts engagement in the last 12 months by region, 2019/20
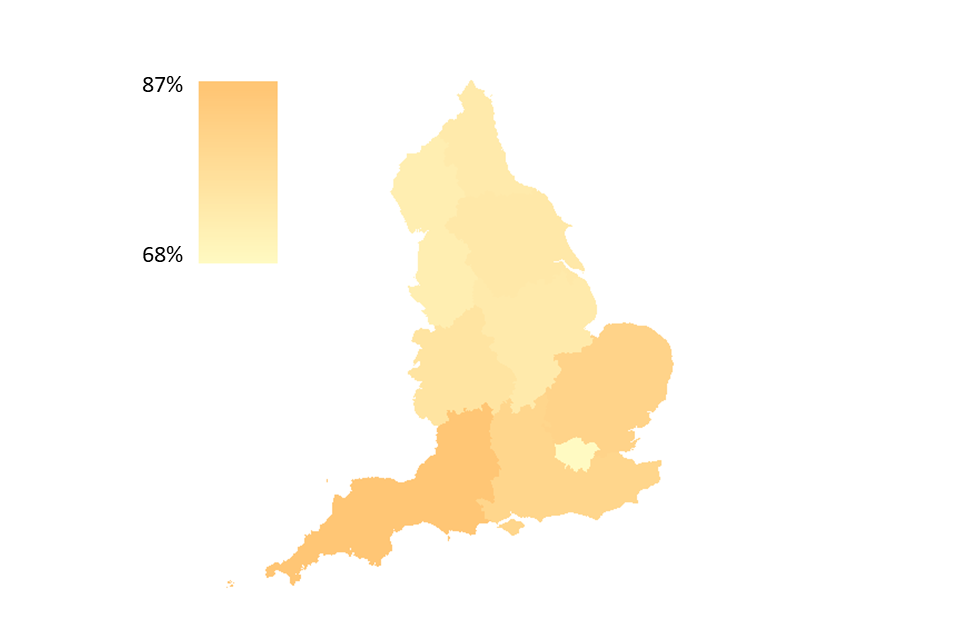
Percentage of respondents who have engaged in arts in the last 12 months by region, 2019/20
In 2019/20, men were less likely than women to report having engaged with the arts once or more in the past 12 months – 73% compared with 79%, respectively. Since data collection began in 2005/06, the trend has always been for men to be less likely than women to report having engaged in the arts.
In 2019/20, no significant difference was found between the percentage of respondents engaging with the arts between those with (76%) or without (77%) a long-term illness/disability. This compares with an estimated difference of 9 percentage points between those with and those without a long-term illness or disability in terms of arts engagement in 2008/09, suggesting that this disparity has narrowed over the last 11 years. This narrowing is interesting given that having a long-term health problem or disability was found to be the third most common barrier against engaging with the arts.
The survey collects information on socio-economic status [footnote 3]. In 2019/20, a smaller proportion of those with intermediate occupations reported having engaged with the arts at least once in the past 12 months compared with those with higher managerial, administrative and professional occupations, 77% compared with 87%.
Further demographic data
- In 2019/20, those living in rural areas (84%) were more likely to engage in the arts once or more in the last 12 months than those in urban areas (74%). This difference has been seen in all years since 2005/6. Though there are likely more opportunities to engage with the arts in urban areas, it could be that other socio-demographic differences mean people in rural areas are more likely to seek out and engage with arts than those in urban areas.
- Homeowners were more likely (81%) to have engaged in arts in the last 12 months than those in the social rented sector (60%) or private rented sector (74%).
- A smaller proportion of those not working engaged with arts (72%) than those working (80%).
-
The 95% confidence intervals are indicated by error bars on the charts. They show the range that we are 95% confident the true value for the population falls between. When there is no overlap between the error bars for two or more groups, we can be more confident that the differences between groups represent true differences between these groups in the population ↩
-
The Index of Multiple Deprivation, commonly known as the IMD, is the official measure of relative deprivation for small areas in England. It is calculated using several measures such as income deprivation, crime and living environment deprivation. The Index of Multiple Deprivation ranks every small area in England from 1 (most deprived area) to 32,844 (least deprived area), which we have sorted into deciles for this publication. ↩
-
Using National Statistics Socio-economic classification (NS-SEC), respondents were categorised as being in one of three groups – Higher managerial, administrative and professional occupations; Intermediate occupations; Routine occupations. The NS-SEC classifies people depending on their employment. For more information see Annex B. ↩