Self-Employment Income Support Scheme statistics: December 2021
Published 16 December 2021

© Crown copyright 2021
This publication is licensed under the terms of the Open Government Licence v3.0 except where otherwise stated. To view this licence, visit nationalarchives.gov.uk/doc/open-government-licence/version/3 or write to the Information Policy Team, The National Archives, Kew, London TW9 4DU, or email: psi@nationalarchives.gov.uk.
Where we have identified any third party copyright information you will need to obtain permission from the copyright holders concerned.
This publication is available at https://www.gov.uk/government/statistics/self-employment-income-support-scheme-statistics-december-2021/self-employment-income-support-scheme-statistics-december-2021
Overview
This publication covers all 5 grants for the Self-Employment Income Support Scheme (SEISS) administered by HM Revenue and Customs (HMRC). Data used is up to 28 October 2021. The information presented includes:
- age of claimants
- gender of claimants
- sector of self-employment activity
- geography
- claim and income bands
This release is classified as Experimental Statistics as the methodologies used to produce the statistics are still in their development phase. As a result, the data are subject to revision. These statistics have been produced quickly in response to developing world events.
The Office for Statistics Regulation, on behalf of the UK Statistics Authority, has reviewed them against several key aspects of the Code of Practice for Statistics and regards them as consistent with the Code’s pillars of Trustworthiness, Quality and Value.
Contact details
For queries or feedback on this publication, please email:
For press queries, please contact HMRC Press Office:
Main findings
- £28.1 billion has been paid in grants in total (up to 28 October 2021). Across the 5 grants, 2.9 million individuals have received a grant and 10.4 million total grants have been claimed
- Of the 2.9 million individuals that claimed at least one grant, 1 million individuals claimed all 5 grants. 1.6 million individuals claimed each of the first 4 grants
- 7.4 million claims (71%) have been made by 2.0 million male claimants (71%) worth £21.6 billion (77%) across the 5 grants. 3.0 million claims (29%) have been made by 0.9 million female claimants (29%) with a total value of £6.5 billion (23%) across the 5 grants
- Over 0.7 million individuals (25%) aged between 45 and 54 made 2.7 million claims (26%) worth £7.3 billion (26%). This is the age group with the largest number of claims but is only slightly higher than individuals aged 35 to 44, and individuals aged 55 to 64
- Take-up rate across each grant has been lowest for individuals aged 65 and over, however they have the highest average value of claims at £3,100 per claim compared to £2,700 per claim for the whole population
- The average value per claim for the first grant was £2,900 and this was the highest of all 5 grants. The average claim for the third and fourth grant was £2,800. The first, third and fourth grants all offered grants worth 80% of average trading profits
- The average value per claim for the second and fifth grants was £2,500 and £2,300, respectively. The second grant was worth 70% of average trading profits. For the fifth grant, individuals could claim either 80% or 30% of 3 months’ average trading profits. The size of the grant was determined by comparing turnover from the pandemic year with turnover from either the 2019 to 2020 or the 2018 to 2019 tax year, known as the reference year. 29% of fifth grant claims were for the lower grant amount. This explains why the second and fifth grant average claim values were lower than the other grants
- Take-up rates dropped from 77% for the first grant to 58% for the fourth grant. The fourth grant allowed some individuals that were previously ineligible to claim for the first time. However, this group had a significantly lower take-up rate than the rest of the population. The take-up rate for the fifth grant dropped to 38%
- The 2 regions with the largest number of claims were London and South East, where 1.0 million individuals claimed 3.6 million grants worth £10.2 billion, reflecting the size of their populations. These 2 regions represent 35% of the total number of claims across the 5 grants. Northern Ireland had the highest regional take-up rate (82%) for the first grant, but the lowest regional take-up rate (32%) for the fifth grant, alongside Wales
- The sector with the highest number of claims overall is the construction industry, with just under 1.0 million individuals making 3.5 million claims worth £11.5 billion. This represents around 34% of the total number of claims across the 5 grants
- The largest group (industrial sub-sector) by number of claims is ‘construction of residential and non-residential buildings’, with over 1.7 million claims by 470,000 individuals worth £5.5 billion across the 5 grants. Over 400,000 individuals who have made nearly 1.5 million claims cannot be matched to a sector
- 42% of claimants for the fifth grant reported that their turnover had fallen by 50% or more between their reference year and the pandemic year, making 529,000 claims worth £1.4 billion. 11% of claimants reported an increase or no change in turnover, claiming 140,000 grants worth £140 million. Overall, around 365,000 (29%) fifth grant claims are for the 30% grant and nearly 900,000 (71%) claims are for the 80% grant
About this release
The Self-Employment Income Support Scheme (SEISS) provided support for self-employed individuals whose business had been affected by coronavirus (COVID-19). Applications for the first grant opened 13 May 2020 and applications for the fifth and final grant closed 30 September 2021. Data used is up to 28 October 2021.
The first grant was open for claims from 13 May 2020 to 13 July 2020 for individuals who had been impacted by Coronavirus. The second grant could be claimed from 17 August 2020 to 19 October 2020. The third grant was open for claims between 30 November 2020 and 29 January 2021. Businesses had to be impacted by coronavirus between 1 November 2020 and 29 January 2021 to claim this grant.
The fourth grant opened for claims on 22 April 2021 and run to 30 May 2021. Businesses had to be impacted by coronavirus between 1 February 2021 and 30 April 2021 in order to claim the grant. The fifth grant could be claimed between 29 July 2021 and 30 September 2021 by those who had been impacted by coronavirus between 1 May 2021 and 30 September 2021.
The data used in this release covers those self-employed individuals that claimed at least one of the 5 grants. This data has been matched with other HM Revenue and Customs (HMRC) data to present breakdowns of claims by:
• age and gender
• industrial sector of the economy
• geography
• claim and income bands
Further information on each of the 5 grants can be found in the Background to the SEISS section.
The tables that accompany this publication can also be accessed on HMRC coronavirus (COVID-19) statistics page on gov.uk.
1. Total SEISS grant claims
2.9 million individuals have claimed at least one of the 5 grants. In total, £28.1 billion has been claimed across 10.4 million total claims. Figure 1 shows the number of claims and the number of individuals that claimed a grant.
Figure 1: Number of claims and number of individuals that claimed a SEISS grant
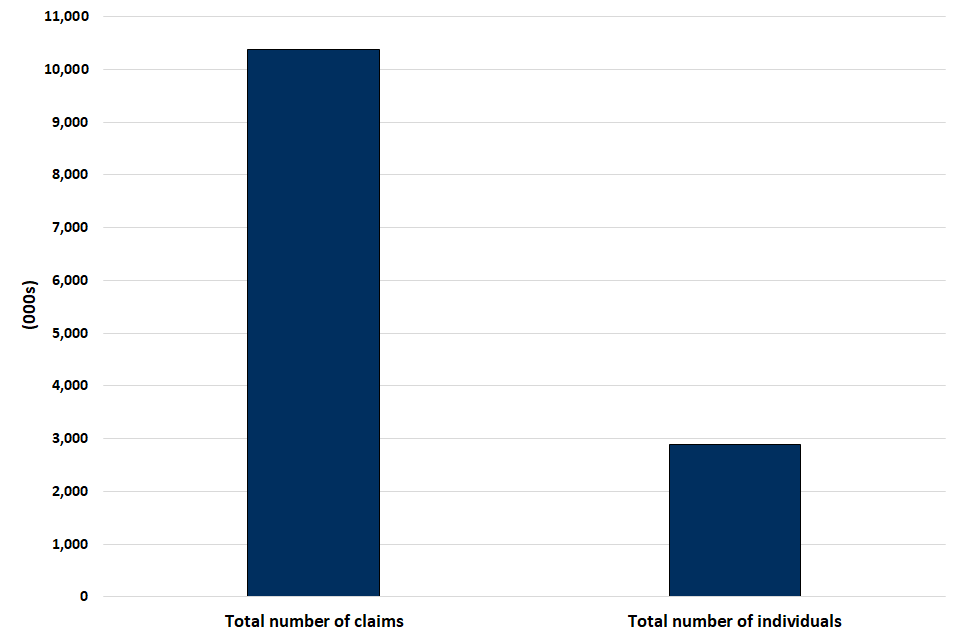
Table 1: Number and value of claims, and number of individuals claiming each grant12
| Grant | Total no. of claims (000s) | Total value of claims (£m) | Average value of claims (£) | Take-up rate |
|---|---|---|---|---|
| First grant | 2,610 | 7,591 | 2,900 | 77% |
| Second grant | 2,351 | 5,931 | 2,500 | 69% |
| Third grant | 2,194 | 6,219 | 2,800 | 65% |
| Fourth grant | 1,958 | 5,518 | 2,800 | 58% |
| Fifth grant | 1,262 | 2,846 | 2,300 | 38% |
| All grants | 10,374 | 28,105 | 2,700 | - |
| Total number of individuals | 2,897 | 28,105 | 9,700 | - |
Notes:
- The lower average claim for the second grant is largely a result of grants being paid out at 70% of an individual’s 3 months’ average trading profits, rather than 80% as for the first, third and fourth grants
- The fifth grant also has a lower average claim due to some claimants receiving the 30% lower grant instead of the 80% higher grant
Around 5 million individuals reported income from self-employment for the tax year 2018 to 2019, and had their data assessed for potential eligibility for the first 3 grants. This led to 7.2 million claims by 2.7 million individuals for the first 3 grants with a total value of £19.7 billion.
Eligibility for the first 3 grants required an individual to have levels of income which met specific tests on:
- their 2018 to 2019 tax year income
- the combination of income for consecutive tax years 2016 to 2017, 2017 to 2018, and 2018 to 2019 where available
Additional eligibility guidance was introduced for the third grant. To be eligible an individual must have been eligible for the first 2 grants and declare that they intended to continue to trade and either:
- were actively trading but impacted by reduced demand due to coronavirus
- were previously trading but were temporarily unable to do so due to coronavirus
For both the fourth and fifth grants, there were 3.2 million claims by 2.0 million individuals with a total value of £8.4 billion.
Eligibility for the fourth and fifth grants was based on a customer’s tax returns for either:
- the 2019 to 2020 tax year income
- an average of the consecutive tax years 2016 to 2017, 2017 to 2018, 2018 to 2019, and 2019 to 2020 if a customer was not eligible based on 2019 to 2020 alone
With 2019 to 2020 tax returns assessed for the first time, some individuals could claim a grant that were previously unable to do so. These individuals were described as either:
- previously ineligible, meaning they were assessed for the third grant, but did not meet the criteria for eligibility, for example because their trading profit was less than their non-trading income
- newly self-employed, meaning they traded for the first time in 2019 to 2020 and did not trade in any of 2016 to 2017, 2017 to 2018 or 2018 to 2019
Around 500,000 people were brought into scope who either became self-employed in tax year 2019 to 2020; or were ineligible for previous grants but became potentially eligible for the fourth and fifth grants based on having submitted their 2019 to 2020 tax return.
The take-up rates for the fourth and fifth grants among individuals who were newly self-employed or previously ineligible for the third grant is lower than the full population.
To claim the fifth grant, individuals had to compare their pandemic year turnover with that from tax year 2019 to 2020 or tax year 2018 to 2019, their reference year. If turnover in the pandemic year decreased by 30% or more compared to the reference year, the higher 80% grant could be claimed. Otherwise, individuals were eligible for the lower 30% grant. Newly self-employed individuals were exempt from the turnover test and were able to claim the higher grant.
Of the 1.3 million individuals who made a successful claim:
- 29% received the lower grant, with an average claim of £1,100
- 71% received the higher grant, with an average claim of £2,700
2. SEISS grants by gender
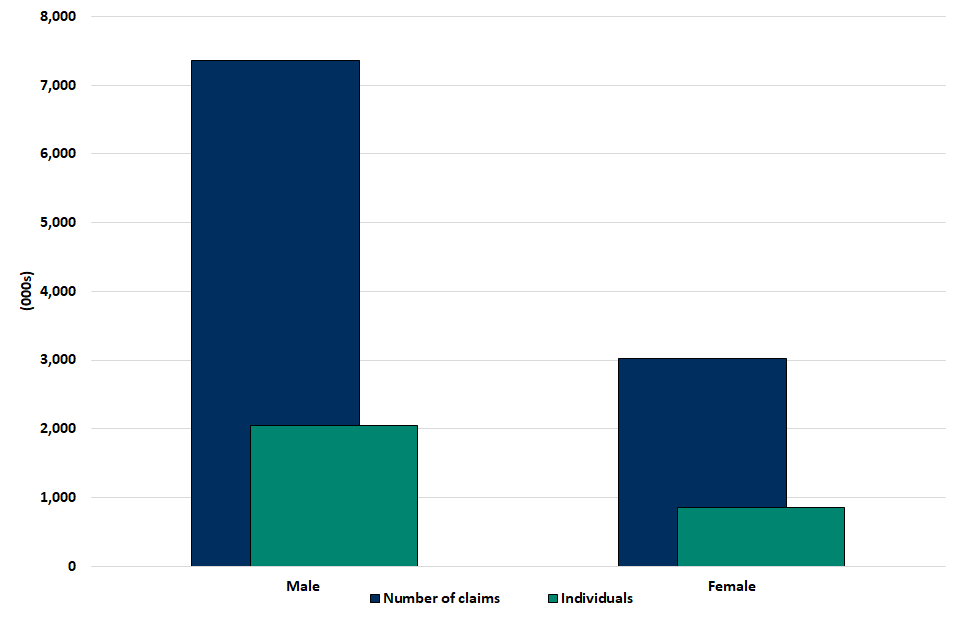
Figure 2 and Table 2 shows the number of claims and the number of individuals that claim for each grant by gender. Table 3 shows claim values by gender.
Of 2.9 million individuals that claimed one or more grant, male claimants make up around 71% and make up the same proportion (71%) of the total number of claims.
HMRC received 7.4 million claims from male claimants totalling £21.6 billion compared to 3.0 million claims from female claimants for £6.5 billion. Male claimants had higher take-up rates than female claimants across all grants and the average value of all claims made across all 5 grants by male claimants (£2,900) was higher than the average for female claimants (£2,100).
Figure 2: Number of claims and number of individuals that made a claim for each grant up, by gender
Source: HMRC SEISS linked to Self Assessment taxpayer information
Table 2: Number of claims for each grant, by gender
| Gender | Number of individuals (000s) | First grant (000s) | Second grant (000s) | Third grant (000s) | Fourth grant (000s) | Fifth grant (000s) |
|---|---|---|---|---|---|---|
| Male | 2,044 | 1,847 | 1,666 | 1,560 | 1,381 | 900 |
| Female | 852 | 762 | 685 | 633 | 577 | 361 |
| All | 2,897 | 2,610 | 2,351 | 2,194 | 1,958 | 1,262 |
Table 3: Value of claims for each grant, by gender
| Gender | First grant (£m) | Second grant (£m) | Third grant (£m) | Fourth grant (£m) | Fifth grant (£m) |
|---|---|---|---|---|---|
| Male | 5,848 | 4,567 | 4,810 | 4,235 | 2,151 |
| Female | 1,740 | 1,362 | 1,407 | 1,282 | 695 |
| All | 7,591 | 5,931 | 6,219 | 5,518 | 2,846 |
Figure 3: Take-up rates for each grant, by gender
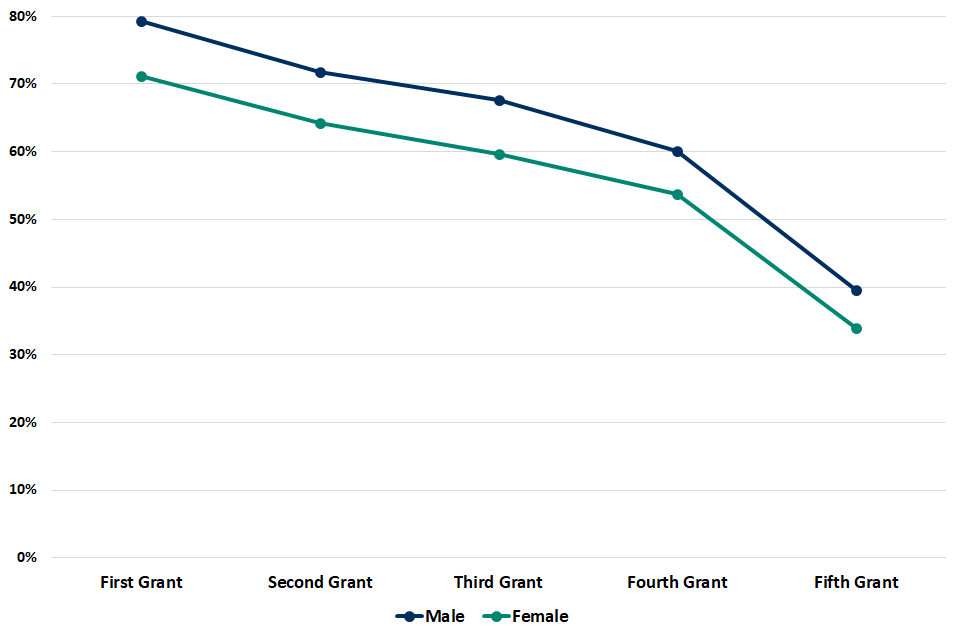
Table 4: Take-up rate for each grant, by gender
| Gender | First grant take-up rate | Second grant take-up rate | Third grant take-up rate | Fourth grant take-up rate | Fifth grant take-up rate |
|---|---|---|---|---|---|
| Male | 79% | 72% | 68% | 60% | 40% |
| Female | 71% | 64% | 60% | 54% | 34% |
| All | 77% | 69% | 65% | 58% | 38% |
3. SEISS grants by age group
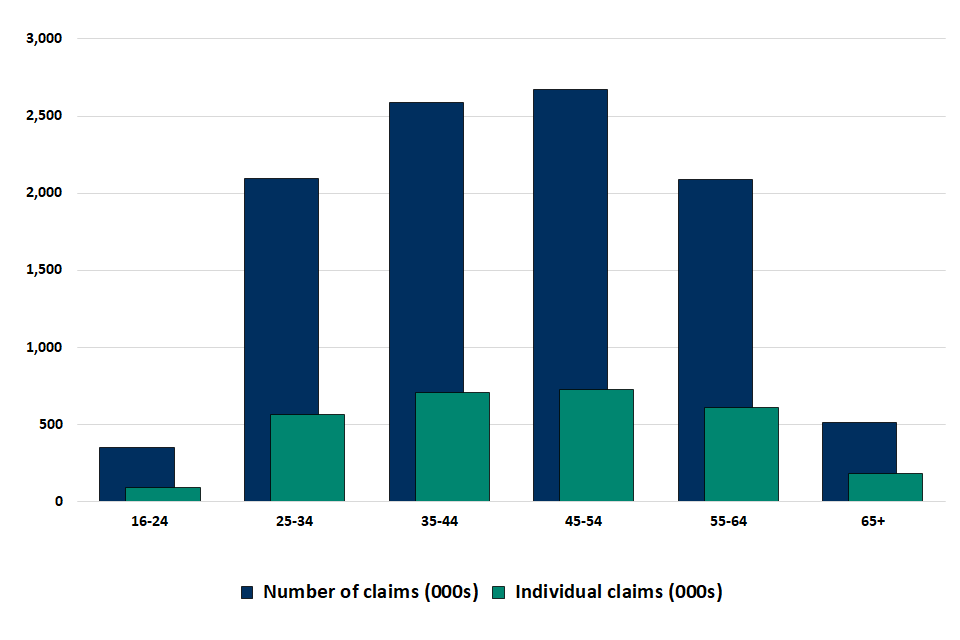
Figure 4 and Table 5 show the number of claims and the number of individuals that made claims across all 5 grants by age group. Table 6 shows claim values by age group.
Around 89% of individuals who claimed grants were between the ages of 25 and 64, with 91% of the value of claims coming this age group. Take-up of the grant in these age-groups was at or above 77% for the first grant and at or above 34% for the fifth grant.
The take-up rate was noticeably lower for those who are aged 65 and over (62% for the first grant and 25% for the fifth grant), although they had the highest average claim value across all 5 grants at £3,100. The youngest age group (16 to 24) have the lowest average claim value at £2,000.
Figure 4: The number of claims and number of individuals that made a claim across all 5 grants, by age group123
Source: HMRC SEISS linked to Self Assessment taxpayer information
Notes:
- Age is calculated as at 13 May 2020 for the first, second and third grant
- Age is calculated as at 22 April 2021 for the fourth and fifth grant
- There is missing age information for 21,000 individuals and 72,000 claims
Table 5: Number of claims and individuals, by age band12
| Age band | First grant (000s) | Second grant (000s) | Third grant (000s) | Fourth grant (000s) | Fifth grant (000s) | Number of individuals (000s) |
|---|---|---|---|---|---|---|
| 16-24 | 89 | 82 | 76 | 60 | 40 | 91 |
| 25-34 | 515 | 477 | 448 | 391 | 264 | 564 |
| 35-44 | 633 | 581 | 546 | 497 | 332 | 707 |
| 45-54 | 679 | 610 | 570 | 498 | 318 | 726 |
| 55-64 | 539 | 471 | 437 | 398 | 241 | 607 |
| 65+ | 136 | 114 | 101 | 100 | 59 | 180 |
| Missing | 18 | 16 | 15 | 14 | 8 | 21 |
| All | 2,610 | 2,351 | 2,194 | 1,958 | 1,262 | 2,897 |
Notes:
- Age is calculated as at 13 May 2020 for the first, second and third grant
- Age is calculated as at 22 April 2021 for the fourth and fifth grant
Table 6: Value of claims, by age band12
| Age band | First grant (£m) | Second grant (£m) | Third grant (£m) | Fourth grant (£m) | Fifth grant (£m) |
|---|---|---|---|---|---|
| 16-24 | 188 | 150 | 160 | 129 | 67 |
| 25-34 | 1,471 | 1,187 | 1,258 | 1,102 | 581 |
| 35-44 | 1,840 | 1,469 | 1,554 | 1,422 | 753 |
| 45-54 | 2,001 | 1,556 | 1,631 | 1,401 | 716 |
| 55-64 | 1,587 | 1,199 | 1,248 | 1,116 | 557 |
| 65+ | 451 | 328 | 325 | 310 | 154 |
| Missing | 53 | 41 | 43 | 38 | 18 |
| All | 7,591 | 5,931 | 6,219 | 5,518 | 2,846 |
Notes:
- Age is calculated as at 13 May 2020 for the first, second and third grant
- Age is calculated as at 22 April 2021 for the fourth and fifth grant
Figure 5: Age distribution of claims, by grant12
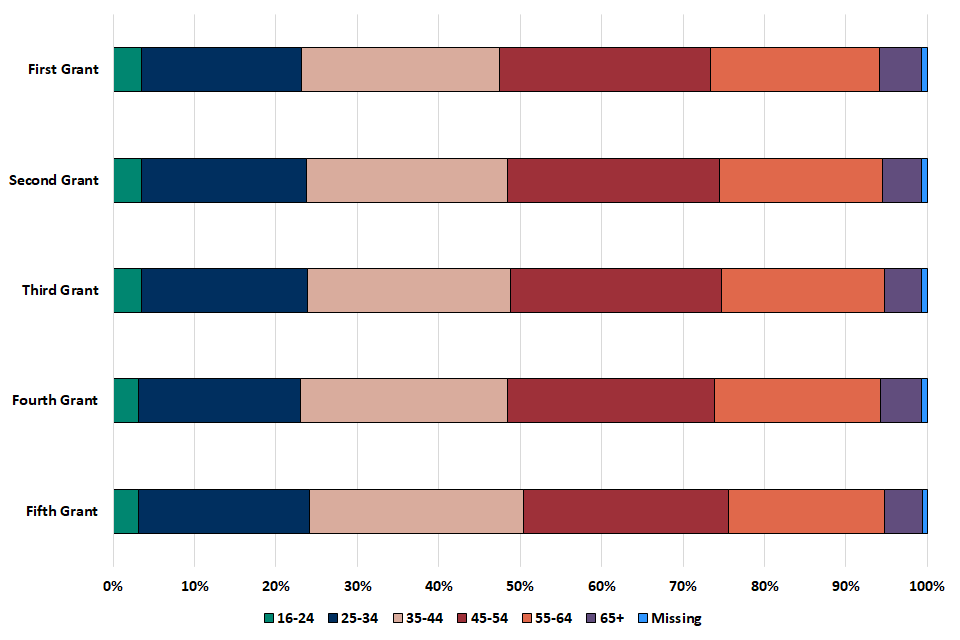
Notes:
- Age is calculated as at 13 May 2020 for the first, second and third grant
- Age is calculated as at 22 April 2021 for the fourth and fifth grant
Table 7: Proportion of claims for each grant, by age band12
| Age band | First grant | Second grant | Third grant | Fourth grant | Fifth grant |
|---|---|---|---|---|---|
| 16-24 | 3% | 3% | 3% | 3% | 3% |
| 25-34 | 20% | 20% | 20% | 20% | 21% |
| 35-44 | 24% | 25% | 25% | 25% | 26% |
| 45-54 | 26% | 26% | 26% | 25% | 25% |
| 55-64 | 21% | 20% | 20% | 20% | 19% |
| 65+ | 5% | 5% | 5% | 5% | 5% |
| Missing | 1% | 1% | 1% | 1% | 1% |
Notes:
- Age is calculated as at 13 May 2020 for the first, second and third grant
- Age is calculated as at 22 April 2021 for the fourth and fifth grant
Figure 6: Take-up rates for each grant, by age band12
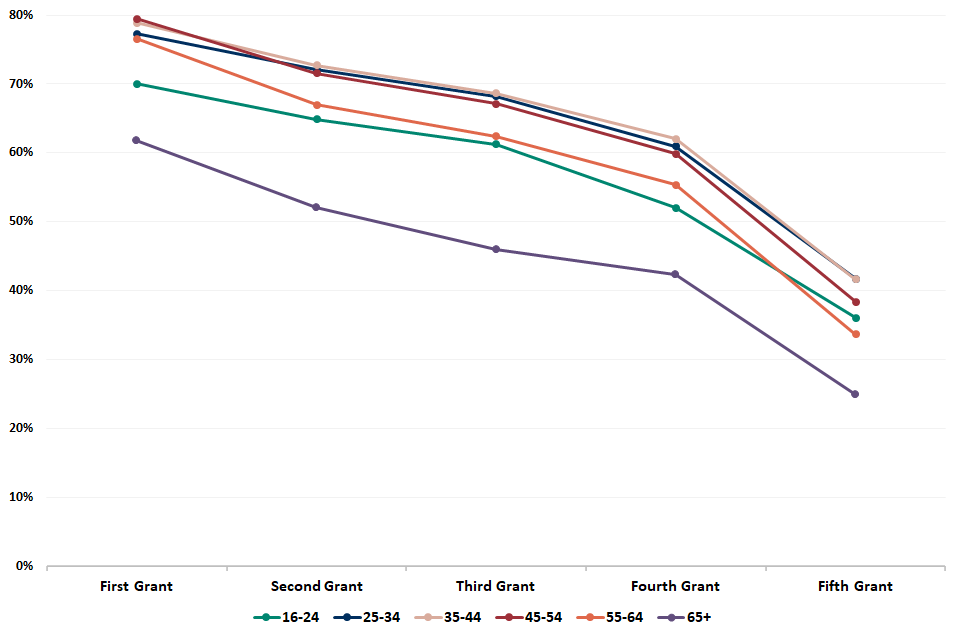
Notes:
- Age is calculated as at 13 May 2020 for the first, second and third grant
- Age is calculated as at 22 April 2021 for the fourth and fifth grant
Table 8: Take-up rates for each grant, by age band12
| Age band | First grant take-up rate | Second grant take-up rate | Third grant take-up rate | Fourth grant take-up rate | Fifth grant take-up rate |
|---|---|---|---|---|---|
| 16-24 | 70% | 65% | 61% | 52% | 36% |
| 25-34 | 77% | 72% | 68% | 61% | 42% |
| 35-44 | 79% | 73% | 69% | 62% | 42% |
| 45-54 | 79% | 72% | 67% | 60% | 38% |
| 55-64 | 77% | 67% | 62% | 55% | 34% |
| 65+ | 62% | 52% | 46% | 42% | 25% |
| Missing | 75% | 67% | 63% | 54% | 33% |
| All | 77% | 69% | 65% | 58% | 38% |
Notes:
- Age is calculated as at 13 May 2020 for the first, second and third grant
- Age is calculated as at 22 April 2021 for the fourth and fifth grant
4. SEISS grants by industrial sector
(see Tables 3 and 3a in the accompanying tables for further details)
Self-employed individuals were asked to provide a description of their business activity on their Self Assessment tax returns. These activities have been mapped across to the Standard Industrial Classification (SIC) 2007 to enable analysis to be carried out by industrial sector. Industrial sector has been assigned based on the business description provided on the claimants Self Assessment tax return. Individuals with multiple trades and those that cannot be assigned to a SIC code are classified as unknown.
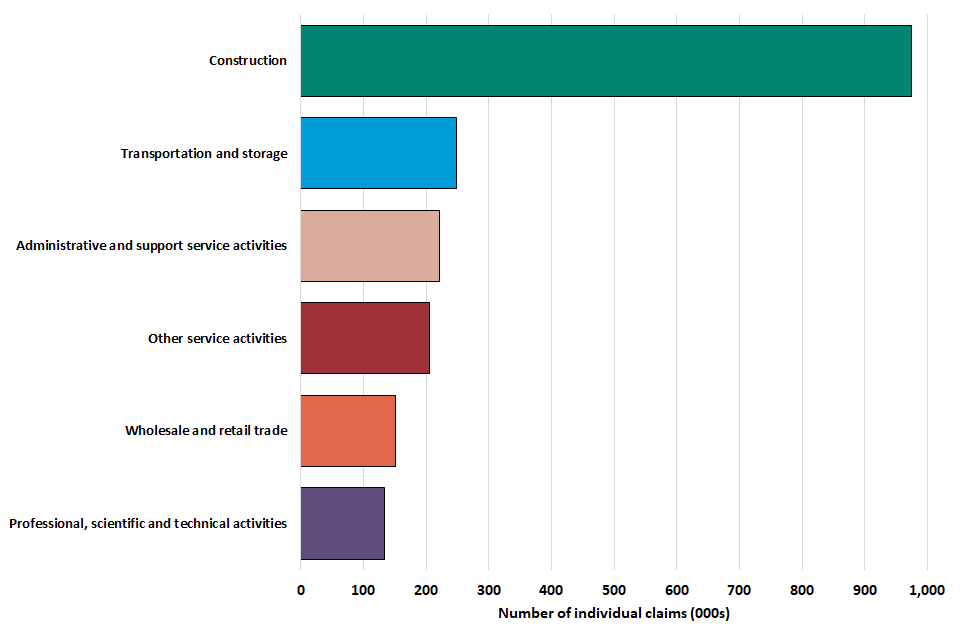
Figures 7 to 12 show the number of claims, the number of individuals that made claims and the value of claims across all 5 grants by industrial sector.
The construction industry had the largest population of individuals (34%) who claimed grants. Just under 1.0 million construction workers had made 3.5 million claims totalling £11.5 billion; an average of £3,300 per claim.
The sector with the highest average claims across all 5 grants was the financial and insurance activities sector (£3,800), but only 15,000 individuals in this sector made claims.
Self-employed individuals in the transportation and storage sector made up 10% of the total number of claims across the 5 grants and 248,000 individuals made just over 1.0 million claims totalling £2.1 billion. Administrative and support services made up 7% of the total number of claims and 221,000 individuals have made 746,000 claims totalling £1.4 billion.
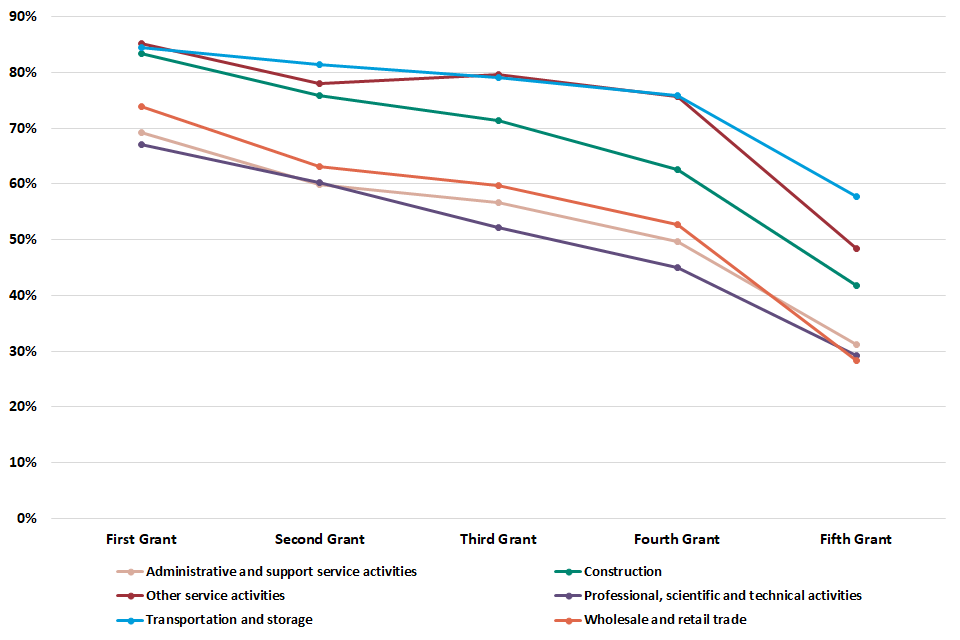
Take-up rates across the 5 grants were highest in the other service activities, transportation and storage, construction, and education sectors. Take-up rates in those sectors range from 80% to 85% for the first grant and 41% to 58% for the fifth grant, with the 58% take-up rate belonging to individuals in the transportation and storage sector.
The agriculture, forestry and fishing sector had the lowest take-up rate for each grant, with 59% for the first grant (compared to 77% overall) and 8% for the fifth grant (compared to 38% overall).
Figure 7: Number of claims made across all 5 grants, by primary industrial sector (for the 6 largest SIC industries1 potentially eligible for the scheme)
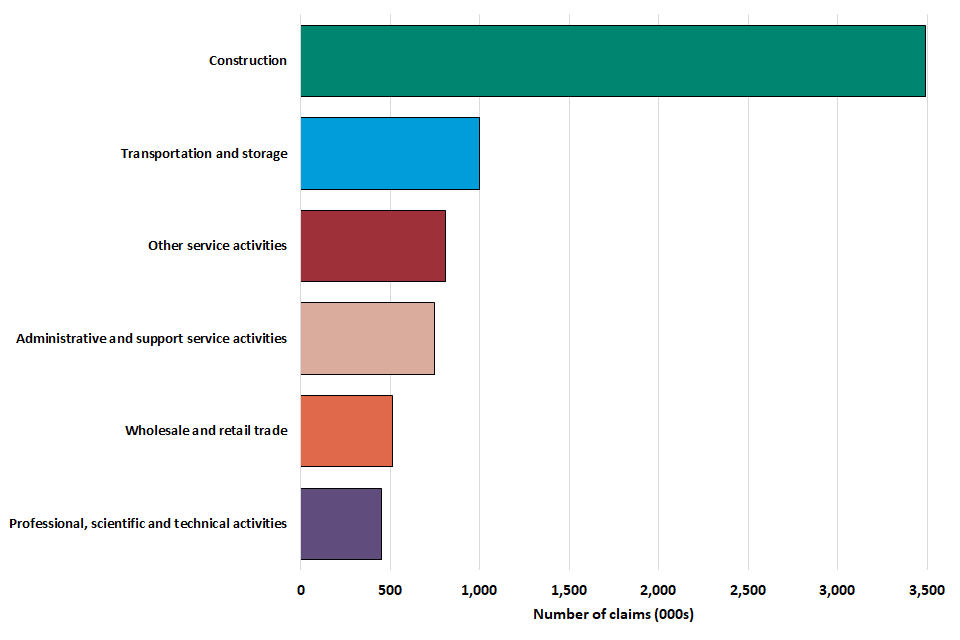
Source: HMRC SEISS linked to Self Assessment taxpayer information
Notes:
- 413,000 individuals covering 1,460,000 claims are included as ‘Unknown and other’ and almost all of these (99%) could not be allocated to a SIC code
Figure 8: Primary industrial sector (SIC 2007) distribution for claims across all grants, by grant
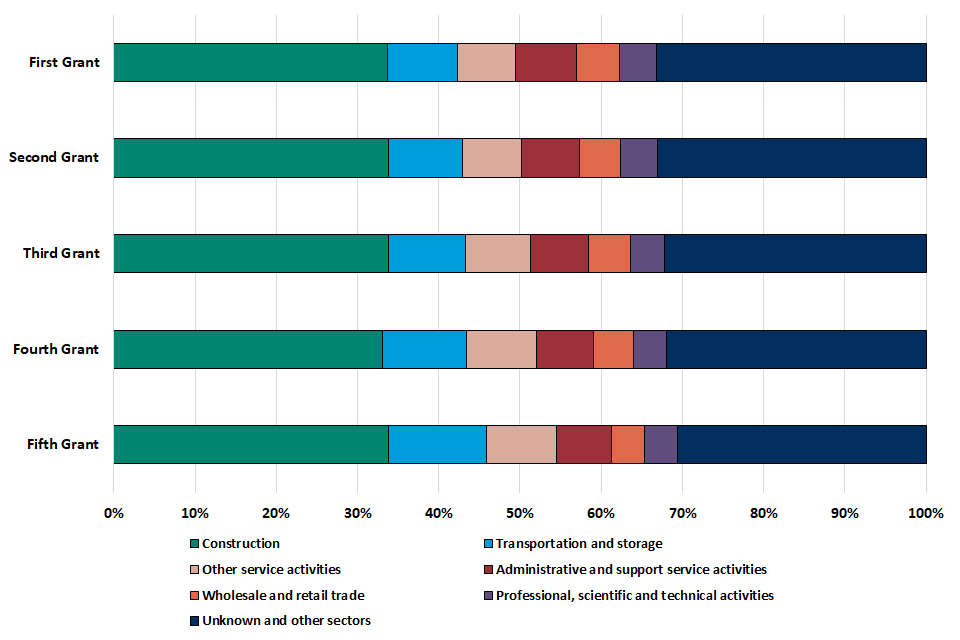
Figure 9: Number of individuals that made claims across all 5 grants, by primary industrial sector (for the 6 largest SIC industries1 potentially eligible for the scheme)
Source: HMRC SEISS linked to Self Assessment taxpayer information
Notes:
- 413,000 individuals covering 1,460,000 claims are included as ‘Unknown and other’ and almost all of these (99%) could not be allocated to a SIC code
Table 9: Number of claims made across all 5 grants, by primary industrial sector (for the 6 largest SIC industries1 potentially eligible for the scheme)
| Sector | Number of individuals (000s) | First grant (000s) | Second grant (000s) | Third grant (000s) | Fourth grant (000s) | Fifth grant (000s) |
|---|---|---|---|---|---|---|
| Construction | 974 | 880 | 795 | 743 | 647 | 427 |
| Transportation and storage | 248 | 223 | 215 | 208 | 202 | 153 |
| Administrative and support service activities | 221 | 195 | 168 | 158 | 138 | 86 |
| Other service activities | 206 | 186 | 170 | 174 | 169 | 108 |
| Wholesale and retail trade; repair of motor vehicles and motorcycles | 151 | 139 | 118 | 111 | 95 | 51 |
| Professional, scientific and technical activities | 133 | 120 | 108 | 93 | 80 | 52 |
Notes:
- 413,000 individuals covering 1,460,000 claims are included as ‘Unknown and other’ and almost all of these (99%) could not be allocated to a SIC code
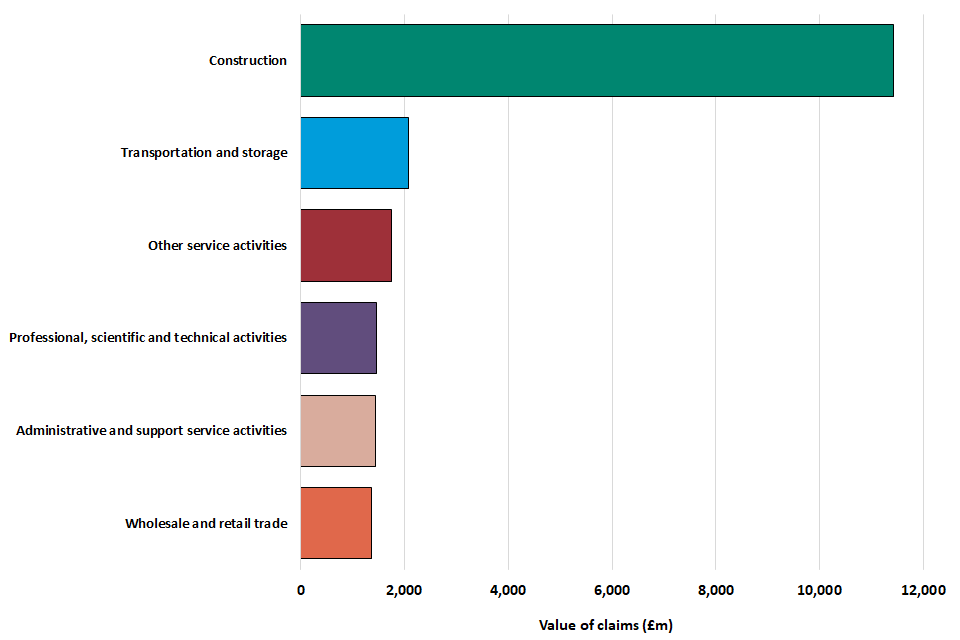
Figure 10: Value of claims made across all 5 grants, by primary industrial sector (for the 6 largest SIC industries1 potentially eligible for the scheme)
Source: HMRC SEISS linked to Self Assessment taxpayer information
Notes:
- 413,000 individuals covering 1,460,000 claims are included as ‘Unknown and other’ and almost all of these (99%) could not be allocated to a SIC code
Table 10: Value of claims made across all 5 grants, by primary industrial sector (for the 6 largest SIC industries1 potentially eligible for the scheme)
| Sector | First grant (£m) | Second grant (£m) | Third grant (£m) | Fourth grant (£m) | Fifth grant (£m) |
|---|---|---|---|---|---|
| Construction | 3,103 | 2,432 | 2,565 | 2,237 | 1,087 |
| Transportation and storage | 487 | 408 | 448 | 436 | 289 |
| Administrative and support service activities | 405 | 300 | 318 | 276 | 136 |
| Other service activities | 413 | 332 | 386 | 383 | 227 |
| Wholesale and retail trade; repair of motor vehicles and motorcycles | 398 | 292 | 309 | 262 | 106 |
| Professional, scientific and technical activities | 417 | 322 | 309 | 261 | 143 |
Notes:
- 413,000 individuals covering 1,460,000 claims are included as ‘Unknown and other’ and almost all of these (99%) could not be allocated to a SIC code
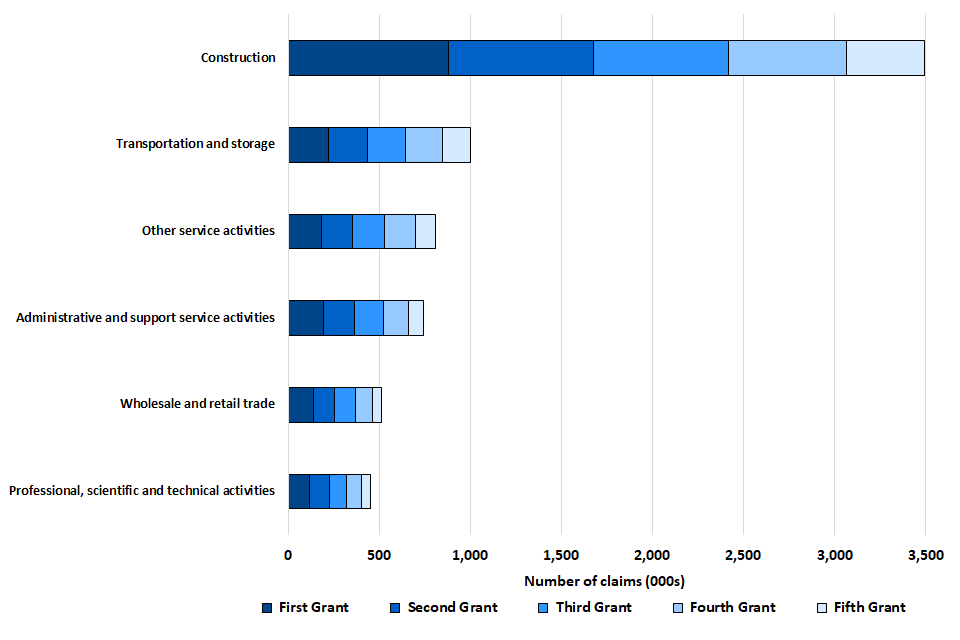
Figure 11: Number of claims made across each grant, by primary industrial sector (for the 6 largest SIC industries1 potentially eligible for the scheme)
Notes:
- 413,000 individuals covering 1,460,000 claims are included as ‘Unknown and other’ and almost all of these (99%) could not be allocated to a SIC code
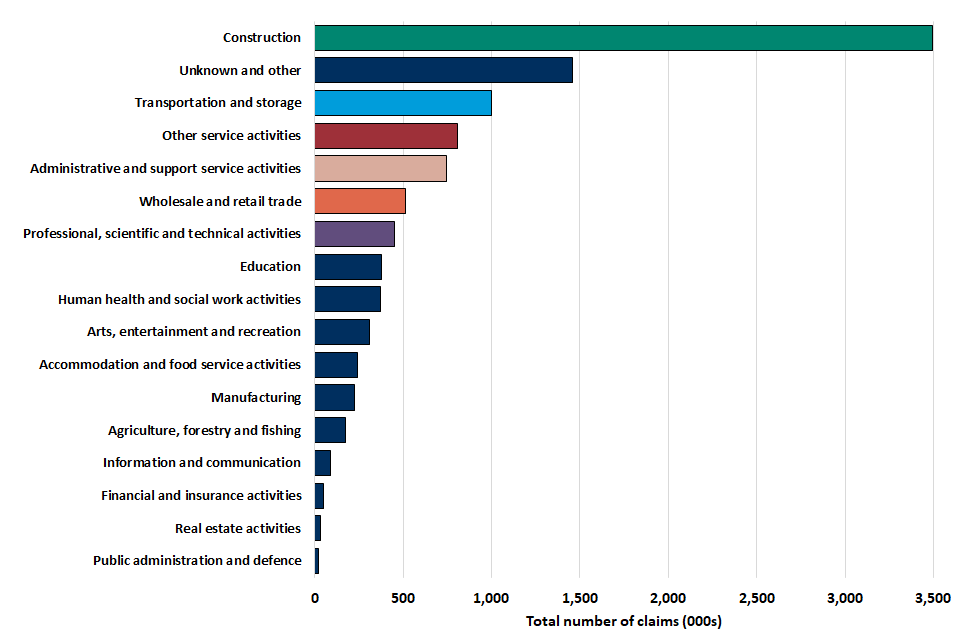
Figure 12: Number of claims across all 5 grants, by primary industrial sector1 (smaller sectors not shown in figure 6)
Source: HMRC SEISS linked to Self Assessment taxpayer information
Notes:
- 413,000 individuals covering 1,460,000 claims are included as ‘Unknown and other’ and almost all of these (99%) could not be allocated to a SIC code
Table 11: Number of claims made across all grants, by primary industrial sector1 (smaller sectors not shown in figure 6)
| Sector | First grant (000s) | Second grant (000s) | Third grant (000s) | Fourth grant (000s) | Fifth grant (000s) |
|---|---|---|---|---|---|
| Human health and social work activities | 101 | 92 | 78 | 64 | 39 |
| Education | 90 | 84 | 81 | 77 | 47 |
| Arts, entertainment and recreation | 75 | 71 | 66 | 61 | 41 |
| Accommodation and food service activities | 62 | 53 | 51 | 46 | 27 |
| Manufacturing | 59 | 52 | 48 | 42 | 25 |
| Agriculture, forestry and fishing | 63 | 47 | 35 | 24 | 8 |
| Information and communication | 24 | 22 | 19 | 16 | 11 |
| Financial and insurance activities | 13 | 12 | 10 | 8 | 5 |
| Real estate activities | 9 | 8 | 7 | 6 | 3 |
| Public administration and defence; compulsory social security | 5 | 4 | 4 | 4 | 3 |
Notes:
- 413,000 individuals covering 1,460,000 claims are included as ‘Unknown and other’ and almost all of these (99%) could not be allocated to a SIC code
Figure 13: Take-up rates for each grant, by primary industrial sector (for the 6 largest SIC industries1 potentially eligible for the scheme)
Notes:
- 413,000 individuals covering 1,460,000 claims are included as ‘Unknown and other’ and almost all of these (99%) could not be allocated to a SIC code
Table 12: Take-up rates for each grant, by primary industrial sector (for the 6 largest SIC industries1 potentially eligible for the scheme)
| Sector | First grant take-up rate | Second grant take-up rate | Third grant take-up rate | Fourth grant take-up rate | Fifth grant take-up rate |
|---|---|---|---|---|---|
| Construction | 83% | 76% | 71% | 63% | 42% |
| Transportation and storage | 84% | 81% | 79% | 76% | 58% |
| Administrative and support service activities | 69% | 60% | 57% | 50% | 31% |
| Other service activities | 85% | 78% | 80% | 76% | 48% |
| Wholesale and retail trade; repair of motor vehicles and motorcycles | 74% | 63% | 60% | 53% | 28% |
| Professional, scientific, and technical activities | 67% | 60% | 52% | 45% | 29% |
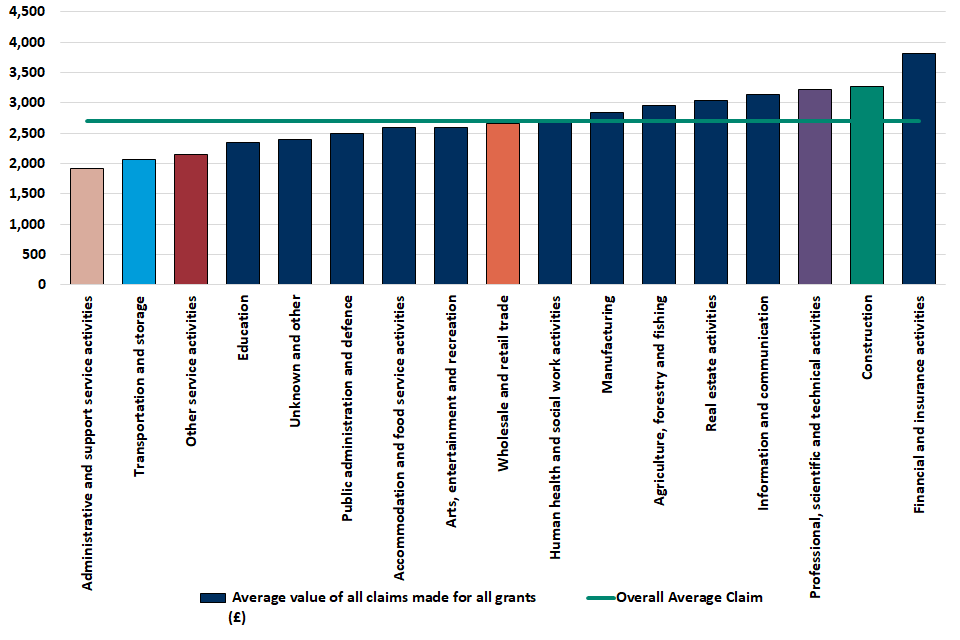
Figure 14 shows the average value of claims by sector which range from £3,800 per claim in the finance and insurance sector to £1,900 per claim in administrative and support services.
Figure 14: Average value of claims across all 5 grants by primary industry12 of self-employment, ranked by average claim
Source: HMRC SEISS linked to Self Assessment taxpayer information
Notes:
- The allocation to industry represents an individual’s highest earning self-employment
- 413,000 individuals covering 1,460,000 claims are included as ‘Unknown and other’ and almost all of these (99%) could not be allocated to a SIC code
Table 13: Average value of claims across all 5 grants, by primary industry of self-employment, ranked by average claim
| Sector | Average value of claims (£) |
|---|---|
| Financial and insurance activities | 3,800 |
| Construction | 3,300 |
| Professional, scientific and technical activities | 3,200 |
| Information and communication | 3,100 |
| Real estate activities | 3,000 |
| Agriculture, forestry and fishing | 3,000 |
| Manufacturing | 2,800 |
| All | 2,700 |
| Human health and social work activities | 2,700 |
| Wholesale and retail trade; repair of motor vehicles and motorcycles | 2,700 |
| Arts, entertainment and recreation | 2,600 |
| Accommodation and food service activities | 2,600 |
| Public administration and defence; compulsory social security | 2,500 |
| Education | 2,400 |
| Other service activities | 2,200 |
| Transportation and storage | 2,100 |
| Administrative and support service activities | 1,900 |
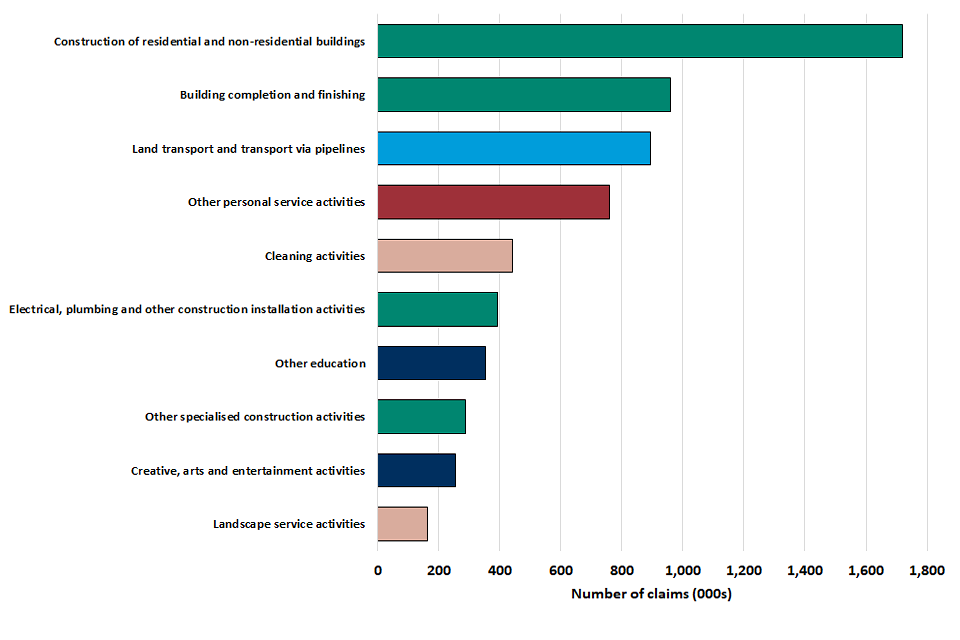
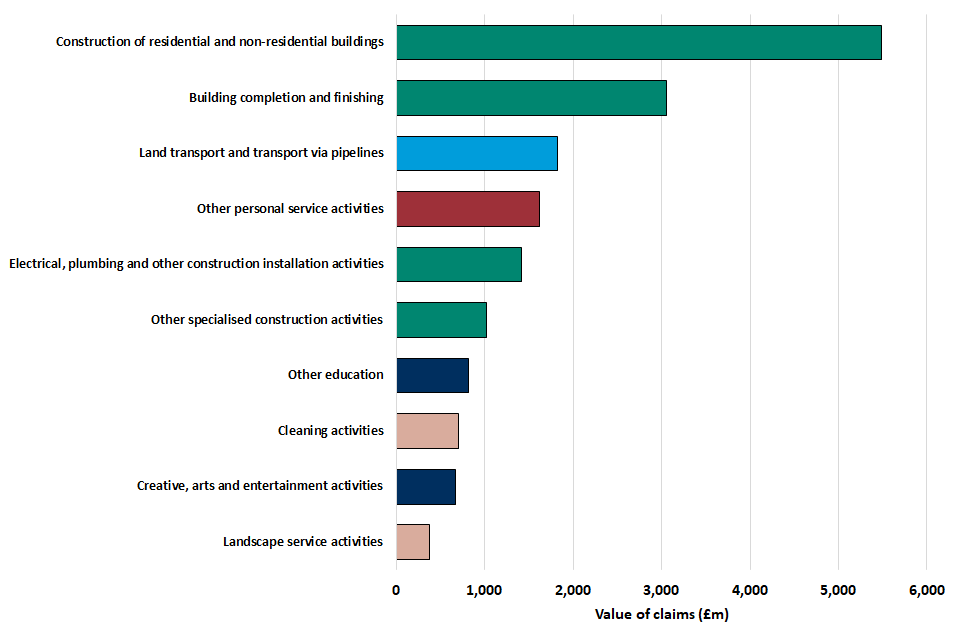
At the 3 digit SIC level the group with the largest number of grant claimants is construction of residential and non-residential buildings with 474,000 individuals who have made over 1.7 million claims worth nearly £5.5 billion.
The highest average claim is in medicinal and dental practice activities where 53,000 claims have been made worth £250 million at an average of £4,700 per claim.
Take-up rates vary across the 5 grants. The highest take-up rate for the first and second grants is in land transport and transport via pipelines at 89% and 86% respectively. For the third grant the highest take-up rate is in gathering of wild growing non-wood projects (88%), although this covers less than 1,000 claims.
For the fourth and fifth grant the take-up is highest in travel agency and tour operator activities at 83% for the fourth grant and 72% for the fifth grant.
Figure 15: Number of claims for 10 largest industrial sub-sector123 groups across all grants
Notes:
- Industrial sub-sector groups are based on 3-digit Standard Industrial Classification of economic activities (SIC) codes. More detail on SIC can be found in the methodology section of the ONS website
- The allocation to industry represents an individual’s highest earning self-employment
- 413,000 individuals covering 1,460,000 claims are included as ‘Unknown and other’ and almost all of these (99%) could not be allocated to a SIC code
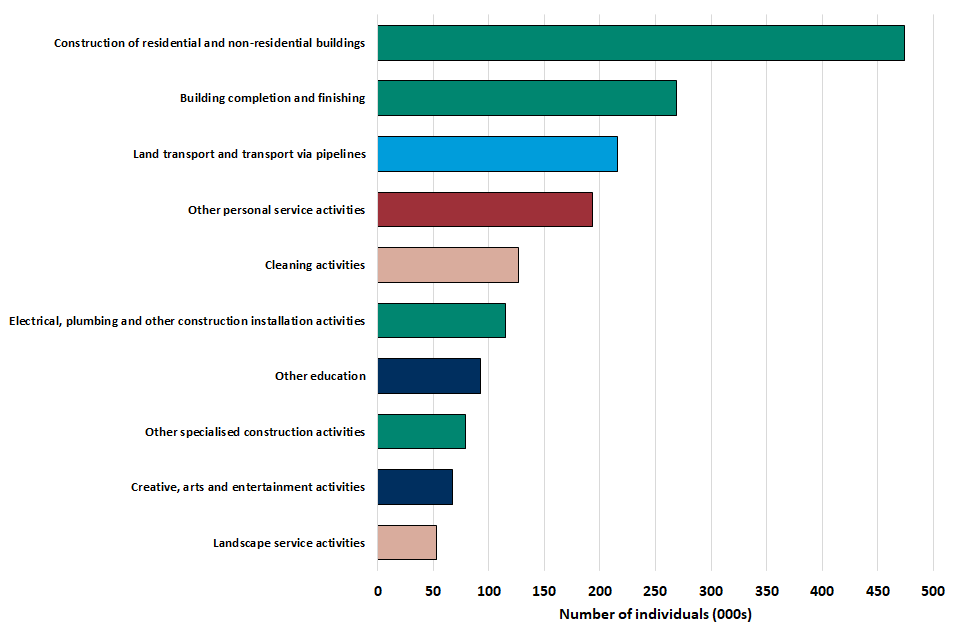
Figure 16: Number of individuals who claimed a grant for 10 largest industrial sub-sector123 groups across all grants
Source: HMRC SEISS linked to Self Assessment taxpayer information
Notes:
- Industrial sub-sector groups are based on 3-digit Standard Industrial Classification of economic activities (SIC) codes. More detail on SIC can be found in the methodology section of the ONS website
- The allocation to industry represents an individual’s highest earning self-employment
- 413,000 individuals covering 1,460,000 claims are included as ‘Unknown and other’ and almost all of these (99%) could not be allocated to a SIC code
Table 14: Number of claims and individuals for 10 largest industrial sub-sector1 groups across all 5 grants
| Industrial sub-sector group | First grant (000s) | Second grant (000s) | Third grant (000s) | Fourth grant (000s) | Fifth grant (000s) | Individuals (000s) |
|---|---|---|---|---|---|---|
| Construction of residential and non-residential buildings | 418 | 382 | 361 | 326 | 232 | 474 |
| Building completion and finishing | 250 | 222 | 209 | 176 | 103 | 269 |
| Land transport and transport via pipelines | 198 | 192 | 186 | 180 | 138 | 216 |
| Other personal service activities | 174 | 160 | 164 | 161 | 103 | 193 |
| Cleaning activities | 111 | 98 | 93 | 84 | 55 | 127 |
| Electrical, plumbing and other construction installation activities | 107 | 95 | 84 | 68 | 38 | 115 |
| Other education | 84 | 78 | 76 | 72 | 44 | 92 |
| Other specialised construction activities | 72 | 66 | 61 | 53 | 36 | 79 |
| Creative, arts and entertainment activities | 60 | 58 | 53 | 49 | 34 | 67 |
| Landscape service activities | 49 | 38 | 36 | 27 | 12 | 53 |
Note:
- Industrial sub-sector groups are based on 3-digit Standard Industrial Classification of economic activities (SIC) codes. More detail on SIC can be found in the methodology section of the ONS website
Figure 17: Value of claims for 10 largest industrial sub-sector123 groups across all grants
Notes:
- Industrial sub-sector groups are based on 3-digit Standard Industrial Classification of economic activities (SIC) codes. More detail on SIC can be found in the methodology section of the ONS website
- The allocation to industry represents an individual’s highest earning self-employment
- 413,000 individuals covering 1,460,000 claims are included as ‘Unknown and other’ and almost all of these (99%) could not be allocated to a SIC code
Table 15: Value of claims for 10 largest industrial sub-sector1 groups across all 5 grants
| 3 digit SIC Group | First grant (£m) | Second grants (£m) | Third grant (£m) | Fourth grant (£m) | Fifth grant (£m) |
|---|---|---|---|---|---|
| Construction of residential and non-residential buildings | 1,437 | 1,139 | 1,219 | 1,109 | 578 |
| Building completion and finishing | 854 | 660 | 699 | 585 | 262 |
| Land transport and transport via pipelines | 423 | 357 | 395 | 384 | 264 |
| Other personal service activities | 382 | 307 | 360 | 360 | 216 |
| Electrical, plumbing and other construction installation activities | 413 | 318 | 317 | 257 | 108 |
| Other specialised construction activities | 279 | 220 | 231 | 197 | 97 |
| Other education | 202 | 165 | 183 | 177 | 96 |
| Cleaning activities | 190 | 144 | 154 | 141 | 73 |
| Creative, arts and entertainment activities | 165 | 138 | 144 | 135 | 86 |
| Landscape service activities | 121 | 81 | 86 | 64 | 20 |
Note:
- Industrial sub-sector groups are based on 3-digit Standard Industrial Classification of economic activities (SIC) codes. More detail on SIC can be found in the methodology section of the ONS website
5. SEISS claims by geography
(see Table 2 in the accompanying tables for further details)
Using the claimant’s Self Assessment address, claims can be mapped to countries of the UK, English regions, and lower geographies.
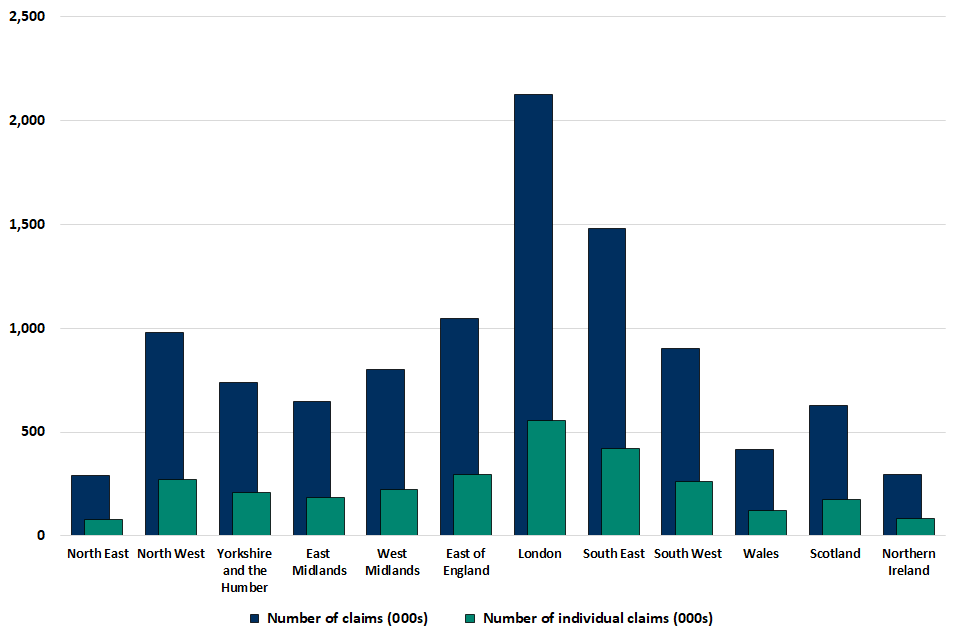
Figure 18 shows the number of claims and number of individuals that have made a claim by country and region.
London had the largest number claims across all 5 grants (2.1 million), the largest number of individuals that made a claim (558,000) and the largest value of claims with a total value of £5.8 billion across the 5 grants.
The North East had the lowest average claim value across all 5 grants at £2,400. The highest average claims values across all 5 grants belong to individuals in East of England and South East (£2,900).
The average take-up rate across the whole United Kingdom for the first grant was 77%, with most regions within 2 percentage points of this. Northern Ireland had the highest take-up rate for the first grant (82%).
The average take-up rate for United Kingdom for the fifth grant was much lower at 38% with more variations across regions compared to the first grant. The take-up rate in London was 50% for the fifth grant compared to a 32% take-up rate in Northern Ireland and Wales, and a 30% take up rate in the South West. Figure 19 shows how the take-up rates change for each grant in each region.
175,000 self-employed individuals in Scotland have made 628,000 claims totalling £1.7 billion; in Wales 418,000 claims were made by 122,000 individuals worth £1.1 billion, and in Northern Ireland 294,000 claims were made by 85,000 individuals for £0.8 billion.
Figure 18: Number of claims and number of individuals that made a claim across all 5 grants by country and region12, ranked by size of number of claims
Source: HMRC SEISS linked to Self Assessment taxpayer information
Notes:
- The allocation to location represents the individual’s address registered on their Self Assessment return
- 7,000 claimants making 23,000 claims could not be allocated to a NUTS1 region
Table 16: Number of claims and number of individuals that made a claim across all 5 grants by country and region, ranked by size of number of claims
| Region | Number of claims (000s) | Number of individuals (000s) | Value of claims (£m) |
|---|---|---|---|
| London | 2,127 | 558 | 5,817 |
| South East | 1,481 | 421 | 4,344 |
| East of England | 1,049 | 298 | 3,063 |
| North West | 978 | 270 | 2,415 |
| South West | 901 | 264 | 2,480 |
| West Midlands | 800 | 225 | 2,075 |
| Yorkshire and the Humber | 740 | 207 | 1,861 |
| East Midlands | 647 | 185 | 1,732 |
| Scotland | 628 | 175 | 1,710 |
| Wales | 418 | 122 | 1,054 |
| Northern Ireland | 294 | 85 | 783 |
| North East | 290 | 81 | 708 |
| All | 10,374 | 2,897 | 28,105 |
Figure 19: Take-up rates across all 5 grants, by country and region
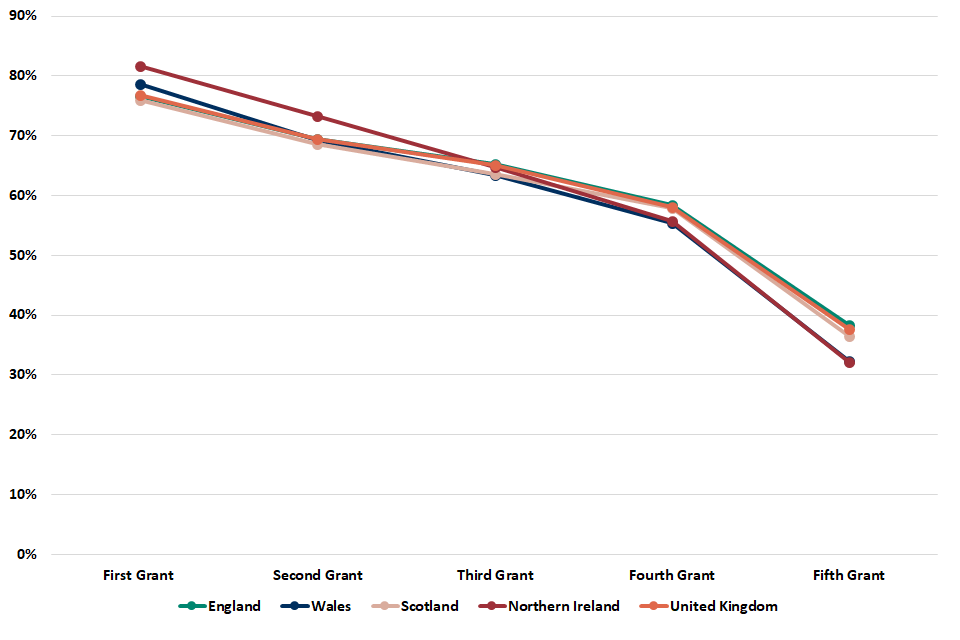
Table 17: Take-up rates across all 5 grants, by country and region
| Region | First grant take-up rate | Second grant take-up rate | Third grant take-up rate | Fourth grant take-up rate | Fifth grant take-up rate |
|---|---|---|---|---|---|
| England | 77% | 69% | 65% | 58% | 38% |
| North East | 77% | 70% | 66% | 59% | 37% |
| North West | 78% | 71% | 67% | 60% | 39% |
| Yorkshire and the Humber | 78% | 70% | 66% | 59% | 37% |
| East Midlands | 76% | 68% | 64% | 56% | 35% |
| West Midlands | 77% | 70% | 65% | 58% | 37% |
| East of England | 76% | 68% | 64% | 56% | 36% |
| London | 77% | 72% | 69% | 65% | 50% |
| South East | 76% | 68% | 63% | 55% | 34% |
| South West | 75% | 66% | 61% | 52% | 30% |
| Wales | 79% | 69% | 63% | 55% | 32% |
| Scotland | 76% | 69% | 64% | 58% | 36% |
| Northern Ireland | 82% | 73% | 65% | 56% | 32% |
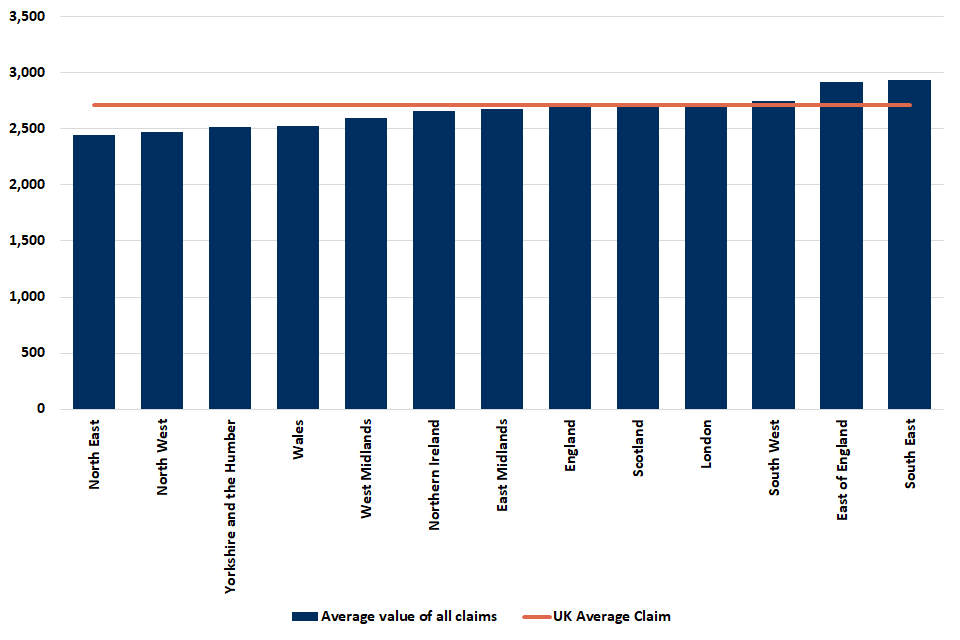
Figure 20 shows the average value of claims across all 5 grants by country and region.
The regions and countries with the lowest average claim value across all 5 grants were the North East (£2,400).
The South East, the East of England (£2,900) and South West (£2,800) had average claim values above the UK average of £2,700.
Figure 20: The average value of claims across all 5 grants by region 1 2, ranked by value
Source: HMRC SEISS linked to Self Assessment taxpayer information
Notes:
1. The allocation to location represents the individual’s address registered on their Self Assessment return
2. 7,000 claimants making 23,000 claims could not be allocated to a NUTS1 region
Table 18: The average value of claims across all 5 grants by region, ranked by value
| Region | Average value of claims (£) |
|---|---|
| South East | 2,900 |
| East of England | 2,900 |
| South West | 2,800 |
| London | 2,700 |
| Scotland | 2,700 |
| UK Average | 2,700 |
| East Midlands | 2,700 |
| Northern Ireland | 2,700 |
| West Midlands | 2,600 |
| Wales | 2,500 |
| Yorkshire and the Humber | 2,500 |
| North West | 2,500 |
| North East | 2,400 |
Sub-regional breakdowns
Tables 4 and 5 in the accompanying data table pack provide a breakdown of claimants across all 5 grants by Parliamentary Constituency and Local Authority.
These tables also include a gender breakdown which show the number of male and female claimants and the amount they claimed by each area.
The maps below illustrate how the average value of grants varied by parliamentary constituency and local authority. Darker shades indicate a higher average grant amount.
The London, City of London local authority had the highest average claim amount at £3,800. The Newham local authority had the highest claim amount of £374 million.
In Northern Ireland, Mid Ulster, Lisburn and Castlereagh, Causeway Coast and Glens, and Newry, Mourne and Down had the highest average claim amounts at £2,800. In Scotland, Shetland Islands had the highest average claim amount £3,200 and Aberdeenshire had an average claim amount of £3,100. In Wales, Vale of Glamorgan, and Rhondda Cynon Taf local authorities had the highest average claim amounts at £2,700.
Figure 21: Average claim values across all 5 grants, by local authority

Source: Office for National Statistics licensed under the Open Government Licence v.3.0. Contains OS data © Crown copyright and database right 2021
The East of England constituency of Mid Bedfordshire had the highest average grant of £3,300. The West Ham constituency had the highest total value of claims across all grants with £197 million.
In Northern Ireland, South Down had the highest average claim amount at £2,900. In Scotland, Gordon had the highest average claim amount at £3,100. In Wales, Cardiff North, Cynon Valley, Delyn, Pontypridd, and Wrexham constituencies had the highest average claim amounts at £2,700.
Figure 22: Average claim values across all 5 grants, by parliamentary constituency

Source: Office for National Statistics licensed under the Open Government Licence v.3.0. Contains OS data © Crown copyright and database right 2021
6. SEISS claims by industrial sector and geography
(see Table 6 in the accompanying tables for further details)
Sections 6 to 8 of this bulletin consider the breakdown of the number of claims received in each country and region by different demographics (industry, gender and age). Comparable information relating to the number of claims, number of individuals that made a claim and value of claims can be found in tables 6 and 7 in the accompanying tables.
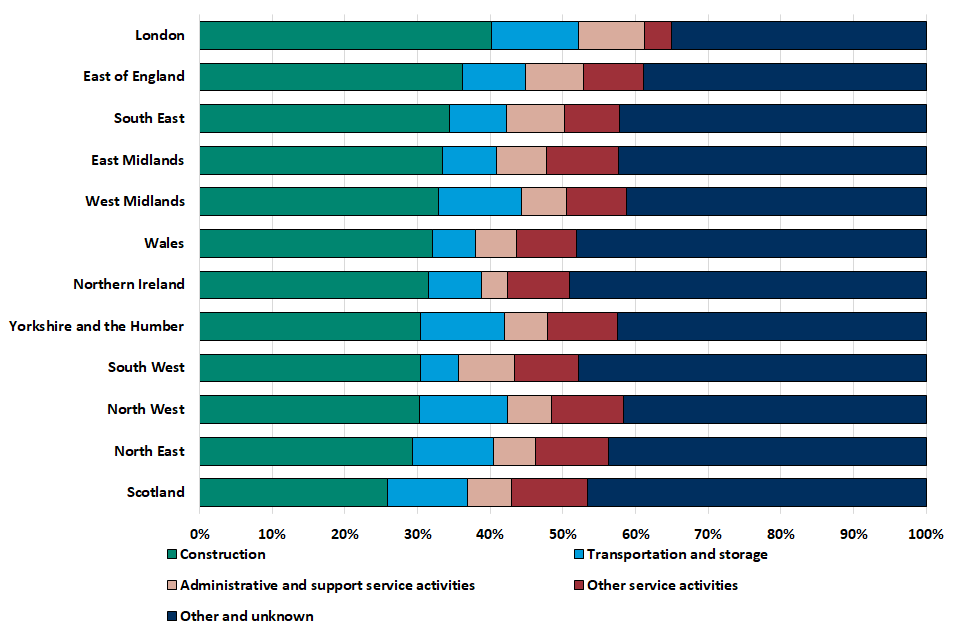
Figure 23 shows the breakdown of claims in each region and country by industrial sector. Construction, transport, other services and administrative services had the largest number of claims overall and are shown as separate categories on the chart. Other smaller industries have been combined.
The industry profile of claimants did not vary greatly between countries and regions. The main exceptions were seen in the construction industry and agriculture, forestry and fishing.
Individuals working in the construction industry accounted for the highest proportion of claims in every country and region of the UK. London had the highest proportion, with 40% of claims being from those working in construction and Scotland had the lowest with 26%.
The second largest sector by number of claims was transportation and storage. This industry accounted for 12% of claims in the North West. The lowest proportion of claims for this sector were in the South West (5%) and Wales (6%).
Figure 23: Primary industry of self-employment distribution of claims across all 5 grants12, by country and region
Notes:
- The allocation to industry represents an individual’s highest earning self-employment
- 413,000 individuals covering 1,460,000 claims are included as ‘Unknown and other’ and almost all of these (99%) could not be allocated to a SIC code
Table 19: Primary industry of self-employment distribution of claims across all 5 grants, by country and region
| Proportion of claims by region and sector | Construction | Transportation and storage | Other Service Activities | Administration and support services activities | Other and unknown |
|---|---|---|---|---|---|
| London | 40% | 12% | 4% | 9% | 35% |
| East of England | 36% | 9% | 8% | 8% | 39% |
| South East | 34% | 8% | 8% | 8% | 42% |
| East Midlands | 33% | 7% | 10% | 7% | 43% |
| West Midlands | 33% | 11% | 8% | 6% | 41% |
| Wales | 32% | 6% | 8% | 6% | 48% |
| Northern Ireland | 31% | 7% | 8% | 4% | 49% |
| Yorkshire and the Humber | 30% | 11% | 10% | 6% | 43% |
| South West | 30% | 5% | 9% | 8% | 48% |
| North West | 30% | 12% | 10% | 6% | 42% |
| North East | 29% | 11% | 10% | 6% | 44% |
| Scotland | 26% | 11% | 10% | 6% | 47% |
7. SEISS claims by gender and geography
(see Table 7 in the accompanying tables for further details)
The areas with the highest proportion of males making claims were Northern Ireland, London and West Midlands (74%) and the lowest areas were Scotland and the South West (66% each).
Since the average claim amount was higher for males than females as well, men accounted for an even higher proportion of total claim values. In the West Midlands 79% and London 80% of total claim values were from men. The lowest male share was in the South West and Scotland where 73% of the total amount claimed was claimed by men.
Figure 24 shows the proportion of claims within each region by gender. The majority of claims for each grant were made by men, ranging from 66% of claims in the South West to 74% in Northern Ireland.
Figure 24: Gender distribution of claims across all 5 grants, by country and region
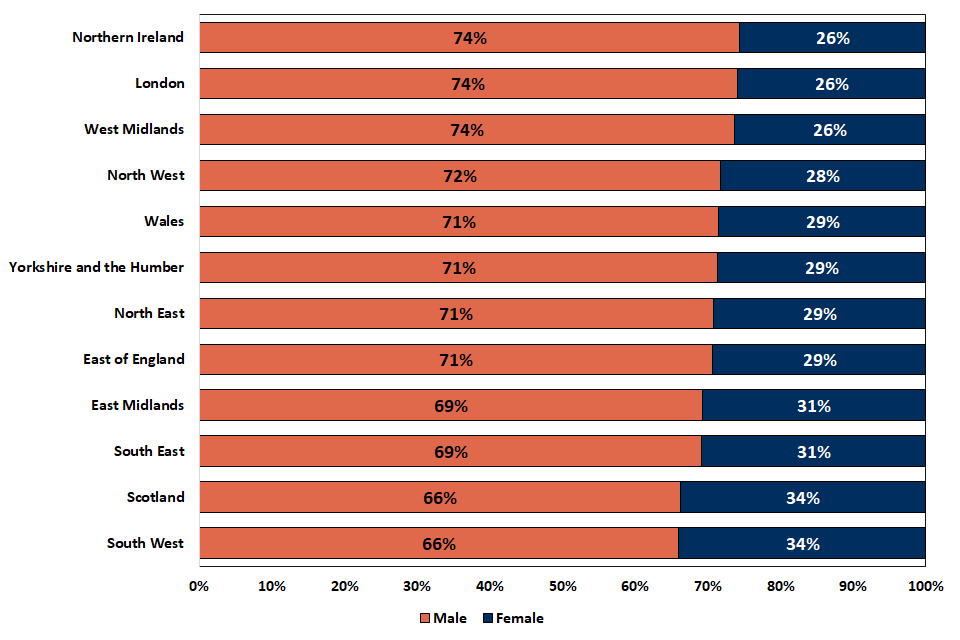
Table 20: Gender distribution of claims received across all 5 grants, by country and region
| Proportion of claims by region and gender | Male | Female |
|---|---|---|
| Northern Ireland | 74% | 26% |
| London | 74% | 26% |
| West Midlands | 74% | 26% |
| North West | 72% | 28% |
| Wales | 71% | 29% |
| Yorkshire and the Humber | 71% | 29% |
| North East | 71% | 29% |
| East of England | 71% | 29% |
| East Midlands | 69% | 31% |
| South East | 69% | 31% |
| Scotland | 66% | 34% |
| South West | 66% | 34% |
8. SEISS claims by age and geography
(see Table 7 in the accompanying tables for further details)
The age distribution of the claims received was reasonably consistent across all countries and regions except for London.
Between 43% (Scotland, Wales and South West) and 49% (the East of England) of the number of claims in each country and region is aged under 45 except in London where 58% are under 45.
A similar distribution was observed for claims and claim value with the lowest proportion aged under 45 being in Scotland (43% of claims and 40% of claim value) and the highest being in London (58% of claims and 58% of claim value).
Figure 25: Age distribution of claims across all 5 grants received, by country and region123
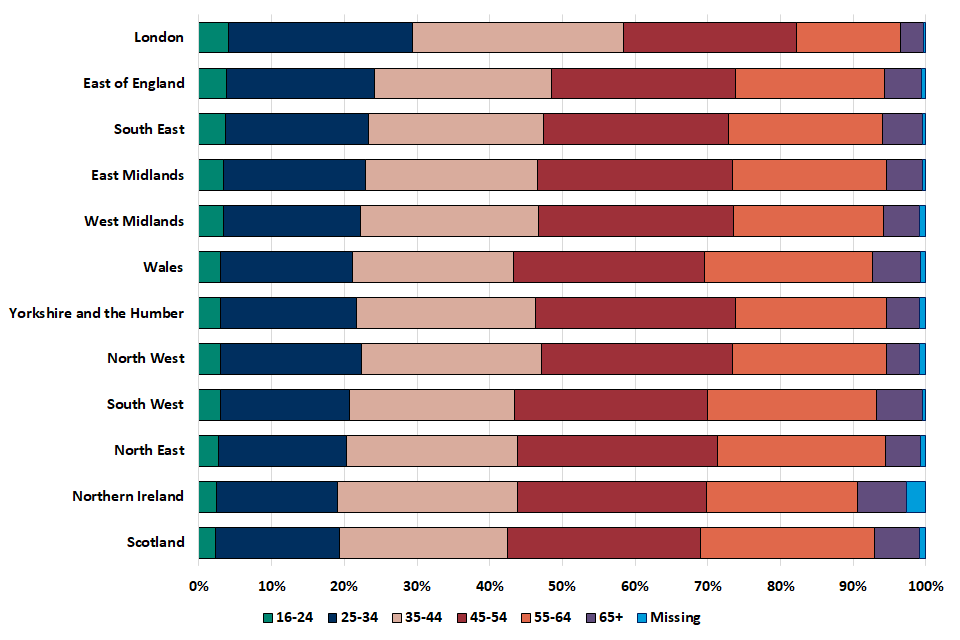
Notes:
- Age is calculated for the first 3 grants at the date the first grant opened on 13 May 2020
- Age is calculated for the fourth and fifth grants at the date the fourth grant opened on 22 April 2021
- There is missing age information for 21,000 individuals and 72,000 claims
Table 21: The proportion of claims received by country and region by gender
| Proportion of claims by region and gender | 16-24 | 25-34 | 35-44 | 45-54 | 55-64 | 65+ | Missing |
|---|---|---|---|---|---|---|---|
| London | 4% | 25% | 29% | 24% | 14% | 3% | 0% |
| East of England | 4% | 20% | 24% | 25% | 20% | 5% | 1% |
| South East | 4% | 20% | 24% | 26% | 21% | 5% | 0% |
| East Midlands | 3% | 20% | 24% | 27% | 21% | 5% | 1% |
| West Midlands | 3% | 19% | 24% | 27% | 21% | 5% | 1% |
| Wales | 3% | 18% | 22% | 26% | 23% | 7% | 1% |
| Yorkshire and the Humber | 3% | 19% | 25% | 28% | 21% | 5% | 1% |
| North West | 3% | 19% | 25% | 26% | 21% | 5% | 1% |
| South West | 3% | 18% | 23% | 27% | 23% | 6% | 0% |
| North East | 3% | 18% | 24% | 27% | 23% | 5% | 1% |
| Northern Ireland | 2% | 17% | 25% | 26% | 21% | 7% | 3% |
| Scotland | 2% | 17% | 23% | 27% | 24% | 6% | 1% |
9. SEISS claims by gender and industrial sector
(see Table 10 in the accompanying tables for further details)
Sections 9 and 10 of this bulletin consider the breakdown of the number of claims received in each industrial sector by age and gender. Comparable information relating to the number of claims, number of individuals that made a claim and value of claims can be found in table 10 in the accompanying tables.
Figure 26 shows the breakdown of each industrial sector by gender. Overall, 71% of claims are made by men. However, men made less claims than women in administrative and support service activities (42%), human health and social work activities (17%) and other service activities (22%).
Construction (98% of claims) and transportation and storage (96%) are the sectors most heavily skewed towards male claimants.
Figure 26: Gender breakdown of claims across all 5 grants received in each industrial sector
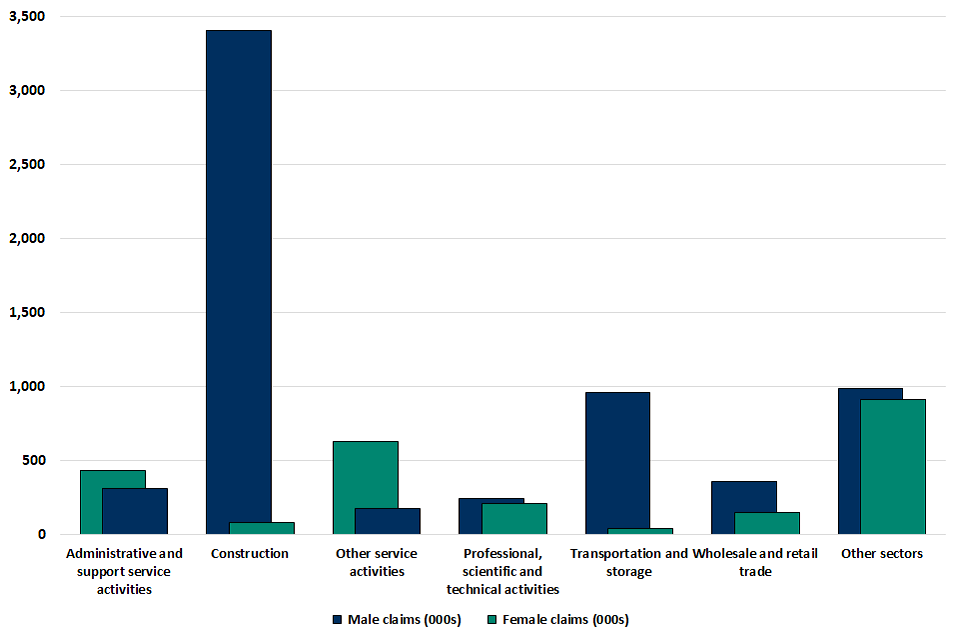
Table 22: Gender breakdown of claims across all 5 grants received in each industrial sector
| Sector | Number of male claimants (000s) | Number of female claimants (000s) |
|---|---|---|
| Construction | 3,406 | 85 |
| Transportation and storage | 958 | 43 |
| Agriculture, forestry and fishing | 137 | 41 |
| Information and communication | 68 | 23 |
| Manufacturing | 160 | 66 |
| Wholesale and retail trade; repair of motor vehicles and motorcycles | 362 | 152 |
| Financial and insurance activities | 34 | 15 |
| Public administration and defence; compulsory social security | 14 | 6 |
| Real estate activities | 22 | 13 |
| Arts, entertainment and recreation | 176 | 136 |
| Professional, scientific and technical activities | 244 | 208 |
| Education | 195 | 183 |
| Accommodation and food service activities | 123 | 117 |
| Administrative and support service activities | 315 | 431 |
| Other service activities | 178 | 630 |
| Human health and social work activities | 62 | 311 |
10. SEISS claims by age and industrial sector
(see Table 10 in the accompanying tables for further details)
Figure 27 shows the age distribution of the 6 largest sectors. The largest proportion of claims by individuals under age 45 is in construction (56%) followed by arts, entertainment and recreation (55%). The lowest proportion is in accommodation and food services (29%).
Figure 27: Age distribution of claims across all 5 grants received in each industrial sector
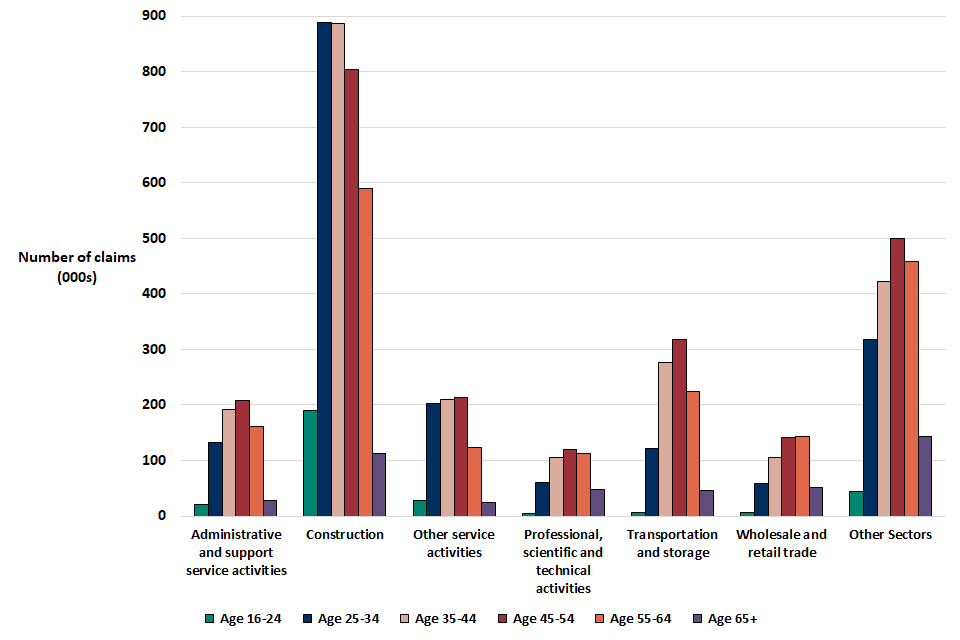
Table 23: Age distribution of claims across all 5 grants received in each industrial sector
| Proportion of sector claims by age | 16-24 (000s) | 25-34 (000s) | 35-44 (000s) | 45-54 (000s) | 55-64 (000s) | 65+ (000s) | Missing (000s) |
|---|---|---|---|---|---|---|---|
| Construction | 190 | 889 | 887 | 804 | 589 | 112 | 21 |
| Arts, entertainment and recreation | 13 | 84 | 75 | 67 | 55 | 17 | 2 |
| Other service activities | 28 | 202 | 210 | 214 | 123 | 25 | 7 |
| Public administration and defence; compulsory social security | <1 | 4 | 6 | 5 | 4 | <1 | <1 |
| Information and communication | 2 | 19 | 25 | 23 | 17 | 4 | <1 |
| Education | 10 | 71 | 89 | 101 | 87 | 17 | 2 |
| Administrative and support service activities | 21 | 133 | 192 | 208 | 161 | 28 | 4 |
| Transportation and storage | 7 | 121 | 276 | 318 | 225 | 46 | 8 |
| Human health and social work activities | 3 | 51 | 94 | 113 | 91 | 19 | 2 |
| Manufacturing | 5 | 34 | 47 | 59 | 58 | 20 | 2 |
| Professional, scientific and technical activities | 5 | 61 | 105 | 119 | 113 | 47 | 3 |
| Wholesale and retail trade; repair of motor vehicles and motorcycles | 7 | 59 | 105 | 142 | 144 | 51 | 6 |
| Real estate activities | <1 | 3 | 7 | 10 | 10 | 4 | <1 |
| Financial and insurance activities | <1 | 5 | 10 | 13 | 15 | 6 | <1 |
| Agriculture, forestry and fishing | 6 | 23 | 26 | 39 | 49 | 31 | 2 |
| Accommodation and food service activities | 3 | 22 | 44 | 70 | 73 | 24 | 3 |
11. SEISS claims by claim band
Across all 5 grants around 4.6 million (44%) of claims were between £1,000 and £2,500. The £1,500 to £2,000 claim band contained the highest number of claims for the first 4 grants. The £1,000 to £1,500 contained the highest number of claims for the fifth grant, reflecting the large proportion of individuals that claimed the lower 30% grant.
There were 233,000 claims for the maximum £7,500 grant which could only be claimed for the first, third, fourth and fifth grants. For the second grant individuals could claim a 70% grant and of the 84,000 claims in the £6,500 to £7,000, the majority will have claimed the maximum grant.
Figure 28: Number of claims across all 5 grants received, by claim band
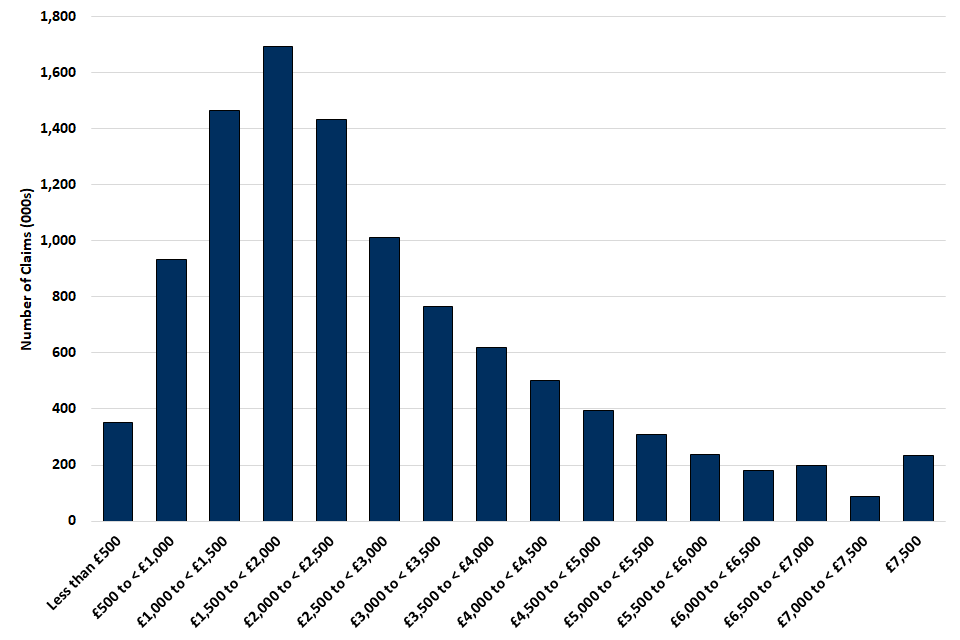
Table 24: Number of claims across all 5 grants received, by claim band
| Value of claims | First grant claims (000s) | Second grant claims (000s) | Third grant claims (000s) | Fourth grant claims (000s) | Fifth grant claims (000s) | Total number of claims (000s) |
|---|---|---|---|---|---|---|
| Up to < £500 | 83 | 86 | 62 | 44 | 75 | 350 |
| £500 to < £1000 | 196 | 235 | 168 | 137 | 200 | 935 |
| £1,000 to < £1,500 | 326 | 385 | 287 | 256 | 212 | 1,466 |
| £1,500 to < £2,000 | 400 | 405 | 352 | 325 | 210 | 1,692 |
| £2,000 to < £2,500 | 363 | 306 | 314 | 288 | 160 | 1,432 |
| £2,500 to < £3,000 | 258 | 215 | 220 | 208 | 110 | 1,011 |
| £3,000 to < £3,500 | 199 | 170 | 168 | 157 | 69 | 764 |
| £3,500 to < £4,000 | 164 | 137 | 137 | 127 | 55 | 619 |
| £4,000 to < £4,500 | 136 | 108 | 112 | 101 | 43 | 500 |
| £4,500 to < £5,000 | 111 | 82 | 90 | 79 | 33 | 395 |
| £5,000 to < £5,500 | 89 | 62 | 71 | 61 | 25 | 308 |
| £5,500 to < £6,000 | 70 | 46 | 55 | 46 | 19 | 237 |
| £6,000 to < £6,500 | 55 | 35 | 42 | 35 | 14 | 182 |
| £6,500 to < £7,000 | 43 | 84 | 32 | 27 | 11 | 197 |
| £7,000 to < £7,500 | 33 | 0 | 25 | 20 | 8 | 87 |
| £7500 | 94 | 0 | 67 | 51 | 21 | 233 |
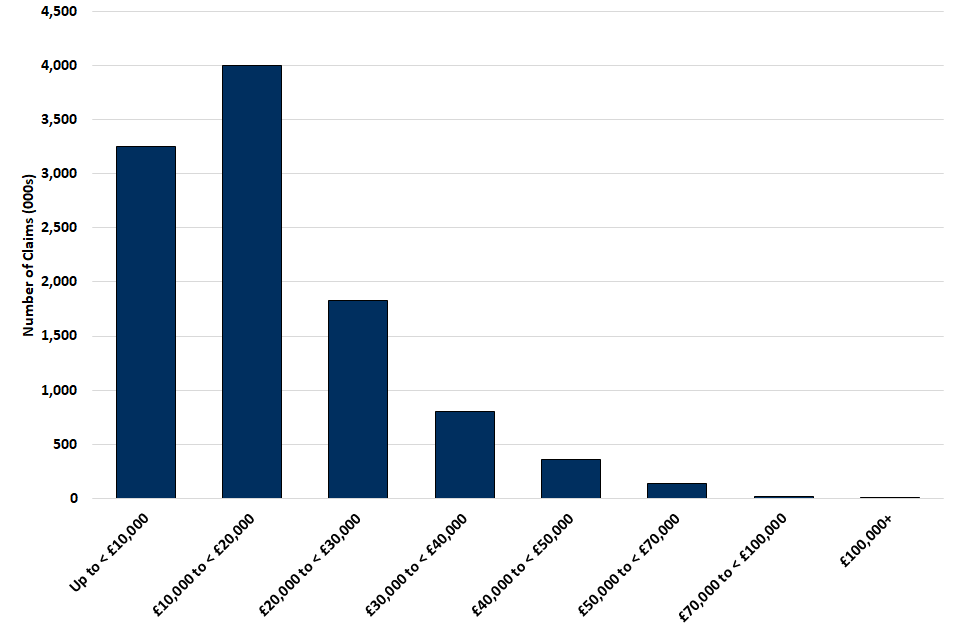
12. SEISS claims by income band
Across all 5 grants around 4 million (38%) claims were made by individuals with a total income between £10,000 and £20,000. There were 3.3 million (31%) claims by individuals with a total income under £10,000, and 0.2 million claims by individuals with a total income above £50,000.
Total income refers to all sources of income stated in an individual’s Self Assessment tax return. In order to be eligible for the grant individuals must have income from self-employment of £50,000 or less. However, they may have income from other sources and so their total income can be above this amount.
For the first 3 grants, total income is based on information on Self Assessment tax returns for the tax year 2018 to 2019. For the fourth and fifth grant, total income is based on information on Self Assessment tax returns for tax year 2019 to 2020.
Figure 29: Number of claims across all 5 grants, by income band1
Note:
- It is possible for an individual to be deemed eligible to claim a grant based on average trading profits over the last 3 or 4 years, hence some individuals with income above £100,000 feature in the chart.
Table 25: Number of claims across all 5 grants received, by income band1
| Income band | First grant claims (000s) | Second grant claims (000s) | Third grant claims (000s) | Fourth grant claims (000s) | Fifth grant claims (000s) | Total number of claims (000s) |
|---|---|---|---|---|---|---|
| Up to < £10,000 | 803 | 730 | 697 | 616 | 407 | 3,253 |
| £10,000 to < £20,000 | 987 | 894 | 846 | 771 | 498 | 3,995 |
| £20,000 to < £30,000 | 467 | 416 | 383 | 342 | 220 | 1,829 |
| £30,000 to < £40,000 | 216 | 189 | 167 | 143 | 88 | 804 |
| £40,000 to < £50,000 | 102 | 88 | 75 | 61 | 36 | 363 |
| £50,000 to < £70,000 | 40 | 34 | 28 | 25 | 14 | 141 |
| £70,000 to < £100,000 | 6 | 5 | 4 | 4 | 2 | 20 |
| £100,000+ | <1 | <1 | <1 | <1 | <1 | 2 |
Note:
- It is possible for an individual to be deemed eligible to claim a grant based on average trading profits over the last 3 or 4 years, hence some individuals with income above £100,000 feature in the chart.
13. Comparing claimants of all 5 grants
Of the 2.9 million individuals that claimed at least one grant, 1 million individuals claimed all 5 grants. 1.6 million individuals claimed each of the first 4 grants.
Around 100,000 claims for each of the fourth and fifth grant were made by individuals who were not eligible to claim the first 3 grants.
There is only a small population who first claimed a grant later than their first opportunity to do so. Around 100,000 individuals claimed the second grant without having claimed the first. There are very few cases where individuals made their first claim for the third grant. Figure 30 below shows for each grant whether individuals claiming each grant were first time claimants or had claimed a previous grant.
Figure 30: Number of claimants having previously claimed a grant, by grant
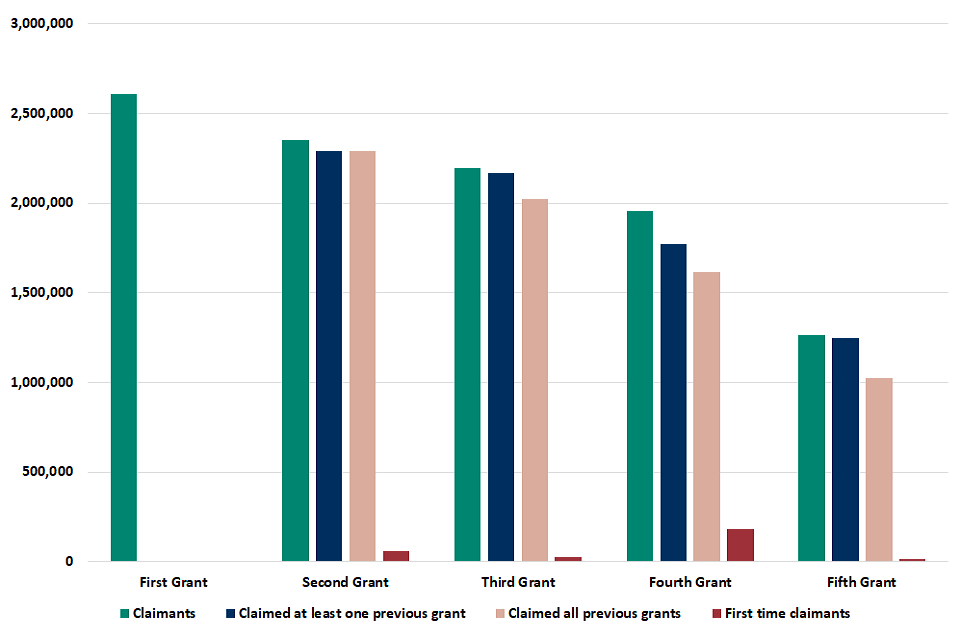
Table 26: Number of claimants for each grant, by previous claims
| First grant | Second grant | Third grant | Fourth grant | Fifth grant | |
|---|---|---|---|---|---|
| Claimants | 2,610,000 | 2,351,000 | 2,194,000 | 1,958,000 | 1,262,000 |
| Of which have claimed at least one previous grant | N/A | 2,290,000 | 2,165,000 | 1,774,000 | 1,245,000 |
| Of which have claimed all previous grants | N/A | 2,290,000 | 2,021,000 | 1,615,000 | 1,025,000 |
| Of which are first time claimants | N/A | 61,000 | 28,000 | 184,000 | 17,000 |
14. SEISS fifth grant reported turnover reductions
By 28 October 2021, there had been 1.26 million claimants for the fifth grant, having a combined value of £2.85 billion. Comparing reported turnover for the claimants in tax year 2020 to 2021 with their selected reference year’s turnover shows that 1,058,000 (84%) of claimants reported a reduction in turnover.
Newly self-employed individuals (62,000) were not assessed on turnover reduction. Newly self-employed individuals and those who reported a 30% or greater turnover reduction were able to claim the higher grant (71% of all claimants).
A reduction of 50% or more of pre-pandemic turnover was reported by 529,000 claimants (42%) who claimed £1.4 billion (49% of the value claimed).
140,000 (11%) claimants reported an increase in turnover or no turnover change. Claims from this group totalled £140 million (5% of the value claimed). Eligibility for the fifth grant was based on income rules and trading activity being impacted coronavirus, as with all previous grants. Turnover was used to determine whether a claimant was eligible for the higher or lower grant.
In order to claim the fifth SEISS grant individuals must have had a new or continuing impact from coronavirus between 1 May 2021 and 30 September 2021. Individuals reporting no change or an increase in turnover are still eligible to claim the fifth SEISS grant. The turnover declaration compares a reference year (either 2018 to 2019 or 2019 to 2020) to the pandemic year (a 12-month period beginning between 1 and 6 April 2020 inclusive). Individuals may have seen an impact to their trade despite an increase in turnover if their costs and profits were impacted or their turnover was less than expected as a result of coronavirus.
Figure 31: Reported Turnover Reduction by claimants of the fifth grant by 28 October 2021
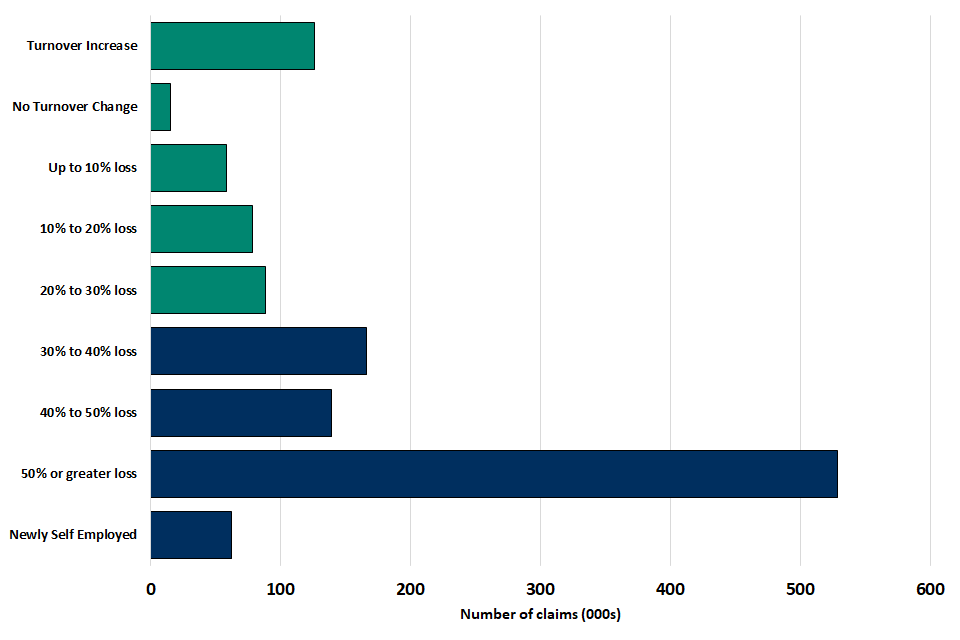
Table 27: The turnover reduction reported by claimants of the fifth grant
| Reported Turnover Change | Total no. of all claims made (000s) | Total value of all claims made (£m) | Average value of all claims made (£) |
|---|---|---|---|
| Newly self-employed, exempt from turnover declaration | 62 | 142 | 2,300 |
| No turnover change or increase | 140 | 140 | 1,000 |
| Up to 10% turnover reduction | 58 | 68 | 1,200 |
| 10% to less than 20% turnover reduction | 78 | 96 | 1,200 |
| 20% to less than 30% turnover reduction | 88 | 106 | 1,200 |
| 30% to less than 40% turnover reduction | 166 | 489 | 2,900 |
| 40% to less than 50% turnover reduction | 139 | 398 | 2,900 |
| 50% or more turnover reduction | 529 | 1407 | 2,700 |
| Total | 1,262 | 2,846 | 2,300 |
Background to the SEISS
The Self-Employment Income Support Scheme (SEISS) was announced on 26 March 2020 as part of the UK government’s support package for businesses and self-employed people during the coronavirus (COVID-19) outbreak in early 2020.
The scheme was open to self-employed individuals and members of a partnership who met the following criteria:
- traded in the tax year 2018 to 2019 and submitted their Self Assessment tax return on or before 23 April 2020 for that year, and
- traded in the tax year 2019 to 2020, and
- intend to continue to trade in the tax year 2019 to 2020, and
- carried on a trade which had been adversely affected by COVID-19
A business could be adversely affected by COVID-19 if, for example:
They were unable to work because they:
- were shielding
- were self-isolating
- were on sick leave because of COVID-19
- had caring responsibilities because of COVID-19
They have had to scale down or temporarily stop trading because:
- their supply chain had been interrupted
- they had fewer or no customers or clients
- their staff were unable to come in to work
The grant was not open to limited companies or those operating a trade through a trust.
To work out eligibility, HMRC first looked at the 2018 to 2019 Self Assessment tax return. Trading profits must have been between £0 and £50,000 and at least equal to non-trading income. If an individual was not eligible based on the 2018 to 2019 Self Assessment tax return, HMRC then looked at an average of the tax years 2016 to 2017, 2017 to 2018, and 2018 to 2019.
The scheme allowed an eligible individual to claim a taxable grant worth 80% of 3 months’ average trading profits, paid out in a single instalment and capped at £7,500 in total. The first grant closed for claims on 13 July 2020.
On the 17 August 2020 applications for the second grant opened. This was a taxable grant worth 70% of 3 months’ average trading profits, paid out in a single instalment and capped at £6,570 in total. The second grant closed for claims on 19 October 2020.
On 30 November 2020 applications for the third grant opened. This was a taxable grant worth 80% of 3 months’ average trading profits, paid out in a single instalment and capped at £7,500 in total. The third grant closed for claims on 29 January 2021.
The eligibility rules changed slightly for the third grant. To be eligible for the third grant an individual must have been eligible for the first and second grant and also declared that they intended to continue to trade and either:
- were currently actively trading but were impacted by reduced activity, capacity or demand due to COVID-19
- were previously trading but were temporarily unable to do so due to COVID-19
The Government announced at Spring Budget 2021 that the Self-Employment Income Support Scheme (SEISS) would continue until September, with a fourth and a final fifth grant.
On 22 April 2021 applications for the fourth grant opened. The claims window closed on 1 June 2021. Eligibility for the fourth grant was based on a person’s tax returns for either:
- the 2019 to 2020 tax year, or
- an average of the consecutive tax years 2016 to 2017, 2017 to 2018, 2018 to 2019, and 2019 to 2020, if a person was not eligible based on 2019 to 2020 alone
With the 2019 to 2020 tax year assessed for the first time, some individuals could claim a grant that were previously unable to do so. These individuals were described as either:
- newly self-employed, meaning the individual started trading in 2019 to 2020 having not traded in any of 2016 to 2017, 2017 to 2018 or 2018 to 2019.
- previously ineligible, meaning they were assessed for the third grant, but did not meet the criteria for eligibility, for example because their trading profit was less than their non-trading income
On 29 July 2021 applications for the fifth grant opened. The claims window closed on 30 September 2021. This grant introduced 2 levels of grant based on the reduction in turnover experienced, between an individual’s reference year (either 2018 to 2019 or 2019 to 2020) and their pandemic year (a 12-month period starting between 1 April and 6 April 2021 inclusive). These 2 levels were either:
- a grant of 80% of 3 months’ average trading profits capped at £7,500 for those with a turnover down by 30% or more, or
- a grant of 30% of 3 months’ average trading profits capped at £2,850 for those with a turnover down by less than 30%
To be eligible for the higher grant, the individual’s turnover must have fallen by 30% or more between their reference year and the pandemic year. Newly self-employed individuals were not subject to the turnover test and could claim the higher grant.
The statistics presented in this release cover claims for all the grants in the scheme.
More information about the claiming grants can be found at HMRC’s coronavirus (COVID-19) guidance and support page on gov.uk.
Glossary
The assessed for potential eligibility population are those self-employed individuals who HMRC identified as having traded in the tax year 2019 to 2020 and submitted their Self Assessment tax return on or before 2 March 2021 for that year.
The SEISS potentially eligible population are those who HMRC identified as being potentially eligible for a grant based on the information held from their Self Assessment tax returns relating to the tax years; 2016 to 2017, 2017 to 2018, 2018 to 2019, and 2019 to 2020. This is the group who have been invited to claim for a grant. This does not attempt to assess if a business was affected by coronavirus (COVID-19) or whether they continued trading after 2019 to 2020. So, it is the potentially eligible population based only on the information in the Self Assessment returns and not all will apply for the grant.
The assessed to be ineligible population are those self-employed individuals who HMRC identified as having traded in the tax year 2019 to 2020 and submitted their Self Assessment tax return on or before 2 March 2021 for that year but were found not to be eligible after being assessed against the SEISS criteria. Trading profits must be between £0 and £50,000 and at least equal to non-trading income. For an individual to be found ineligible based on the income criteria they need to be found ineligible based on the 2019 to 2020 Self Assessment tax return and the combination of the relevant fields for consecutive tax years 2016 to 2017, 2017 to 2018, 2018 to 2019, and 2019 to 2020. Individuals are also included in the ineligible figures in this publication if an individual’s grant calculation resulted in an amount of £0 or less and if they are recorded as having ceased trading on the Self Assessment systems.
The number of claims is defined as the total number of individuals who had submitted a claim for a grant that had been either paid, sent for payment or had been received and were awaiting various checks. Only non-rejected claims are included, with the majority of these having been paid or sent for payment. However, a small number of claims were still being processed and could be rejected.
Methodology and data sources
Coverage
This publication covers all self-employed individuals that made at least one claim for any of the 5 grants as at 28 October 2021. For the first 3 grants, this includes individuals that HMRC identified as having traded in the tax year 2018 to 2019 and having submitted their Self Assessment tax return on or before 23 April 2020 for that year. For the fourth and fifth grant, this includes individuals that HMRC identified as having traded in tax year 2019 to 2020 and submitted their Self Assessment tax return on or before 2 March 2021 for that year.
Small changes in the numbers of eligible and ineligible individuals between publications may be observed as HMRC continue to review and monitor HMRC data systems to identify all potentially eligible individuals and to ensure that only genuine HMRC customers are invited to claim.
The claim information covers individuals who had submitted a claim for the grant by 28 October 2021 which had not been rejected or failed certain compliance checks.
Data sources used in this release
The data for this release come from HM Revenue and Customs’ (HMRC’s) system for administering SEISS. It covers the whole population rather than a sample of people or companies.
Additional data from HM Revenue and Customs’ (HMRC’s) Self Assessment system and other HMRC administrative systems has been matched with SEISS data to produce the data released here.
The age, gender and postcode of residential address has been collected from the Self Assessment account for each individual. The industry information has been collected from the Self Assessment tax return for the tax year ending 5 April 2020 and relates to the self-employment business description provided on that return.
To produce the geographic breakdowns, the claimants’ residential postcode has been matched to Office for National Statistics (ONS) data that links UK Post Codes to geographic areas. The geographic areas that have been presented in this release are Country and English Region, Local Authority and Parliamentary Constituency.
The Self Assessment system is a live operational dataset and, as such, details such as residential address may be updated at any point. The allocation of geography and industry in these statistics is based on the latest reported information. As a result, it is possible for an individual claimant’s characteristics to change between the first publication of SEISS statistics on 11 June 2020 and subsequent publications.
Strengths and limitations
Experimental Statistics status
This release is classed as Experimental Statistics as the methodologies used to produce the statistics are still in their development phase. This does not mean that the statistics are of low quality, but it does signify that the statistics are new and still being developed. As the methodologies are refined and improved, there may be revisions to these statistics.
HMRC SEISS Management Information
Management information (MI) on the number and value of SEISS claims received had been published by HMRC at various dates since the scheme was launched on 13 May 2020.
This MI report will no longer be published and instead the HMRC Coronavirus (COVID-19) statistics page will point towards these statistics.
Differences compared to Survey of Personal Incomes
In HMRC’s Survey of Personal Incomes individuals are considered as self-employed if HMRC received or expects to receive SA forms covering income from self-employment in their 2018 to 2019 Self Assessment tax return.
The population assessed for SEISS eligibility here includes only those individuals who submitted 2019 to 2020 Self Assessment tax returns by 2 March 2021 and included data on self-employment in that return.
Differences compared to other sources
Other organisations such as the Office for National Statistics and Institute for Fiscal Studies have published information about SEISS either from surveys or estimates derived from previously published data. We believe these HMRC statistics provide a more reliable picture as they are based on administrative data from the SEISS claim and Self Assessment systems.