Extensions of stay
Published 26 November 2015
Valid: 26 November 2015 to 24 February 2016
Data relate to the year ending September 2015 and all comparisons are with the year ending September 2014, unless indicated otherwise.
Back to ‘Immigration statistics July to September 2015’ content page.
This is not the latest release. View latest release.
1. Key facts
There were 280,753 decisions on extensions in the year ending September 2015, 8% fewer than in the previous 12 months. Four-fifths of decisions were grants (224,918) and a fifth (55,835) were refusals.
There were 82,263 work-related grants of extensions in the year ending September 2015, 8% lower than in the previous 12 months (89,115). There was a 2% fall for Tier 2 Skilled Work (to 59,574), a fall of 58% for Tier 1 Entrepreneurs (to 3,196) following tightening of rules to prevent abuse, and a fall of 25% in the Tier 1 General category (to 6,779) reflecting its previous closure to new entrants.
Study-related grants of extensions fell by nearly a quarter (-23%) to 69,011 in the year ending September 2015, likely reflecting falling numbers of study visas from 2010 to 2013 and tighter rules such as the new use of the “genuineness” test. For further details see the study topic.
Family-related grants of extensions increased by 15% (+5,503 to 42,131) in the year ending September 2015. This was largely accounted for by a 4,083 increase in grants to partners (to 22,831). The increase in grants to partners likely reflects a longer probationary period before it is possible to apply to stay in the UK permanently (settlement) and a requirement to obtain an extension after two and a half years, under new family rules implemented from 9 July 2012.
There were 55,835 refusals of an extension in the year ending September 2015 of which 7,966 related to work, 13,370 to study, 16,189 to family and 18,310 to other categories. Correspondingly the refusal rates for work, study, family and other categories were 9%, 16%, 28% and 37% respectively.
2. Grants of extensions by reason, and refusals
| Year | Total decisions | Total grants | Work | Study | Family (1) | Other (1) | Refusals |
|---|---|---|---|---|---|---|---|
| Year ending September 2011 | 356,886 | 302,601 | 128,927 | 129,158 | 17,645 | 26,871 | 54,285 |
| Year ending September 2012 | 304,487 | 273,115 | 142,400 | 92,997 | 15,459 | 22,259 | 31,372 |
| Year ending September 2013 | 361,921 | 285,334 | 129,900 | 99,851 | 36,579 | 19,004 | 76,587 |
| Year ending September 2014 | 306,755 | 247,362 | 89,115 | 89,405 | 36,628 | 32,214 | 59,393 |
| Year ending September 2015 | 280,753 | 224,918 | 82,263 | 69,011 | 42,131 | 31,513 | 55,835 |
| Change: latest 12 months | -26,002 | -22,444 | -6,852 | -20,394 | +5,503 | -701 | -3,558 |
| Percentage change | -8% | -9% | -8% | -23% | +15% | -2% | -6% |
Table notes
Source: Home Office, Immigration Statistics July to September 2015, Extensions table ex 01 q.
(1) The introduction of the new Family Life (10-year) route in July 2012,‘Statement of intent:
Family migration’ means that the total number of Family and Other grants are not fully comparable over time.
3. Long-term trends in grants and refusals of extensions of stay
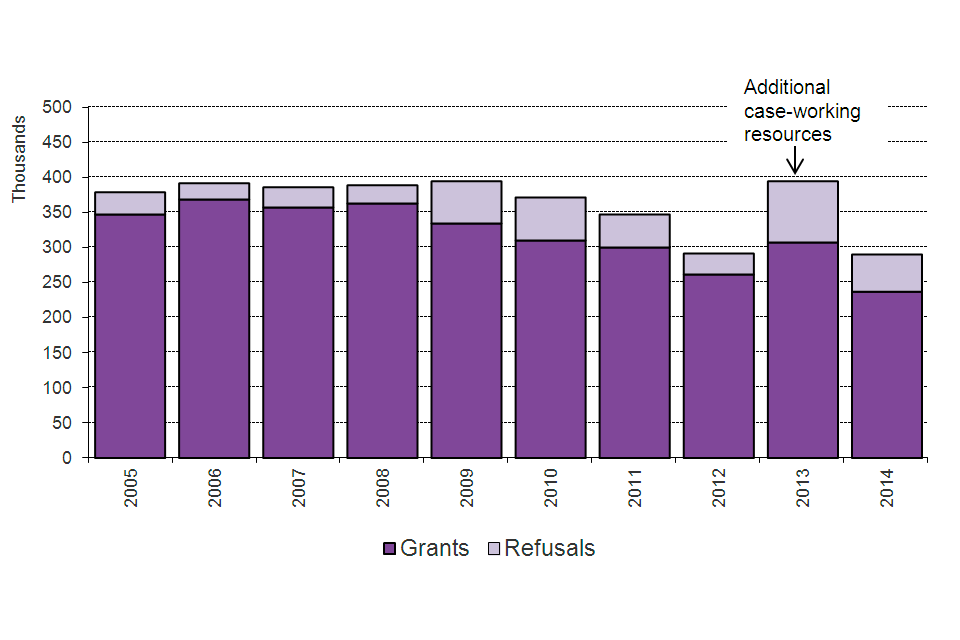
The chart below illustrates longer-term trends in grants and refusals to extend stay by calendar year.

The chart shows grants and refusals of an extension of stay between 2005 and the latest calendar year. Additional case-working resources in 2013. The chart is based on data in Table ex 01.
Chart notes
Source: Home Office, Immigration Statistics July to September 2015, Extensions table ex 01.
4. Nationalities granted an extension
(excludes dependants)
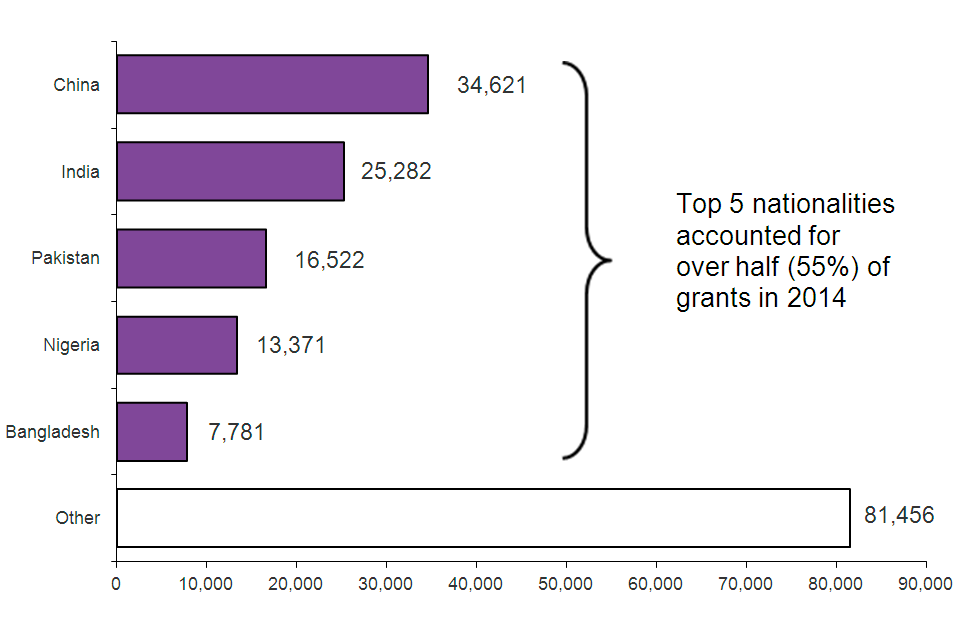
Top 5 nationalities granted an extension to stay, 2014
(Total number of grants 179,033, excludes dependants)

The chart shows grants of extension of stay by nationality in 2014. Top 5 nationalities accounted for over half (55%) of grants in 2014. The chart is based on data in Table ex 02.
Chart notes
Source: Home Office, Immigration Statistics July to September 2015, Extensions table ex 02.
5. Data tables
Further data are available in Extensions tables ex 01 to expc 01 o.
More detailed analysis on family extensions and additional tables for years ending June were included in the Immigration Statistics April to June 2015 release [Family topic] to assist users in understanding the trends before and after the changes to the Family Immigration Rules in July 2012.
A short statistical article on ‘Extensions of stay by previous category’ was published alongside the Immigration Statistics April to June 2013 release to provide further detailed information. Updates of the more detailed tables provided in the article are included in the Extensions tables.
6. Background information
The figures in this section relate to individuals inside the UK extending or changing the status of their stay in the UK. Data include dependants unless stated otherwise.
The numbers reflect past changes in the levels of those entering the UK in different categories, policy and legislative changes, e.g. closure of categories or changes to the length of visas granted to people entering the UK, or to the rules on whether individuals can switch categories. The figures also may reflect the level of case-working resources available.
