A return to inspection: the story (so far) of previously exempt outstanding schools
Updated 22 November 2022
Applies to England

© Crown copyright 2022
This publication is licensed under the terms of the Open Government Licence v3.0 except where otherwise stated. To view this licence, visit nationalarchives.gov.uk/doc/open-government-licence/version/3 or write to the Information Policy Team, The National Archives, Kew, London TW9 4DU, or email: psi@nationalarchives.gov.uk.
Where we have identified any third party copyright information you will need to obtain permission from the copyright holders concerned.
This publication is available at https://www.gov.uk/government/publications/school-inspections-statistical-commentaries-2021-to-2022/a-return-to-inspection-the-story-so-far-of-previously-exempt-outstanding-schools
Introduction
In 2012, the Department for Education made outstanding primary and secondary schools exempt from routine inspection. This was intended to reduce what they perceived as the ‘burden’ of inspection and provide greater freedoms for highly performing state-funded schools. The exemption ran for 8 years until it was lifted in 2020.
During the period of the exemption, we could still inspect exempt schools if we had concerns. These concerns could be triggered by a risk assessment (based on data such as school performance data, workforce data, contextual data and complaints); or by a significant change to the school (such as taking on an extra key stage). The number of inspections varied by year, but for instance in 2018/19 we inspected 11% of the group.
Many schools moved out of local authority control to become academies during this time. Although these academies were legally new schools, government policy was that they inherited the exemption from their predecessor school.
We visited very few previously exempt schools in 2020/21, because of the pandemic. This commentary is therefore largely based on inspections in 2021/22.
In this commentary, we look at what happened during the period of the exemption, and at what we have seen since the exemption was lifted. We will publish a fuller report in early 2023, which will include an analysis of the issues found in schools inspected in 2021/22 that were judged to be no longer outstanding.
Movement in and out of the outstanding category during the exemption period
There were 3,900 outstanding primary and secondary schools when the exemption was introduced, and 3,400 were outstanding when it ended. Although these numbers are similar, the composition of the list changed substantially during those 8 years. There were 1,400 schools that remained outstanding throughout the period because they were not inspected at all and so kept their grade, and 570 that were inspected but remained outstanding. About 1,900 schools ceased to be outstanding (usually after an inspection triggered by a risk assessment) and 1,500 additional schools were judged outstanding.
Figure 1: Changes in the cohort of outstanding exempt schools, 2012 to 2020
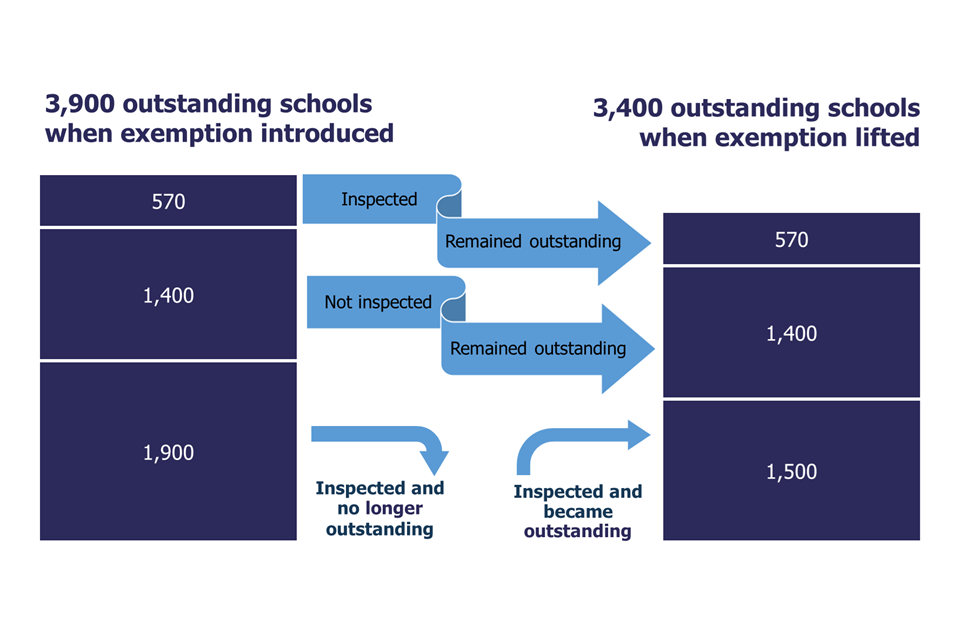
Note: The number of schools for when the exemption was introduced are as at 8 June 2012, and numbers for when the exemption was lifted are as at 30 November 2020.
All numbers relate to mainstream primary and secondary schools only. Nursery schools, special schools and alternative provision were not exempt.
Numbers are rounded so may not add up to the totals exactly.
Number of schools in brackets
View data in an accessible table format.
We carried out 2,900 inspections of outstanding schools in the exemption period (including some schools that we visited more than once). [footnote 1]
Of these inspections, 71% resulted in the school no longer being judged to be outstanding. Whilst we did inspect schools where we had concerns, this proportion is high and shows the importance of routine inspection. Of the schools that were no longer outstanding:
- 51% became good
- 16% required improvement
- 4% were inadequate
The position at the end of the exemption
When the exemption ended, 43% of the 3,400 exempt schools had not had a graded inspection for at least 10 years, as their last graded inspection was between September 2005 and August 2010. A further 38% had gone between 5 and 10 academic years (last inspected 2010 to 2015). Since their last inspection, many of these schools will have had a new headteacher, new governors, and (especially the secondary schools) become part of an academy trust.
Figure 2: Outstanding schools by date of last graded inspection, November 2020 (percentages)
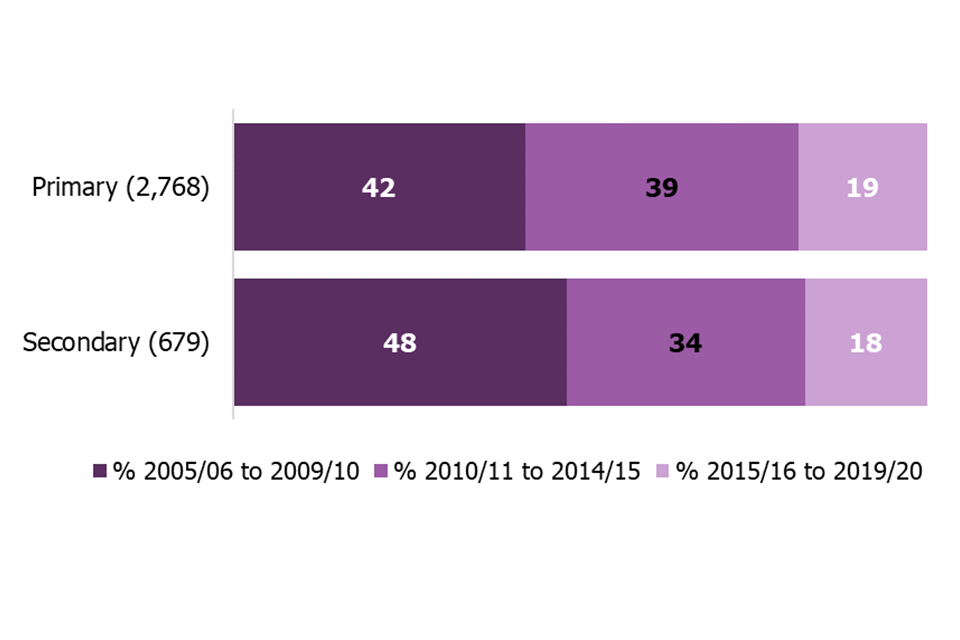
Note: Number of schools in brackets
View data in an accessible table format.
The inspection model has changed significantly since most of these schools were last inspected.
For around a fifth of the 3,400 schools, their last graded inspection was one of the lighter-touch ‘reduced tariff inspections’ carried out between 2006 and 2009. Eighty-two per cent had not been inspected under either our common inspection framework (used between 2015 and 2019) or our current education inspection framework, which has different sub-judgements and more emphasis on the curriculum.
This makes it difficult to know how much schools changed during the time they were exempt, and when any decline may have happened: a lower grade may reflect changes that happened years earlier, under different leadership.
Inspections since the exemption ended – overview
In March 2020, routine inspection was suspended due to the pandemic, and when the exemption ended in November 2020, we had yet to return to a normal inspection programme. Normal inspections resumed for all types of school from September 2021.
All previously exempt outstanding schools have now returned to a regular inspection cycle. We are prioritising those that have gone the longest without an inspection. The date of their last inspection determines the type of inspection. Schools last inspected before September 2015 have a graded inspection, while those inspected since September 2015 usually have an ungraded one.[footnote 2]
In 2021/22, we inspected over 500 previously exempt schools.[footnote 3] We will have inspected all previously exempt schools by the end of July 2025.
Graded inspections
Around 370 schools had a graded inspection in 2021/22. On average, their last inspection was over 13 years earlier. This means they had been risk assessed many times, but their data had not raised sufficient concerns to lead to an inspection.
When inspected, 17% remained outstanding, 62% became good and 21% were judged requires improvement or inadequate.
Figure 3: Outcomes of graded inspections of previously exempt schools in 2021/22 by phase
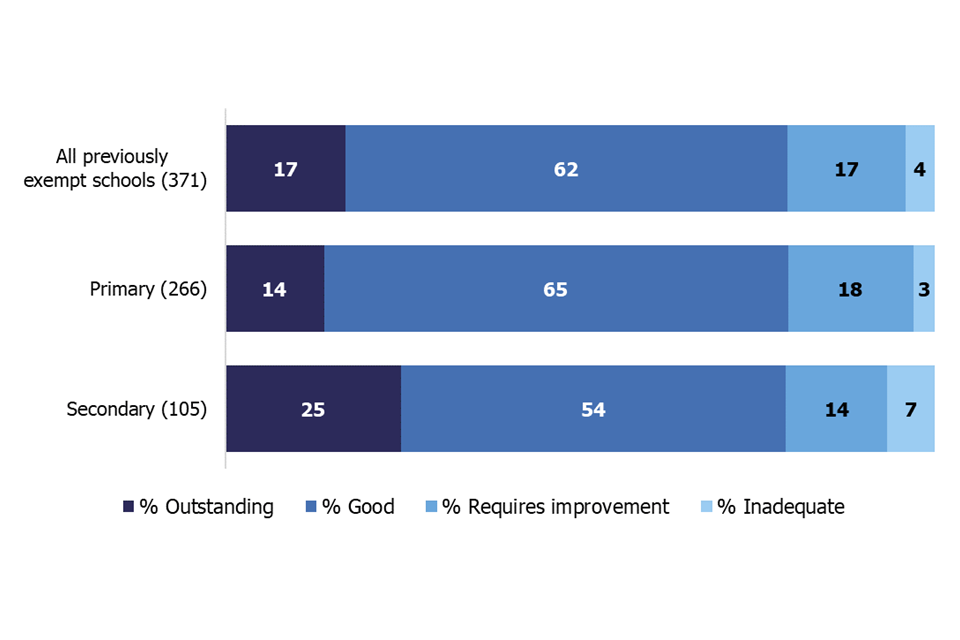
Note: Number of schools in brackets
View data in an accessible table format.
Prioritising schools that have gone the longest without a graded inspection may mean that schools inspected in 2021/22 are not typical of all exempt schools, and the pattern of inspection outcomes may change later. The schools that had a graded inspection last year do represent the schools that had not been inspected for the longest, and about which we therefore had the most concerns and decided to visit in 2021/22.
Ungraded inspections
Schools graded outstanding after September 2015 usually receive ungraded inspections. These inspections cannot change the overall effectiveness grade, but can flag concerns that a school may no longer be outstanding.
We carried out 130 ungraded inspections of previously exempt schools and identified concerns in 59% of them. These schools will have time to make improvements before receiving a graded inspection around 12 months later.
Figure 4: Outcomes of ungraded inspection outcomes of previously exempt schools in 2021/22, by phase
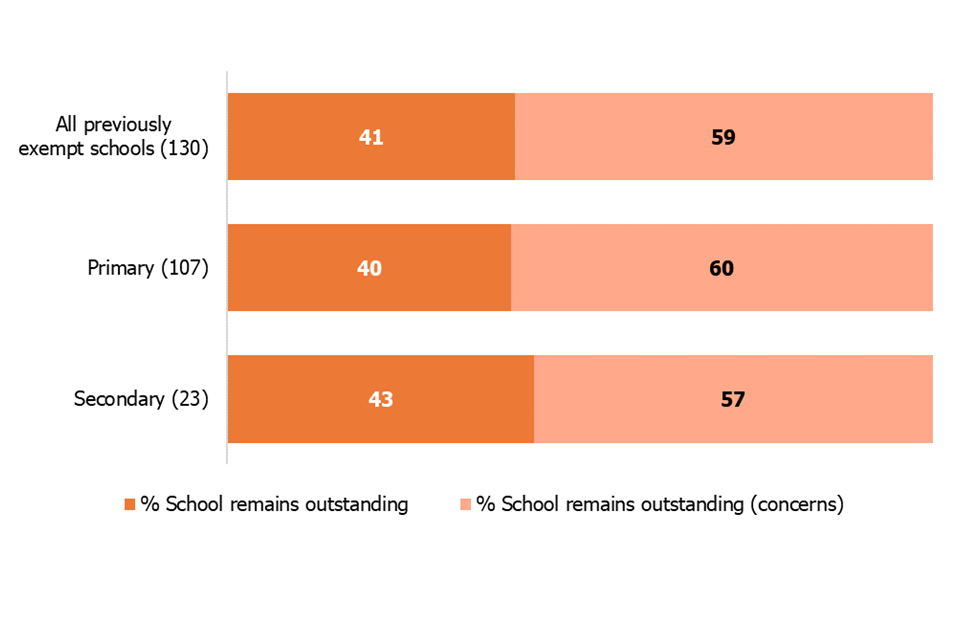
Note: Number of schools in brackets
View data in an accessible table format.
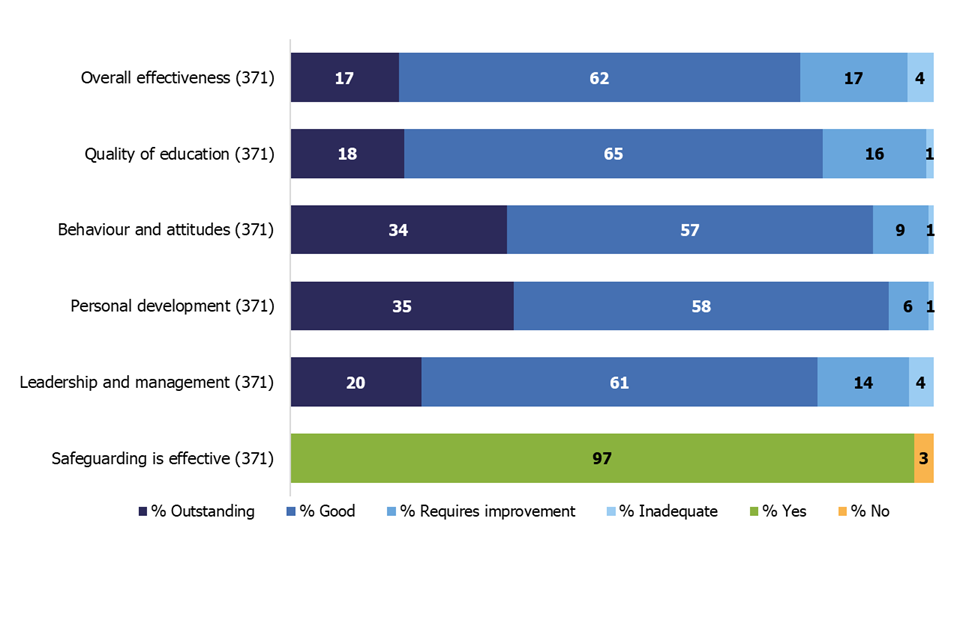
Outcomes for each of the key judgements in graded inspections in 2021/22
Most schools that that did not remain outstanding were graded less than outstanding for both quality of education and for leadership and management. A higher proportion of schools were judged outstanding for behaviour and attitudes and personal development. This relationship between the different judgements exists for graded inspections generally, and is not specific to outstanding or previously outstanding schools.[footnote 4]
Very few previously outstanding schools were judged ineffective for safeguarding, though safeguarding was a weakness for a small number of schools (3%).
Figure 5: Outcomes of graded inspections of previously exempt schools in 2021/22, by judgement
Note: Number of schools in brackets
View data in an accessible table format.
Outcomes for different types of schools in graded inspections in 2021/22
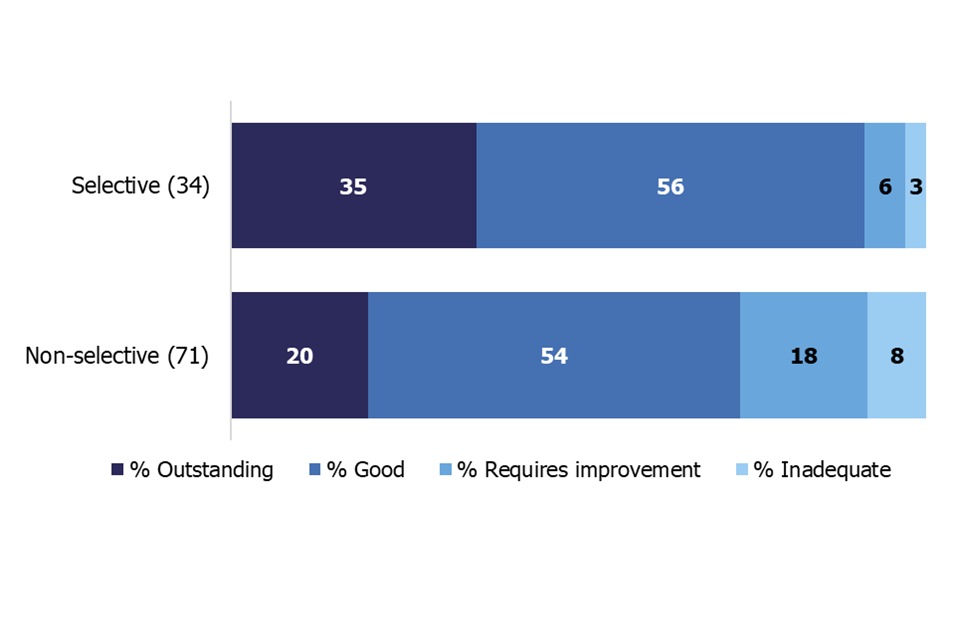
Selective status
Selective schools such as grammar schools were more likely to remain outstanding than non-selective schools, and less likely to be judged requires improvement or inadequate even when they received a lower grade. However, this is based on just 34 selective schools.
Figure 6: Outcomes of graded inspections of previously exempt secondary schools in 2021/22, by selective status
Note: Number of schools in brackets
View data in an accessible table format.
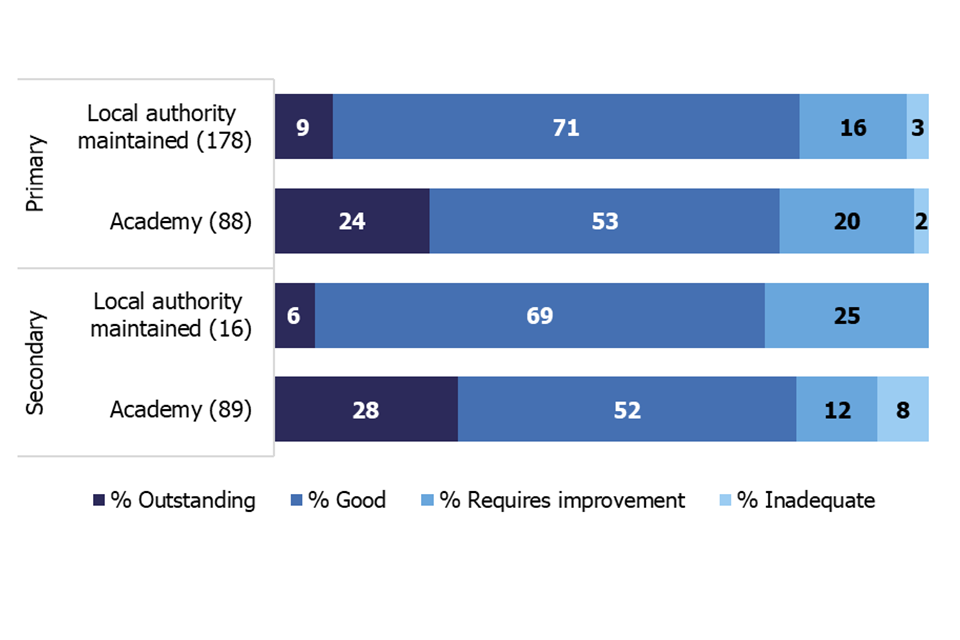
Type of school
When the exemption began, just 2% of outstanding primary and secondary schools were academies and free schools at the time of their last inspection.[footnote 5] By the time the exemption ended, 45% were academies and free schools. Seventy-nine per cent of these schools were in multi-academy trusts.
In 2021/22, the academies were more likely than maintained schools to remain outstanding. This was the case for both primary and secondary schools. However, in the case of secondary schools (most of which are now academies), the comparison is based on just 16 local authority (LA) schools.
Figure 7: Outcomes of graded inspections of previously exempt schools in 2021/22, by type
Note: Number of schools in brackets
View data in an accessible table format.
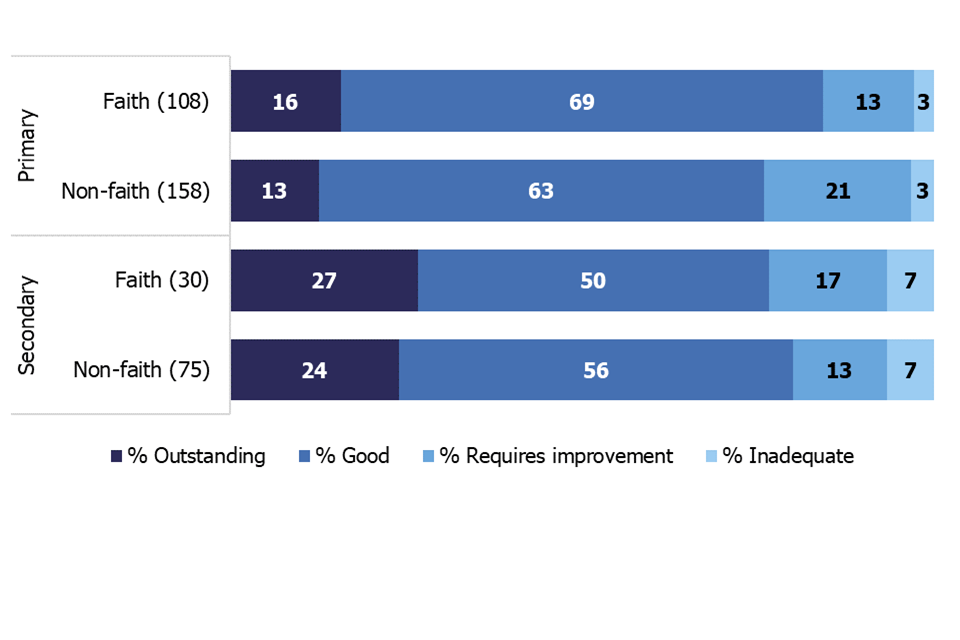
Faith
There was a mixed picture for schools of different faiths, but overall faith schools were slightly more likely to remain outstanding than non-faith schools. The vast majority of faith schools inspected were Christian schools.
Figure 8: Outcomes of graded inspections of previously exempt schools in 2021/22, by faith
Note: Number of schools in brackets
View data in an accessible table format.
Deprivation
There was a complicated pattern of outcomes by deprivation level, but when comparing the 2 most deprived groups to the 2 least deprived groups, the deprived primary schools were more likely to remain outstanding. [footnote 6]
Figure 9: Outcomes of graded inspections of previously exempt schools in 2021/22, by deprivation
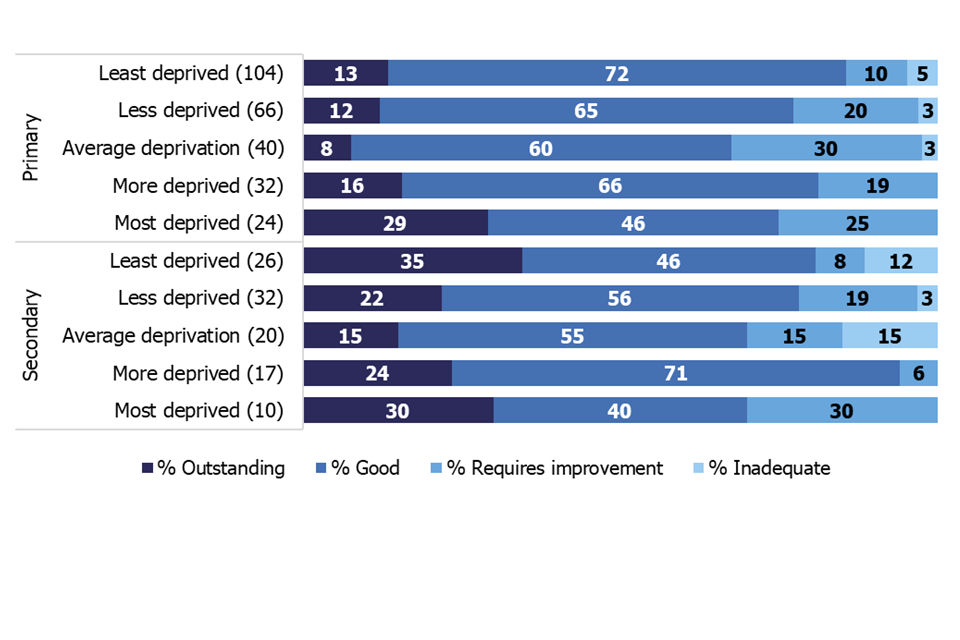
Note: Number of schools in brackets
View data in an accessible table format.
How do inspection outcomes for previously exempt schools compare with other schools?
The outstanding schools that had a graded inspection in 2021/22, which on average had not been inspected for over 13 years, are by definition unusual. This makes it difficult to compare the inspection outcomes of the 370 schools we visited last year with those of other schools, and to draw any conclusions. The way outstanding schools are selected for inspection (based on time since last inspection) also makes it difficult to compare inspection outcomes during and after the period of the exemption. The following charts attempt to put this year’s outcomes in context but they are not a like-for-like comparison.
Twenty-one per cent of the previously exempt primary schools that had a graded inspection in 2021/22 were judged to require improvement or to be inadequate. Ten per cent of all open primary schools received a grade of requires improvement or inadequate at their most recent inspection.[footnote 7]
Figure 10: Comparing outcomes of graded inspections of previously exempt primary schools with inspections of other schools
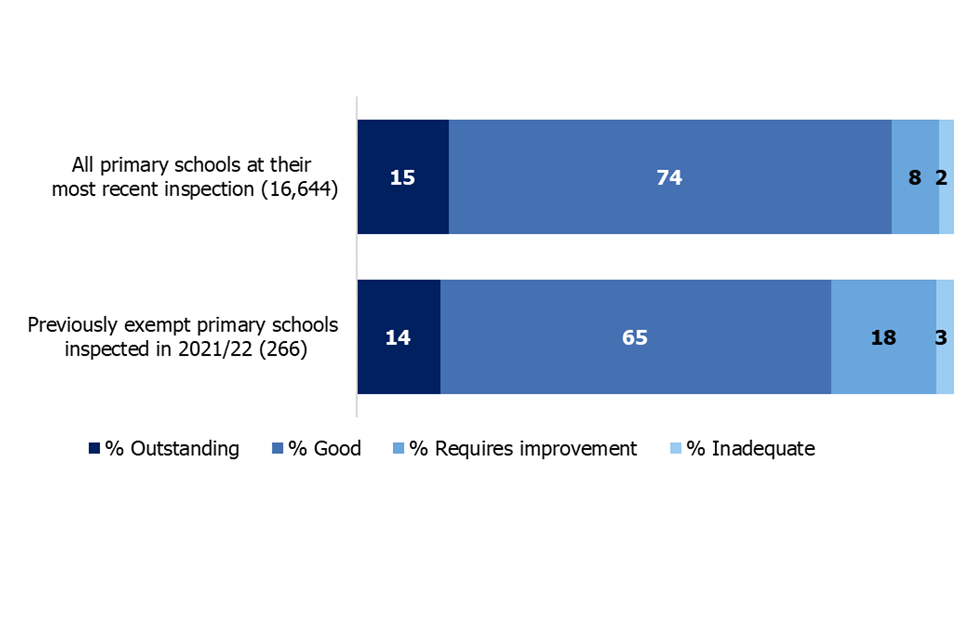
Note: Number of schools in brackets
View data in an accessible table format.
Twenty-one per cent of the previously exempt secondary schools that had a graded inspection in 2021/22 were judged to require improvement or to be inadequate. Twenty per cent of all open secondary schools received a grade of requires improvement or inadequate at their most recent inspection.
Figure 11: Comparing outcomes of graded inspections of previously exempt secondary schools with inspections of other schools
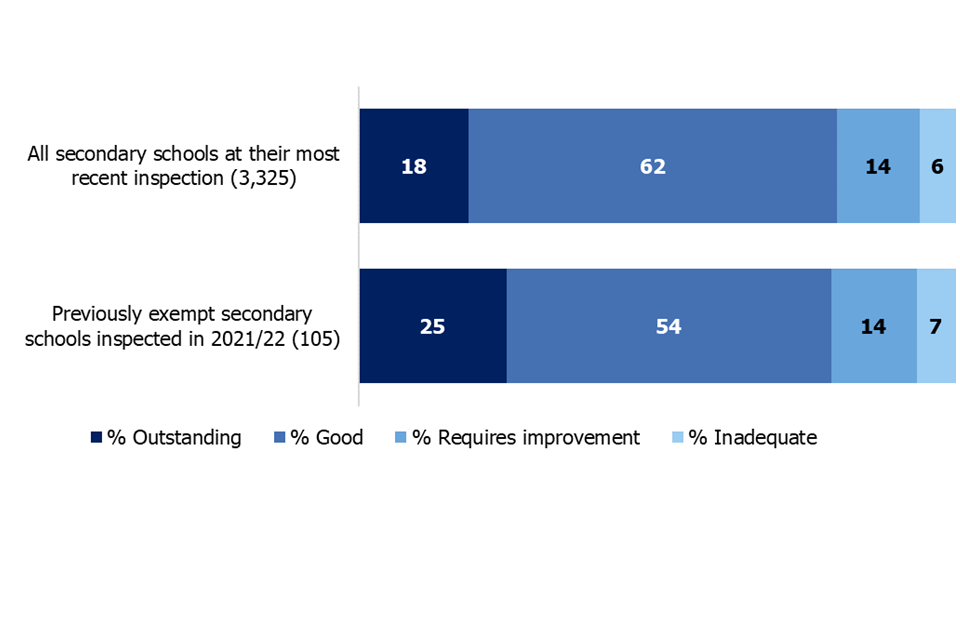
Note: Number of schools in brackets
View data in an accessible table format.
Summary and look ahead
During the 8 years of the exemption, we could only inspect outstanding schools if we had concerns. Of the schools that we inspected in the period, 570 were inspected and remained outstanding throughout, 1,900 schools ceased to be outstanding and 1,500 additional schools became outstanding (see Figure 1). A further 1,400 schools were not inspected and so also remained outstanding.
When the exemption ended in 2020, there were 3,400 outstanding schools. We had not inspected 82% for at least 5 years, and not inspected around half of these for at least 10 years (see Figure 2). This also means that these schools had not been inspected under our current or previous inspection frameworks. Many of the schools became academies, and many will have had a change of headteacher in this time.
In 2021/22, we resumed inspections and inspected over 500 schools that were previously exempt. Of the schools that had a graded inspection, 17% retained their outstanding grade, 62% became good and 21% were judged requires improvement or inadequate (see Figure 3). On average, we have not inspected these schools for over 13 years, so they may not be typical of all exempt schools. Nevertheless, the performance of these schools is concerning, and a higher proportion now require improvement or are inadequate than is the case for all schools nationally, especially for the primary schools (see Figure 10 and Figure 11).
Looking at 2021/22 graded inspections in more detail, so far the groups most likely to keep their outstanding grade have been: the secondary schools; selective secondary schools; academies; faith schools; and deprived primary schools. See Figure 3, Figure 6, Figure 7, Figure 8 and Figure 9). However, many of these comparisons are based on small numbers so should be used with caution.
We will inspect all previously exempt outstanding schools by the end of July 2025. During that time, we will continue to monitor their outcomes, which may change, as the schools we visit over the next few years will have been inspected more recently than the ones we visited this year.
We will publish a fuller report on exempt schools in spring 2023, including an analysis of what inspectors found in the 2021/22 inspections.
Annex: data tables for figures
Data for figure 1: Changes in the cohort of outstanding exempt schools, 2012 to 2020
| Changes in the cohort | Number of schools |
|---|---|
| Outstanding schools when exemption introduced | 3900 |
| Inspected remained outstanding | 570 |
| Not inspected remained outstanding | 1,400 |
| Inspected, no longer outstanding | 1,900 |
| Outstanding schools when exemption lifted | 3,400 |
| Inspected and became outstanding | 1,500 |
See Figure 1
Data for figure 2: Outstanding schools by date of last graded inspection, November 2020 (percentages)
| Primary (2,768) | Secondary (679) | |
|---|---|---|
| 2005/06 to 2009/10 | 42% | 48% |
| 2010/11 to 2014/15 | 39% | 34% |
| 2015/16 to 2019/20 | 19% | 18% |
Note: Number of schools in brackets
See Figure 2
Data for figure 3: Outcomes of graded inspections of previously exempt schools in 2021/22 by phase
| Type of school | Number of schools | % Outstanding | % Good | % Requires improvement | % Inadequate |
|---|---|---|---|---|---|
| All previously exempt schools | 371 | 17 | 62 | 17 | 4 |
| Primary | 266 | 14 | 65 | 18 | 3 |
| Secondary | 105 | 25 | 54 | 14 | 7 |
See Figure 3
Data for figure 4: Outcomes of ungraded inspection outcomes of previously exempt schools in 2021/22, by phase
| Type of school | Number of schools | School remains outstanding | School remains outstanding (concerns) |
|---|---|---|---|
| All previously exempt schools | 130 | 41 | 59 |
| Primary | 107 | 40 | 60 |
| Secondary | 23 | 43 | 57 |
See Figure 4
Data figure 5: Outcomes of graded inspections of previously exempt schools in 2021/22, by judgement
| Outcome | Number of schools | % Outstanding | % Good | % Requires improvement | % Inadequate |
|---|---|---|---|---|---|
| Overall effectiveness | 371 | 17 | 62 | 17 | 4 |
| Quality of education | 371 | 18 | 65 | 16 | 1 |
| Behaviour and attitudes | 371 | 34 | 57 | 9 | 1 |
| Personal development | 371 | 35 | 58 | 6 | 1 |
| Leadership and management | 371 | 20 | 61 | 14 | 4 |
| Outcome | Number of schools | Yes | No |
|---|---|---|---|
| Safeguarding is effective | 371 | 97 | 3 |
See Figure 5
Data for figure 6: Outcomes of graded inspections of previously exempt secondary schools in 2021/22, by selective status
| Selective status | Number of schools | % Outstanding | % Good | % Requires improvement | % Inadequate |
|---|---|---|---|---|---|
| Selective | 34 | 35 | 56 | 6 | 3 |
| Non-selective | 71 | 20 | 54 | 18 | 8 |
See Figure 6
Data for figure 7: Outcomes of graded inspections of previously exempt schools in 2021/22, by type
| School type | Number of schools | % Outstanding | % Good | % Requires improvement | % Inadequate |
|---|---|---|---|---|---|
| Primary: Local authority maintained | 178 | 9 | 71 | 16 | 35 |
| Primary: Academy | 88 | 24 | 53 | 20 | 2 |
| Secondary: Local authority maintained | 16 | 6 | 69 | 25 | 0 |
| Secondary: Academy | 89 | 28 | 52 | 12 | 8 |
See Figure 7
Data for figure 8: Outcomes of graded inspections of previously exempt schools in 2021/22, by faith
| School type | Number of schools | % Outstanding | % Good | % Requires improvement | % Inadequate |
|---|---|---|---|---|---|
| Primary: faith | 108 | 16 | 69 | 13 | 3 |
| Primary: non-faith | 158 | 13 | 63 | 21 | 3 |
| Secondary: faith | 30 | 27 | 50 | 17 | 7 |
| Secondary: non-faith | 75 | 24 | 56 | 13 | 7 |
See Figure 8
Data for figure 9: Outcomes of graded inspections of previously exempt schools in 2021/22, by deprivation
| School type | Number of schools | % Outstanding | % Good | % Requires improvement | % Inadequate |
|---|---|---|---|---|---|
| Primary: least deprived | 104 | 13 | 72 | 10 | 5 |
| Primary: less deprived | 66 | 12 | 65 | 20 | 3 |
| Primary: average deprivation | 40 | 8 | 60 | 30 | 3 |
| Primary: more deprived | 32 | 16 | 66 | 19 | 0 |
| Primary: most deprived | 24 | 29 | 46 | 25 | 0 |
| Secondary: least deprived | 26 | 35 | 46 | 8 | 12 |
| Secondary: less deprived | 32 | 22 | 56 | 19 | 3 |
| Secondary: average deprivation | 20 | 15 | 55 | 15 | 15 |
| Secondary: more deprived | 17 | 24 | 71 | 6 | 0 |
| Secondary: most deprived | 10 | 30 | 40 | 30 | 0 |
See Figure 9
Data for figure 10: Comparing outcomes of graded inspections of previously exempt primary schools with inspections of other schools
| Number of schools | % Outstanding | % Good | % Requires improvement | % Inadequate | |
|---|---|---|---|---|---|
| All primary schools at their most recent inspection | 16,644 | 15 | 74 | 8 | 2 |
| Previously exempt primary schools inspected in 2021/22 | 266 | 14 | 65 | 18 | 3 |
See Figure 10
Data for figure 11: Comparing outcomes of graded inspections of previously exempt secondary schools with inspections of other schools
| School type | Number of schools | % Outstanding | % Good | % Requires improvement | % Inadequate |
|---|---|---|---|---|---|
| All secondary schools at their most recent inspection | 3,325 | 18 | 62 | 14 | 6 |
| Previously exempt secondary schools inspected in 2021/22 | 105 | 25 | 54 | 14 | 7 |
See Figure 11
-
This figure is based on all types of inspections, including full graded section 5 inspections and other inspections such as no formal designation visits. Schools were only inspected if there was either a concern or a substantial change, such as taking on an additional key stage. ↩
-
Graded inspections are carried out under section 5 of the Education Act and ungraded ones are carried out under section 8. ↩
-
All analysis of 2021/22 inspection outcomes is based on inspection reports published by 31 October 2022. To see the full list of schools inspected see ‘Management information – state-funded schools – as at 31 Oct 22’, Ofsted, 2022. ↩
-
For instance, see page 53 of ‘The Annual Report of Her Majesty’s Chief Inspector of Education, Children’s Services and Skills 2019/20’, Ofsted, December 2020. ↩
-
Based on the 3,900 schools that were outstanding in 2012 when the exemption came in, and the type of school they had been at the time of their last graded inspection. ↩
-
Deprivation level is based on the Income Deprivation Affecting Children Index (IDACI). It is based on the home postcodes of the pupils attending the school rather than the location of the school. Schools are placed into quintiles from least to most deprived. ↩
-
Includes inspections carried out and published by 31 October 2022. ↩