Police use of firearms statistics, England and Wales: financial year ending 31 March 2014
Published 9 July 2015
Applies to England and Wales

© Crown copyright 2015
This publication is licensed under the terms of the Open Government Licence v3.0 except where otherwise stated. To view this licence, visit nationalarchives.gov.uk/doc/open-government-licence/version/3 or write to the Information Policy Team, The National Archives, Kew, London TW9 4DU, or email: psi@nationalarchives.gov.uk.
Where we have identified any third party copyright information you will need to obtain permission from the copyright holders concerned.
This publication is available at https://www.gov.uk/government/statistics/police-use-of-firearms-statistics-england-and-wales-financial-year-ending-31-march-2014/police-use-of-firearms-statistics-england-and-wales-financial-year-ending-31-march-2014
The Home Office is seeking feedback on this publication so that we can assess how well it meets our users’ needs and make improvements where possible. If you have not already done so, please could you complete a short five-minute survey.
1. Introduction
This release contains statistics on police use of firearms across England and Wales in the year ending March 2014. It details the total number of:
- police firearms’ operations (operations in which firearms were authorised)
- police firearms’ operations involving Armed Response Vehicles (ARVs)
- police firearms’ operations where firearms were discharged (number of incidents where conventional firearms were discharged)
- police firearms officers (authorised firearms officers (AFOs))
The statistics in this release can be found in the ‘Police use of firearms, England and Wales, year ending March 2014: data tables’. The tables include force and regional breakdowns.
Section 5, Additional information, provides supplementary detail on:
- the coverage of the statistics
- work undertaken to ensure the statistics were of sufficient quality to continue publishing as official statistics
- comparability with figures before the year ending March 2009
- revisions to previously published figures
- the review of Taser data and other uses of force led by Chief Constable David Shaw
- future work to develop this release
- how to provide feedback and enquiries
2. Key Facts
- there were 14,864 police firearms’ operations in the year ending March 2014; this represents a decrease of 4% (-590) compared with the previous year and a fall of 36% (-8,317) since the year ending March 2009
- there were 12,061 police firearms’ operations involving Armed Response Vehicles (ARVs) in the year ending March 2014; this represents a decrease of 4% (-559) compared with the previous year and a fall of 36% (-6,813) since the year ending March 2009
- in the year ending March 2014, 81% of police firearms’ operations involved ARVs; the proportion has remained fairly stable since the year ending March 2009
- the police discharged firearms in 2 operations in the year ending March 2014; the figure has been six or less in each of the previous 5 years
- there were 5,875 police firearms’ officers as at 31 March 2014; this represents a decrease of 4% (-217) compared with the previous year and a fall of 15% (-1,031) since 31 March 2009
3. Police firearms’ operations and police firearms’ operations involving Armed Response Vehicles (ARVs)
There were 14,864 police firearms’ operations in the year ending March 2014. This represents a decrease of 4% (-590) compared with the previous year and a fall of 36% (-8,317) since the year ending March 2009.
There were 12,061 police firearms’ operations involving ARVs in the year ending March 2014. This represents a decrease of 4% (-559) compared with the previous year and a fall of 36% (-6,813) since the year ending March 2009.
As Figure 1 shows, there has been a consistent downward trend for both measures since the year ending March 2009. Of the police firearms’ operations, the proportion involving ARVs has remained fairly stable throughout the series, and accounted for 81% of operations in the year ending March 2014.
Figure 1: Police firearms’ operations and police firearms’ operations involving ARVs, year ending March 2009 to 2014, England and Wales
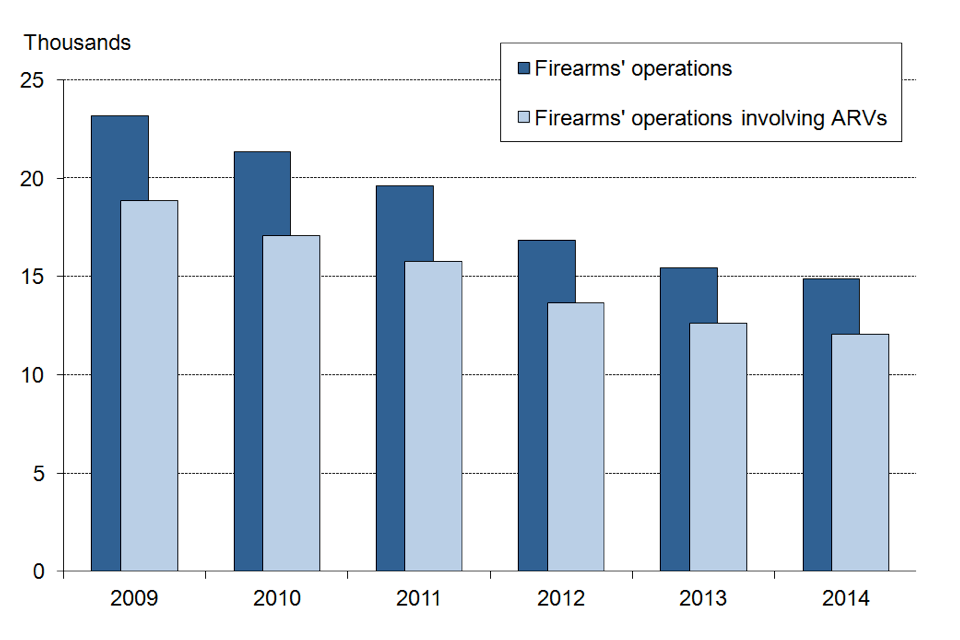
Source: Police use of firearms, England and Wales, year ending March 2014, data tables 1 and 2.
The police discharged firearms in 2 operations in the year ending March 2014. The figure has been six or less in each of the previous 5 years.
4. Police firearms officers
There were 5,875 police firearms officers as at 31 March 2014. This represents a decrease of 4% (-217) compared with the previous year and a fall of 15% (-1,031) since 31 March 2009. As Figure 2 shows, there has been a general downward trend in the number of police firearms’ officers over the last 6 years.
Figure 2: Police firearms’ officers, as at 31 March 2009 to 2014, England and Wales
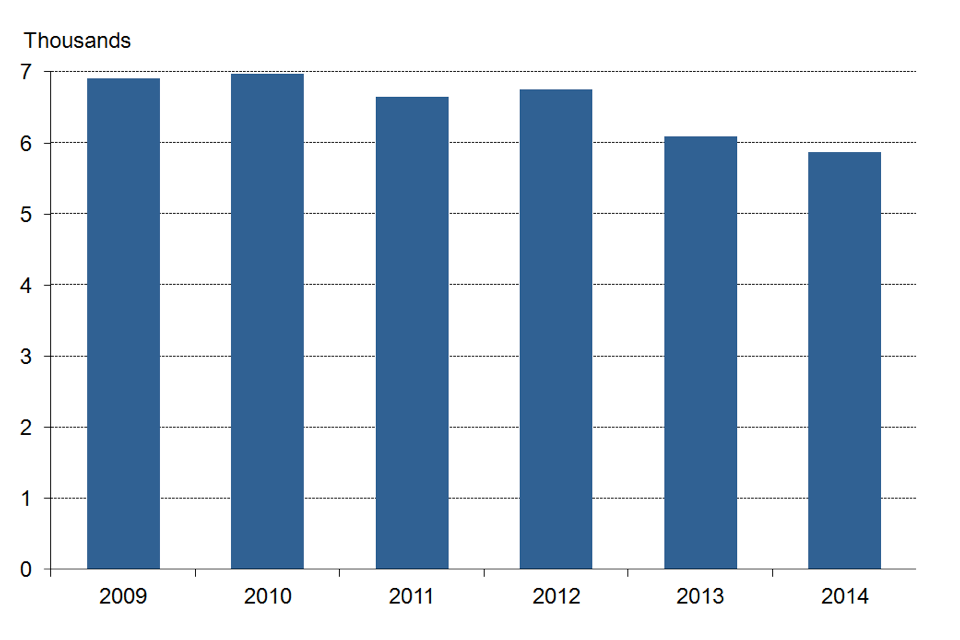
Source: Police use of firearms, England and Wales, year ending March 2014, data table 3.
5. Additional information
5.1 Coverage
This release contains statistics on police use of firearms across England and Wales for the year ending March 2014 and for the years going back to the year ending March 2009. It details trends on the total number of:
- police firearms’ operations (operations in which firearms were authorised)
- police firearms’ operations involving Armed Response Vehicles (ARVs)
- police firearms’ operations where firearms were discharged (number of incidents where conventional firearms were discharged)
- police firearms officers (authorised firearms officers (AFOs))
The statistics in this release are based on aggregated figures provided by individual police forces as part of the Home Office Annual Data Requirement (ADR). The ADR is a list of all mandatory data requests made to police forces in England and Wales under the Home Secretary’s statutory powers.
Police firearms’ operations are defined in the ADR notes for guidance as operations involving the authorised deployment of Authorised Firearms Officers (AFOs) where they may have to protect themselves or others from a person who (a) is in possession of a firearm, (b) has immediate access to a firearm or (c) is otherwise so dangerous that the officer’s use of a firearm may be necessary.
An AFO is a police officer who has been selected, trained, accredited and authorised by their chief officer to carry a firearm operationally.
Deployments also include those incidents where AFOs ‘self-authorise’. This is when AFOs encounter situations where they believe that the criteria for AFO deployment have been met, and delay in seeking authority to deploy would be detrimental to public or officer safety, so AFOs deploy themselves and take the necessary and proportionate action in accordance with their training.
ARVs are police vehicles carrying armed AFOs. Police firearms’ operations involving ARVs are a subset of total police firearms’ operations. Police firearms’ operations involving ARVs are defined in the ADR notes for guidance as those where the initial or sole response was by an ARV.
Each incident is classed as only one operation regardless of the number of personnel (or deployments) or tactics employed to deal with the incident.
The following are excluded from the figures:
- operations where officers had not commenced their task before being stood down (e.g. operation was cancelled before arrival or did not move from a rendezvous point into actual deployment)
- deployments for VIP protection, armed prisoner escorts, airport patrols, other guarding duties, and routine patrols
The number of police firearms’ operations where firearms were discharged does not include discharges for animal destruction or during police training.
5.2 Work undertaken to ensure the statistics were of sufficient quality to continue publishing as official statistics
On 23 March 2015, the Home Secretary announced the suspension of the Police use of firearms statistical publication (and the Police use of Taser statistical publication) due to data quality concerns. To address these, Home Office officials, along with the National Armed Policing Secretariat, carried out an internal review of the reporting process. Following the review, officials (including Home Office statisticians) undertook rigorous variance and validation checks to tackle data quality issues for data relating to the year ending March 2014 and for previously published data going back to the year ending March 2009.
In addition, the Home Office Chief Statistician wrote to all Chief Constables and Commissioners asking them to confirm the data published in this release.
In light of the above, the Home Office Chief Statistician is now satisfied that the figures are of sufficient quality to publish them as official statistics. However, as is common using data extracted from forces’ systems, figures may not necessarily be accurate to the last digit and may be subject to future revisions.
5.3 Comparability with figures before the year ending March 2009
The figures in this release cover the period between the years ending March 2009 and 2014. Whilst data from the year ending March 2002 onwards is available, any comparisons between data before and after the year ending March 2009 should be made with caution. This is because whilst figures preceding the year ending March 2009 were subjected to a data confirmation exercise before they were initially published, they were not subjected to the same rigorous data validation or variance checks which have been applied this year (see section 5.2 above). Therefore, the quality of these figures may not be of the same standard.
Nonetheless, figures for the year ending March 2002 to the year ending March 2008, which include force level breakdowns, can be accessed here.
5.4 Revisions analysis
A number of forces submitted revisions in light of the work outlined in section 5.2 (see above). Of the 43 forces, 24 submitted revisions for at least one measure. Forces cited ‘Operational’ factors, such as the changing of reporting systems, as the main reasons for changes in the figures.
As shown in the table below, forces submitted revisions which resulted in the total number of police firearms’ operations increasing for all years, ranging from 34% in the year ending March 2012 (4,307) to 50% in the year ending March 2010 (7,119). Whilst nearly all forces had previously provided figures on the number of police firearms’ operations involving ARVs, several forces indicated that they had not included these in their figure for the number of police firearms’ operations, as is required. This was a key driver for the upward revisions.
Total number of police firearms’ operations, comparison between the figures in the previous release and the figures in this release, years ending March 2009 to 2013
| Year ending March | Figures in the previous release | Figures in this release | Change | % Change | Number of forces that made revisions |
|---|---|---|---|---|---|
| 2009 | 16,456 | 23,181 | 6,725 | 41 | 14 |
| 2010 | 14,218 | 21,337 | 7,119 | 50 | 6 |
| 2011 | 13,496 | 19,619 | 6,123 | 45 | 8 |
| 2012 | 12,550 | 16,857 | 4,307 | 34 | 11 |
| 2013 | 10,996 | 15,454 | 4,458 | 41 | 13 |
For the number of police firearms’ operations involving ARVs, as shown in the table below, revisions resulted in total decreases across all years, except for the year ending 2010, which had an increase of 0.2% (31). The year ending March 2011 figure had the biggest decrease (-6% or -1,002).
Total number of police firearms’ operations involving armed response vehicles, comparison between the figures in the previous release and the figures in this release, years ending March 2009 to 2013
| Year ending March | Figures in the previous release | Figures in this release | Change | % Change | Number of forces that made revisions |
|---|---|---|---|---|---|
| 2009 | 19,928 | 18,874 | -1,054 | -5 | 9 |
| 2010 | 17,068 | 17,099 | 31 | 0.2 | 8 |
| 2011 | 16,774 | 15,772 | -1,002 | -6 | 7 |
| 2012 | 14,261 | 13,672 | -589 | -4 | 11 |
| 2013 | 13,116 | 12,620 | -496 | -4 | 12 |
- Cheshire and Cleveland were previously unable to provide figures for the years ending March 2010 and 2012 respectively on the number of police firearms’ operations involving ARVs. The forces have now been able to provide this information and it is included in this publication for the first time.
After the revisions to the figures for the number of police firearms’ operations and the number of police firearms’ operations involving ARVs, the downward trend remains unaffected with the year ending March 2014 figures around two-thirds the year ending March 2009 level.
Looking at the revisions to the total number of police firearms’ officers, as the table below shows, only two forces submitted revisions which resulted in little or no change to the overall numbers.
Total number of police firearms’ officers, comparison between the figures in the previous release and the figures in this release, as at 31 March 2009 to 2013
| As at 31 March | Figures in the previous release | Figures in this release | Change | % Change | Number of forces that made revisions |
|---|---|---|---|---|---|
| 2009 | 6,906 | 6,906 | 0 | 0 | 0 |
| 2010 | 6,979 | 6,976 | -3 | -0.04 | 1 |
| 2011 | 6,653 | 6,653 | 0 | 0 | 0 |
| 2012 | 6,756 | 6,756 | 0 | 0 | 0 |
| 2013 | 6,091 | 6,092 | 1 | 0.02 | 1 |
The data for the latest year (and for other years) may be revised in due course. It is standard practice across all Home Office statistical releases to incorporate revisions for previous years’ data in the latest release. Corrections and revisions follow the Home Office corporate revisions policy (see page 6).
5.5 Review of Taser data and other police use of force
In October 2014, the Home Secretary announced that the national policing lead for conflict management, Chief Constable David Shaw, would conduct an in-depth review of the publication of Taser data and other use of force by police officers. The review will present options for publishing data on how police officers are deploying their sensitive powers, who they are being used on and what the outcome was. Recommendations from the Review will feed into future plans to develop this release.
5.6 Developing the police use of firearms and Taser statistical releases
In parallel with the Review of Taser data and other police use of force, Home Office statisticians will continue to review the arrangements for producing this release. By improving current practices and taking measures to ensure compliance with the Code of Practice (for Official Statistics), the aim of Home Office statisticians is to resume a more regular publication schedule and potentially apply for National Statistics status, after considering the recommendations from the David Shaw review. Home Office statisticians have already taken the following steps to improve the publication and make it more in line with other Home Office statistical releases:
- to ensure the statistics were of sufficient quality to continue publishing as official statistics, officials undertook rigorous variance checks, validity checks and a data confirmation exercise which included sign-off from Chief Constables and Commissioners (see section 5.2)
- the clarity and format of both the commentary and data tables have been enhanced. The order of Tables 2 and 3 has been swapped to ensure a more logical order; Table 2 now provides figures on police firearms’ operations involving ARVs, which is a subset of the police firearms’ operations figures in Table 1; Table 3 now provides figures on police firearms’ officers
- a revisions section which details changes to previously published figures has now been included
- a statistical news release has now been provided
- accompanying ODS data tables have been provided to improve the accessibility and usability of the statistics
- users of this release have been asked to complete a short feedback survey so that the Home Office can assess how well the release meets users’ needs and make improvements where possible (see 5.7 ‘User feedback and enquiries’); in addition, a clear point of contact has been included so users can make enquiries
Going forward, Home Office statisticians will continue to improve the quality of the outputs in this release so that they are more aligned with National Statistics publications. For example, developing a comprehensive user guide which will document definitions, processes, uses made of the statistics, etc. In addition, statisticians will:
- in collaboration with forces, develop recording and validation practices
- assess the feedback gained from the user survey to ensure users’ needs are met and improvements are made where possible; authors will document the findings in the next release
- review the publication schedule to ensure more timely and regular statistics are provided
5.7 Feedback and enquiries
The Home Office is seeking feedback on this publication so that we can assess how well it meets our users’ needs and make improvements where possible. If you have not already done so, please could you complete a short five-minute survey.
If you would like to make an enquiry about this release, please email the Chief Statistician’s Unit at: CSU.Statistics@homeoffice.gov.uk.