Police use of firearms statistics, England and Wales: April 2016 to March 2017
Published 27 July 2017
Applies to England and Wales

© Crown copyright 2017
This publication is licensed under the terms of the Open Government Licence v3.0 except where otherwise stated. To view this licence, visit nationalarchives.gov.uk/doc/open-government-licence/version/3 or write to the Information Policy Team, The National Archives, Kew, London TW9 4DU, or email: psi@nationalarchives.gov.uk.
Where we have identified any third party copyright information you will need to obtain permission from the copyright holders concerned.
This publication is available at https://www.gov.uk/government/statistics/police-use-of-firearms-statistics-england-and-wales-april-2016-to-march-2017/police-use-of-firearms-statistics-england-and-wales-april-2016-to-march-2017
1. Introduction
This release contains statistics on police use of firearms from the 43 Home Office police forces in England and Wales in the year ending 31 March 2017. It details the total number of:
- police firearms operations [footnote 1], including operations involving Armed Response Vehicles (ARVs)
- incidents in which police firearms were discharged [footnote 2]
- armed officers [footnote 3]
- armed officers compared with the total number of all police officers
Previous publications covered the number of ‘authorised firearms officers’ (AFOs). Following feedback from the National Police Chiefs’ Council (NPCC), College of Policing, and various police forces, data from 2016 to 2017 is being collected on the number of ‘armed officers’. This refers to all officers who are authorised to use firearms, which should incorporate all operationally deployable armed officers, including those currently being utilised as trainers. This change in definition was implemented to increase clarity, as the term ‘AFO’ can be used to refer specifically to an armed officer trained at the basic level as well as to any officer who is authorised to use firearms in general. All 43 forces were contacted to ascertain how this change in definition affected the figures submitted for this year. Of the 42 forces that responded, only 2 forces reported that the change in definition affected their figures. The change accounted for less than 0.5% of the total number of armed officers as at 31 March 2017. As such, the figures for 31 March 2017 are perceived as comparable to figures from previous publications.
The user guide provides additional information on the statistics in this release. It also includes a glossary and sections on data quality and revisions.
The figures in this release cover the period between the years ending 31 March 2009 and 31 March 2017. Although figures prior to the year ending 31 March 2009 are available, they have not gone through the same quality assurance processes (including data confirmation, validation or variance checks) as those applied to the figures presented in this release (see the quality and methodology section of the user guide. All figures in this release can be found in the Police use of firearms, England and Wales, April 2016 to March 2017 tables.
2. Headline figures
- there were 15,705 police firearms operations in the year ending 31 March 2017, an increase of 1,056 (7%) operations when compared with the previous year
- in the year ending 31 March 2017, 84% of firearms operations involved Armed Response Vehicles (ARVs), compared with 85% in the previous year
- there were ten incidents in which police firearms were discharged in the year ending 31 March 2017, up from seven incidents in the previous year
- there were 6,278 armed officers on 31 March 2017, an increase of 639 (11%) armed officers when compared with the previous year
3. Police firearms operations, including operations involving Armed Response Vehicles (ARVs)
In the year ending 31 March 2017, there were 15,705 police firearms operations in England and Wales. Since the year ending 31 March 2009, there has been an overall decrease of 7,476 (-32%) police firearms operations.
Figure 1 shows that between the years ending 31 March 2009 and 31 March 2016, there had been a consistent downward trend in the overall number of firearms operations. However, in the year ending 31 March 2017, there was an increase of 1,056 (7%) police firearms operations.
In the year ending 31 March 2017, 13,223 (84%) of all firearms operations involved ARVs. This represents an increase of 723 (6%) on the previous year and an overall decrease of 5,651 (-30%) since the year ending 31 March 2009.
Figure 1: Police firearms operations including operations involving ARVs, England and Wales, year ending 31 March 2009 to 2017
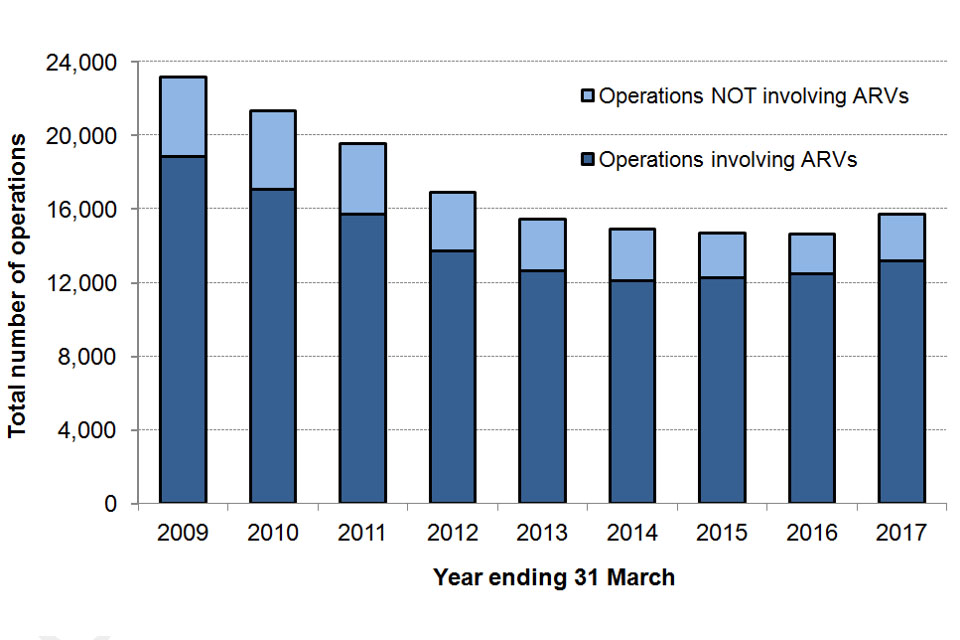
Chart notes
Source: Home Office, Police use of firearms, England and Wales, April 2016 to March 2017 tables 1 and 2.
1. Figures are for the 43 Home Office forces in England and Wales.
2. Following the data confirmation and validation exercise this year, the total firearms operations for the year ending 31 March 2016 was revised down from 14,753 to 14,649, and operations involving ARVs was revised up from 12,471 to 12,500 (see table 1 of the data tables and the revisions section in the user guide).
Table 1 shows that the proportion of operations involving ARVs remained fairly stable between the years ending 31 March 2009 and 31 March 2014, accounting for between 80% and 82% of all firearms operations. There has been a slight increase in the proportion of operations involving ARVs in the last three years with the figure for the year ending 31 March 2017 now at 84%.
Table 1: Number of police firearms operations and the proportion of which involved Armed Response Vehicles (ARVs), England and Wales, year ending 31 March 2009 to 31 March 2017
| March 2009 | March 2010 | March 2011 | March 2012 | March 2013 | March 2014 | March 2015 | March 2016R | March 2017 | |
|---|---|---|---|---|---|---|---|---|---|
| Total number of firearms operations | 23,181 | 21,337 | 19,586 | 16,930 | 15,475 | 14,939 | 14,685 | 14,649 | 15,705 |
| Proportion of which involve ARVs | 81% | 80% | 80% | 81% | 82% | 81% | 84% | 85% | 84% |
| Proportion of which do not involve ARVs | 19% | 20% | 20% | 19% | 18% | 19% | 16% | 15% | 16% |
Table notes
Source: Home Office, Police use of firearms, England and Wales, April 2016 to March 2017 tables 1 and 2.
1. Figures are for the 43 Home Office forces in England and Wales.
2. Operations in which the issue of firearms was authorised.
3. The following are excluded from the figures:
operations where officers were stood down before being deployed (e.g. the operation was cancelled before arrival or officers did not move from a rendezvous point into actual deployment);
deployments for VIP protection, armed prisoner escorts, airport patrols, other guarding duties, and routine patrols.
R. Following the data confirmation and validation exercise this year, the total firearms operations for the year ending 31 March 2016 was revised down from 14,753 to 14,649, and operations involving ARVs was revised up from 12,471 to 12,500 (see table 1 of the data tables and revisions section in the user guide).
In the year ending 31 March 2017, London accounted for the largest proportion of all police firearms operations with 4,274 (27%) firearms operations. The North East accounted for the smallest proportion, 394 (3%) firearms operations.
The West Midlands region experienced the largest increase in the number of police firearms operations between the year ending 31 March 2016 and 31 March 2017, with a rise of 626 (41%) firearms operations. Wales experienced the largest decrease, with firearms operations falling by 144 (-16%).
In the year ending 31 March 2017, 96% of Wales’ police firearms operations involved ARVs, the highest proportion of all regions. In the same period, ARVs were involved in 74% of Yorkshire and the Humber’s firearms operations, the lowest proportion of all regions.
4. Incidents in which police firearms were discharged
These statistics refer to incidents in which police firearms were discharged, such as the terror attack in Westminster in March 2017. Any incident may involve multiple armed officers discharging firearms.
In the year ending 31 March 2017, there were 10 incidents in which police discharged firearms. Table 2 shows that the number of incidents has been 10 or fewer in each of the last 9 years.
Table 2: Number of incidents in which police firearms were discharged, England and Wales, year ending 31 March 2009 to 31 March 2017
| March 2009 | March 2010 | March 2011 | March 2012 | March 2013 | March 2014 | March 2015 | March 2016 | March 2017 | |
|---|---|---|---|---|---|---|---|---|---|
| Number of incidents | 6 | 6 | 4 | 4 | 3 | 4 | 6 | 7 | 10 |
Table notes
Sources: National Police Chiefs’ Council (NPCC) and Home Office, Police use of firearms, England and Wales, April 2016 to March 2017 table 4’
1. Figures are for the 43 Home Office forces in England and Wales.
2. Number of incidents where conventional firearms were discharged. The figures exclude less-lethal weapons (see glossary section in the user guide).
3. Excludes accidental discharges, discharges for animal destruction, during police training and for the purpose of deflating tyres.
4. Figures in previous publications, for the years ending March 2009 to March 2011, are from data submitted to the NPCC. Figures published in the years ending March 2012 to March 2017 are from data submitted to the Home Office via the Annual Data Requirement, which have been confirmed by police forces.
5. Armed officers
5.1 Trends in the number of armed officers between 31 March 2009 and 31 March 2017
Previous publications covered the number of ‘authorised firearms officers’ (AFOs). Following feedback from the National Police Chiefs’ Council (NPCC), College of Policing, and various police forces, data from 2016 to 2017 is being collected on the number of ‘armed officers’. This refers to all officers who are authorised to use firearms, which should incorporate operationally deployable armed officers, including those currently being utilised as trainers. This change in definition was implemented to increase clarity, as the term ‘AFO’ can be used to refer specifically to an armed officer trained at the basic level as well as to any officer who is authorised to use firearms in general.
All 43 forces were contacted to ascertain how this change in definition affected the figures submitted for this year. Of the 42 forces that responded, only 2 forces reported that the change in definition affected their figures. The change accounted for less than 0.5% of the total number of armed officers as at 31 March 2017. As such, the figures for 31 March 2017 are perceived as comparable to figures from previous publications.
There were 6,278 armed officers on 31 March 2017, an increase of 639 (11%) armed officers compared with 31 March 2016 and the first increase in the number of armed officers since 31 March 2012. Figure 2 shows that between 31 March 2009 and 31 March 2016, there had been an overall decrease of 1,267 (-18%) armed officers.
The Home Office is currently providing funding for a national uplift in our armed policing capability in order to respond more quickly and effectively in operations. The figures for the year ending 31 March 2017 include a number of armed officers associated with the national armed policing uplift programme.
Figure 2: Armed officers, on 31 March 2009 to 31 March 2017, England and Wales
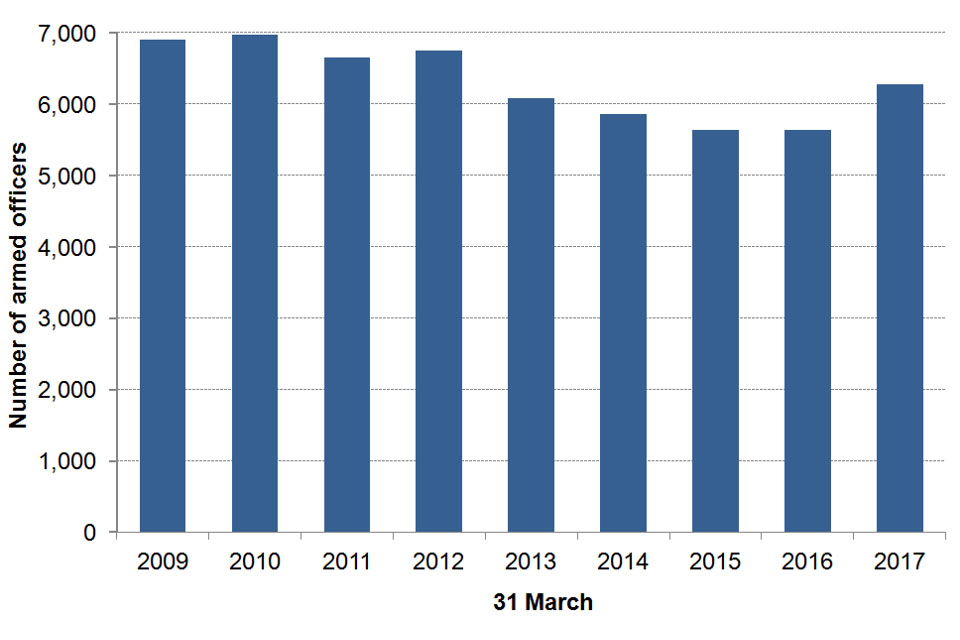
Chart notes
Source: Home Office, Police use of firearms, England and Wales, April 2016 to March 2017 tables, table 3
1. Figures are for the 43 Home Office forces in England and Wales.
5.2 Armed officers compared with total number of all police officers between 31 March 2009 and 31 March 2017
On 31 March 2017 there were 125,851 police officers [footnote 4] in England and Wales, representing a decrease of 1% when compared with the previous year. The most recent fall in the number of police officers continues the general downward trend seen in the last eight years (a fall of 14% from 145,948 officers on 31 March 2009).
Overall, the number of armed officers has shown a similar decline (-9%) over the same period. However, when compared to the previous year the number of armed officers as at 31 March 2017 has increased by 11%. As shown in Table 3, armed officers accounted for 5% of all police officers on 31 March 2017, the highest proportion in the last 9 years.
Table 3: The number of armed officers as a proportion of all police officers in England and Wales, on 31 March 2009 to 31 March 2017
| Police officers (headcount) | Armed officers (headcount) | Armed officers as a proportion of all police officers (headcount) | |
|---|---|---|---|
| March 2009 | 145,948 | 6,906 | 4.7% |
| March 2010 | 146,030 | 6,976 | 4.8% |
| March 2011 | 141,495 | 6,653 | 4.7% |
| March 2012 | 136,528 | 6,756 | 4.9% |
| March 2013 | 132,123 | 6,092 | 4.6% |
| March 2014 | 130,514 | 5,864 | 4.5% |
| March 2015 | 129,879 | 5,647 | 4.3% |
| March 2016 | 126,766 | 5,639 | 4.4% |
| March 2017 | 125,851 | 6,278 | 5.0% |
| Change from March 2016 | -915 | 639 | |
| % Change from March 2016 | -0.7% | 11.3% | |
| Change from March 2009 | -20,097 | -628 | |
| % Change from March 2009 | -13.8% | -9.1% |
Table notes
Source: Home Office, Police workforce, England and Wales, 31 March 2017: open data tables.
Police use of firearms, England and Wales, April 2016 to March 2017 table 3.
1. Figures are for the 43 Home Office forces in England and Wales.
The ‘Police use of firearms’ release is an Official Statistics output produced to the highest professional standards and free from political interference. It has been produced by statisticians working in the Home Office Analysis and Insight Directorate in accordance with the Home Office’s ‘Statement of compliance with the Code of Practice for Official Statistics’ which covers our policy on revisions and other matters. The Chief Statistician, as Head of Profession, reports to the National Statistician with respect to all professional statistical matters and oversees all Home Office National Statistics products with respect to the Code, being responsible for their timing, content and methodology.
-
An operation for which the issue of firearms was authorised. ↩
-
An incident where a conventional firearm was discharged by the police. Excludes less-lethal weapons (see glossary section in the user guide). ↩
-
An armed officer is a police officer who is authorised to use firearms, which should incorporate all operationally deployable armed officers, including those currently being utilised as trainers. ↩
-
The total number of police officers provided in this release is a headcount figure. For the number of FTE police officers see Table H3 of the police workforce tables. ↩