Chapter 5: adult social care
Updated 27 January 2020

© Crown copyright 2020
This publication is licensed under the terms of the Open Government Licence v3.0 except where otherwise stated. To view this licence, visit nationalarchives.gov.uk/doc/open-government-licence/version/3 or write to the Information Policy Team, The National Archives, Kew, London TW9 4DU, or email: psi@nationalarchives.gov.uk.
Where we have identified any third party copyright information you will need to obtain permission from the copyright holders concerned.
This publication is available at https://www.gov.uk/government/publications/people-with-learning-disabilities-in-england/chapter-5-adult-social-care
Summary
Councils with social service responsibilities make annual returns to NHS Digital concerning adult social care activity and expenditure. Major changes to the way social care data are collected occurred between 2013 to 2014 and 2014 to 2015, meaning that data reported across longer time periods cannot be treated as continuous.
In total, the number of adults with learning disabilities getting some form of long-term social care increased from 139,555 people in the period 2014 to 2015 to 147,915 people in 2017 to 2018.
In 2017 to 2018, the most common living situation for adults with learning disabilities aged 18 to 64 years getting long-term social care support was settled living with family/friends (48,165 people, 36.7% of all working age adults with learning disabilities getting long-term social care). 29,975 people were living in some form of supported accommodation, 21,145 people in registered care homes, and 16,640 people in tenancies with local authorities, housing associations or registered social landlords.
Relatively small numbers of people aged 18 to 64 in 2017 to 2018 were in shared lives arrangements (3,535 people), owner-occupier/shared ownership arrangements (3,000 people), sheltered housing/extra care housing (1,105 people) nursing care (990 people), or various forms of temporary accommodation (1,700 people).
A different database reports that in 2017 to 2018 the number of adults with learning disabilities aged 18 to 64 in residential care was 23,420 people, while 1,075 people were in nursing care. For adults with learning disabilities aged 65 years or more, 5,240 people were in residential care in 2017 to 2018, and 620 people were in nursing care.
From the period 2014 to 2015 to 2017 to 2018 the number of adults with learning disabilities living in residential care has decreased, while the number of adults with learning disabiltiies living with family/friends or living in supported accommodation has increased.
In 2017 to 2018 the most common type of social care support used by those adults with learning disabilities aged 18 to 64 not in residential or nursing care was received as a council-managed personal budget (49,150 people in 2017 to 2018), followed by a direct payment only (26,560 people), a part-direct payment personal budget (15,550 people), or council-commissioned support only (8,525 people).
For adults with learning disabilities aged 65 years or older not living in residential or nursing care, the most common type of social care support used in 2017 to 2018 was received as a council-managed personal budget (7,205 people in 2017 to 2018), followed by council-commissioned support only (1,090 people), a direct payment only (725 people), or a part-direct payment personal budget (685 people).
Overall, the number of adults with learning disabilities getting long-term social care via some form of personal budget increased from the period 2014 to 2015 to the period 2017 to 2018, while the number of people getting council-commissioned support only decreased.
In 2017 to 2018 the total gross social care expenditure on adults with learning disabilities was £5.5 billion, with the vast majority of expenditure on adults aged 18 to 64 (89.3%) and the vast majority of expenditure on long-term rather than short-term social care (98.5%). From the period 2014 to 2015 to the period 2017 to 2018, social care expenditure for both working age and older adults with learning disabilities has run marginally ahead of inflation.
In terms of residential services and housing support, in 2017 to 2018 the largest single category of social care expenditure for adults with learning disabilities aged 18 to 64 was residential care (£1.70 billion, 34.4% of all social care expenditure on adults with learning disabilities aged 18 to 64), followed by supported living (£1.16 billion). Lower amounts were spent on supported accommodation (£301 million) and nursing care (£63 million).
For older adults with learning disabilities, in 2017 to 2018 the largest single category of social care expenditure relating to housing support was residential care (£262.6 million, 45.0% of all social care expenditure on adults with learning disabilities aged over 65), followed by supported living (£141.6 million), supported accommodation (£40.9 million) and nursing care (£25.5 million).
In terms of social care expenditure in 2017 to 2018 on long-term community social care support for adults with learning disabilities aged 18 to 64, £630.1 million (12.7% of all social care expenditure on working age adults with learning disabilities) was spent via direct payments, £353.2 million was spent on home care, and £661.5 million was spent on ‘other’ types of long-term community social care.
For older adults with learning disabilities, in 2017 to 2018 £25.1 million (4.2% of all social expenditure on older adults with learning disabilities) was spent via direct payments, £45.8 million was spent on home care, and £46.8 million was spent on ‘other’ types of long-term community social care.
There was substantial geographical variation across local authorities in England both in the provision of social care and in expenditure on social care support.
People with learning disabilities in England
National statistical information on the characteristics of people with learning disabilities, and the services and supports they and their families use, is collected by several government departments. The aim of People with Learning Disabilities in England, produced by the Learning Disabilities Team at Public Health England (PHE), is to provide a concise summary of this information.
Previous versions have been produced as a single report, most recently People with Learning Disabilities in England 2015[footnote 1]. In this version of People with Learning Disabilities in England, individual sections are updated as data become available, to allow for more regular and timely updates of national statistics.
Adult social care
Statistics related to social care support for people with learning disabilities are largely publicly available through NHS Digital (formerly the Health and Social Care Information Centre) via reports and data tables on the NHS Digital website. Data in this section are collected by councils with social services responsibilities.
Some aspects of the data collection system for social care have changed over time, with particularly wide-ranging changes introduced in 2014 to 2015. As such, statistics over the time period 2013 to 2014 to the period 2014 to 2015 cannot be treated as continuous. There were changes to the categories of activity counted, the approach to designating individuals’ main reasons for receiving support, and a different approach to estimating the total number of people in the group for whom services could be relevant.
This chapter provides summaries of the available information (more detailed data tables are available in the accompanying adult social care data tables PDF document), organised as follows:
- the living situations of adults with learning disabilities getting social care
- the number of adults with learning disabilities using community social care services (including personal budgets)
- requests for support from adults with learning disabilities
- local authority expenditure on social care services for adults with learning disabilities
- the experience of social care reported by adults with learning disabilities
The living situations of adults with learning disabilities getting social care
There is a large amount of data available related to the living situations of those adults with learning disabilities in England who are getting social care support. In 2014 to 2015 there were wide-ranging changes to the statistics collected for social care, meaning that statistics over the time period 2013 to 2014 to the period 2014 to 2015 cannot be treated as continuous.
Figure 1 below presents data on the number of adults with learning disabilities aged 18 to 64 years in England in all forms of accommodation between 1 April and 31 March 2009 to 2010 to 2017 to 2018 (2009 to 2010 to 2013 to 2014 ASC-CAR Table L2[footnote 2]; from the time period 2014 to 2015 to the period 2017 to 2018 SALT Table LTS004b3). From 2009 to 2010 to the period 2013 to 2014, these data related to adults with learning disabilities known to local authorities. From the period 2014 to 2015 to the period 2017 to 2018 these data relate to adults with a primary support reason of learning disability receiving long-term support from the council, resulting in discontinuities in the data from 2013 to 2014 to the period 2014 to 2015 (indicated in Figure 1 by a vertical line and different shading in the two time periods). Figure 1 combines some types of accommodation into larger categories, with full details of all types of accommodation available in Table 1 in the accompanying adult social care data tables PDF document.
Figure 1 shows that the number of working age adults with learning disabilities known to councils slowly increased from 2009 to 2010 to 2013 to 2014 (up to 141,980 adults in 2013 to 2014, an average increase of 1,408 people per year), as recorded in the line at the top of the figure. In 2014 to 2015 there were reported to be 124,445 working age adults with learning disabilities receiving long-term support from councils, which increased to 131,415 adults in 2017 to 2018 (an average increase of 2,323 people per year). Possible reasons for the difference between 2013 to 2014 and 2014 to 2015 include:
-
some adults formerly classified as having a learning disability in social care statistics may have been re-classified as having a primary reason for support of something other than learning disability in 2014 to 2015 (in 2014 to 2015 only a person’s primary reason for support is used in the social care statistics). The impact of this change is unknown, although from 2013 to 2014 to 2014 to 2015 the numbers of adults in all support categories were recorded as fewer in 2014 to 2015 than in 2013 to 2014
-
some adults with learning disabilities formerly ‘known to councils’ may not have been receiving long-term support from their council (for example, receiving short-term support or no support within a particular year), and therefore may not have been counted in the 2014 to 2015 statistics
It is also worth nothing that the number of people in a type of accommodation unknown to the local authority was also recorded for the first time in 2014 to 2015.
In 2017 to 2018, the most common living situation for working age adults with learning disabilities getting long-term support from the council was settled living with family/friends (48,165 people, 36.7% of all working age adults with learning disabilities getting long-term social care). This was an increase of 1,127 people per year from 2014 to 2015 (44,785 people). There was also an upward trend from 2009 to 2010 (41,590 people) to 2013 to 2014 (52,090 people, an increase of 2,625 people per year).
The next most common living situation for working age adults with learning disabilities getting long-term social care support in 2017 to 2018 was living in supported accommodation/supported lodgings/supported group homes (29,975 people, 22.2%), an increase of 2,040 people per year from 2014 to 2015 (23,075 people). There was also an upward trend from 2009 to 2010 (17,655 people) to 2013 to 2014 (24,485 people, an increase of 1,708 people per year).
The third most common living situation in 2017 to 2018 was living in residential care homes (21,145 people, 16.1% of working age adults with learning disabilities getting long-term social care), a decrease of 690 people per year from 2014 to 2015 (23,215 people). This decrease was in contrast to a fluctuating but slightly upward trend from 2009 to 2010 (24,830 people) to 2013 to 2014 (25,755 people, an increase of 231 people per year).
In 2017 to 2018, 16,640 people (12.7% of working age adults with learning disabilities getting long-term social care) were in housing with some form of tenancy, a very similar number to 2014 to 2015 (16,385, an increase of 85 people per year). The years from 2009 to 2010 (17,170 people) to 2013 to 2014 (21,505 people) showed a more substantial increase of 1,084 people per year.
Relatively small numbers of people in 2017 to 2018 were in shared lives arrangements (3,535 people, up from 3,100 people in 2014 to 2015), owner-occupier/shared ownership arrangements (3,000 people, up from 2,460 people in 2014 to 2015), sheltered housing/extra care housing (1,105 people, down from 1,195 people in 2014 to 2015), or nursing care (990 people, down from 1,360 people in 2014 to 2015).
The number of working age adults with learning disabilities getting long-term social care who were living in various forms of temporary accommodation increased from 1,355 people in 2014 to 2015 to 1,700 people in 2017 to 2018 (an increase of 115 people per year). From 2009 to 2010 (1,865 people) to 2013 to 2014 (2,080 people) there was a similar but smaller increase of 54 people per year.
The number of working age adults with learning disabilities getting long-term social care who are recorded by local authorities as being in an acute/long-stay healthcare residential facility or hospital has consistently decreased over time; from 2014 to 2015 (1,035 people) to 2017 to 2018 (415 people), and earlier from 2009 to 2010 (1,295 people) to 2013 to 2014 (1,075 people). This is likely to reflect the fact that adults with learning disabilities in these inpatient services are largely funded by healthcare rather than social care, rather than being an accurate record of the total number of adults with learning disabilities in inpatient services.
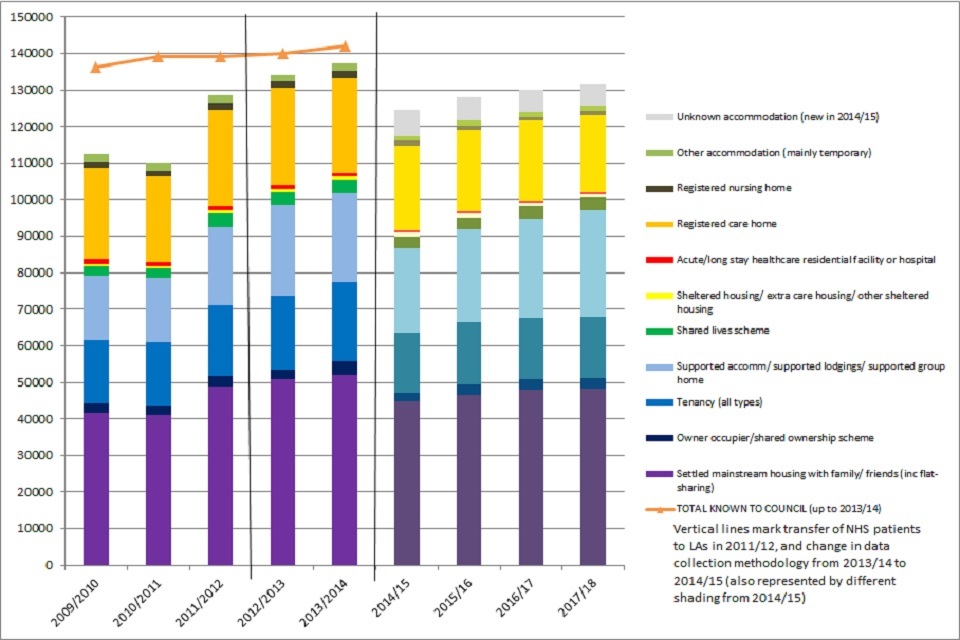
Number of adults aged 18 to 64 years in England with a primary support reason of learning disability receiving long-term social care living in different forms of accommodation 2009/10 to 2017/18
Figure 2 below presents data on the number of adults with learning disabilities aged 18 to 64 in England receiving council-funded residential support in the form of nursing care or residential care at the end of each year, reported annually from 2009 to 2010 to 2017 to 2018 (see Table 2 in the accompanying data tables PDF document, including breakdown by age band; ASC-CAR Table S1[footnote 2] up to 2013 to 2014 and SALT Table LTS001a[footnote 3] for 2014 to 2015 onwards). Major changes in social care data collection and reporting for 2014 to 2015 means that statistics up to 2013 to 2014 and for 2014 to 2015 cannot be assumed to be continuous (indicated in Figure 2 by a gap between 2013 to 2014 and 2014 to 2015). When interpreting Figure 2, it is also important to note that an estimated 1,840 adults with learning disabilities in residential care in 2011 to 2012 were already in residential care under NHS funding, but transferred to local authority responsibility (with funding also transferring) under Valuing People Now for 2011 to 2012[footnote 4] – these are not represented in the figure.
The overall numbers in Figure 2 are higher than those reported in Figure 1. In terms of trends over time, the number of adults with learning disabilities aged 18 to 64 in residential care decreased, from 25,075 people in 2014 to 2015 to 23,420 people in 2017 to 2018 (a drop of 552 people per year). The number of adults with learning disabilities aged 18 to 64 in nursing care stayed fairly static, from 1,060 people in 2014 to 2015 to 1,075 people in 2017 to 2018.
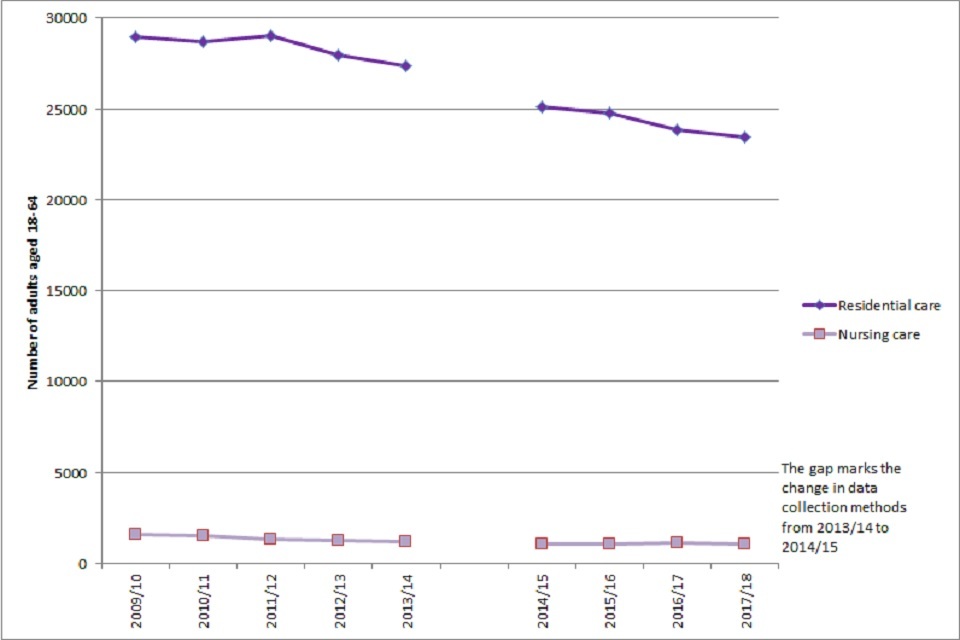
Figure 2: Number of adults with learning disabilities aged 18 to 64 years in England supported by local authorities at 31 March in residential or nursing care: 2009 to 2010 to time period 2017 to 2018
Figure 3 below presents the same data for adults with learning disabilities aged 65 years or over, from 2009 to 2010 to 2017 to 2018 (Table 2 in the accompanying data tables PDF document provides detailed data). In terms of trends over time, from 2014 to 2015 to 2017 to 2018 the number of older adults with learning disabilities in residential care homes decreased slightly (from 5,425 people in 2014 to 2015 to 5,240 people in 2017 to 2018, a decrease of 62 people per year) and the smaller number of older adults in nursing care fluctuated over the time period (from 670 people in 2014 to 2015 to 620 people in 2017 to 2018).
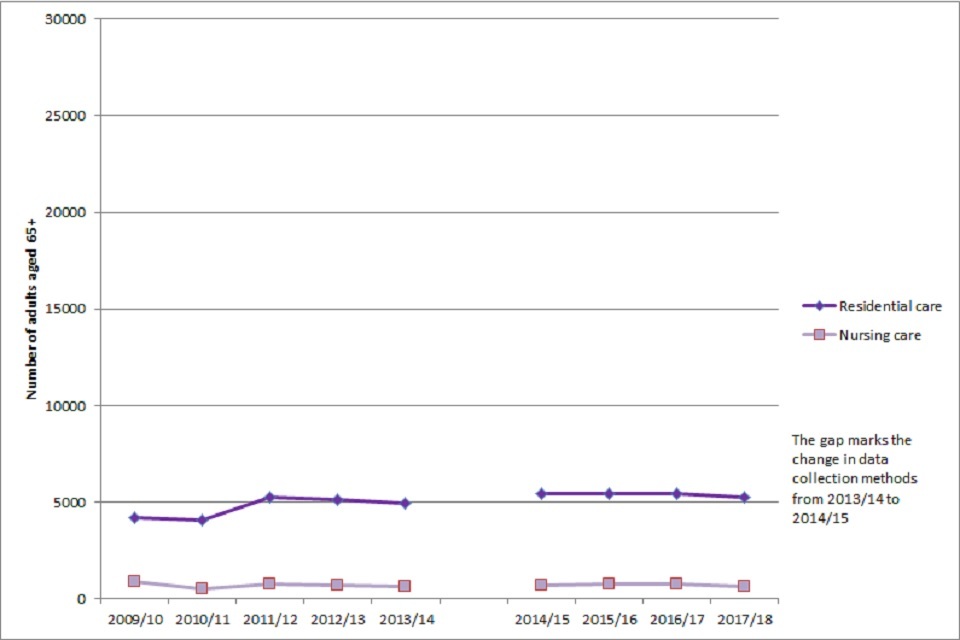
Figure 3: Number of adults with learning disabilities aged 65+ years in England supported by local authorities at 31 March in residential or nursing care: 2009 to 2010 to time period 2017 to 2018
The number of adults with learning disabilities using community social care services (including personal budgets)
Up to 2013 to 2014, there was a substantial amount of data available concerning community (for example non-residential) social services for adults with learning disabilities in England (People with Learning Disabilities in England 2015[footnote 1]). In 2014 to 2015, this was replaced by statistics recording, amongst adults with learning disabilities receiving long-term social care support, whether they were using services in the following mutually exclusive categories:
- residential care and nursing care (reported above),
- various forms of personal budget (direct payment only; personal budget - part direct payment; council-managed personal budget)
- council-commissioned support only (this category can include any form of support except residential or nursing care, so includes supported living and tenancies) (SALT Table LTS001a[footnote 3])
The 2014 to 2015 statistics onwards do not record the number of people using the types of community-based social services in the detail reported up to 2013 to 2014 – see People with Learning Disabilities in England 2015[footnote 1] for details of this information).
Figure 4 below presents information on the number of adults with learning disabilities aged 18 to 64 years getting various types of social care support using the categories in place from 2014 to 2015 onwards (see also Table 3 in the accompanying data tables document). For adults aged 18 to 64 years the data are available in consistent categories from 2009 to 2010 (with the exception of the category of council-commissioned services only), although for reasons outlined earlier the data are discontinuous between 2013 to 2014 and 2014 to 2015, represented by a gap in the graph between these dates.
In 2017 to 2018 the most common type of social care support used by working age adults with learning disabilities was received as a council-managed personal budget (54,435 people in 2017 to 2018), an increase of 1,762 people per year from 2014 to 2015 (49,150 people). This is a slower upward trend than that reported from 2009 to 2010 (4,870 people) to 2013 to 2014 (54,490 people, an increase of 12,405 people per year).
In 2017 to 2018, 26,560 working age adults with learning disabilities were getting long-term social care in the form of a direct payment only, an increase from 2014 to 2015 (21,580 people, an increase of 1,660 people per year). This is faster than the earlier upward trend from 2009 to 2010 (16,940 people) to 2013 to 2014 (20,715 people, an increase of 944 people per year).
In 2017 to 2018, 15,550 working age adults with learning disabilities were getting long-term social care in the form of a part-direct payment personal budget, an increase of 762 people per year from 2014 to 2015 (13,265 people). This is a slower upward trend than that reported from 2009 to 2010 (1,795 people) to 2013 to 2014 (13,320 people, an increase of 2,881 people per year).
From 2014 to 2015 (12,000 people) to 2017 to 2018 (8,525 people) the number of working age adults getting council-commissioned support only decreased, by 1,158 people per year.
For all these categories of long-term social care usage, it is important to note that they do not describe the nature of the long-term social care support used by working age adults with learning disabilities, only the vehicle by which social care support was received.
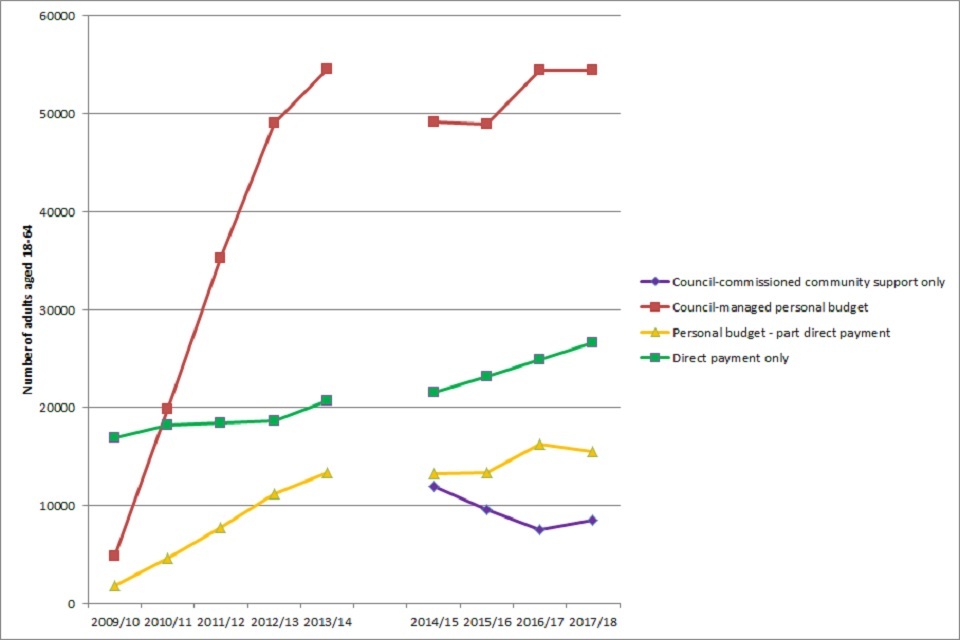
Figure 4: Number of adults with learning disabilities aged 18 to 64 years in England supported by local authorities getting different types of long-term social care support during the year: 2009 to 2010 to time period 2017 to 2018
Figure 5 below presents information in the same format on the number of adults with learning disabilities aged 65 years or more getting various types of social care support using the categories in place from 2014 to 2015 onwards (see also Table 3 in the accompanying data tables PDF document). As these data are only available for older adults with learning disabilities from 2014 to 2015 onwards, Figure 5 reports data from 2014 to 2015 to 2017 to 2018.
In 2017 to 2018 the most common type of social care support used by older adults with learning disabilities was received as a council-managed personal budget (7,205 people in 2017 to 2018), an increase of 428 people per year from 2014 to 2015 (5,920 people).
In 2017 to 2018, 725 older adults with learning disabilities were getting long-term social care in the form of a direct payment only, a slight increase from 2014 to 2015 (620 people, an increase of 35 people per year).
In 2017 to 2018, 685 older adults with learning disabilities were getting long-term social care in the form of a part-direct payment personal budget, a slight increase from 2014 to 2015 (505 people) of 60 people per year.
From 2014 to 2015 (1,430 people) to 2017 to 2018 (1,090 people) the number of older adults getting council-commissioned support only decreased, by 113 people per year.
For all these categories of long-term social care usage, it is important to note that they do not describe the nature of the long-term social care support used by older adults with learning disabilities, only the vehicle by which social care support was received.
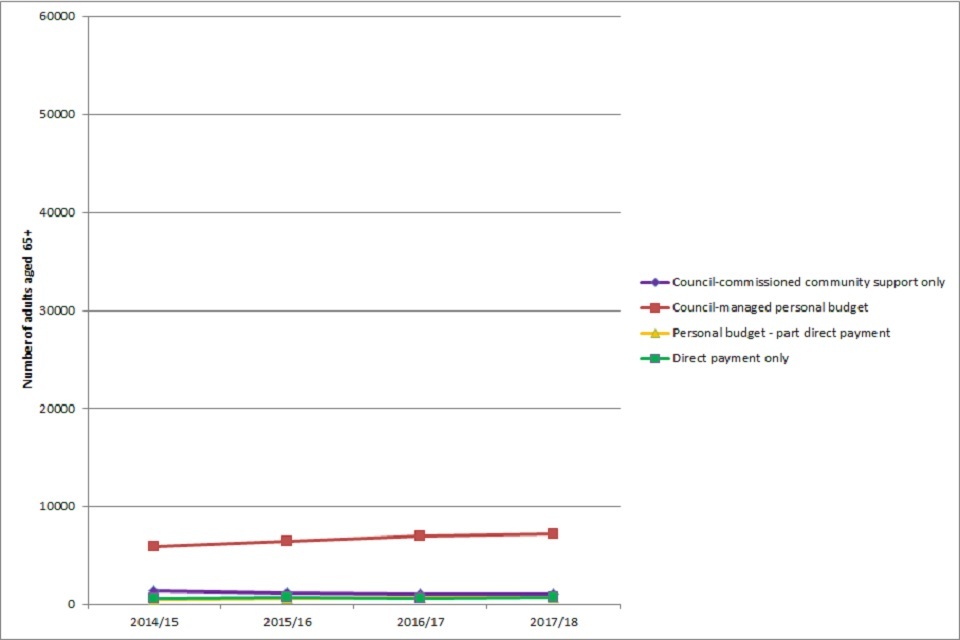
Figure 5: Number of adults with learning disabilities aged 65+ years in England supported by local authorities getting different types of long-term social care support during the year: 2014 to 2015 to time period 2017 to 2018
For all types of long-term social care, there is substantial variation across local authorities. Figure 6 reports the rate per 100,000 population of adults with learning disabilities aged 18+ getting any form of long-term social care (the graph does not include data from the Isles of Scilly) in 2017 to 2018, ordered from lowest to highest (SALT data LTS001a[footnote 3]).
As Figure 6 shows, the median rate per 100,000 population of adults with learning disabilities age 18+ getting long-term social care in 2017 to 2018 was 340 people per 100,000. The 10 local authorities with the lowest rates reported 240 per 100,000 or fewer adults with learning disabilities getting long-term social care; the 10 local authorities with the highest rates reported 445 per 100,000 or more adults with learning disabilities getting long-term social care.
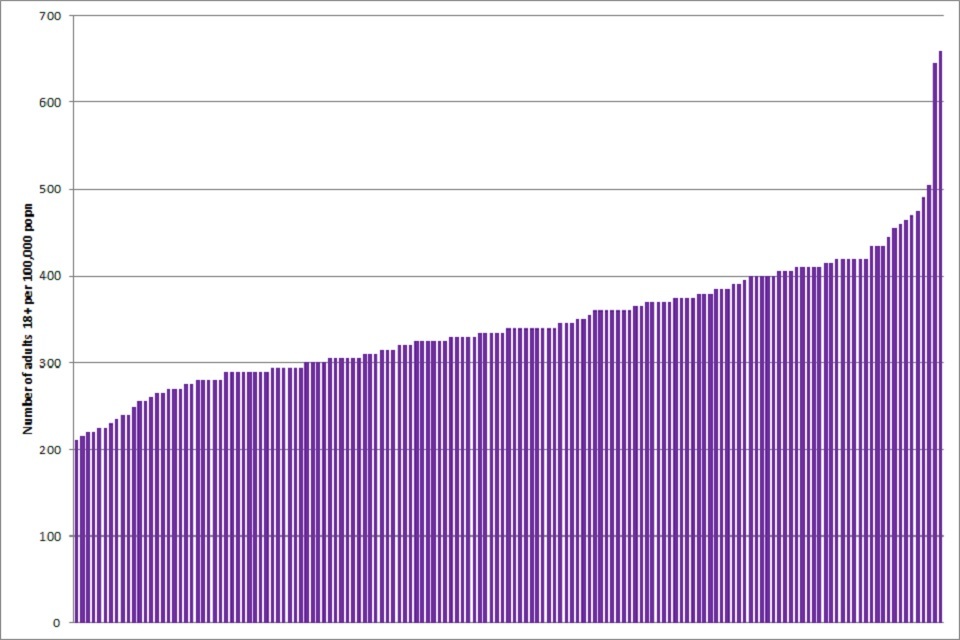
Rate per 100,000 population of adults in England with a primary support reason of learning disabilities aged 18+ getting any form of long-term social care ordered by local authority: 2017/18
Requests for support from adults with learning disabilities
From 2014 to 2015, data have been published on the number of new adult clients with learning disabilities where the sequel to a request for support was short-term support to maximise independence, and what followed from this request. In 2014 to 2015 and 2015 to 2016 similarly detailed information was made available concerning existing adult clients with learning disabilities, but not in 2016 to 2017 and 2017 to 2018 (see Table 4 in the accompanying data tables PDF document for detailed information).
Figure 7 presents this information for new adult clients with learning disabilities, from 2014 to 2015 to 2017 to 2018. Overall, the number of requests for support increased from 555 requests in 2014 to 2015 to 1,140 requests in 2017 to 2018.
In 2017 to 2018, the most common sequel to a request for support was no services provided: no identified needs, which increased from 220 requests in 2014 to 2015 to 415 requests in 2017 to 2018. The next most common sequels were no services: universal services/signposting (an increase from 30 requests in 2014 to 2015 to 185 requests in 2017 to 2018), and long-term support (175 requests in 2014 to 2015 and 185 requests in 2017 to 2018).
Other fairly common sequels to a request for support included an early cessation of service (not leading to support) (an increase from 35 requests in 2014 to 2015 to 100 requests in 2017 to 2018), other short-term support (an increase from 35 requests in 2014 to 2015 to 95 requests in 2017 to 2018), and ongoing low-level support (an increase from 35 requests in 2014 to 2015 to 80 requests in 2017 to 2018).
Overall, in absolute terms the number of new requests resulting in long-term support increased from 190 requests in 2014 to 2015 to 215 requests in 2017 to 2018, although in percentage terms this was a decrease from 34% of new requests in 2014 to 2015 to 19% of new requests in 2017 to 2018. In contrast, both the number (from 295 requests in 2014 to 2015 to 750 requests in 2017 to 2018) and the percentage (from 53% in 2014 to 2015 to 66% in 2017 to 2018) of new requests resulting in no service increased in this 3 year period.
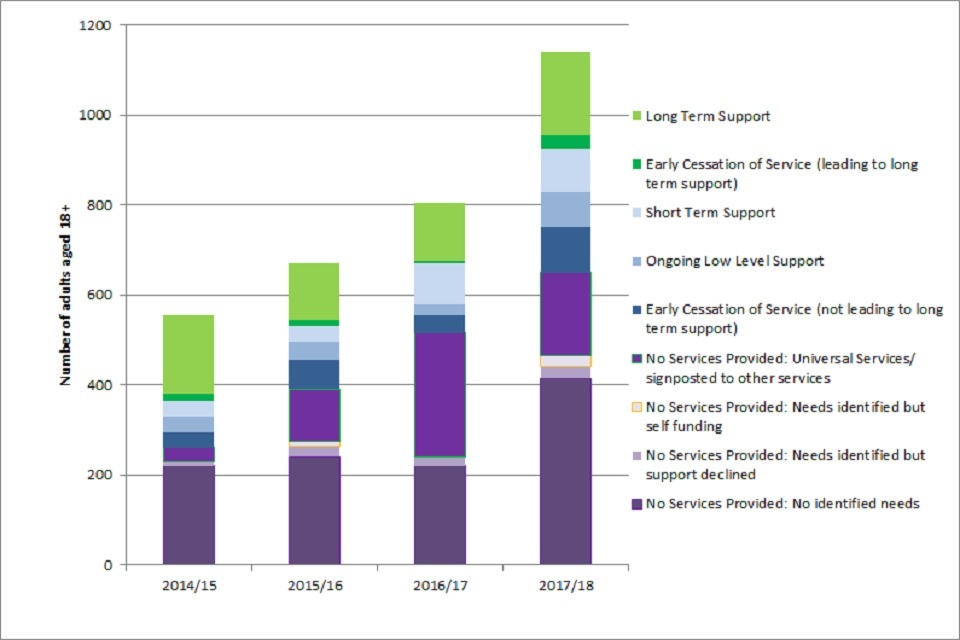
Figure 7: Number of new adult clients with learning disabilities aged 18+ where the sequel to a request for support was short-term support to maximise independence, and what followed: 2014 to 2015 to time period 2017 to 2018
Local authority expenditure on social care services for adults with learning disabilities
Publicly available statistics on local authority expenditure changed substantially in 2014 to 2015. Up to 2013 to 2014, statistics were only available on gross social services expenditure on services for adults with learning disabilities aged 18 to 64 years old (PSS-EX1; see Table 5 and Table 6 in the accompanying PDF document for detailed data tables[footnote 4]). From 2014 to 2015 data are also available for adults with learning disabilities aged 65 years or over. Although the categories of reported spending have changed (ASC-FR; see Table 5 and Table 6 for detailed data tables[footnote 3]), some categories of expenditure reported are consistent from 2013 to 2014 to 2014 to 2015.
Figure 8 below presents categories of gross social care expenditure on services for adults with a primary care need of learning disabilities from 2014 to 2015 to 2017 to 2018, broken down by categories of expenditure and age band (18 to 64 years, and 65+ years). The purple lines represent inflation-adjusted total expenditure over the time period, with 2014 to 2015 as an anchor, using the Personal Social Services Research Unit annual percentage increases for adult services (all sectors) pay and prices index (excluding capital)[footnote 5].
As Figure 8 shows (see also Tables 5 and 6 in the accompanying data tables PDF document), in 2017 to 2018 total gross social care expenditure on adults with learning disabilities was £5.5 billion, with the vast majority of expenditure on adults aged 18 to 64 (89.3%) and the vast majority of expenditure on long-term rather than short-term social care (98.5%). From 2014 to 2015 to 2017 to 2018, social care expenditure for both working age and older adults with learning disabilities has run marginally ahead of inflation.
In terms of residential services and housing support, in 2017 to 2018 the largest single category of social care expenditure for adults with learning disabilities aged 18 to 64 was residential care (£1.70 billion, 34.4% of all social care expenditure on adults with learning disabilities aged 18 to 64), followed by supported living (£1.16 billion; 23.4%). Lower amounts were spent on supported accommodation (£301 million; 6.1%) and nursing care (£63 million; 1.3%).
For older adults with learning disabilities, in 2017 to 2018 the largest single category of social care expenditure relating to housing support was residential care (£262.6 million, 45.0% of all social care expenditure on adults with learning disabilities aged 65+), followed by supported living (£141.6 million; 23.8%), supported accommodation (£40.9 million; 6.9%) and nursing care (£25.5 million; 4.3%).
For both age groups there were consistent year-on-year increases in expenditure on supported living; for residential care, nursing care and supported accommodation, increases in social care expenditure were smaller and less consistent year-on-year.
In terms of social care expenditure on long-term community social care support for adults with learning disabilities aged 18 to 64 in 2017 to 2018, £630.1 million (12.7% of all social care expenditure on working age adults with learning disabilities) was spent via direct payments, £353.2 million (7.1%) was spent on home care, and £661.5 million (13.4%) was spent on ‘other’ types of long-term community social care. Spending on direct payments for this age group has increased substantially from 2014 to 2015 (£454.2 million) and spending on other community social care has also increased (£613.1 million in 2014 to 2015), while spending on home care has remained fairly static (£348.6 million in 2014 to 2015).
For older adults with learning disabilities, in 2017 to 2018 £25.1 million (4.2% of all social expenditure on older adults with learning disabilities) was spent via direct payments, £45.8 million (7.7%) was spent on home care, and £46.8 million (7.9%) was spent on ‘other’ types of long-term community social care. For older adults with learning disabilities, all these types of social care spending stayed fairly static from 2014 to 2015 to 2017 to 2018.
Finally, relatively small amounts of social care expenditure concerns short-term social care. Spending on short-term social care to maximise independence in 2017 to 2018 was £19.6 million for adults with learning disabilities aged 18 to 64 (compared to £16.6 million in 2014 to 2015) and £2 million for adults with learning disabilities aged 65+ (compared to £1.2 million in 2014 to 2015). Spending on ‘other’ short-term social care in 2017 to 2018 was £55.7 million for adults with learning disabilities aged 18 to 64 (compared to £43.1 million in 2014 to 2015) and £3.9 million for adults with learning disabilities aged 65+ (compared to £5.1 million in 2014 to 2015).
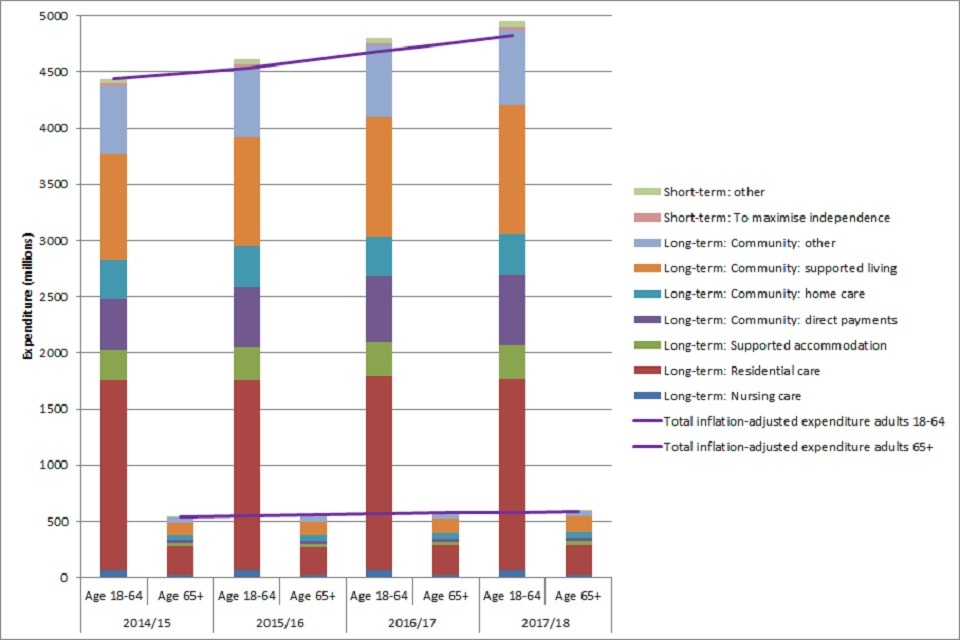
Local authority gross expenditure on social services for adults with learning disabilities in England aged 18-64 years and 65 or more years (in millions) 2014/15 to 2017/18, totalling £5.5 billion in 2017/18
For adults with learning disabilities aged 18 to 64, some of the categories of social care expenditure are consistent across the changes in data collection from 2014 to 2015 (although changes to how the populations of adults with learning disabilities are defined mean that the expenditure data cannot be treated as continuous from 2013 to 2014 to 2014 to 2015).
Figure 9 belows presents information on gross social care expenditure on selected categories of social care for working age adults with learning disabilities that are consistently recorded over time: residential care; nursing care; supported living and other supported accommodation; home care; direct payments; and other community long-term support. The gap between 2013 to 2014 and 2014 to 2015 is to demonstrate that the data cannot be treated as continuous across this time period. The data in Figure 9 are also not adjusted for inflation.
When interpreting Figure 9, it is crucial to note that gross expenditure costs for 2011 to 2012 include costs transferred from the NHS to social services under Valuing People Now (for people with learning disabilities). An estimated total of £872 million was transferred from the NHS to local authorities under Valuing People Now and NHS transfer schemes[footnote 6]. However, these transfer figures cannot be broken down into specific categories of expenditure. Therefore, the recorded increase in gross expenditure for all services for adults with learning disabilities aged 18 to 64 from 2010 to 2011 to 2011 to 2012 of £880 million is fully accounted for by transfers from the NHS to local authorities and does not represent real increases in state funding for services for adults with learning disabilities.
As Figure 9 shows, residential care is still the largest single category of social care expenditure for adults with learning disabilities aged 18 to 64 in 2017 to 2018, with spending fairly flat (except for the NHS transfer to local authorities in 2011 to 2012) from 2005 to 2006 to 2013 to 2014 and 2014 to 2015 to 2017 to 2018. Spending on supported and other accommodation is the second biggest category of expenditure, continuing to rise rapidly from 2005 to 2006 to 2013 to 2014 and 2014 to 2015 to 2017 to 2018. Expenditure on nursing homes for adults with learning disabilities aged 18 to 64 is at a consistent, low level throughout.
Social care expenditure via direct payments has risen steadily from a very low baseline in 2005 to 2006 to 2013 to 2014, and from 2014 to 2015 to 2017 to 2018. Expenditure on home care steadily increased from 2005 to 2006 to 2011 to 2012, but was fairly static from 2011 to 2012 to 2013 to 2014 and from 2014 to 2015 to 2017 to 2018. Finally expenditure on other long-term community support also appeared to gradually increase from 2005 to 2006 to 2011 to 2012 and decrease from 2011 to 2012 to 2013 to 2014, with a gradual increase again from 2014 to 2015 to 2017 to 2018.
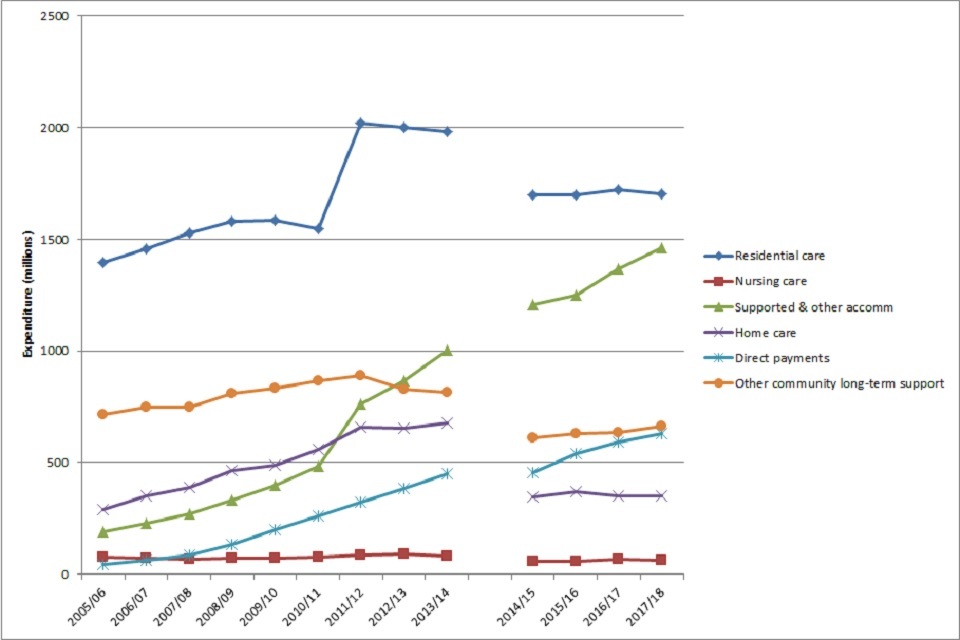
Figure 9: Local authority gross current expenditure on selected categories of social care for adults with learning disabilities aged 18 to 64 years (in millions): 2005 to 2006 to time period 2017 to 2018 (not adjusted for inflation)
For all types of substantial social care expenditure, there is variation across local authorities. Figure 10 reports the annual expenditure on long-term social care for adults with learning disabilities aged 18+, per head of the local population (the graph does not include data from the Isles of Scilly) in 2017 to 2018, ordered from lowest to highest (ASC-FR data[footnote 3]).
As Figure 10 shows, median annual expenditure on long-term social care for adults with learning disabilities aged 18+, per head of population, is £121.51 per head. The 10 local authorities with the lowest rates reported expenditure of £86.07 per head or less; the 10 local authorities with the highest rates reported expenditure of £156.32 per head or more.
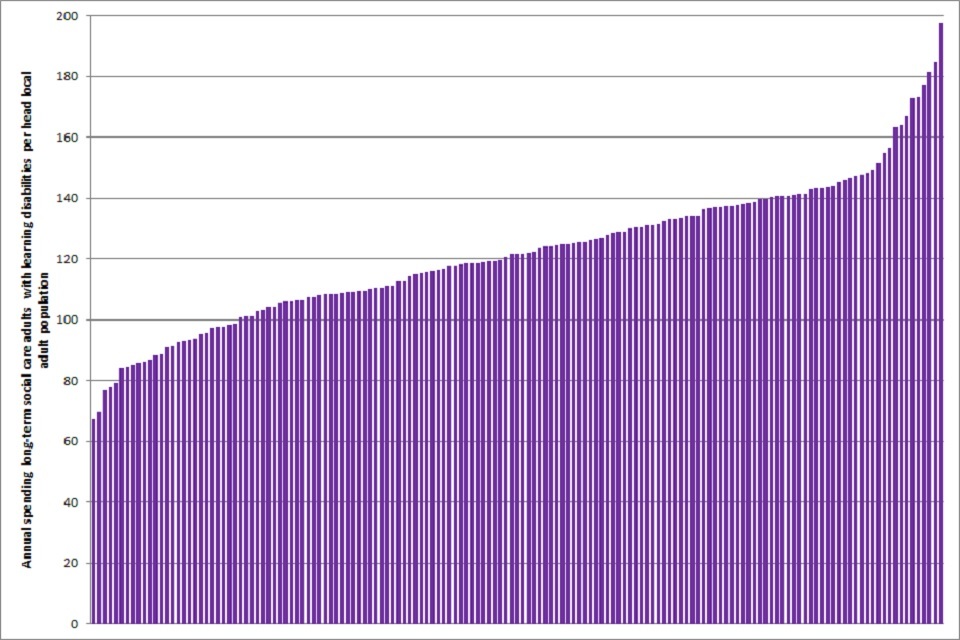
Figure 10: Annual expenditure on long-term social care for adults with learning disabilities aged 18+, per head of the local population, ordered by local authority: 2017 to 2018
Data are also available from 2007 to 2008 on the unit costs of a range of social care services for adults with learning disabilities aged 18 to 64, presented in Figure 11 below (see Table 7 in the accompanying data tables PDF document for a more detailed table; PSS-EX1 Unit Costs table; ASC-FR unit costs table[footnote 3]). Unit costs data up to 2017 to 2018 are available for residential and nursing care[footnote 3]; unit costs data for home care, day services and direct payments are only available up to 2013 to 2014. As it cannot be assumed that unit costs data are continuous from 2013 to 2014 to 2014 to 2015, Figure 11 presents a break at that point.
Regarding residential social services for adults with learning disabilities aged 18 to 64, Figure 11 shows that in 2017 to 2018, the weekly unit cost of nursing care was £1,246 per person aged 18 to 64 years per week, and the weekly unit cost of residential care was £1,476 per person aged 18 to 64 years per week. After a period of relative stability, unit costs appear to have recently begun rising.
From 2014 to 2015, data are also available on the unit costs of nursing and residential care for adults with learning disabilities aged 65 years or over (see Table 7 in the accompanying data tables PDF document). In 2017 to 2018 the unit costs of both nursing care (£947 per person per week) and residential care (£961 per person per week) for adults with learning disabilities aged 65 years or more are considerably lower than for younger adults with learning disabilities, and also appear to be increasing.
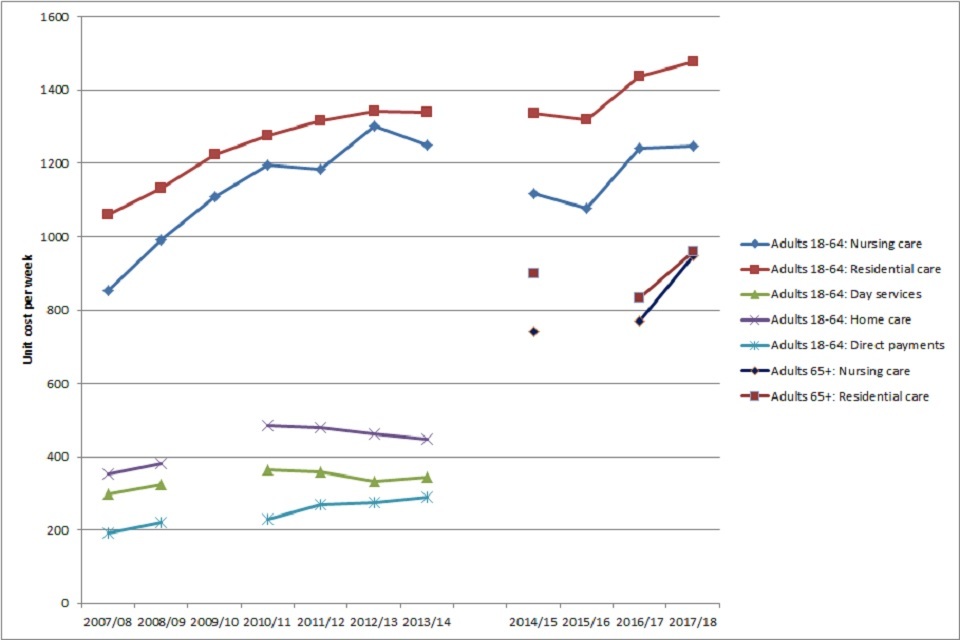
Figure 11: Local authority unit costs per week of social services for adults with learning disabilities (not inflation adjusted): 2007 to 2008 to time period 2017 to 2018
The experience of social care reported by adults with learning disabilities
Starting from 2011/2012, NHS Digital have conducted an annual national survey of adult users of personal social services. From 2014 to 2015, stratified random samples of adults currently using long-term social care (as defined by the database for SALT, see above) have been surveyed, typically from January to March each year[footnote 7] [footnote 8] [footnote 9] [footnote 10]. Standard and easy read versions of the survey questionnaire were available and distributed via local authorities.
Figure 12 below reports selected indicators from the survey from 2014 to 2015 to 2017 to 2018 for adults with learning disabilities (17,135 people responding to the survey in 2017 to 2018), adults with physical support needs (35,385 people) and adults with mental health support needs (5,460 people) (see Table 8 in the accompanying data tables PDF document for details, including details of sample size and methodological issues).
As Figure 12 shows, people with learning disabilities reported markedly more positive experiences of social care services and of their own health (with the exception of present state anxiety/depression) than other groups (this trend is also noticeable in other indicators not reported here). This was particularly noticeable in the proportion using the extreme positive end of possible response options. There is also considerable consistency in responses for all groups over time, from 2014 to 2015 to 2017 to 2018.
These differences may partially be accounted for by 2 methodological issues. First, almost all the adults with learning disabilities (98.0%) completed the easy read version of the survey, compared to very few adults with physical support needs (0.7%) or adults with mental health support needs (0.8%). Second, adults with learning disabilities were less likely than people with physical support needs or people with mental health support needs to have completed the survey by themselves (7% vs 26% and 36%), and more likely to have had help to complete the survey from a care worker (49% vs 15% and 33%).
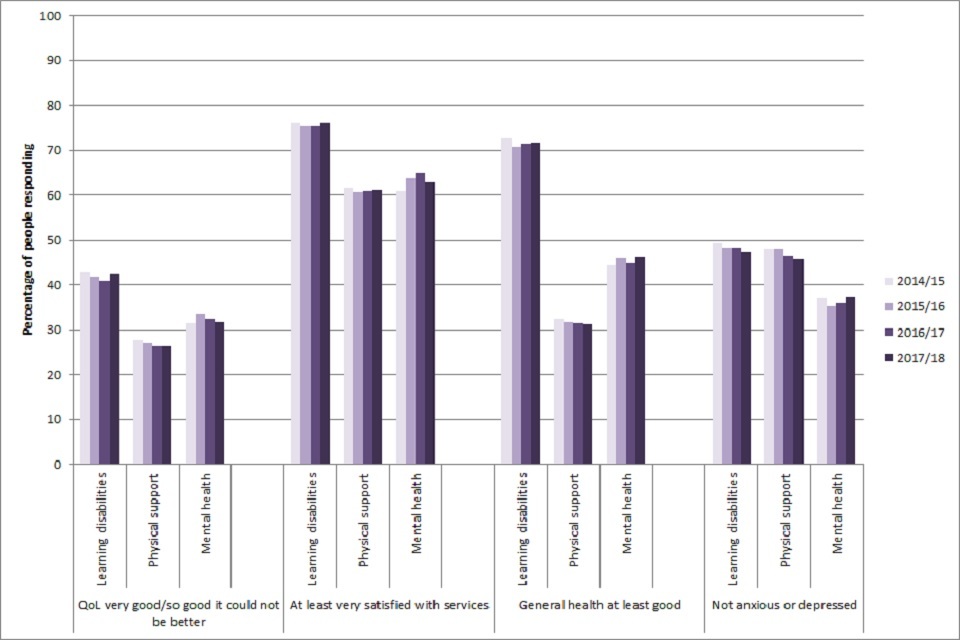
Figure 12: Adult experiences of social care: quality of life, satisfaction with services, self-rated general health, and self-rated anxiety/depression. 2014 to 2015 to time period 2017 to 2018
References
-
Public Health England (2016) People with learning disabilities in England 2015 ↩ ↩2 ↩3
-
NHS Digital (2014) Community Care Statistics: Social Services Activity, England 2013-14 ↩ ↩2
-
NHS Digital 2018) Adult Social Care Activity and Finance Report, England 2017 to 2018 ↩ ↩2 ↩3 ↩4 ↩5 ↩6 ↩7
-
NHS Digital (2014) Personal Social Services: Expenditure and Unit Costs, England - 2013-14, Final release ↩ ↩2
-
Curtis L and Burns A (2018) PSSRU Unit Costs of Health and Social Care 2018. Canterbury: University of Kent/Personal Social Services Research Unit. ↩
-
NHS Digital (2013) Personal Social Services: Expenditure and Unit Costs, England, 2011-12, Final release ↩
-
NHS Digital (2015) Personal Social Services Adult Social Care Survey, England - 2014-15 ↩
-
NHS Digital (2016) Personal Social Services Adult Social Care Survey, England - 2015-16 ↩
-
NHS Digital (2017) Personal Social Services Adult Social Care Survey, England - 2016-17 ↩
-
NHS Digital (2018) Personal Social Services Adult Social Care Survey, England - 2017-18 ↩