Metal theft, England and Wales, financial year ending March 2013
Published 28 November 2013
Applies to England and Wales

© Crown copyright 2013
This publication is licensed under the terms of the Open Government Licence v3.0 except where otherwise stated. To view this licence, visit nationalarchives.gov.uk/doc/open-government-licence/version/3 or write to the Information Policy Team, The National Archives, Kew, London TW9 4DU, or email: psi@nationalarchives.gov.uk.
Where we have identified any third party copyright information you will need to obtain permission from the copyright holders concerned.
This publication is available at https://www.gov.uk/government/statistics/metal-theft-england-and-wales-financial-year-ending-march-2013/metal-theft-england-and-wales-financial-year-ending-march-2013
This release covers the number of metal thefts recorded in England and Wales between April 2012 and March 2013, using metal theft figures provided by police forces.
These data are experimental and caution should be applied when interpreting the figures. User feedback is welcomed by the Home Office. More information on experimental statistics can be found in the Office for National Statistics Guide to Experimental Statistics.
This release is the first official release that covers force-level data on metal theft.
All tables are available at the link below:
Future editions of this release will be published on dates announced on the UK Statistics Authority Publication Hub: Release Calendar.
For further information about metal theft in England and Wales, please email: crimestats@homeoffice.gov.uk or write to:
Home Office Statistics
5th Floor
Peel Building
2 Marsham Street
London
SW1P 4DF
1. Overview
This release covers offences involving metal theft (from here on referred to as metal theft offences) recorded by police in England and Wales for the financial year ending March 2013. It should be noted that these are experimental data and this is the first time these figures are being published by the Home Office. Metal theft is not a crime defined by law, but is recorded by police under broader offence classifications, such as other theft offences and burglary. It refers to thefts of items for the value of their constituent metals, rather than the acquisition of the item. This release, where possible, differentiates between infrastructure-related metal theft and non-infrastructure-related metal theft.
The Home Office annual data requirement guidance gives police forces the following definitions for use when differentiating between infrastructure-related and non-infrastructure-related metal thefts:
- Infrastructure-related metal theft is ‘the removal of metal that has a direct impact on the functioning of infrastructure and/or fabric of a building or machinery. This includes all metals that are connected to live services such as: water, heating, electricity, other service cabling and railway cabling, roofing lead, a catalytic converter removed from a vehicle and manhole covers’.
- Non-infrastructure-related metal theft is ‘the removal of metal that has no direct impact on the functioning of infrastructure and/or fabric of a building or machinery. This includes metal that is not connected to services, redundant metal, war memorial plaques, and metal gates/fencing’.
2. Key findings
There were 61,349 metal theft offences recorded by police in England and Wales between April 2012 and March 2013, which corresponds to 2% of all police recorded crime in England and Wales for this period. This is based on 3,731,338 police recorded crimes, as published in the Office for National Statistics bulletin ‘Crime in England and Wales, year ending March 2013’.
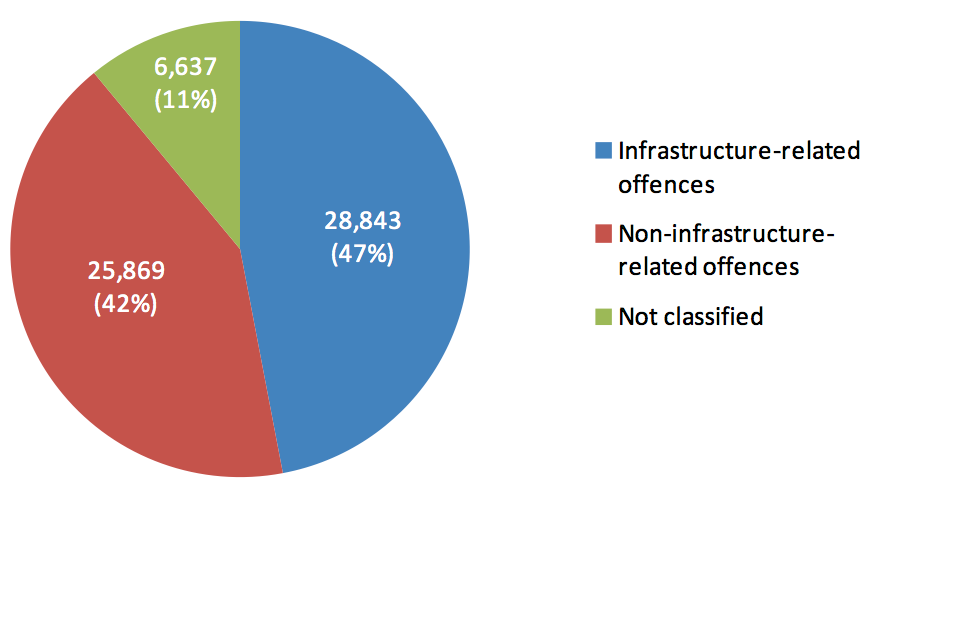
Of the 61,349 metal theft offences recorded by police in England and Wales:
- 28,843 (47%) were infrastructure-related offences
- 25,869 (42%) were non-infrastructure-related offences
- 6,637 (11%) were not classified
There were 11 metal theft offences per 10,000 members of the population in England and Wales between April 2012 and March 2013.
3. Data tables
Metal theft figures for the financial year ending March 2013, broken down by police force area can be found in the metal theft tables.
4. Metal thefts across England and Wales
An offence is flagged as metal theft if it is believed that the intent for committing an offence was to remove an item for its scrap metal value rather than acquisition of the item itself. Attempted metal theft offences are also flagged by police and are included in the metal theft figures presented here.
Note that metal theft offences are assigned to a broader overall offence category, such as theft or burglary, and are recorded in overall crime figures under these categories. Before April 2012, police forces were not required to flag when one of these offences involved metal theft. As a result, it is not possible to extract offences involving metal theft from crime data for previous years. For this report, police forces provided data on the number and types of metal theft offences they recorded between April 2012 and March 2013.
There were 61,349 metal theft offences recorded by police in England and Wales between April 2012 and March 2013. These were broken down into infrastructure-related offences, non-infrastructure-related offences, and offences that were not classified (as shown in chart 4.1). Some forces were unable to distinguish between infrastructure-related and non-infrastructure-related metal thefts, hence there were 6,637 offences that were not classified into one of these two sub-categories. Almost half (47%) of metal theft offences were classified as infrastructure-related offences, while 42% were classified as non-infrastructure-related offences.
4.1 Metal theft offences by type, England and Wales, financial year ending March 2013
.
Source
Home Office, Metal theft tables: MT.02.
5. Metal thefts by police force area
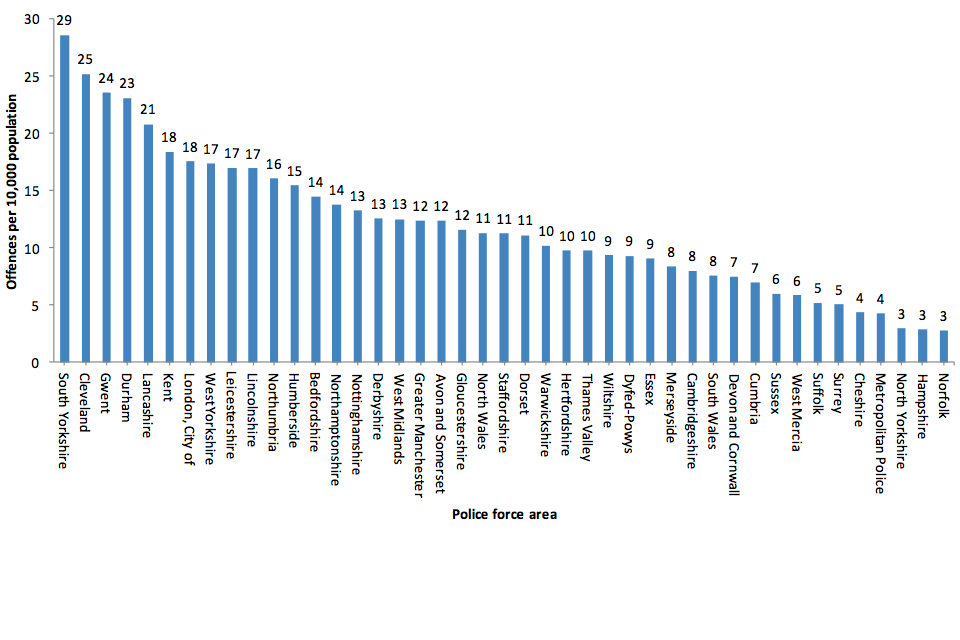
There were 11 metal theft offences per 10,000 members of the population in England and Wales between April 2012 and March 2013.
Chart 5.1 shows the variation in the number of metal theft offences per 10,000 population across different police forces in England and Wales. Population data for British Transport Police were not available; therefore this force was excluded from force population analysis. However, data for this force were included in totals for England and Wales. Hampshire, Norfolk and North Yorkshire had the lowest overall rate with 3 offences per 10,000 population, while South Yorkshire had the highest overall rate with 29 offences per 10,000 population.
5.1 Metal theft offences per 10,000 population by police force area, England and Wales, financial year ending March 2013
.
Source
Home Office, Metal theft tables: MT.03.
In some cases, a metal theft offence may be considered by a police force to be both infrastructure-related and non-infrastructure-related. If this is the case, police forces are asked to categorise the theft as infrastructure-related only. This may partly explain why more infrastructure-related offences than non-infrastructure-related were recorded across England and Wales.
There was, however, considerable variation in types of metal theft between police forces. The proportion of infrastructure-related metal thefts ranged from 16% of the 543 offences recorded by Hampshire to 67% of the 557 offences recorded by Warwickshire.
The number of both infrastructure-related and non-infrastructure-related offences per 10,000 population was highest in South Yorkshire with 15 and 14 offences respectively.
The number of infrastructure-related offences per 10,000 population was lowest in Hampshire, with fewer than 1 offence. The areas with the lowest number of non-infrastructure-related offences were North Yorkshire, West Midlands, Suffolk, Hampshire, and the Metropolitan Police, all with 2 offences per 10,000 population.
6. Metal thefts by type of offence
The Home Office Data Hub (HODH) is the primary data collection tool for police recorded crime. Some forces currently provide data to the HODH, and the Home Office is working towards getting more forces to provide data in this way. This will allow for more detailed analysis of crime data, while reducing the burden on forces. In addition to collecting data on the number of recorded crimes, police forces can also submit information identifying whether offences were linked to metal theft. This provides valuable information on the type of offences which involve metal thefts.
Not all forces are currently providing these data through the HODH. The following information is therefore based on a limited number of forces (23) who were considered to have provided reliable data for the financial year ending March 2013. These forces account for 42% of all metal thefts across England and Wales. As such, these figures are indicative, and caution should be used if attempting to use these data to establish trends across England and Wales.
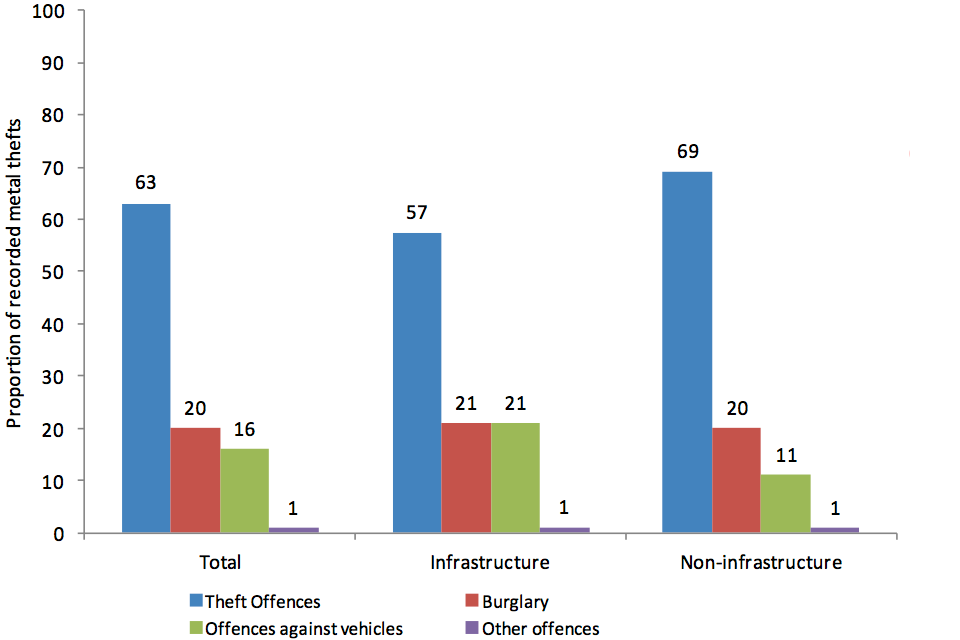
The available data showed that the majority of metal thefts (63%) were linked to other theft offences. The remaining metal thefts were linked to burglary offences (20%), offences against vehicles (16%) and other offences (1%), as shown in chart 6.1. The ‘other offences’ category includes drug offences, fraud and forgery, robbery, sexual offences and violence against the person.
6.1 Proportion of recorded metal thefts by offence type, for 23 police forces in England and Wales, financial year ending March 2013
.
Source
Home Office Data Hub
Of the infrastructure-related metal thefts:
- 57% were linked to other theft offences
- 21% were linked to burglary offences
- 21% were linked to offences against vehicles
- 1% were linked to other offences
Of the non-infrastructure-related metal thefts:
- 69% were linked to other theft offences
- 20% were linked to burglary offences
- 11% were linked to offences against vehicles
- 1% were linked to other offences
7. Data quality and interpreting the figures
These data are experimental as the data are not fully developed, therefore caution should be applied when interpreting the figures. Police forces were first required to flag metal thefts when recording offences from April 2012. As a result, the inclusion of metal theft information in police recorded crime is relatively new, and some of the data may not meet the rigorous quality standards usually upheld in official statistics. The Home Office welcomes user feedback for this publication in order to improve the way information on metal theft is presented in future. For more information, see the Office for National Statistics Guide to Experimental Statistics.
For this release, aggregate data were collected from 44 police forces across England and Wales, and cover notifiable offences (see the ‘User Guide to Crime Statistics for England and Wales’) that were recorded between 1 April 2012 and 31 March 2013. These data have been confirmed by police forces, and are correct as at 11 October 2013. As population data are not available for the British Transport Police, metal theft offences per 10,000 population were not available for this force. However, the number of offences recorded by this force was included in the overall figure for England and Wales.
Data for the number of metal theft offences by overall offence type may differ slightly from the rest of the data. This is because the HODH is a live system and these data were taken at a later date (25 October 2013) than the aggregate data, and may reflect changes made by forces after the aggregate data were supplied, for example no crimes. An offence may be ‘no crimed’ if it is determined by the police that no offence actually took place. This may be for a number of reasons (see the ‘User Guide to Crime Statistics for England and Wales’ for more details). Some forces are currently in a transition phase working towards providing data via the HODH. Consequently, data for a limited number of forces (23) were used for the metal theft by offence type analysis.
As mentioned earlier, if a metal theft was considered to be both infrastructure-related and non-infrastructure-related, police forces were instructed to flag the offence as infrastructure-related only. This could partly explain why there were more infrastructure-related offences.
8. Metal theft in the Commercial Victimisation Survey
With the rising cost of metal over recent years, metal thefts have become an area of increasing concern. Anecdotal evidence suggests this type of offence has risen in recent years. However, because metal theft is not a crime defined in law, there is limited information available on it, and it has previously not been separated out from other offences in police recorded crime statistics.
One response to this has been the inclusion of metal theft questions in the Commercial Victimisation Survey (CVS). The CVS was set up to address the gap in crime statistics that exists for crimes against businesses. The 2012 survey focussed on 4 industry sectors. These were manufacturing, wholesale and retail trade, transportation and storage, and accommodation and food services.
The survey found that:
- 14% of manufacturing premises experienced metal theft
- 9% of wholesale and retail premises experienced metal theft
- 9% of transport and storage premises experienced metal theft
- 8% of food and accommodation premises experienced metal theft
- around 1 in 6 commercial victims of burglary and theft believed the latest incident to involve some form of metal theft
9. Other information
The coalition government’s commitment to tackling metal theft is outlined in the Home Office article ‘Scrap metal laws to stop metal theft come into force’. The introduction of the Scrap Metal Dealers Act 2013 aims to build on previous measures to tackle metal theft including targeted police enforcement activity and banning cash payments for scrap metal. It introduces a robust licensing scheme aimed at ensuring more effective compliance activity by local authorities and stronger enforcement by police, in order to ensure there is a level playing field for law-abiding scrap metal dealers. From 1 October 2013, all scrap metal dealers need a licence to trade; must verify the name and address of the supplier of scrap metal, and keep records of scrap metal received and disposed of. These measures, along with the ban on cash payments, which came into force on 3 December 2012, are designed to improve the traceability of stolen metal and help improve trading standards within the scrap metal industry.
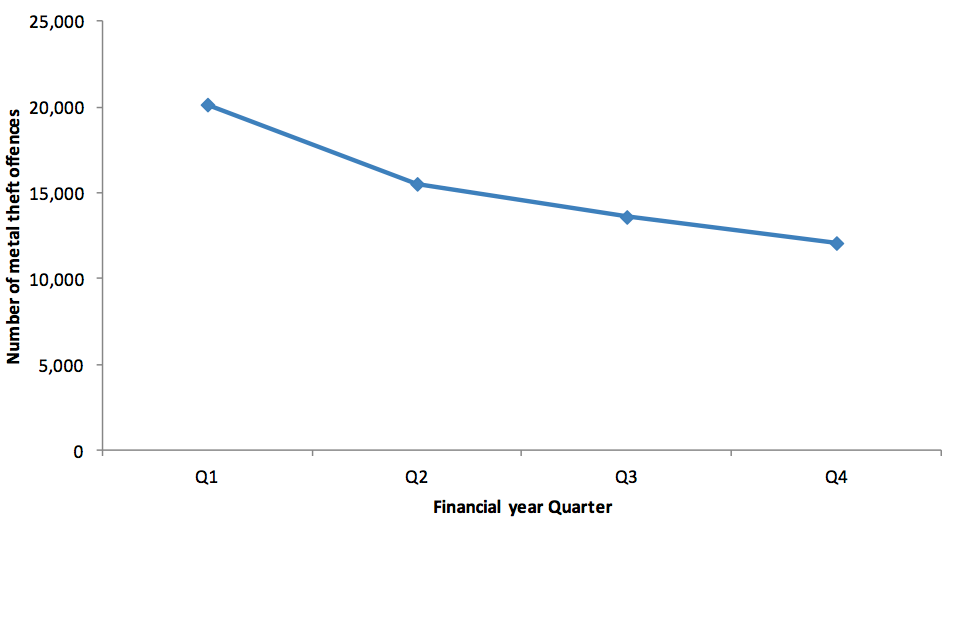
During the financial year ending March 2013, metal theft offences in England and Wales have fallen by 40% (see chart 9.1) from 20,151 in the first quarter (April to June 2012) to 12,076 in the last quarter (January to March 2013). Police forces in England and Wales have listed the following reasons for the apparent reduction in metal theft offences recorded in their area:
- introduction of local initiatives to reduce metal theft
- a general fall in the price of scrap metal over the reporting period
- pending legislation change and the added exposure of media coverage
This is the first official publication that provides force-level Home Office data on metal theft. As a result, there are no previous annual figures to which these data can be compared. Caution must be applied when interpreting the fall in metal theft across this period, as the changes could be affected by seasonal variation. The reasons for these changes could become clearer when more data are available.
9.1 Number of metal theft offences by financial year quarter, financial year ending March 2013
.
Source
Home Office, Metal theft tables: MT.04.
‘Tackling Metal Theft – prohibit cash payments and higher fines’, was published in 2012. This article gives an insight into the issues leading to a rise in concern about metal theft and outlines strategies to reduce metal theft. It was prepared for the amendments made to the Legal Aid, Sentencing and Punishment Act 2012 to ban cash carries and increase fines. Exact metal theft figures are not provided in the report, but estimates for the financial year 2011 to 2012 are provided as well as estimates for the cost that metal theft has for the UK.