Inspection profiles of the largest private and voluntary providers of children's homes March 2019
Updated 9 October 2024
Applies to England

© Crown copyright 2024
This publication is licensed under the terms of the Open Government Licence v3.0 except where otherwise stated. To view this licence, visit nationalarchives.gov.uk/doc/open-government-licence/version/3 or write to the Information Policy Team, The National Archives, Kew, London TW9 4DU, or email: psi@nationalarchives.gov.uk.
Where we have identified any third party copyright information you will need to obtain permission from the copyright holders concerned.
This publication is available at https://www.gov.uk/government/publications/inspection-outcomes-of-the-largest-childrens-social-care-providers/inspection-profiles-of-the-largest-private-and-voluntary-providers-of-childrens-homes-march-2019
As at 31 March 2019, these providers owned 561 children’s homes collectively. This was 18 more than as at 31 August 2018. Despite this, the proportion of homes run by the 10 largest providers has dropped slightly, to just under 30% of all private and voluntary children’s homes.
This release covers inspection profiles only. It does not feature any other characteristics of these homes, or the wider factors that local authorities take into account when placing a child in a children’s home.
Inspection profiles of the largest organisations
In February 2019, CareTech Holdings Plc (CareTech) completed its acquisition of Cambian Group Plc. CareTech now owns nearly 100 more children’s homes than the next largest provider, Keys Group Limited.
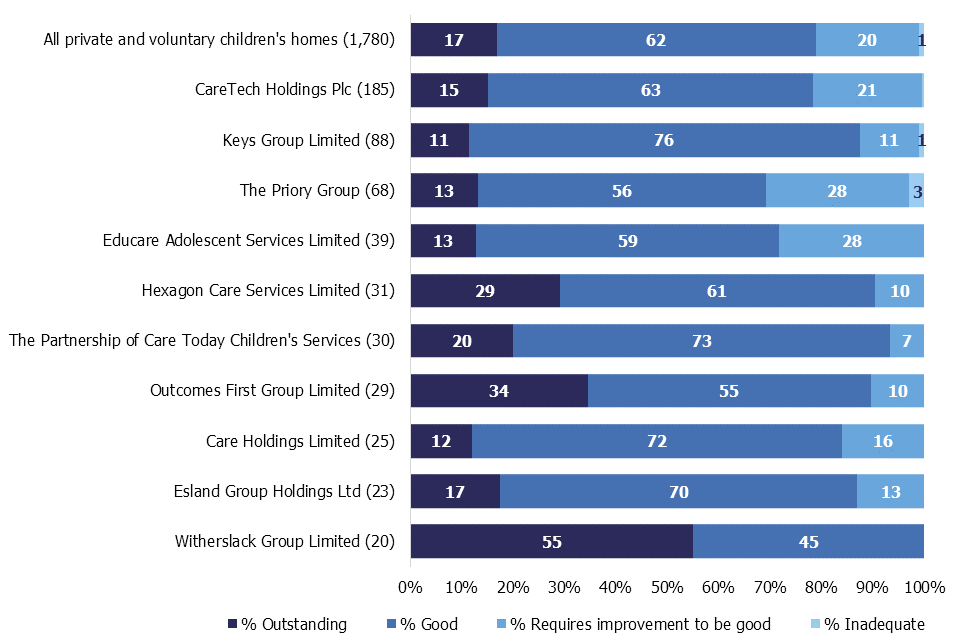
Figures 1a and 1b show the inspection profiles of the largest private and voluntary organisations that own children’s homes as at 31 March 2019.
Figure 1a
Bar chart showing 8 of the top 10 largest providers of children’s homes had a higher proportion of good and outstanding children’s homes than the average nationally.
Bar chart showing 8 of the top 10 largest providers of children’s homes had a higher proportion of good and outstanding children’s homes than the average nationally.
Figure 1b
Data table showing 8 of the top 10 largest providers of children’s homes had a higher proportion of good and outstanding children’s homes than the average nationally.
| Large provider name (total number of homes) | Outstanding (%) | Good (%) | Requires improvement to be good (%) | Inadequate (%) |
|---|---|---|---|---|
| All private and voluntary children’s homes (1,780) | 17 | 62 | 20 | 1 |
| CareTech Holdings Plc (185) | 15 | 63 | 21 | 1 |
| Keys Group Limited (88) | 11 | 76 | 11 | 1 |
| The Priory Group (68) | 13 | 56 | 28 | 3 |
| Educare Adolescent Services Limited (39) | 13 | 59 | 28 | 0 |
| Hexagon Care Services Limited (31) | 29 | 61 | 10 | 0 |
| The Partnership of Care Today Children’s Services (30) | 20 | 73 | 7 | 0 |
| Outcomes First Group Limited (29) | 34 | 55 | 10 | 0 |
| Esland Group Holdings Ltd (23) | 17 | 70 | 13 | 0 |
| Witherslack Group Limited (20) | 55 | 45 | 0 | 0 |
| Care Holdings Limited (25) | 12 | 72 | 16 | 0 |
This is a snapshot of full inspections as at 31 March 2019. Some children’s homes may have improved or declined since this date.
Data is based on private and voluntary children’s homes that had been inspected as at 31 March 2019 with their reports published as at 30 April 2019.
Figures in bracket indicate the number of homes for each company. Some homes owned by these organisations are new and have yet to have their first inspection.
Percentages may not sum to 100 due to rounding.
National view of private and voluntary organisations
The previous section presented the inspection profiles of the 10 largest organisations.
The average inspection profile of the 10 largest providers and of all voluntary and private children’s homes as at 31 March 2019 are shown in Figures 2a and 2b.
Nationally, the proportion of good and outstanding children’s homes has dropped two percentage points from 81% as at 31 August 2018 to 79% as at 31 March 2019. The proportion of good and outstanding children’s homes among the 10 largest provider chains has also fallen from 83% to 82%, remaining above the national figure.
Figure 2a
Bar chart showing, as at 31 March 2019, the proportion of children’s homes judged to be good or outstanding was 4 percentage points higher among the top 10 largest provider chains than among other private and voluntary owned children’s homes.

Bar chart showing, as at 31 March 2019, the proportion of children’s homes judged to be good or outstanding was 4 percentage points higher among the top 10 largest provider chains than among other private and voluntary owned children’s homes.
Figure 2b
Data table showing, as at 31 March 2019, the proportion of children’s homes judged to be good or outstanding was 4 percentage points higher among the top 10 largest provider chains than among other private and voluntary owned children’s homes.
| Provider type (total number of homes) | Outstanding (%) | Good (%) | Requires improvement to be good (%) | Inadequate (%) |
|---|---|---|---|---|
| All private and voluntary children’s homes (1,780) | 17 | 62 | 20 | 1 |
| Homes owned by largest organisations (532) | 18 | 64 | 17 | 1 |
| Homes not owned by largest organisations (1,248) | 17 | 61 | 21 | 1 |
This is a snapshot of inspections as at 31 March 2019. Some children’s homes may have improved or declined since this date.
Data is based on private and voluntary children’s homes that had been inspected as at 31 March 2019 and published as at 30 April 2019.
Percentages may not sum to 100 due to rounding.