Citizenship
Updated 3 March 2016

© Crown copyright 2016
This publication is licensed under the terms of the Open Government Licence v3.0 except where otherwise stated. To view this licence, visit nationalarchives.gov.uk/doc/open-government-licence/version/3 or write to the Information Policy Team, The National Archives, Kew, London TW9 4DU, or email: psi@nationalarchives.gov.uk.
Where we have identified any third party copyright information you will need to obtain permission from the copyright holders concerned.
This publication is available at https://www.gov.uk/government/statistics/immigration-statistics-october-to-december-2015/citizenship
Valid: 25 February 2016 to 25 May 2016
Data relate to the calendar year 2015 and all comparisons are with the calendar year 2014, unless indicated otherwise.
Back to ‘Immigration statistics October to December 2015’ content page.
This is not the latest release. View latest release.
1.Key facts
Applications for British citizenship increased by 18% in the calendar year 2015 to 149,549 but were 36% (-82,713) lower than the peak of 232,262 in 2013.
There were 129,506 decisions about British citizenship, 2% fewer than in the previous year (131,827). This included 6% fewer people granted British citizenship (-7,501 to 118,152) while refusals and withdrawals increased (+5,180 to 11,354).
The number of grants fell in the second and third quarters of 2014 as UK Visas and Immigration (UKVI) resources were used to assist HM Passport Office and increased in the fourth quarter of 2014 and first quarter of 2015 as this work was completed and resources returned to UKVI. Grant rates fell from 95% in 2014 to 91% in 2015 following the introduction of enhanced checks on cases requiring higher levels of assurance in April 2015, e.g. those cases with previous asylum refusals and cases with adverse immigration histories.
The 7,501 fall in grants of British citizenship was reflected in lower numbers of people granted citizenship in all broad categories.
These year-on-year comparisons of decisions numbers can be affected by changes in case work resource allocation. Such fluctuations can be examined in more detail in the quarterly data that are also available in the published tables.
2.Grants and refusals of citizenship
| Year | Total decisions | Total grants | On basis of residence | On basis of marriage | As children | Other grounds | Refusals and withdrawals |
| 2011 | 184,669 | 177,785 | 94,660 | 35,616 | 41,993 | 5,516 | 6,884 |
| 2012 | 201,087 | 194,209 | 107,102 | 39,122 | 42,964 | 5,021 | 6,878 |
| 2013 | 215,258 | 207,989 | 113,339 | 46,301 | 44,275 | 4,074 | 7,269 |
| 2014 | 131,827 | 125,653 | 62,511 | 26,185 | 32,298 | 4,659 | 6,174 |
| 2015 | 129,506 | 118,152 | 60,812 | 24,451 | 28,748 | 4,141 | 11,354 |
| Change: latest year | -2,321 | -7,501 | -1,699 | -1,734 | -3,550 | -518 | 5,180 |
| Percentage change | -2% | -6% | -3% | -7% | -11% | -11% | +84% |
Table notes
Source: Home Office, Immigration Statistics October to December 2015, Citizenship tables cz 01 q and cz 02 q.
‘Other grounds’ includes Entitlement and Discretionary registration as an adult, Entitlement and Discretionary registration on other grounds and registration under section 5 of the British Nationality Act 1981. See Table cz 07 and the user guide for more detail.
3.Long-term trends in grants of citizenship
The chart below illustrates longer-term trends in grants of citizenship by calendar year.
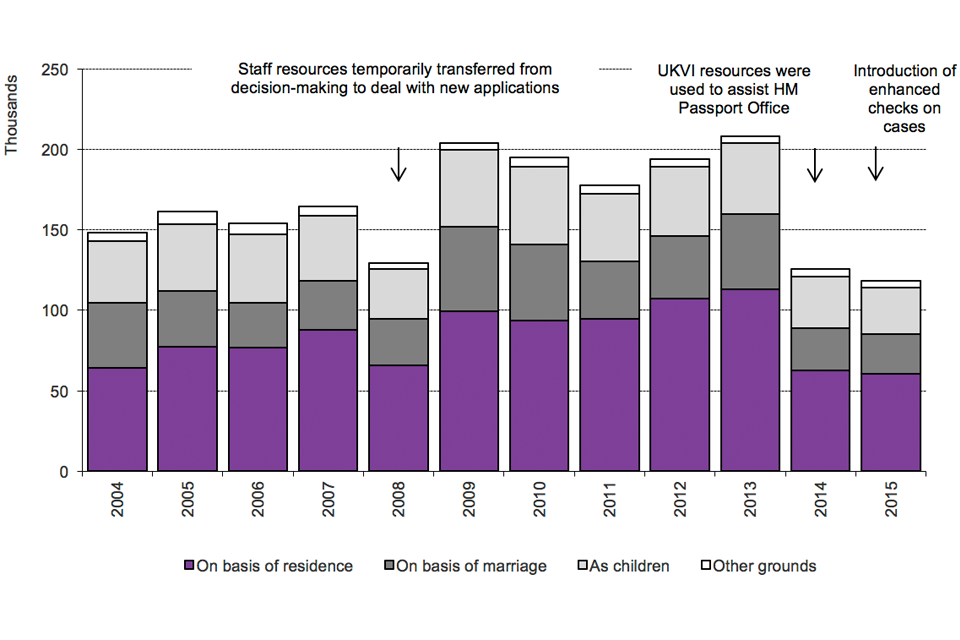
The
Chart notes
Source: Home Office, Immigration Statistics October to December 2015, Citizenship table cz 03.
The number of grants in 2015 (118,152) was the lowest since 2002 (120,121).
Between 2009 and 2013 there was a general increase in applications for and grants of citizenship, which is likely in part to reflect increased grants of permission to stay permanently (known as settlement) up to 2010. After a period of residence those granted settlement become eligible to apply for citizenship. There were 207,989 grants of citizenship in 2013, more than double the level seen in 2001 (90,282) and the highest comparable annual total since records began in 1962.
There were notable increases in British citizenship applications made in 2005 (211,911) and 2013 (232,262). The increase in 2005 may have reflected people anticipating the introduction of the Knowledge of Life in the UK test on 1 November that year. Similarly, the increase in 2013 may, in part, have been due to people anticipating the rule change to the English language element of the Life in the UK test as of 28 October 2013. See the Policy and Legislative Changes Timeline. Applications in 2014 fell to 127,259, a level not seen since 2004 (125,668). This may partly be due to the rule change to the English language element of the Life in the UK test as of 28 October 2013 and fewer grants of settlement since 2010.
4.Top 5 previous nationalities granted citizenship, 2014
(Total number of grants 125,653)
Data for grants by nationality in 2015 are planned to be published in Immigration Statistics January to March 2016, due to be released on 26 May 2016.
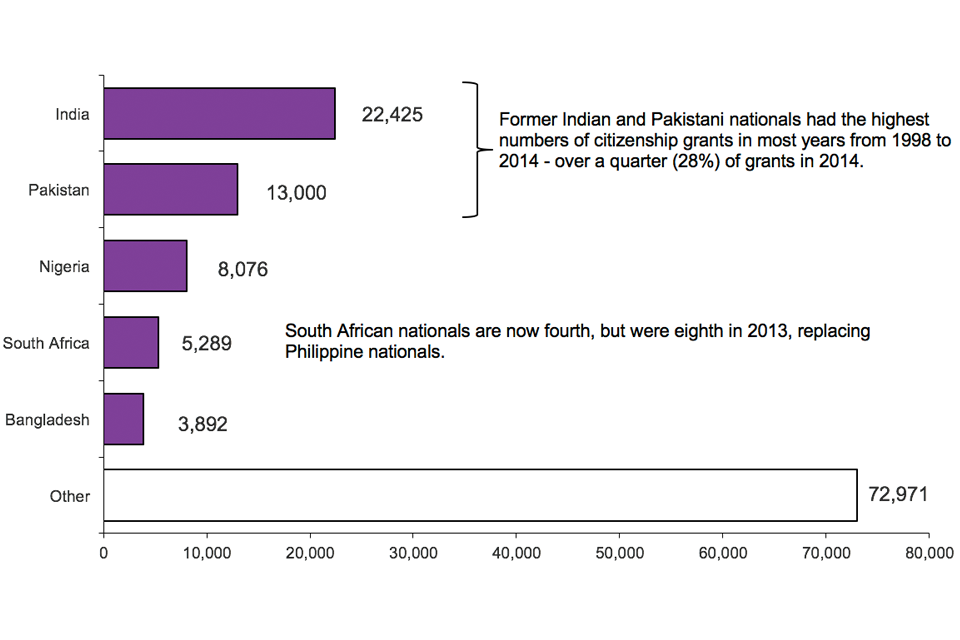
The
Chart notes
Source: Home Office, Immigration Statistics October to December 2015, Citizenship table cz 06.
5.Data tables
Further data on British citizenship are available in Citizenship tables cz 01 to cz 10.
In addition to applications and detailed breakdowns of decisions, these include information on refusals, citizenship ceremonies attended and renunciations of citizenship.
6.Background information
The figures in this section relate to the number of people who are granted or refused British citizenship.
The numbers of decisions made are not always fully comparable over time. This is because, as well as reflecting changes in the levels of those settling in the UK, the figures are influenced by policy and legislative changes, for example, when changes are made to English language requirements or the Life in the UK test. In addition, the level of decisions made may be affected by the resources available in the Home Office.
6.1Migration Transparency Data webpage
A range of key input and impact indicators are currently published by the Home Office on the Migration Transparency Data webpage.